SEES 503 Sustainable Water Resources 1/49 Instructor Assist. Prof. Dr. Bertuğ Akıntuğ Civil Engineering Program Middle East Technical University Northern Cyprus Campus SEES 503 SEES 503 SUSTAINABLE WATER RESOURCES SUSTAINABLE WATER RESOURCES PRECIPITATION PRECIPITATION
Transcript
SEES 503 Sustainable Water Resources 1/49
Instructor
Assist. Prof. Dr. Bertuğ Akıntuğ
Civil Engineering ProgramMiddle East Technical University
Northern Cyprus Campus
SEES 503SEES 503SUSTAINABLE WATER RESOURCESSUSTAINABLE WATER RESOURCES
PRECIPITATIONPRECIPITATION
SEES 503 Sustainable Water Resources 2/49
2. PRECIPITATION 2. PRECIPITATION
Overview
IntroductionMeasurement of Precipitation
Non-recording Rain GaugesRecording Rain Gauges
Analysis of PrecipitationConverting the Recorded Diagram to the HyetographAreal Mean PrecipitationResultant Hyetograph
Snow Snow flakes and Snow grainsHail Roughly spherical lumps of ice, 5-50 mm or more in diameter.Drizzle Droplets < 0.5 mm in diameterSleet (Ice Pellets) Partly melted snow or a mixture of rain and snow
SEES 503 Sustainable Water Resources 4/49
2. PRECIPITATION 2. PRECIPITATION
Overview
IntroductionMeasurement of Precipitation
Non-recording Rain GaugesRecording Rain Gauges
Analysis of PrecipitationConverting the Recorded Diagram to the HyetographAreal Mean PrecipitationResultant Hyetograph
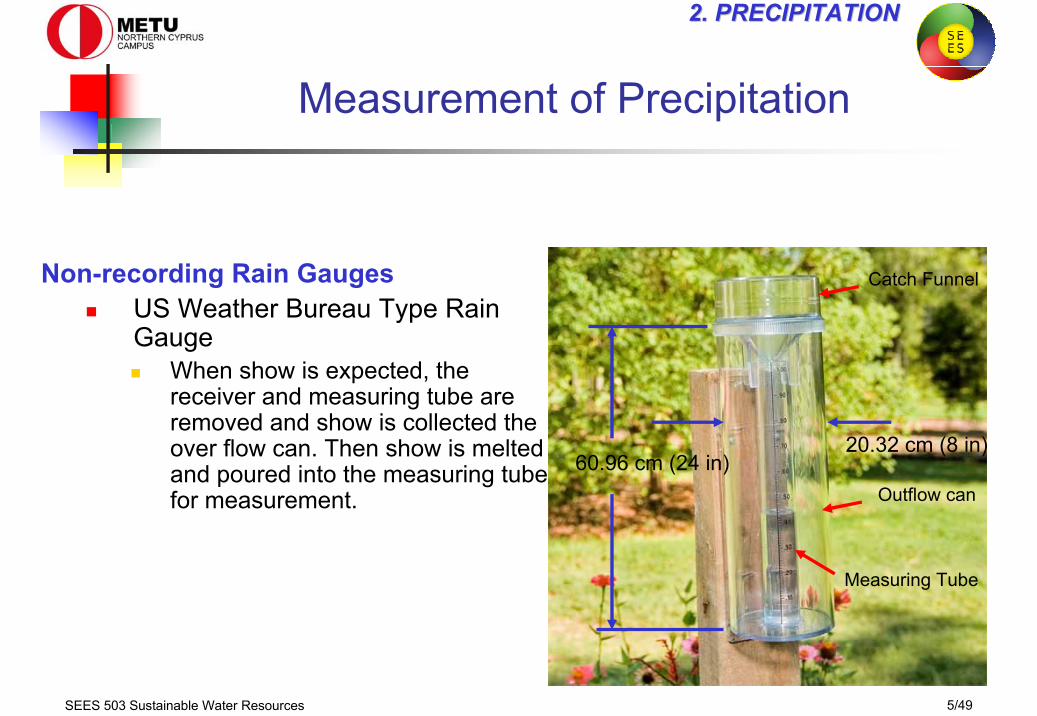
Non-recording Rain GaugesUS Weather Bureau Type Rain Gauge
When show is expected, the receiver and measuring tube are removed and show is collected the over flow can. Then show is melted and poured into the measuring tube for measurement.
20.32 cm (8 in)60.96 cm (24 in)
Catch Funnel
Measuring Tube
Outflow can
SEES 503 Sustainable Water Resources 6/49
2. PRECIPITATION 2. PRECIPITATION
Measurement of Precipitation
Non-recording Rain GaugesHellmann type:
Diameter = 16 cmCross-sectional area = 200 cm2
Height = 44 cmA copper or brass receiver is fitted over the topBelow the rim there is a collecting vessel with a capacity of 70 mm (1.4 lt)A glass measuring tube is used to measure the height of the precipitation
SEES 503 Sustainable Water Resources 7/49
2. PRECIPITATION 2. PRECIPITATION
Measurement of Precipitation
Recording Rain GaugesBeside the total amount, it is often necessary to know the intensity of precipitation.The most commonly used recording rain gauges:
Recording Rain GaugesWeighing Gauge The slope of this graph at any
time with respect to the horizontalaxis gives intensity of the rainfallat that time.
SEES 503 Sustainable Water Resources 9/49
2. PRECIPITATION 2. PRECIPITATION
Measurement of Precipitation
Recording Rain GaugesWeighing Gauge
Usually a daily chart is used for the diagrams, but for locations where access is not easy, weekly charts can also be used.
SEES 503 Sustainable Water Resources 10/49
2. PRECIPITATION 2. PRECIPITATION
Measurement of Precipitation
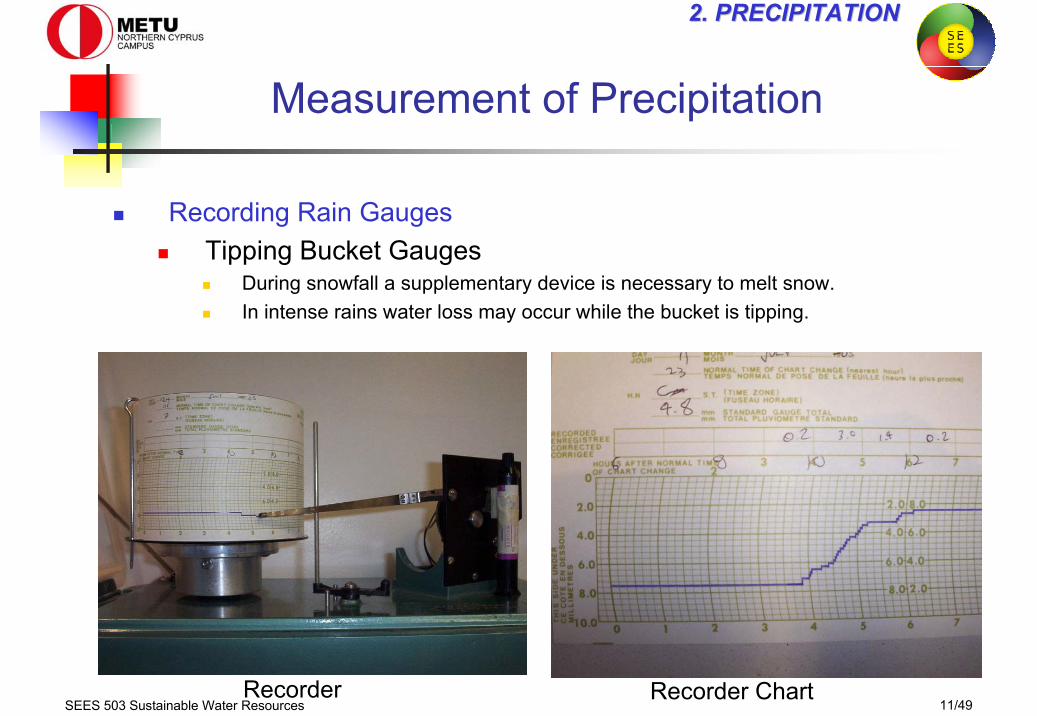
Recording Rain GaugesTipping Bucket Gauges
It has simple, durable, and reliable mechanism.
SEES 503 Sustainable Water Resources 11/49
2. PRECIPITATION 2. PRECIPITATION
Measurement of Precipitation
Recording Rain GaugesTipping Bucket Gauges
During snowfall a supplementary device is necessary to melt snow.In intense rains water loss may occur while the bucket is tipping.
Recorder Recorder Chart
SEES 503 Sustainable Water Resources 12/49
2. PRECIPITATION 2. PRECIPITATION
Measurement of Precipitation
Recording Rain GaugesFloat-type Gauge
The most important drawback of this type of gauges lies in their operation at temperatures below the freezing point.
SEES 503 Sustainable Water Resources 13/49
2. PRECIPITATION 2. PRECIPITATION
Measurement of Precipitation
Recording Rain GaugesWireless Rain Gauge with Temperature Display
Features: • Self-emptying cable free rain collector • Indoor thermometer • Long range capability allows the canister to be placed up to 300 feet from the main unit • Calendar alarm clock • Provides cumulative & daily precipitation totals for up to nine days • Total rainfall display with registered date • Rainfall alarm • Rainfall display in inches or millimeters • ºF/ºC switch • Min/max temperature • 12 or 24 hour clock format • 4-line LCD display • Wall or table mount features
http://www.generaltools.com
SEES 503 Sustainable Water Resources 14/49
2. PRECIPITATION 2. PRECIPITATION
Measurement of Precipitation
Storage or Totalizer GaugesUsed in mountainous regions or remote areas, which are not accessible during winter or where observers are not available.Large tanks collecting precipitation during a whole season.It is measured at the end of the season.Usually equipped with windshieldsAntifreeze is added to melt the snow.The solution is covered by some low-viscosity oil, which prevents evaporation but allows the passage of precipitation.
SEES 503 Sustainable Water Resources 15/49
2. PRECIPITATION 2. PRECIPITATION
Measurement of Precipitation
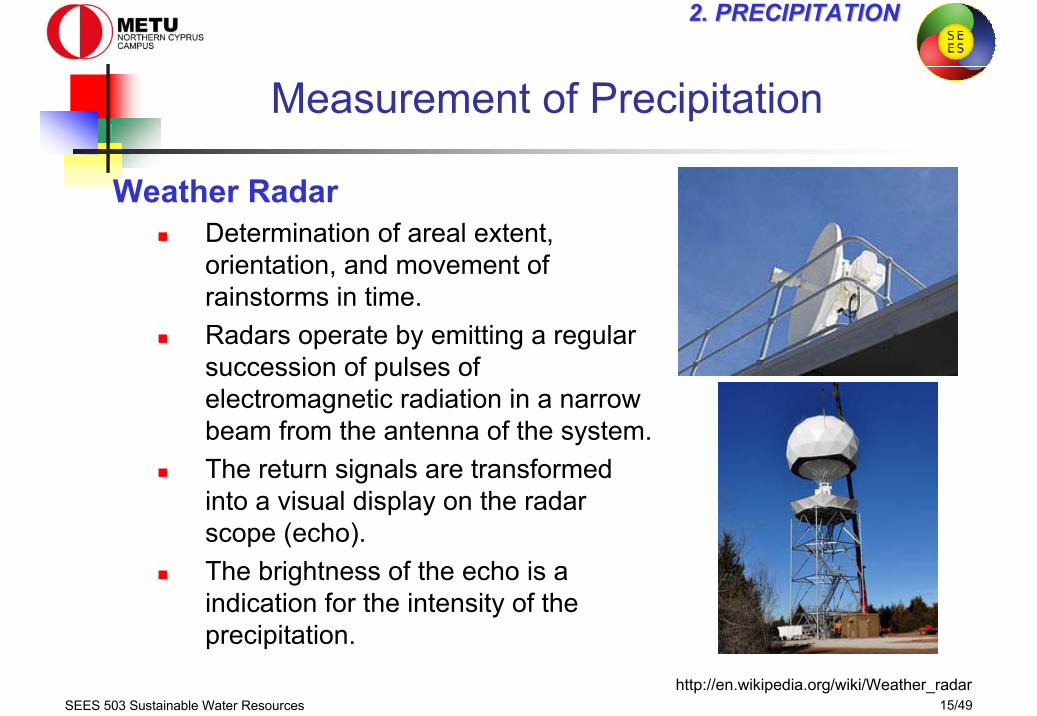
Weather RadarDetermination of areal extent, orientation, and movement of rainstorms in time.Radars operate by emitting a regular succession of pulses of electromagnetic radiation in a narrow beam from the antenna of the system. The return signals are transformed into a visual display on the radar scope (echo).The brightness of the echo is a indication for the intensity of the precipitation.
http://en.wikipedia.org/wiki/Weather_radar
SEES 503 Sustainable Water Resources 16/49
2. PRECIPITATION 2. PRECIPITATION
Overview
IntroductionMeasurement of Precipitation
Non-recording Rain GaugesRecording Rain Gauges
Analysis of PrecipitationConverting the Recorded Diagram to the HyetographAreal Mean PrecipitationResultant Hyetograph
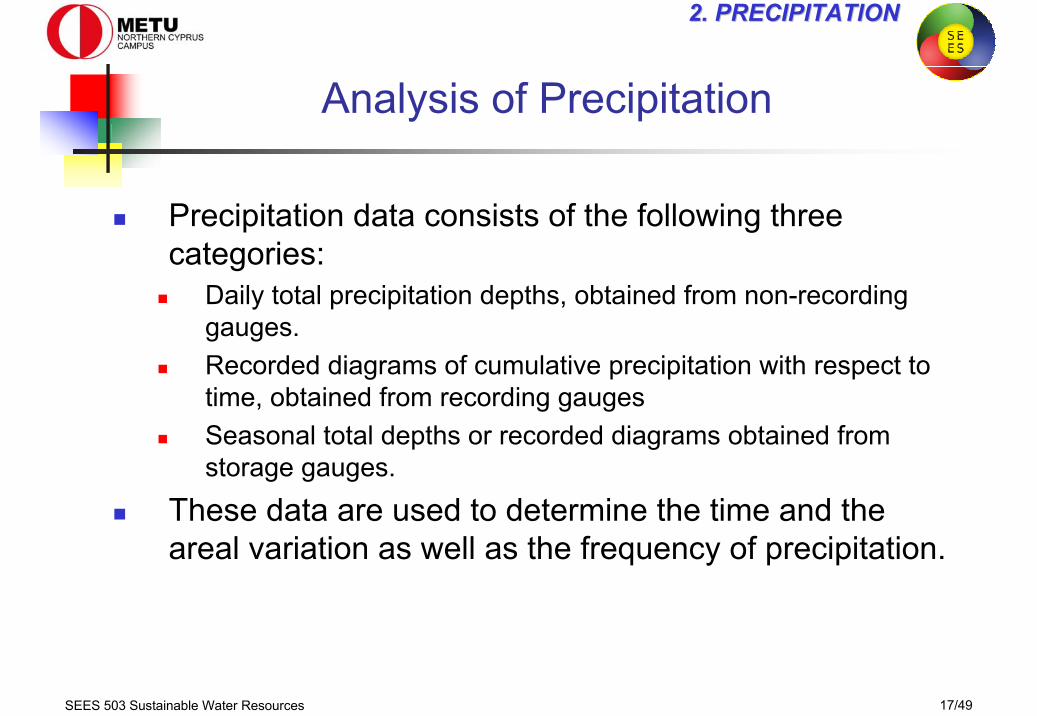
Precipitation data consists of the following three categories:
Daily total precipitation depths, obtained from non-recording gauges.Recorded diagrams of cumulative precipitation with respect to time, obtained from recording gaugesSeasonal total depths or recorded diagrams obtained from storage gauges.
These data are used to determine the time and the areal variation as well as the frequency of precipitation.
SEES 503 Sustainable Water Resources 18/49
2. PRECIPITATION 2. PRECIPITATION
Analysis of Precipitation
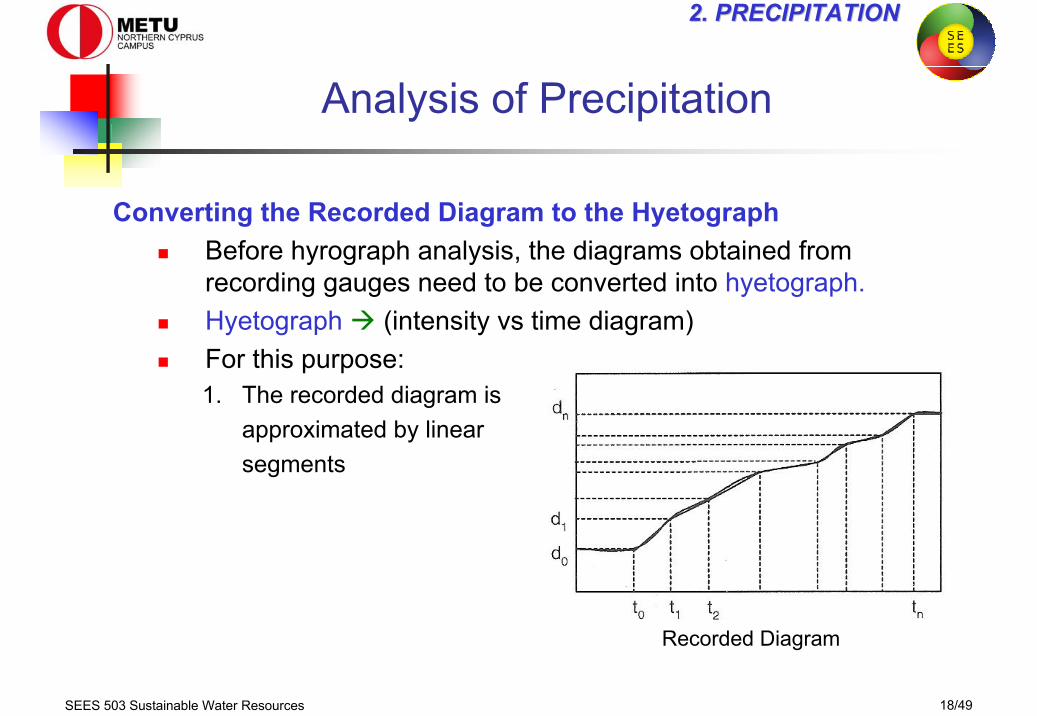
Converting the Recorded Diagram to the HyetographBefore hyrograph analysis, the diagrams obtained from recording gauges need to be converted into hyetograph.Hyetograph (intensity vs time diagram)For this purpose:1. The recorded diagram is
approximated by linearsegments
Recorded Diagram
SEES 503 Sustainable Water Resources 19/49
2. PRECIPITATION 2. PRECIPITATION
Analysis of Precipitation
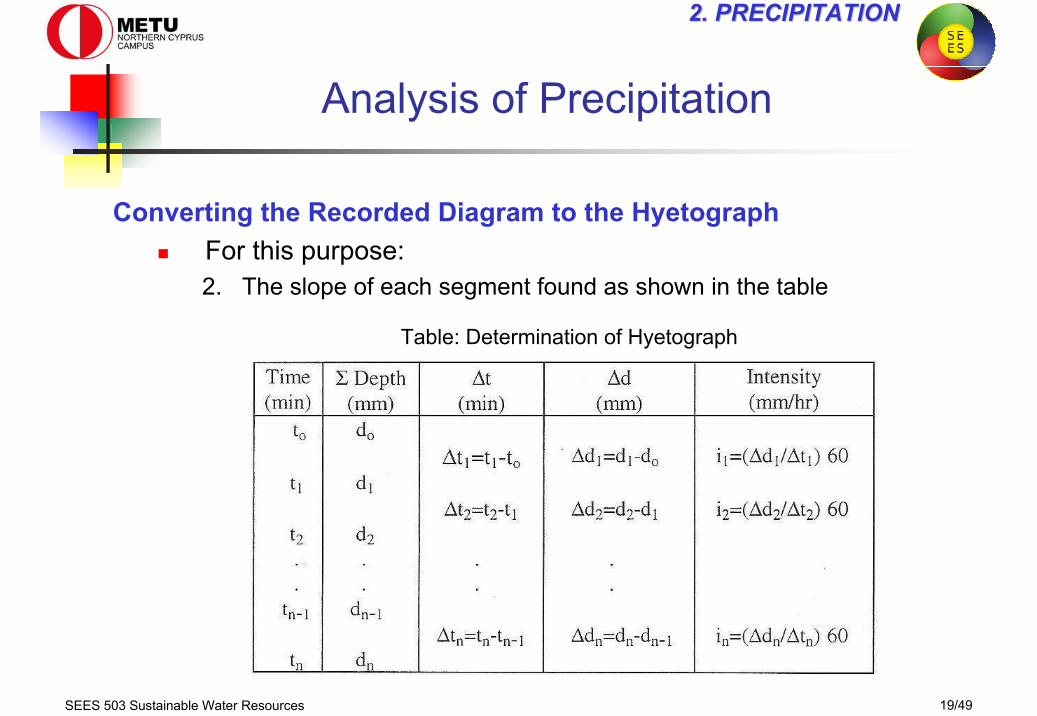
Converting the Recorded Diagram to the HyetographFor this purpose:2. The slope of each segment found as shown in the table
Table: Determination of Hyetograph
SEES 503 Sustainable Water Resources 20/49
2. PRECIPITATION 2. PRECIPITATION
Analysis of Precipitation
Converting the Recorded Diagram to the HyetographFor this purpose:3. Then intensities are plotted with respect to time as shown in the
figure
Hyetograph
SEES 503 Sustainable Water Resources 21/49
2. PRECIPITATION 2. PRECIPITATION
Analysis of Precipitation
Converting the Recorded Diagram to the HyetographExample
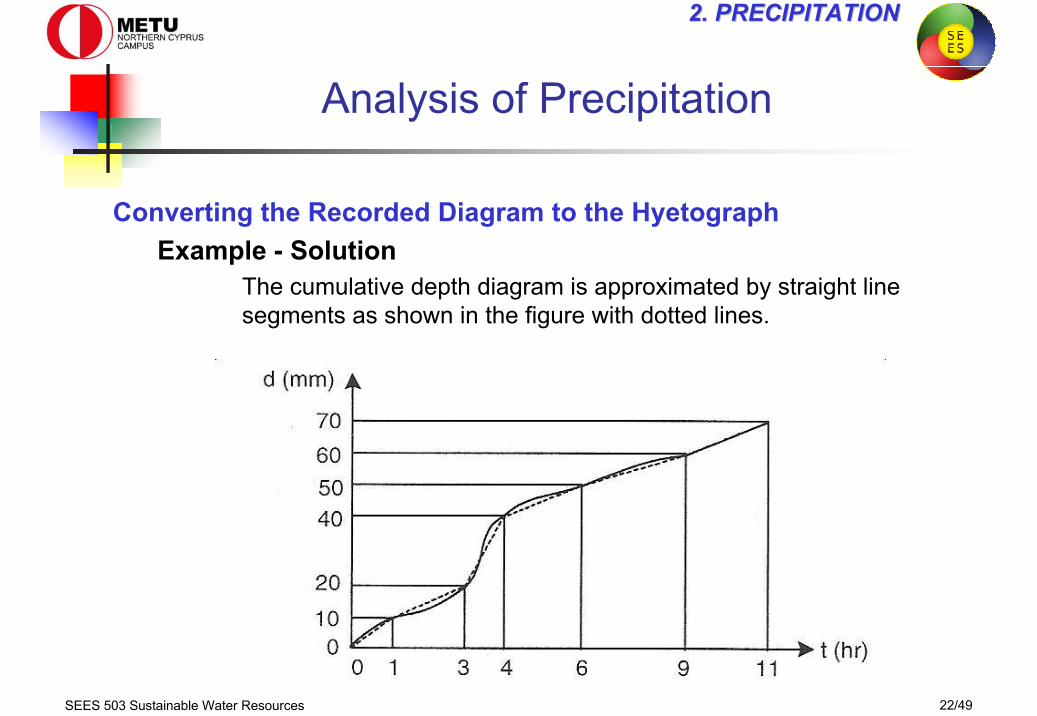
The cumulative depth diagram of a storm obtained from a recording raingauge is given in the figure. Obtain the corresponding hyetograph for this storm.
SEES 503 Sustainable Water Resources 22/49
2. PRECIPITATION 2. PRECIPITATION
Analysis of Precipitation
Converting the Recorded Diagram to the HyetographExample - Solution
The cumulative depth diagram is approximated by straight line segments as shown in the figure with dotted lines.
SEES 503 Sustainable Water Resources 23/49
2. PRECIPITATION 2. PRECIPITATION
Analysis of Precipitation
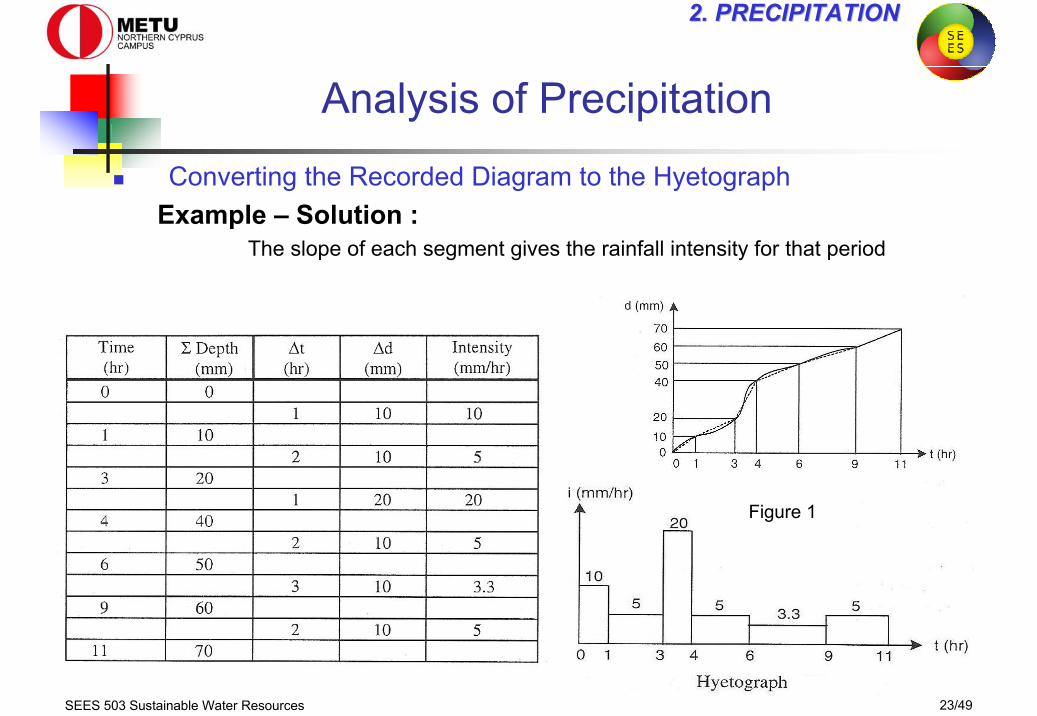
Converting the Recorded Diagram to the HyetographExample – Solution :
The slope of each segment gives the rainfall intensity for that period
Figure 1
SEES 503 Sustainable Water Resources 24/49
2. PRECIPITATION 2. PRECIPITATION
Analysis of Precipitation
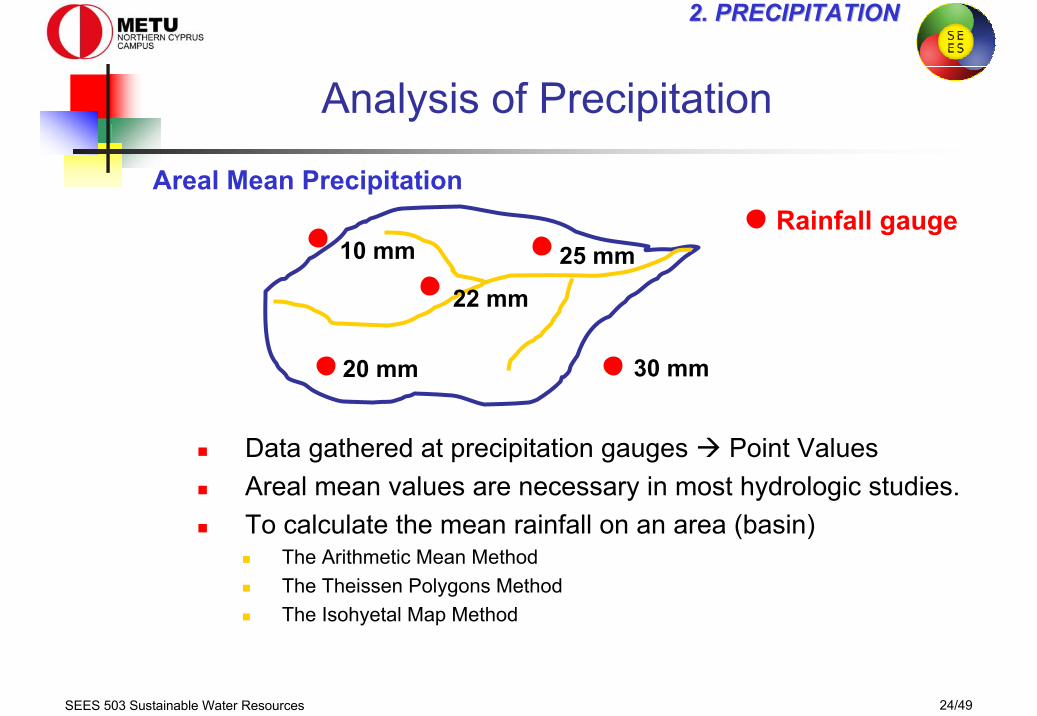
Areal Mean Precipitation
Data gathered at precipitation gauges Point ValuesAreal mean values are necessary in most hydrologic studies.To calculate the mean rainfall on an area (basin)
The Arithmetic Mean MethodThe Theissen Polygons MethodThe Isohyetal Map Method
Rainfall gauge
30 mm
25 mm
20 mm
22 mm
10 mm
SEES 503 Sustainable Water Resources 25/49
2. PRECIPITATION 2. PRECIPITATION
Analysis of Precipitation
Areal Mean Precipitation1. The Arithmetic Mean Method
(Sum of the precipitation depths at all stations in the basin) / (# of stations)
where Pave : the areal mean precipitation,Pi : rainfall observed at the ith station inside the basin, n : the number of inside stations
nPi
ave∑=P
SEES 503 Sustainable Water Resources 26/49
2. PRECIPITATION 2. PRECIPITATION
Analysis of Precipitation
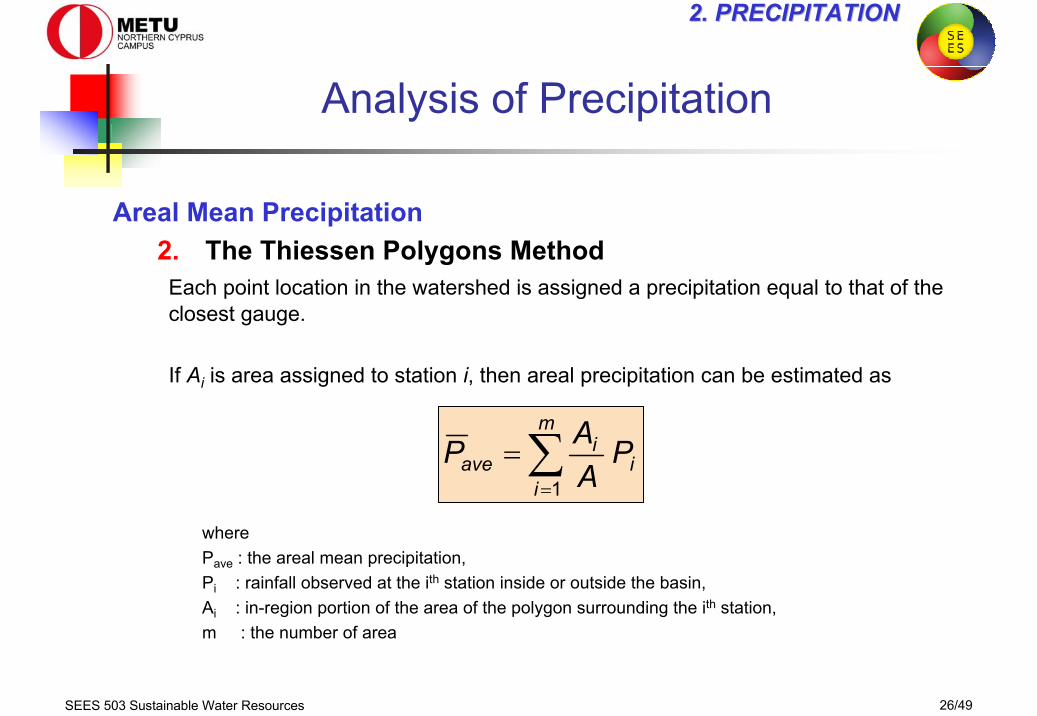
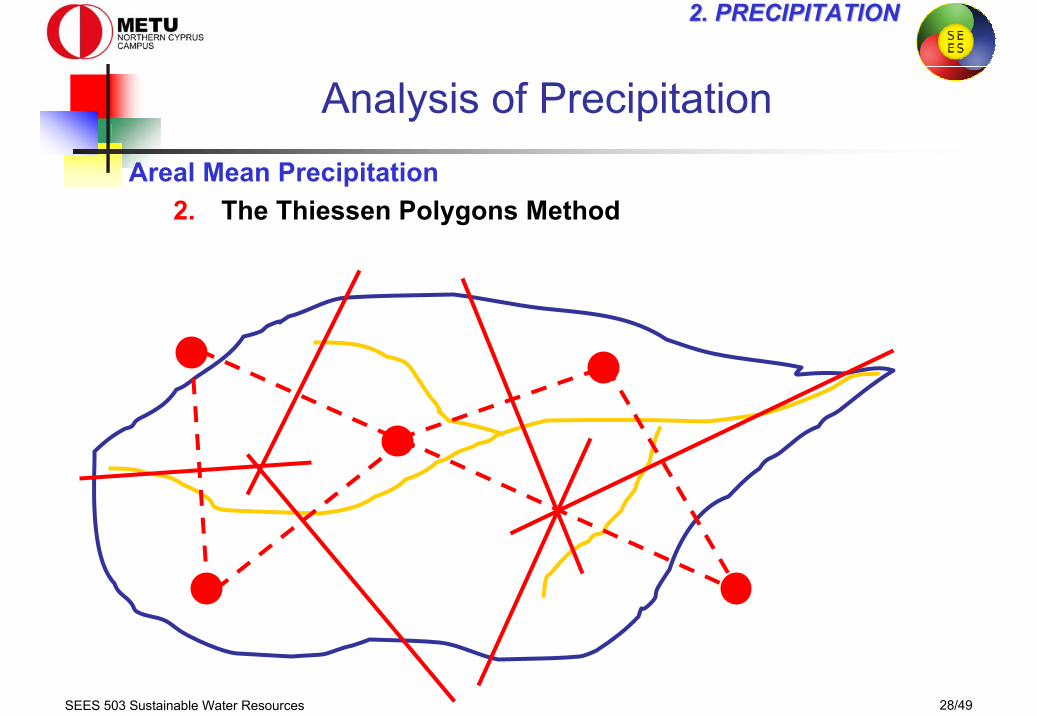
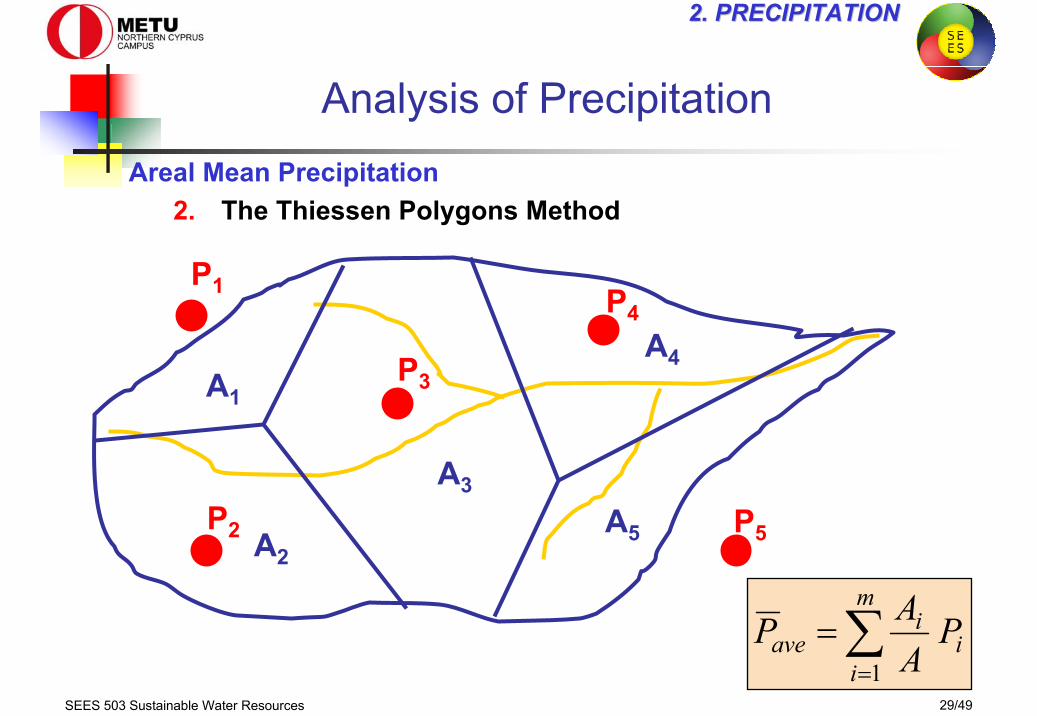
Areal Mean Precipitation2. The Thiessen Polygons MethodEach point location in the watershed is assigned a precipitation equal to that of the closest gauge.
If Ai is area assigned to station i, then areal precipitation can be estimated as
where Pave : the areal mean precipitation,Pi : rainfall observed at the ith station inside or outside the basin, Ai : in-region portion of the area of the polygon surrounding the ith station, m : the number of area
i
m
i
iave P
AAP ∑
=
=1
SEES 503 Sustainable Water Resources 27/49
2. PRECIPITATION 2. PRECIPITATION
Analysis of Precipitation
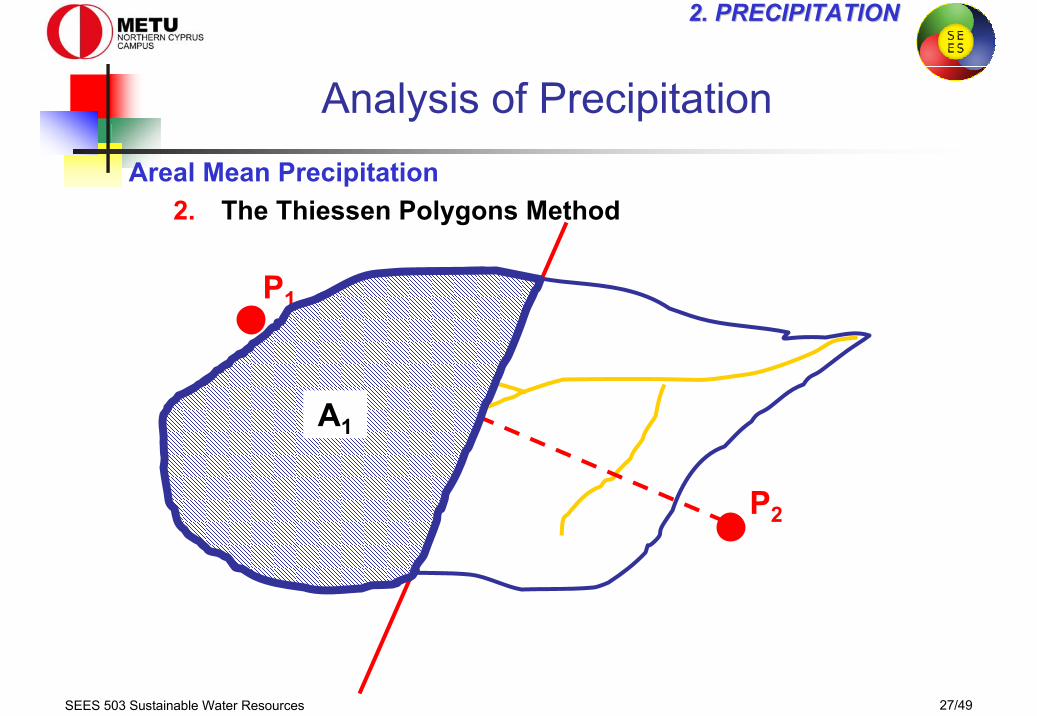
P1
P2
A1
Areal Mean Precipitation2. The Thiessen Polygons Method
SEES 503 Sustainable Water Resources 28/49
2. PRECIPITATION 2. PRECIPITATION
Analysis of PrecipitationAreal Mean Precipitation
2. The Thiessen Polygons Method
SEES 503 Sustainable Water Resources 29/49
2. PRECIPITATION 2. PRECIPITATION
Analysis of Precipitation
A1
A2
A3
A4
A5
P1
P2
P3
P4
P5
i
m
i
iave P
AAP ∑
=
=1
Areal Mean Precipitation2. The Thiessen Polygons Method
SEES 503 Sustainable Water Resources 30/49
2. PRECIPITATION 2. PRECIPITATION
Analysis of Precipitation
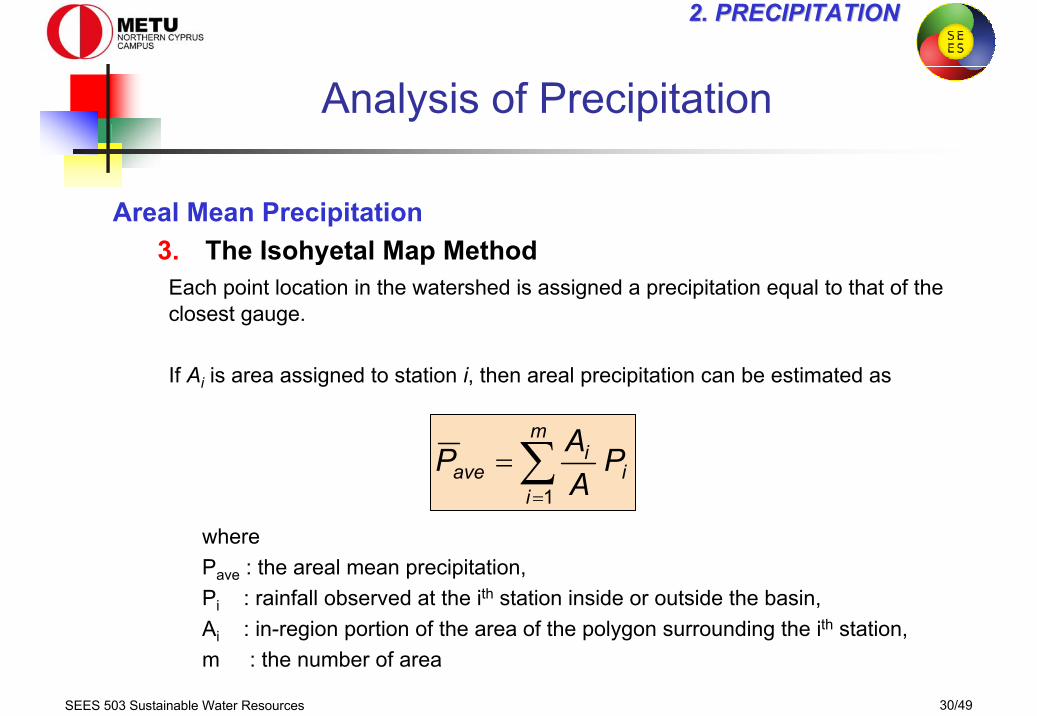
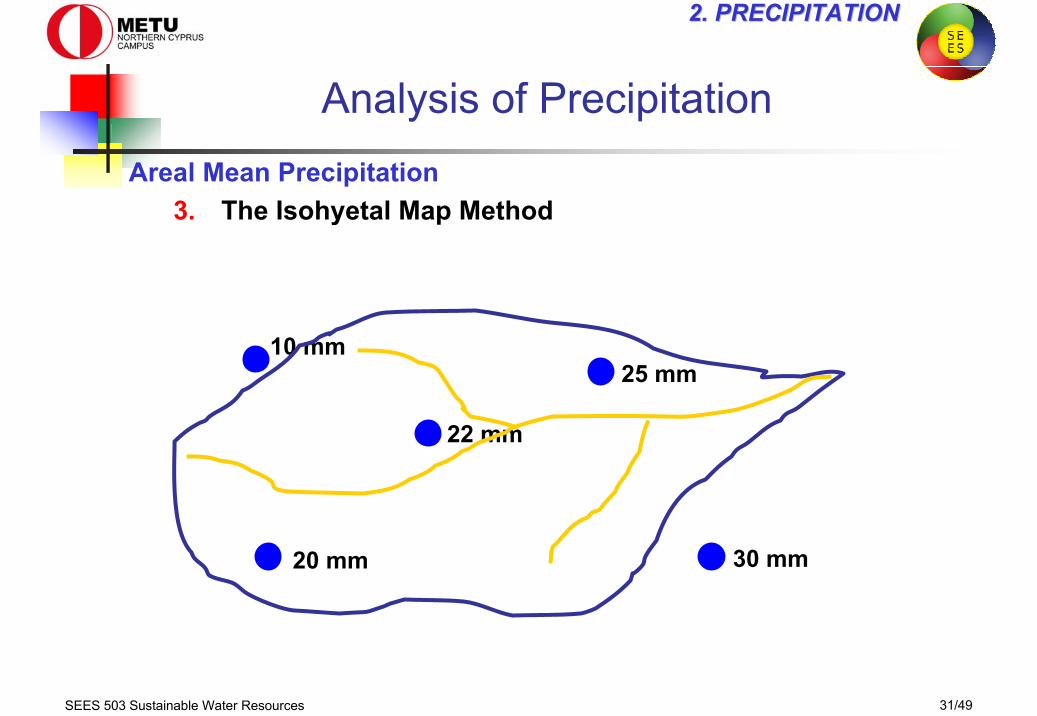
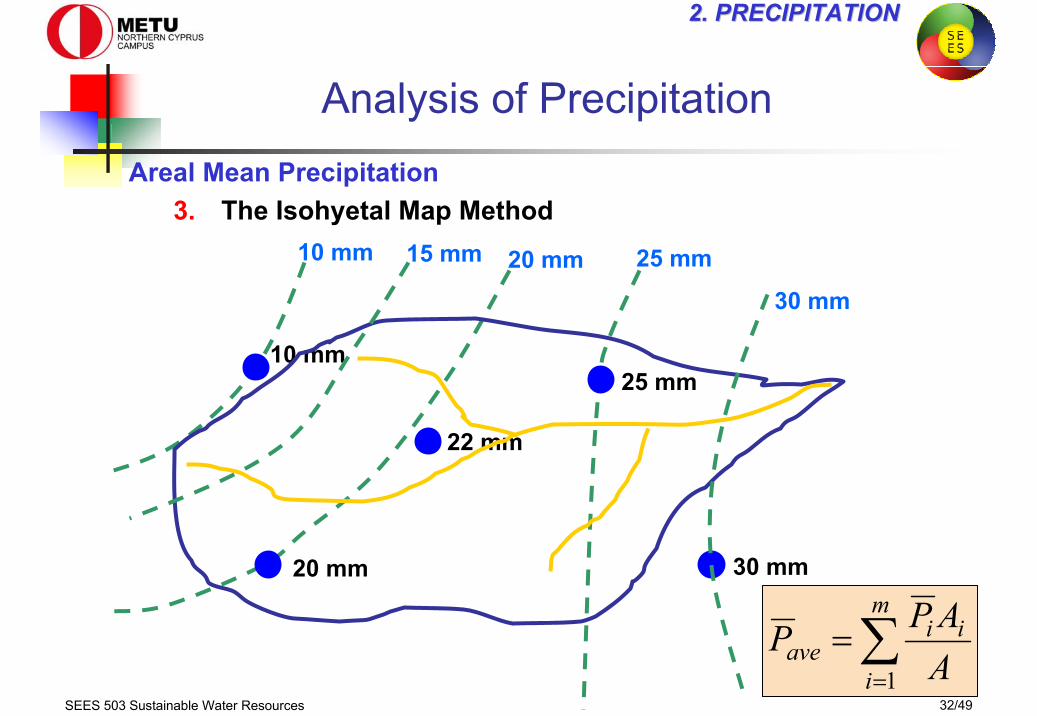
Areal Mean Precipitation3. The Isohyetal Map MethodEach point location in the watershed is assigned a precipitation equal to that of the closest gauge.
If Ai is area assigned to station i, then areal precipitation can be estimated as
where Pave : the areal mean precipitation,Pi : rainfall observed at the ith station inside or outside the basin, Ai : in-region portion of the area of the polygon surrounding the ith station, m : the number of area
i
m
i
iave P
AAP ∑
=
=1
SEES 503 Sustainable Water Resources 31/49
2. PRECIPITATION 2. PRECIPITATION
30 mm
25 mm
20 mm
22 mm
10 mm
Analysis of PrecipitationAreal Mean Precipitation
3. The Isohyetal Map Method
SEES 503 Sustainable Water Resources 32/49
2. PRECIPITATION 2. PRECIPITATION
30 mm
25 mm
20 mm
22 mm
10 mm
Analysis of Precipitation
30 mm
25 mm20 mm15 mm10 mm
Areal Mean Precipitation3. The Isohyetal Map Method
∑=
=m
i
iiave A
APP1
SEES 503 Sustainable Water Resources 33/49
2. PRECIPITATION 2. PRECIPITATION
Analysis of Precipitation
Resultant HyetographIn hydrograph analysis, the variation of the areal mean precipitation over time is importantThe mean hyetograph for a basin resultant hyetograph.Resultant Hyetograph by superposing the hyetographs in the stations and taking a suitable time interval such as minute, hour, or dayFor superposition of hyetographs1. The Arithmetic Mean Method2. The Thiessen Polygon Method
SEES 503 Sustainable Water Resources 34/49
2. PRECIPITATION 2. PRECIPITATION
Analysis of Precipitation
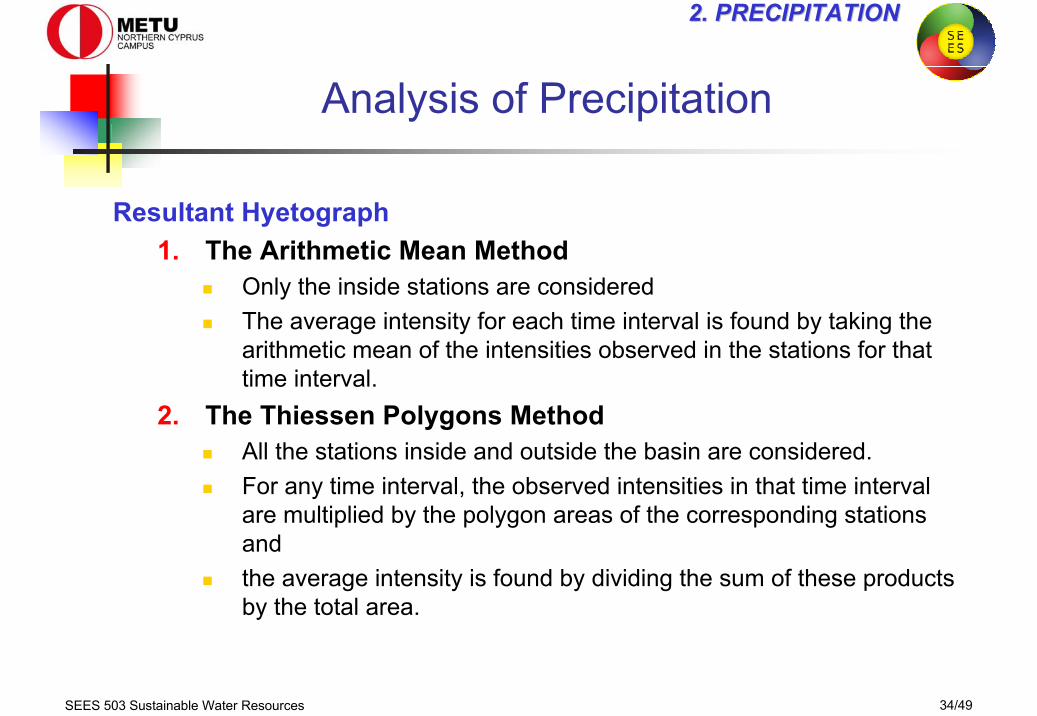
Resultant Hyetograph1. The Arithmetic Mean Method
Only the inside stations are consideredThe average intensity for each time interval is found by taking the arithmetic mean of the intensities observed in the stations for that time interval.
2. The Thiessen Polygons MethodAll the stations inside and outside the basin are considered.For any time interval, the observed intensities in that time interval are multiplied by the polygon areas of the corresponding stations andthe average intensity is found by dividing the sum of these products by the total area.
SEES 503 Sustainable Water Resources 35/49
2. PRECIPITATION 2. PRECIPITATION
Analysis of Precipitation
Resultant Hyetograph
SEES 503 Sustainable Water Resources 36/49
2. PRECIPITATION 2. PRECIPITATION
Analysis of Precipitation
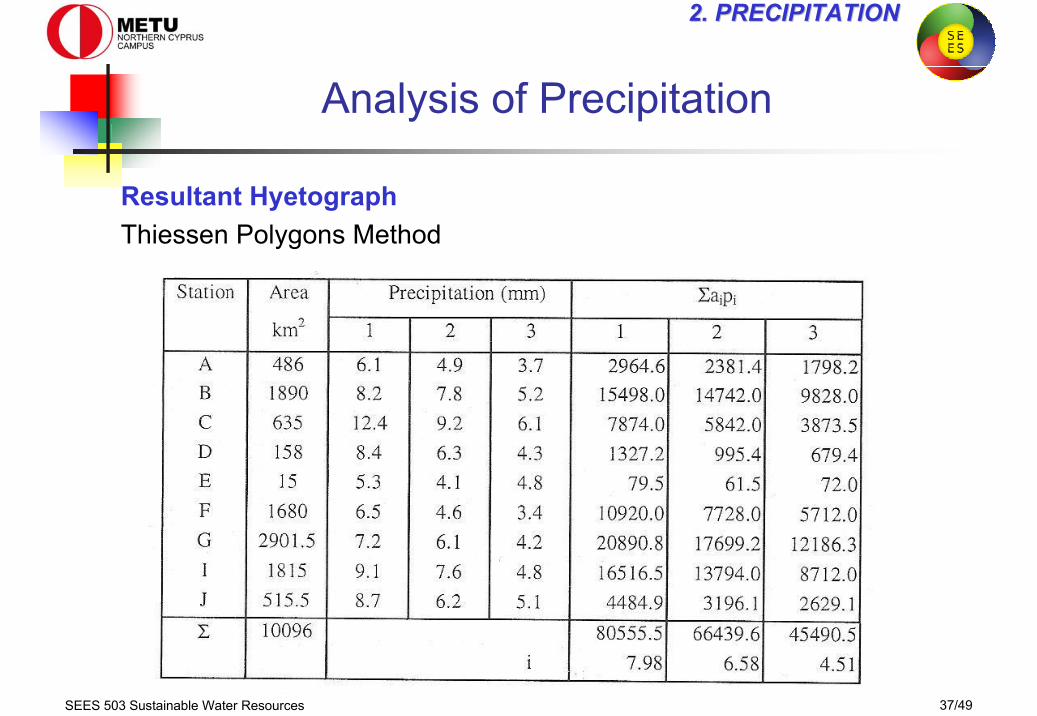
Resultant HyetographThiessen Polygons Method
SEES 503 Sustainable Water Resources 37/49
2. PRECIPITATION 2. PRECIPITATION
Analysis of Precipitation
Resultant HyetographThiessen Polygons Method
SEES 503 Sustainable Water Resources 38/49
2. PRECIPITATION 2. PRECIPITATION
Analysis of Precipitation
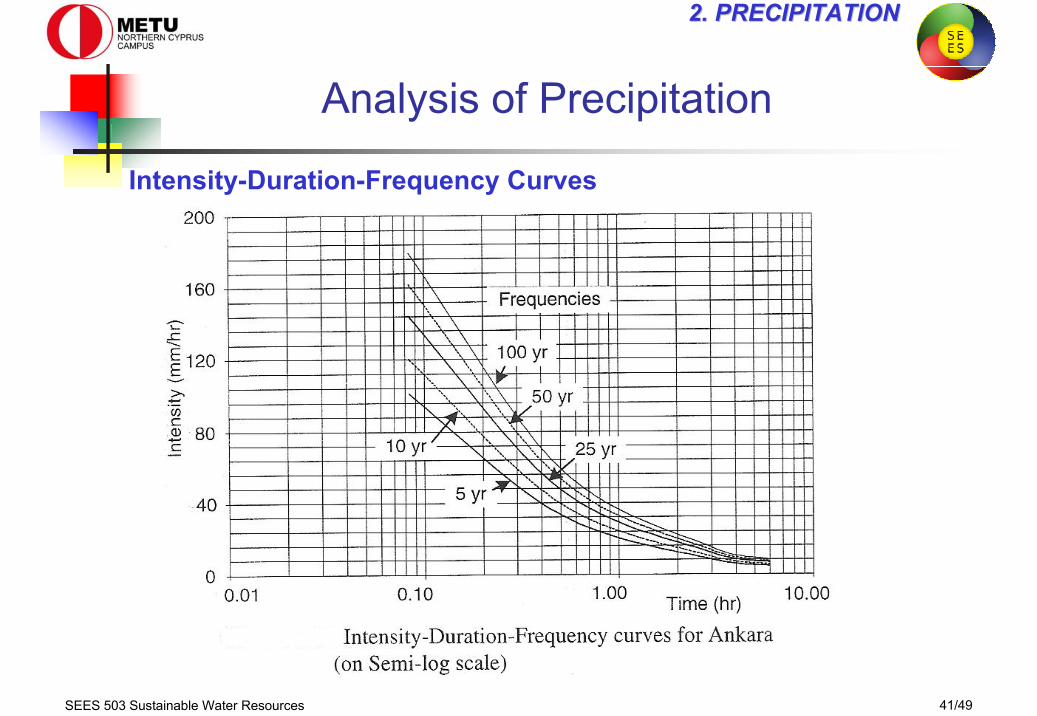
Intensity-Duration-Frequency CurvesIn general, the higher the intensity of the rainfall, the shorter the duration of it will beThe Intensity-Duration-Frequency curve is used in designing hydraulic structure
Design•Bridge•Culvert•Sewer•Channel
Intensity-Duration-Frequency curves
SEES 503 Sustainable Water Resources 39/49
2. PRECIPITATION 2. PRECIPITATION
Analysis of Precipitation
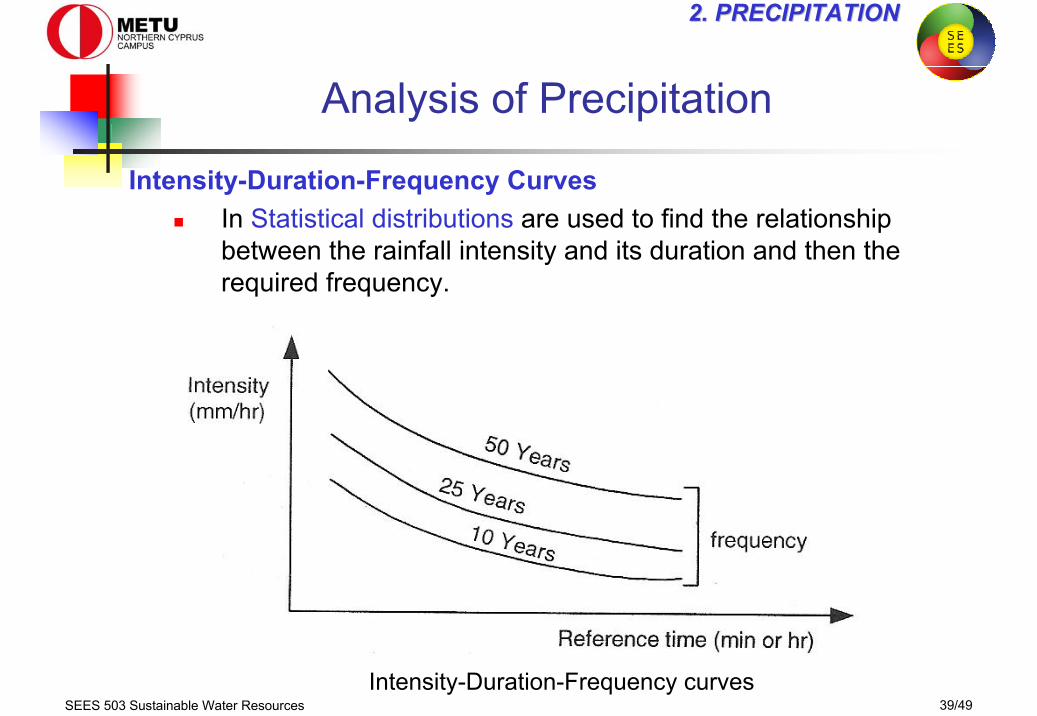
Intensity-Duration-Frequency CurvesIn Statistical distributions are used to find the relationship between the rainfall intensity and its duration and then the required frequency.
Intensity-Duration-Frequency curves
SEES 503 Sustainable Water Resources 40/49
2. PRECIPITATION 2. PRECIPITATION
Analysis of Precipitation
Intensity-Duration-Frequency CurvesThese curves are obtained by the statistical analysis of the maximum storm observed in the study area using long time series of rainfall data.They should be generated for all the areas or basins where small hydraulic structures are to be planned and constructed.
SEES 503 Sustainable Water Resources 41/49
2. PRECIPITATION 2. PRECIPITATION
Analysis of Precipitation
Intensity-Duration-Frequency Curves
SEES 503 Sustainable Water Resources 42/49
2. PRECIPITATION 2. PRECIPITATION
Overview
IntroductionMeasurement of Precipitation
Non-recording Rain GaugesRecording Rain Gauges
Analysis of PrecipitationConverting the Recorded Diagram to the HyetographAreal Mean PrecipitationResultant Hyetograph
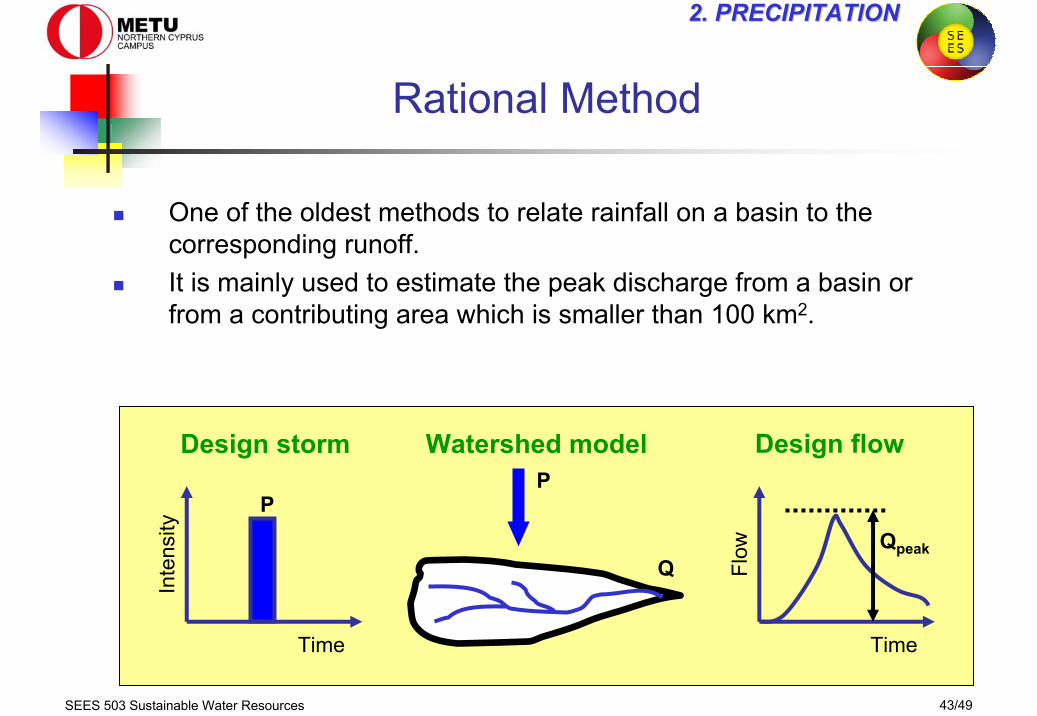
One of the oldest methods to relate rainfall on a basin to the corresponding runoff.It is mainly used to estimate the peak discharge from a basin orfrom a contributing area which is smaller than 100 km2.
Design storm
Inte
nsity
Time
P
Flow
Time
Qpeak
Design flowP
Q
Watershed model
SEES 503 Sustainable Water Resources 44/49
2. PRECIPITATION 2. PRECIPITATION
Rational Method
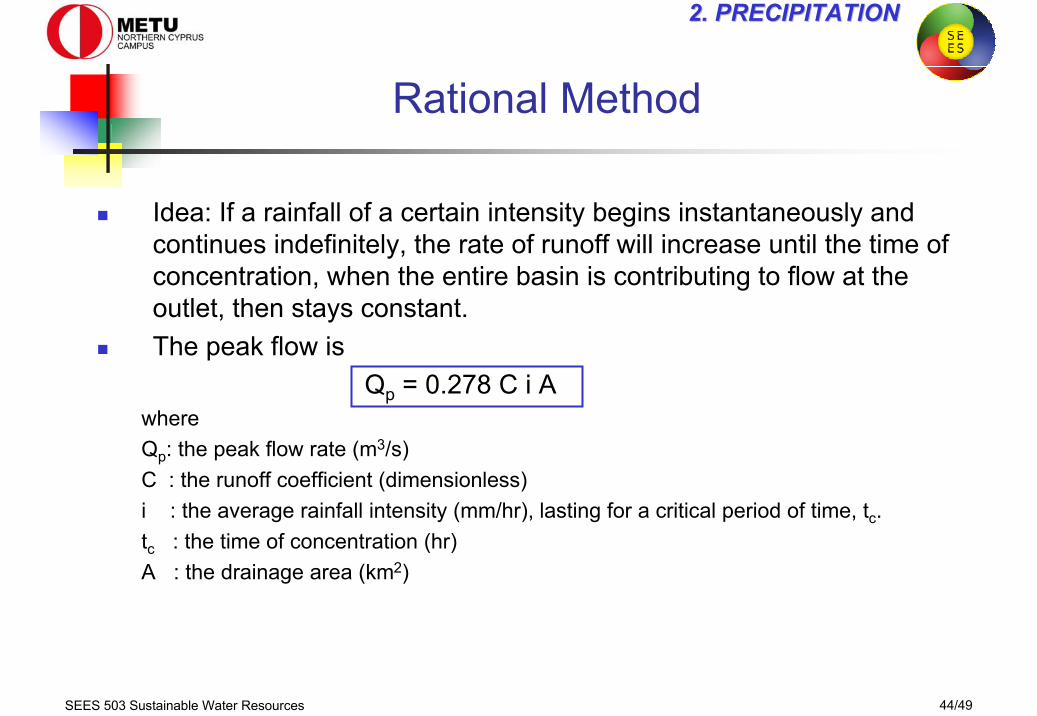
Idea: If a rainfall of a certain intensity begins instantaneously and continues indefinitely, the rate of runoff will increase until the time of concentration, when the entire basin is contributing to flow at the outlet, then stays constant.The peak flow is
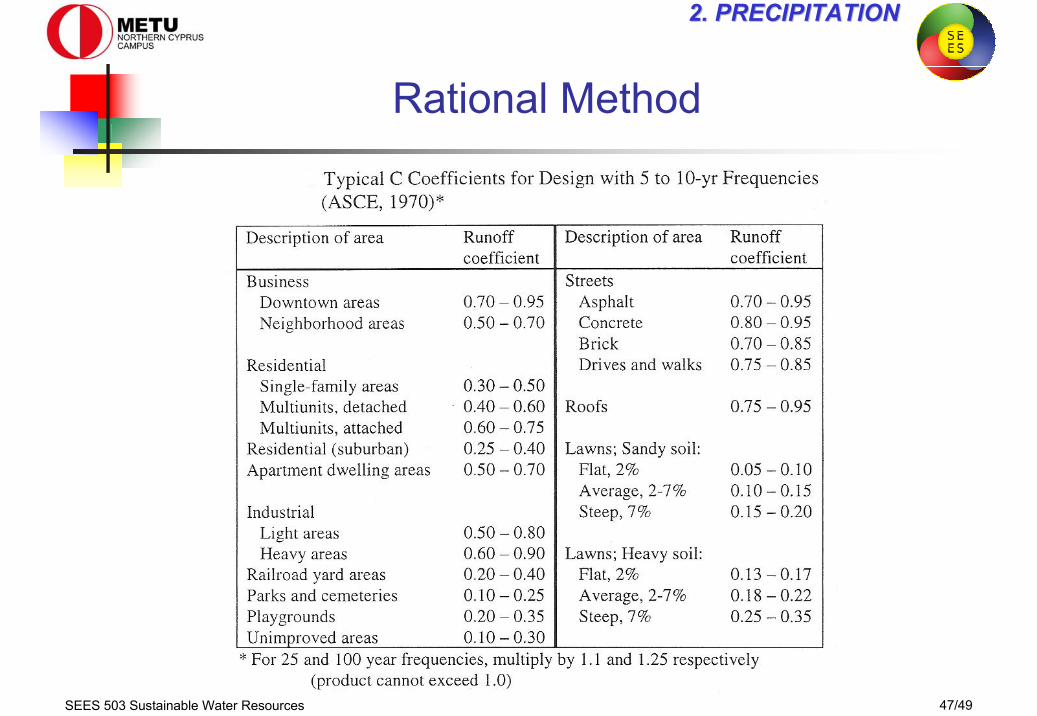
Qp = 0.278 C i Awhere Qp: the peak flow rate (m3/s)C : the runoff coefficient (dimensionless)i : the average rainfall intensity (mm/hr), lasting for a critical period of time, tc.tc : the time of concentration (hr)A : the drainage area (km2)
SEES 503 Sustainable Water Resources 45/49
2. PRECIPITATION 2. PRECIPITATION
Rational Method
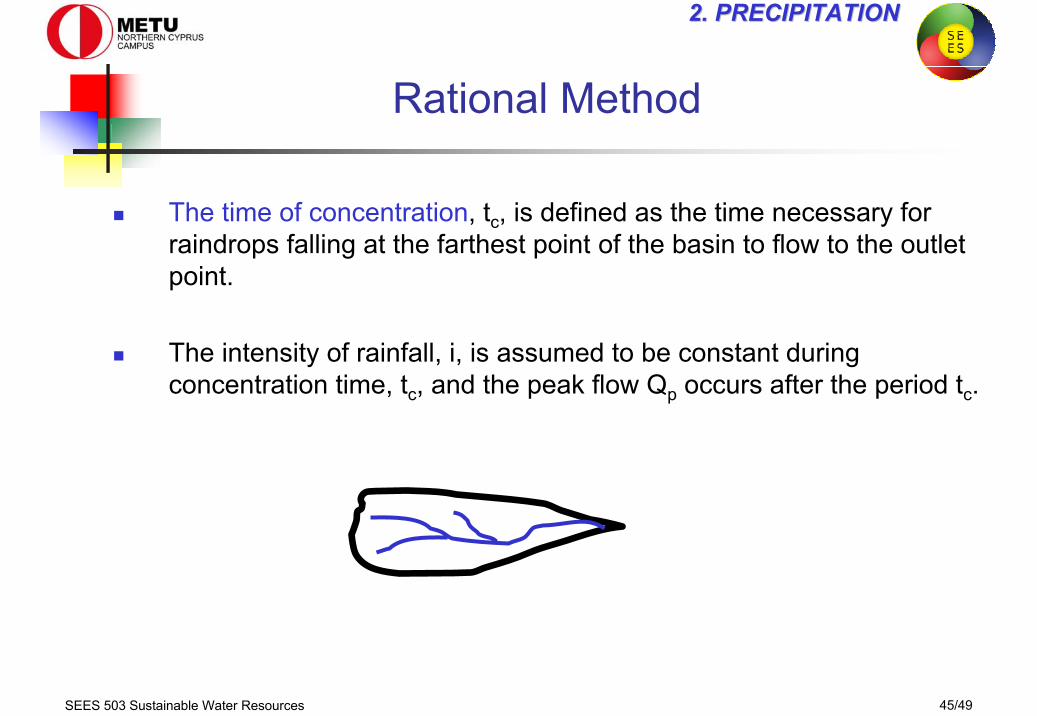
The time of concentration, tc, is defined as the time necessary for raindrops falling at the farthest point of the basin to flow to the outlet point.
The intensity of rainfall, i, is assumed to be constant during concentration time, tc, and the peak flow Qp occurs after the period tc.
SEES 503 Sustainable Water Resources 46/49
2. PRECIPITATION 2. PRECIPITATION
Rational Method
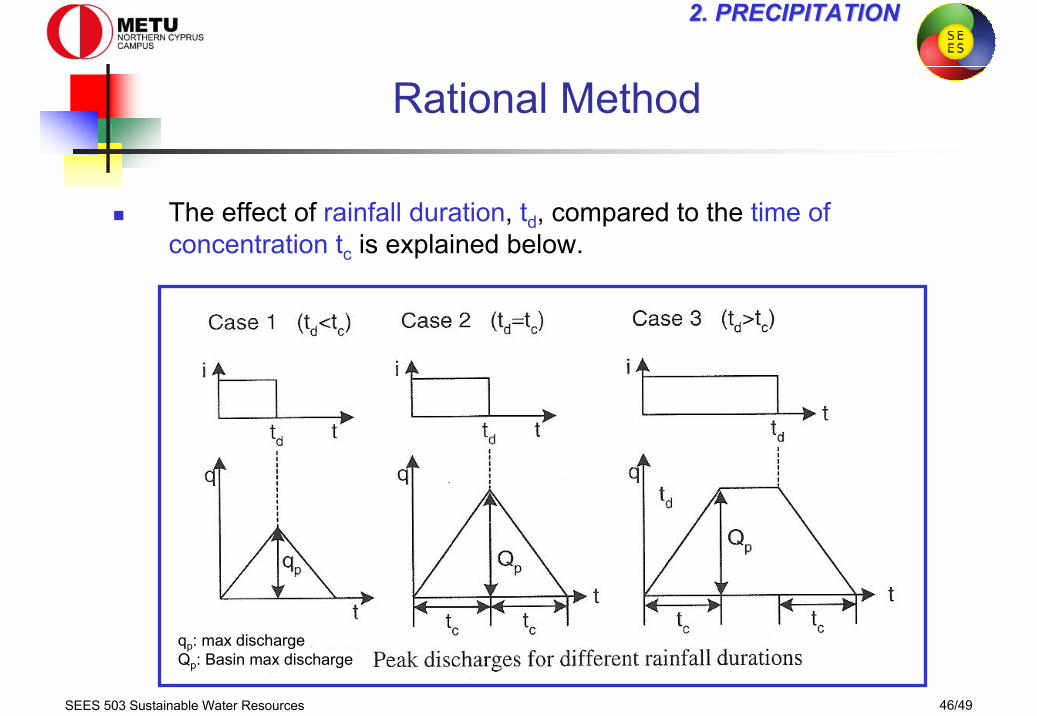
The effect of rainfall duration, td, compared to the time of concentration tc is explained below.
qp: max dischargeQp: Basin max discharge
SEES 503 Sustainable Water Resources 47/49
2. PRECIPITATION 2. PRECIPITATION
Rational Method
SEES 503 Sustainable Water Resources 48/49
2. PRECIPITATION 2. PRECIPITATION
Rational Method
In urban areas, the drainage area usually consists of subareas or subbasins of different surface characteristics.If the area of subbasins are denoted by Aj and the runoff coefficients of each subbasin are denoted by Cj for j=1, 2, … nThe peak runoff is
∑=
=n
jjjp ACiQ
1
278.0
SEES 503 Sustainable Water Resources 49/49
2. PRECIPITATION 2. PRECIPITATION
Rational Method
The following steps are utilized in the application of the Rational formula for the determination of peak flow.
1. Estimation of the time of concentration of the drainage area, tc.2. Estimation of the runoff coefficient, C.3. Selection of the return period (frequency) Tr, and finding the intensity
of rain that will be equaled or exceeded on the average, once every Tryears. To produce equilibrium flows, this design storm must have a duration equal to tc or longer. The desired intensity can be found from the Intensity-Duration-Frequency (IDF) curves of that region using a rainfall duration equal to the time of concentration.


![[XLS]test.nhb.org.intest.nhb.org.in/Urban_Housing/4041 statutory Towns.xlsx · Web view502 802681 27 502 802682 27 503 802683 27 503 802684 27 503 802685 27 503 802686 27 503 802687](https://static.documents.pub/doc/80x56/5ab1742b7f8b9abc2f8cb599/xlstestnhborg-statutory-townsxlsxweb-view502-802681-27-502-802682-27-503-802683.jpg)


