Segmentation of Complex Outdoor Scenes Bahram A. Parvin and Bir Bhanu UUCS 85-110 August 31, 1985 Department of Computer Science University of Utah Salt Lake City, Utah 84112 Abstract A new simpler approach to image segmentation via recursive region splitting and merging is presented. Unlike other techniques the kernel of splitting is based on a generalization of a two class gradient relaxation method and merging uses a statistical analysis of variance. Index Terms - Image Understanding, Multiclass Images, Outdoor Natural Scenes, Relaxation, Image Segmentation, Split and Merge, Thresholding Name and Present Address of the Corresponding author: Bir Bhanu, Department of Computer Science, 3160 Merrill Engg. Building, University of Utah, Salt Lake City, Utah 84112
Transcript
Segm entation of Complex Outdoor Scenes
Bahram A. Parvin and Bir Bhanu U U CS 85-110
August 31, 1985
Department of Computer Science University of Utah
Salt Lake City, Utah 84112
A b stra ct
A new sim pler approach to image segmentation via recursive region splitting and
m erging is presented. Unlike other techniques the kernel of splitting is based on a
generalization of a two class gradient relaxation method and merging uses a statistical
analysis of variance.
I n d e x T e r m s - Image Understanding, Multiclass Images, Outdoor Natural Scenes,
Relaxation, Im age Segmentation, Split and Merge, Thresholding
Name and Present Address of the Corresponding author:
Bir Bhanu, Department of Com puter Science, 3160 Merrill Engg. Building, University of
Utah, Salt Lake City, Utah 84112
1
Image segmentation is one of the crucial steps in image analysis. T h e goal of a
segmentation algorithm is to partition an image into regions, each having a homo gene ous
property such as intensity, color, texture etc. Ultimately, segmentation provides a set of
symbols and their interrelationships necessary for machine perception. Segmentation
algorithms can be categorized into three different types: edge detection, clustering and
region splitting and merging. Recursive segmentation based on the analysis of
distribution of features is one of the most popular and c o m m only used techniques for
image segmentation [7, 8, 11, 13]. Many of these techniques make use of an elaborate
peak location and selection procedure [7, 8] which provides threshold values for the
purpose of image segmentation. As an example Ohlander, Price and Reddy [8 ] select peak
from the histogram of 9 features of a color image using a seven step peak precedence
description. The computation of peak maxima and minima is complicated since minor
changes must be distinguished from major ones. One of the shortcomings of these
techniques is that small regions in a large image may not show a distinct peak in the
histogram, even if they are distinct from their immediate neighborhood. Therefore, in the
application of these techniques normally the image is partitioned artificially into a set of
subimages and each subimage is segmented and split further independently [5, 7, 8 ]. As
a result a remerging measure may be required [7] to merge regions that are arbitrarily
broken at the subimage boundaries. Very often this merging step leads to some regions
which remain unmerged or overmerged.
In complex natural scenes with many different regions due either to the increased size
of the image or to the decreased size of the regions, the gray level histogram may have
only one peak because the range of intensities for each region will probably overlap with
the ranges of other regions. As a result of this overlap, the histogram is usually almost
1. Introduction
unimodal. In [2] we presented a two class gradient relaxation algorithm for the
segmentation of images having unimodal gray level distributions. This basic algorithm
has been compared with the Rosenfeld, Hummel and Zucker algorithm [12] and has been
successfully used in the extraction of objects from biomedical images, aerial images and
tactical images [3, 4]. The tactical images being both in the visible and infrared spectrum.
This algorithm allows control over the segmentation results and rate of convergence of
the relaxation process. It provides automatic selection of the threshold for binarization.
In this paper we generalize the use of this algorithm for the segmentation of complex
natural scenes [1, 9, 10]. Region splitting is accomplished via recursive application of the
two class gradient relaxation algorithm [2]. It is followed by merging which attempts to
resolve fragmentation. T w o adjacent regions are merged if they have equal mean values.
The test for equal mean value is achieved by one way analysis of variance from a subset
of pixels in each region.
Since the technique presented here allows the splitting of the image to depend on the
outcome of the two class gradient relaxation technique [ 1, 2 ], it avoids any heuristic and
arbitrary measures for partitioning the image. Thus it does not suffer from the fact that
some of the regions may be artificially broken at the subimage boundaries and does not
require a robust merging step in order to remove the boundary artifacts [7]. It does not
require the detailed peak location and selection procedure. Further as it does not directly
depend on the peaks and valleys of the gray level histogram to initiate the relaxation
process (initial probability assignment), and uses image statistics, the initial step of the
relaxation process is a simple one, which is to be used over and over at the various
levels of the region splitting hierarchy.
2. Two C lass Gradient Relaxation Algorithm
Bhanu and Faugeras [1, 2] proposed a gradient relaxation algorithm for the segmentation
of images having unimodal distributions. These distributions are typically obtained when
the image consists mostly of a large background area with other small but significant
regions. In such cases the selection and location of the valley in the histogram is
nontrivial. Since two-class method is used as the basis for the segmentation of
multiclass images, a brief description of the algorithm is given below.
Suppose a set of N pixels i= 1,2,...,N fall into two classes x1 and X2 corresponding to the
white (gray value = 255) and black (gray value = 0). Reduced inconsistency and ambiguity
of pixels with respect to their neighbors are achieved by maximizing the global criterion,
c <Pi....
subject to the constraint that p/s are probability vectors. p, is the probability that the ith
pixel belongs to class X1 and X2. q;, the compatibility vector, is a function of P ; 's . It is
defined as,
qi(Xk)=(1/Vi)S 2 j=1c(i,Xlt,j,X1)pj(X|); k-1,2; i - 1 .... N (2)* i
where compatibility,
c(i,Xk,j,X|)={ 0; k = I; k= 1,2 ; j iVj, for all i{ 1; k = I ; k=1,2; j *Vj( for all i (3)
and \A is the set of 8 nearest neighbors of the ith pixel. qj(Xk) is in effect the average of
Pj(Xk) of eight nearest neighbors.
Initially at every pixel the assignment of probabilities is done by,
pj(X1)=FACT*((l (i ) - IBAR)/255) + 0.5 (4)
where, IBAR is the mean of the image and F A C T a function of intensity which is taken to
be equal to 1 if l (i )>IBAR, otherwise normally it is taken between 0.7 and 1. T he process
The magnitude of a's control the degree of sm oothing at each iteration and their ratio
control the bias to a class. The magnitude of FACT controls the initial assignm ent of
probabilities. After a few iterations the gray level histogram becom es bimodal with two
well separated peaks and the image is segm ented into black and white classes.
2.1. Ev al uat io n of th e T w o C la ss G r a d i e n t Relax at ion A l g o r i t h m
Since the two class gradient relaxation technique is used as the basis for the region
splitting procedure, its performance needs to be understood and evaluated. Three factors
are used to evaluate the performance: s igna l-to -no ise ratio, region size and contrast.
The following m ethodology analyzes the first two parameters.
1) A 100x100 synthetic image is created to consist of a square region against the
constant background. The size of the square is 50x50 pixels with magnitude of 130 for
intensity, and the background has a magnitude of 100 on the gray scale of 0-255. This
image is noise-free, and the objective is to extract the square from its immediate
background (see Fig. 1(a) top left image).
2) White noise is added to the original image and the s igna l-to -no ise ratio is varied
from 1 to 10. It is defined as the square of the step edge amplitude divided by the
standard deviation of Gaussian white noise.
3) A f ig u re of m e rit is established to a sse ss the am ount of deviation between the
noise-free segmentation, and the segmentation obtained on the noisy images. It is
defined as the number of the square region pixels which are segm ented as background.
is iterated u s in g e q u a t io n s ,
5
and the number of background pixels which are segmented as the square region pixels.
4) The size of the square region is gradually reduced from 50x50 to 5x5 and steps 2 and
3 are repeated to estimate the effect of the region-sizes on the segmentation algorithm.
The results are shown in Fig. 1 for the region-sizes of 50x50, 20x20, and 5x5. The
figure of m erit is plotted in Fig. 2. It shows the error versus the sign a l - t o -n oise ratio.
Using these figures, this experiment reveals that a) the segmentation algorithm has the
noise cleaning effect; b) most of the erroneous labelling occur at the boundary pixels, and
c) as the region-size is decreased, the number of mislabeled pixels in the background are
increased.
The noise cleaning effect is a major attribute of the relaxation technique. The iterative
relaxation process allows the labelling at any pixel location, to depend on the results of
the previous iteration. Thus, the process is better informed as the analysis proceeds.
The erroneous labelling of the border pixels is due to their inherent instability. For
example, all the border pixels in the inner square (with the exception of the corner pixels)
are biased toward the inner square, since 5 out of 8 nearest neighbors are voting for the
brighter square region. This results from a slight noise distortion in the vicinity of the
border data created by shifting the pixel balance, thus producing a wrong assignment.
The effect of shrinking the region-size is evident in Fig. 1(a) through 1(c). As the re g io n -
size is reduced, the contribution of the smaller region is decreased in the global mean,
thus, increasing the initial probability and compatibility measure at each pixel location.
Therefore, it increased the number of mislabelled pixels.
The contrast can be defined as a function of the mean difference between the
delineated square region and the background. In other words, it is a measure of the
overall variance of the image. It was found through experiments that the relaxation
6
algorithm, as defined by equations (4) to (6 ) can partition the above synthetic images (Fig.
1) provided that the signal -mean is approximately 2 5 % above the background -mean. Fig.
3 shows the effect of contrast and noise on the region extraction. T o enhance the
performance of the segmentation algorithm, the estimation of the initial probability
(equation (4)) was revised to include both mean and variance of the image. This is done
by replacing IBAR with (IBAR-bias) where bias is defined in Fig. 4, and its value is
obtained in such a way that the segmentation error across a wide range of the contrast
is minimized. With this change the lower contrast image with signal intensity=110 and
background intensity=100, small square region, was successfully extracted. Consider what
has occurred: as the variance of the image is decreased, the value of the bias is
increased, thus, increasing the initial probability assignment and local compatibility
measure. Consequently, this change forces region extraction from the background.
2.2. A Real t i m e A r c h i t e c t u r e for th e T w o C l a s s G r a d i e n t Re la xat ion A l g o r i t h m
To emphasize the simplicity of the two class segmentation algorithm, its real time
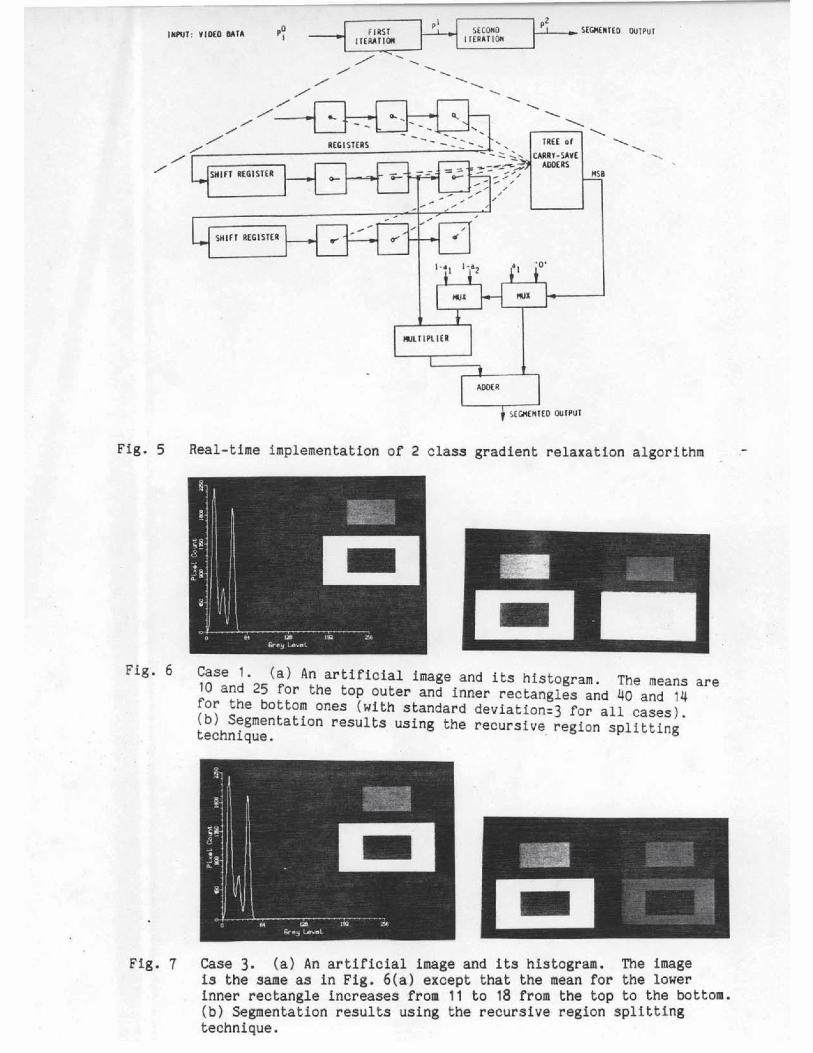
implementation is also examined and evaluated. The implementation shown in Fig. 3 is of
a pipelined architecture, and consists of three components:
1. Computation o f the i n i t i a l p r o b a b i l i t y ,2. Computation o f the c o m p a t i b i l i t y v e c t o r , and 3- U p da t in g the p r o b a b i l i t y v e c t o r .
Since the computation of the initial probability depends on the global mean and
variance of the image, it is assumed that these two variables are computed on the
previous frame. In other words, the global mean and variance do not change significantly
on the frame to frame basis. In many image understanding problems such as biomedical
data analysis, the computation of mean and variance is not necessary, since, either the
mean and variance are known apriori, or they have to be computed only once. The
second component of the relaxation algorithm is the computation of compatibility vector
which is defined as the mean probability of the neighborhood. T o align the eight near
neighbors, two shift-registers and nine registers are employed (Fig. 5), and a tree of
carry -sa ve-a dd ers is used to compute the local mean. Next, the most significant bit of
the compatibility measure is checked to either increase or decrease the current
probability assignment.
This architecture enables the application of the relaxation algorithm a viable approach to
image segmentation in real time environment. Currently the VLSI implementation of this
algorithm is in progress.
3. Extension to Multiclass
3.1. Re c u r si ve Re gio n Spl i t t in g
The multiclass segmentation algorithm is fundamentally a region splitting technique.
Historically [8, 13], these techniques rely on the analysis of the gray level (or Color)
histogram. In this context, the image is split into separate parts along the regions of
nonuniformity. The location of the sharp boundary variation is determined either by
locating the valley in the histogram which often requires histogram smoothing to
eliminate small peaks, or partitioning the histogram into intervals where each interval
satisfies an elaborate set of rules [13] such as,
i) the interval must contain a marked peak, ii) the area of the interval is above a
prespecified threshold, iii) the highest peak in an interval is above a certain amplitude,
and iv) the valleys on each side of the interval are sufficiently low.
The splitting is done by finding a well separated peak. If no split can be done, then
either the region is considered to be segmented or in cases where there is a lack of
spectral features such as monochromatic images, arbitrary partitioning of the image is
8
done and the splitting is done recursively.
The proposed multiclass segmentation algorithm depends on the recursive application of
the two class segmentation algorithm discussed earlier. Consequently, splitting of the
image based on mere global histogram is avoided, and the segmentation at each level of
the hierarchy, is allowed to depend on local neighborhood activity.
Another important issue in region splitting is the ambiguity of the border (edge data)
pixels. An approach to this problem is "conservative thresholding'' [13] where the original
threshold is actually replaced by two thresholds, one to left and the other one to the
right of the original threshold. The pixels to the right of the rightmost threshold and left
of the leftmost threshold are labelled normally, whereas the pixels that lie between the
two thresholds are not labelled and region growing is used to fill in the labels for these
pixels. In the proposed multiclass segmentation algorithm, the border pixels are masked
off, and are not labelled initially. However, the border pixels are used in computation of
the compatibility coefficients for the pixels directly adjacent to them. After the
segmentation process, region growing is used to fill in for the border pixels.
In summary, the two class segmentation algorithm is applied to the entire image,
splitting the image based on its global and local properties, into tw o distinct classes.
Next, all the conn ected-components of the segmented image are isolated and labelled.
Then each con nec ted-com ponent is used as a binary mask on the original image to
partition it further. A region is said to be partitionable if it has a valley in its histogram,
and as it will be shown later by an example, if such a valley exists, its selection is trivial.
This process continues recursively until a region is either nonpartitionable (unimodal), or
its area is small enough that its further partioning is of no interest. Currently, any region
that has an area of less than one percent of the total image area is not partitioned
further. In addition, any region that is less than 0.05% of the total im age area is not
labelled at all. These holes are either due to noise or sharp local intensity variation, and
are filled in during the final analysis. The multiclass segm entation algorithm is form ally
defined below. Note that only the local variables are pushed onto the stack.
10
p r o c e d u r e SEGMENT (image, mask, borderjnask, 2_class_image)
g l o b a l image :2_D array; /^original image*/mask :2_D array; /^initialized 'true'*/border mask :2-D array; /*array of border pixels*/2-class_image :2_D array; /*2 class segmentation image*/split_flag :boolean;
local connected_component :2_D array;label :1_D array;
/* 'label[i]' is an array which maintains the area of the labeled-region 1 i1 */
b e g i nMARK_BORDER_PIXELS (mask, border_mask); /*set all the border pixels
of the 'mask' array true, return the border pixels in 'border_mask'*/
2_CLASS_SEGMENT (image, mask, border_mask, 2_class_image); /* apply the 2 class segmentation algorithm to the 'image' where ever 'mask' is true and border jnask is false.*/
REGI0N_GR0W (2 class image, border_mask); /* perform region growing on the segmentation result where ever the border pixels 'border_mask' is true*/
LABEL_C0NNECTED_C0MP0NENT (2_class_image, mask, connected_component, label, split_flag); /* find all the connected-components, and create a list of the assigned 'label'. Set 'split_flag' true, if more than one connected-component is found, i.e. the two class segmentation did split the image.*/
i : = 1;w h i l e labelti] n o t null do
b e gi n
if split_flag t h e n b e gi n
if label [i] > threshold_area t h e n
b e gi nSET_MASK(LABEL[i]); /* Set mask true where
ever the connected-component array has value equal to label [i].*/SEGMENT(image, mask, border_mask, 2_class_image);
e n d ;e n delse ASSIGN_LABEL(i);
/* Region i is not partitionable, assign a label to it */i = i + 1; e n d ;
e n d ;e n d SEGMENT
Note that the recursive segmentation algorithm, described above, does not assume a
known number of classes. In other words, it is unsupervised, and allows classes to be
generated as required. This is accomplished by first extracting the dominant regions
based on the global feature activity and then using these regions to structure finer
segmentation in a hierarchical manner so that the local feature activity is revealed.
3.2. Re g io n M e r g i n g
A side effect of any pure recursive region splitting algorithm is fragmentation and it
may lead to poor segmentation results for some images [6]. Therefore, we use a merging
step which removes fragmentation and improves the performance of the relaxation
algorithm for a much wider class of images.
After the splitting algorithm has been applied, the image consists of a set of regions
where each of them is uniquely labelled. The goal of merging is to test whether the
histogram of two adjacent regions is unimodal. If the test is successful then the two
regions are merged; otherwise they remain intact. Such a test is usually achieved by
measuring the gray scale variance of the adjacent regions. Assuming that adjacent
regions X I and X2 are of size nl and n2 pixels respectively. then there are
(n1+n2)!/(n1!)*(n2!) ways to merge the two regions. Since nl grows as n n, a simple
test [14] was defined to be:
c 12 = V0n1+n2/ ( V 1n1. V 2n 2 )
where
VO = the standard deviation across region X1 and X2,V1 = the standard deviation across region X1 and V2 = the standard deviation across region X2
C12 is a confidence measure that regions X1 and X2 are separable.
11
Several variations of this criterion have been used for merging [7]. In this paper.
12
adjacent regions are merged if they have equal means. The test for equal mean is based
on the analysis of variance. The technique is as follows:
1a. Compute mean of each region,
n iXj^d/n^Z x x^j, where Xjjis jth pixel intensity of region i.
1b. Compute mean of the combined regions,2
X=(1/n)Z i.1nlXi
2a. Compute sum of squares between the means of the regions and the mean of the combined regions,
2 9Q1= 2 i=1nl(Xi-X)2
2b. Compute sum of squares within region,
Q2= l 21= r n i k = i ( x i k - xi >2
2c. Compute the quotient V = Q1(N-2)/Q2, where N=n1+n2
3. Choose a significant level of a at 5% and determine the solution c of the equation p(V <=c)=1-<*.
4. From the F-distribution table with (1,n-2) degrees of freedom find the value of c; if V <= c then accept the unimodality hypothesis and merge the two regions.
The above methodology assumes that all n1 and n2 pixels are independent.
Obviously, the intensity information in a given image is spatially correlated.
For this reason only a fraction of pixels are used to compute the statistic of
the adjacent regions This fraction is 5% of pixels in each region. Further,
if regions X1 and X2 are merged then statistic of the new region is updated
and all of the new neighbors are recursively examined for further merging.
Note that since we are not arbitrarily partitioning the image, it is
possible to avoid this merging step altogether if a smoothing operation
(expansion and contraction) is carried out on the binary mask to eliminate
13
small regions, holes and thin connections between regions.
3.3. Re s u l ts of the M u l t ic l a s s T e c h n i q u e o n S y n t h e t i c & N at u r a l S c e n e s
S y n t h e t i c I m a g e s : Three synthetic images are used to evaluate the
performance of the multiclass segmentation algorithm. These images have also
been used by Nagin et. al. and Price [7, 11].
E x a m p l e 1: Fig. 6(a) shows a synthetic image with its gray level histogram.
There are four regions in this image. The means are R1 = 10 and R2=25 for the
top outer and inner rectangles and R3=U0 and R4=14 for the bottom ones with
standard deviation=3 for all cases. The histogram reveals three distinct
peaks, as the distribution of the R2 and R4 is represented by the same peak.
However, since R2 and R4 are not spatially adjacent, they are labelled as two
separate regions. Note that R1 and R4 would merge together if they were
spatially adjacent. In Fig. 6(b) left image is the original image and the
right image shows the segmentation results after region splitting. T h e
multiclass technique produces results which are similar to those of [7, 11].
This experiment is repeated by changing the intensity of the region R4 from
14 to 17, and the multiclass segmentation algorithm produced an identical
result. The importance of this test is that as the intensity of R4 is changed
to 17, its distribution becomes completely ambiguous in the histogram. As a
result, the techniques that depend solely on the global histogram peaks for
initial probability assignment are subject to failure [7].
E x a m p l e 2: Fig. 7(a) shows the previous image with R4 replaced with a ramp
function which varies from 11 to 18 from the top to the bottom. The result is
shown in Fig. 7(b). Evidently, the relaxation scheme did not correctly label
14
a very small number of pixels. This is due to the very low contrast variation
in R4.
N a tu r a l I m a g e s : Two natural images of approximate size 200x200 pixels are
examined. The first one is a green component of the color house image. It is
shown in Fig. 8 together with its gray level histogram. The same image has
been used by many researchers. Fig. 9 shows the results of the two class
gradient relaxation algorithm on the original house image. It is evident from
Fig. 9(b) that the selection of the binarization threshold is trivial. Fig.
10(a) shows the segmentation results following region splitting. Fig. 10(b)
shows the outline of the regions obtained after the split and merge process.
The results indicate that the sky, roof, front wall, bushes and windows are
well segmented and most of the details in the images are maintained.
Segmentation problems have occurred, however, at three locations: i) the left
corner of the roof where it is split into three parts; ii) the left tree where
it is merged with the left window; and iii) the roof which is merged with the
right tree.
The second natural image is shown in Fig. 11 together with its histogram.
It is an aerial image consisting of several roads and a storage tank complex.
The segmentation results after recursive region splitting are shown in Fig.
12(a) and the boundaries of the extracted regions after the split and merge
process are shown in Fig. 12(b). Note that the results indicate that the tank
complex, main highway, curved road and the background are well extracted.
However, some parts of the highway are merged with the background; this is due
to the small width of the road.
15
4. Conclusions
In this paper, the performance of the two class gradient relaxation
algorithm was evaluated. The evidence indicates successful segmentation in
the presence of noise, low contrast and small region size. The simplicity of
the algorithm was demonstrated by providing a real-time architecture. The
implementation is possible on the ground that the algorithm requires only
local processing for updating the initial probabilities in a subimage. Next,
the two class gradient relaxation algorithm was used as the basis for the
recursive region splitting which was followed by region merging to resolve
fragmentation. One shortcoming of the proposed technique is its inability to
extract narrow line segments as required for roads and highways. One possible
solution is to make use of the intensity and edge information in an integrated
manner [3].
The multiclass segmentation technique presented here is a much simpler and
conceptually straight forward technique and provides at least as good results
on complex natural scenes as the techniques presented in [7, 8]. It uses only
the intensity feature as opposed to color or texture features.
16
References
[1] B. Bhanu.Shape Matching and Image Segmentation U sin g Stochastic Labeling.Technical Report USCIPI 1030, USC Image Processing Institute, Los
Angeles, California, August, 1981.
[2] B. Bhanu and O.D. Faugeras.Segmentation of Images Having Unimodal Distributions.IE E E Transactions on Pattern Analysis and Machine Inte lligen ce
PAMI-4(4):408-4l9, July, 1982.[ 3 ] B. Bhanu and R.D. Holben.
Model Based Segmentation of FLIR Images.In A.G. Tescher (editor), Proc. S P IE , Applications of D ig ita l Image
Processing \ I I I , Num ber 504, pages 10-18. August, 1984.
[4] B. Bhanu, A.S. Politopoulos and B.A. Parvin.Intelligent Autocueing of Tactical Targets.In IE E E Conference on Computer Vision and Pattern Recognition, pages
502-503. June, 1983.
[5] O.K. Chow and T. Kaneko.Automatic Boundary Detection of the Left Ventricle from Cineangiograms.Computer Graphics and Biom edical Research 5:388-410, 1972.
[6] A.R. Hanson, E.M. Riseman and P.A. Nagin.Author's Reply.IE E E Trans, on Pattern Analysis and Machine Inte lIige n ce PAMI-6:249> March,
1984.
[7 ] P. Nagin, A. Hanson and E. Riseman.Studies in Global and Local Histogram Guided Relaxation Algorithms.IE E E Transactions on Pattern Analysis and Machine I ntel I igence :263-276, May,
1982.
[8] R. Ohlander, K. Price and D.R. Reddy.Picture Segmentation Using a Recursive Region Splitting Method.Computer Graphics and Image Processing 8:313-333» 1978.
[9] B.A. Parvin and B. Bhanu.Segmentation of Images Using a Relaxation Technique.In IE E E Conference on Computer Vision and Pattern R ecognition, pages
151-153. June, 1983.[10] B.A. Parvin.
A Split and Merge Algorithm for Segmentation of Natural Scenes.In Seventh International Conference on Pattern Recognition, pages 294-296.
1984.
17
[11] K. Price.A Comment on - Studies in Global and Local Histogram Guided Relaxation
Algorithms.I E E E Transactions on Pattern Analysis and Machine I ntelI igence :247-249,
March, 1984. -
[12] A. Rosenfeld, R. Hummel and S. Zucker.Scene Labeling by Relaxation Operations.IE E E Transactions on Systems. Man, and Cybernetics SMC-6(6):420-433, June,
1976*[13] S. Shafer and T. Kanade.
Recursive Region Segmentation by Analysis of the Histogram.In /nternational Conference on Acoustics, Speech and Signal Processing, pages
1166-1171. May, 1982.[14] Y. Yakimovsky.
Boundary and Object Detection in Real World Images.Journal of Assoc. Comput. Mach. 23(4):599—618, 1976.
(a) region size 50x50 region size 20x20 region size 5x5
Fig. 1 Effect of noise on the 2 class gradient relaxation technique for regions of various sizes with varying amount of signal-to-noise ratio.
S I G N A L 10 1 S C I M H O
Fig. 2 Pixel classification error versus signal-to-noise ratio for the images in Fig. 1.
m
■3PI
’■A5GT'
&* .<
3 “ *
m m ■ ■. 4 ' '
15=100 I r=\Z'3 TRPGET
OPIGIHftL
u33
RELflXATtow
2 *<*: Z- tis7 s--N=:
« 8
(a) <b>
Fig. 3 Effect of contrast and noise on target extraction(a) target size 30x30, target intensity 150, background intensity 100(b) target size 30x30, target intensity 125, background intensity 100
Fig. 4 Relation between bias and variance used in the initial assignment of probabilities.
Fig. 5 Real-time implementation of 2 class gradient relaxation algorithm
Fig. 6 ?JSae An artificial image and its histogram. The means aretu and 25 for the top outer and inner rectangles and 40 and 14 tor the bottom ones (with standard deviation=3 for all cases).techniquentati°n results usin8 the recursive region splitting
Fig. 7 Case 3- (a) An artificial image and its histogram. The image is the same as in Fig. 6(a) except that the mean for the lower inner rectangle increases from 11 to 18 from the top to the bottom, (b) Segmentation results using the recursive region splitting technique.
Fig. 8 A house image and its gray level histogram.
(a) (b)
Fig. 9 (a) Effect of two class gradient relaxation algorithm on the house .. image.
(b) Histogram of the image corresponding to Fig. 9(a).
(a) (b)
Fig. 10 (a) Results of recursive region splitting.(b) Edge results of the segmented image following the region
merging step.
Fig. 11 An aerial image and its gray level histograa.
Fig. 12 (a) Results of recursive region splitting.(b) Edge results of the segmented image following the region
merging step.
List of Figures
Fig. 2
Fig. 3
Fig. 4
Fig. 5
Fig. 6
Fig. 7
Fig. 8
Fig. 9
Fig. 1(
Fig. 1
F ig . 1 Effect of noise on the 2 class gradient relaxation technique for regions of various sizes with varying amount of signal-to-noise ratio.(a) region size 50x50(b) region size 20x20(c) region size 5x5
Pixel classification error versus signal-to-noise ratio for the images in Fig. 1.
Effect of contrast and noise on target extraction(a) target size 30x30, target intensity 150, background intensity 100(b) target size 30x30, target intensity 125, background intensity 100
Relation between bias and variance used in the initial assignment of probabilities.
Real-time Implementation of 2 class gradient relaxation algorithm
Case 1. (a) An artificial image and its histogram. The means are 10 and 25 for the top outer and inner rectangles and 40 and 14 for the bottom ones (with standard deviation=3 for all cases).(b) Segmentation results using the recursive region splitting technique.
Case 3* (a) An artificial image and its histogram. The image is the same as in Fig. 6(a) except that the mean for the lower inner rectangle increases from 11 to 18 from the top to the bottom,(b) Segmentation results using the recursive region splitting technique.
A house image and its gray level histogram.
(a) Effect of two class gradient relaxation algorithm on the house image.
(b) Histogram of the image corresponding to Fig. 9(a).
(a) Results of recursive region splitting.(b) Edge results of the segmented image following the region
merging step.
1 An aerial image and its gray level histogram.
Fig. 12 (a) Results of recursive region splitting.(b) Edge results of the segmented image following the region
merging step.
i
Table of Contents1. Introduction 12. Two Class Gradient Relaxation Algorithm 3
2.1. Evaluation of the Two Class Gradient Relaxation Algorithm 42.2. A Real time Architecture for the Two Class Gradient 6
Relaxation Algorithm3. Extension to Multiclass 7
3.1. Recursive Region Splitting 73.2. Region Merging 113.3. Results of the Multiclass Technique on Synthetic & Natural 13