Seismic attenuation and well log analysis in a heavy oilfield Zimin Zhang* and Robert R. Stewart, CREWES Project, University of Calgary Summary We analyze the relationship between seismic attenuation and rock properties in well 11-25-13-17W3 from the Ross Lake heavy oilfield, Saskatchewan. Well log analysis indicates that the main lithologies in this well are shale and shaly sandstone. Interval Q values for the P wave and shear wave were estimated by applying the spectral ratio method on near-offset VSP data (which used both vertical and horizontal vibrators). The Q values are most reliable from 400m to 1050m for the P wave and from 225m to 1050m for the shear wave. The Q values correlate interestingly with petrophysical variables. Qp values increase with P- and S-velocities and decrease with Vp/Vs and porosity. Shaly sandstone shows more attenuation than pure shale and sandstone. A crossplot between Qp and clay-bound water indicates more attenuation in shaly sandstone possibly caused by the interaction between mobile water and clay-bound water. Q values for S-waves also display a similar relationship. Velocity dispersion was observed between VSP-derived velocities and sonic velocities. On average, sonic log velocities are 3.4% higher than VSP velocities for the P wave, and 4.8% higher for shear waves. Introduction Attenuation is one of the basic attributes of seismic waves propagating in the earth. Understanding the causes of seismic attenuation and the relationship between it and rock properties is important in the acquisition, processing and interpretation of seismic data. In this study, well log data and VSP data will be used to analyze the relationship between rock properties and attenuation. An ultimate goal of the studies is to use attenuation to provide helpful information for seismic interpretation and reservoir characterization. The borehole selected for this study is well 11-25-13-17W3 from Ross Lake, Saskatchewan. The lithologies of the studied interval are mainly shale and shaly sandstone. The producing reservoir in this well is a Cretaceous-age channel sand in the Cantuar formation of the Mannville Group. The produced oil is heavy, about 13° API. A multi-offset VSP survey was conducted in June 2003 (Xu and Stewart, 2003). The zero-offset VSP survey used both vertical and horizontal vibrators as sources, which are favorable for estimation P- and S-wave attenuation. Density and neutron porosity, dipole sonic and resistivity logs were also available in this well. Well log analysis and Q estimation Figure 1 displays well log curves with formation tops from the 11-25-13-17W3 well. There are two porous clean sand intervals with good permeability at 1148m-1160m and 1164m-1180m respectively, which are interpreted to be sand channels in the Cantuar formation. There is about 12m of oil pay in the upper sand, while the lower sand is wet. Clay content in the rock was estimated from the gamma-ray curve by linear scaling between its minimum and maximum values. The total porosity was calculated from the average of the density-porosity and neutron-porosity logs. Effective porosity was estimated from the average of the shale- corrected density-porosity and neutron-porosity logs. The porosity of the channel sand is quite high, about 30%. According to the neutron-density porosity difference and Figure 1: Well log curves for 11-25-13-17W3 well. Top, from left to right - spontaneous potential (SP); resistivity (deep measurement in red, medium measurement in blue and shallow tool in green); gamma-ray (GR); density porosity (red, sandstone-scale) and neutron porosity (blue, sandstone-scale); DELT (shear wave in blue, and P wave in red); and Vp/Vs. The bottom is same as the top focusing on the channel sand portion of the well.
Transcript
Seismic attenuation and well log analysis in a heavy oilfield Zimin Zhang* and Robert R. Stewart, CREWES Project, University of Calgary Summary We analyze the relationship between seismic attenuation and rock properties in well 11-25-13-17W3 from the Ross Lake heavy oilfield, Saskatchewan. Well log analysis indicates that the main lithologies in this well are shale and shaly sandstone. Interval Q values for the P wave and shear wave were estimated by applying the spectral ratio method on near-offset VSP data (which used both vertical and horizontal vibrators). The Q values are most reliable from 400m to 1050m for the P wave and from 225m to 1050m for the shear wave. The Q values correlate interestingly with petrophysical variables. Qp values increase with P- and S-velocities and decrease with Vp/Vs and porosity. Shaly sandstone shows more attenuation than pure shale and sandstone. A crossplot between Qp and clay-bound water indicates more attenuation in shaly sandstone possibly caused by the interaction between mobile water and clay-bound water. Q values for S-waves also display a similar relationship. Velocity dispersion was observed between VSP-derived velocities and sonic velocities. On average, sonic log velocities are 3.4% higher than VSP velocities for the P wave, and 4.8% higher for shear waves. Introduction Attenuation is one of the basic attributes of seismic waves propagating in the earth. Understanding the causes of seismic attenuation and the relationship between it and rock properties is important in the acquisition, processing and interpretation of seismic data. In this study, well log data and VSP data will be used to analyze the relationship between rock properties and attenuation. An ultimate goal of the studies is to use attenuation to provide helpful information for seismic interpretation and reservoir characterization. The borehole selected for this study is well 11-25-13-17W3 from Ross Lake, Saskatchewan. The lithologies of the studied interval are mainly shale and shaly sandstone. The producing reservoir in this well is a Cretaceous-age channel sand in the Cantuar formation of the Mannville Group. The produced oil is heavy, about 13° API. A multi-offset VSP survey was conducted in June 2003 (Xu and Stewart, 2003). The zero-offset VSP survey used both vertical and horizontal vibrators as sources, which are favorable for estimation P- and S-wave attenuation. Density and neutron porosity, dipole sonic and resistivity logs were also available in this well. Well log analysis and Q estimation Figure 1 displays well log curves with formation tops from the 11-25-13-17W3 well. There are two porous clean sand
intervals with good permeability at 1148m-1160m and 1164m-1180m respectively, which are interpreted to be sand channels in the Cantuar formation. There is about 12m of oil pay in the upper sand, while the lower sand is wet. Clay content in the rock was estimated from the gamma-ray curve by linear scaling between its minimum and maximum values. The total porosity was calculated from the average of the density-porosity and neutron-porosity logs. Effective porosity was estimated from the average of the shale- corrected density-porosity and neutron-porosity logs. The porosity of the channel sand is quite high, about 30%. According to the neutron-density porosity difference and
Figure 1: Well log curves for 11-25-13-17W3 well. Top, from left to right - spontaneous potential (SP); resistivity (deep measurement in red, medium measurement in blue and shallow tool in green); gamma-ray (GR); density porosity (red, sandstone-scale) and neutron porosity (blue, sandstone-scale); DELT (shear wave in blue, and P wave in red); and Vp/Vs. The bottom is same as the top focusing on the channel sand portion of the well.
Seismic attenuation and rock properties
regional geology in southwest Saskatchewan, the lithologies in this well are mostly shale, shaly sandstone and sandstone.
The spectral ratio method (Toksöz and Johnson, 1981) was used to estimate the average Q value (Qave) from VSP data. The interval Q values for a layered medium are then calculated from Qave (Bale et al., 2002),
)1()()1(
)1()1(
)()(
+−+
−++
=nQ
nTnTnQ
nTnQ
nT
aveaveave
,
n=1,2, …, N-1
Figure 2: Top, from left to right - amplitude spectrum and spectral ratio (source sweep in red, the first depth level trace in blue and the bottom receiver in green); cumulative attenuation calculated from the spectral ratio method; and estimated interval Q values of P wave. The bottom plots are for the shear wave. The amplitude spectra for all the levels were calculated using a 500ms window on down-going P- and down-going shear-waves respectively. The sweep signal was used as reference at the surface for accumulative attenuation calculation. Considering the signal-to-noise ratio, frequency bands from 20Hz to 120 Hz for P-wave and
20Hz to 40 Hz for shear wave were chosen to build the cumulative attenuation curves for average Q value estimation (Figure 2). To avoid unreasonable Q values, the cumulative attenuation curves were smoothed using a 7-point window before calculating average Q values from the surface to each depth. Interval Q-depth structures for P- wave and shear wave were determined from smoothed average Q values. The Qp values are from 20 to 120, and Qs values range from 10 to 80. They are comparable to average Q values determined by Haase and Stewart (2004) using a variety of techniques, which are 67 for the P-wave and 23 for the shear-wave over an interval of 200m to 1200m.
Q values and rock properties
Figure 3: Top, from left to right - Qp, Vp/Vs, Vp, Vs, shale volume, porosity (effective porosity in blue, density porosity in red and neutron density in green), and P-wave impedance. The bottom plots are for the S wave (the far right frame is shear-wave impedance). Well log data were smoothed using a 15m window.
From the cumulative attenuation curve in Figure 2, we see that the values gradually increase with depth from 400m to
Seismic attenuation and rock properties
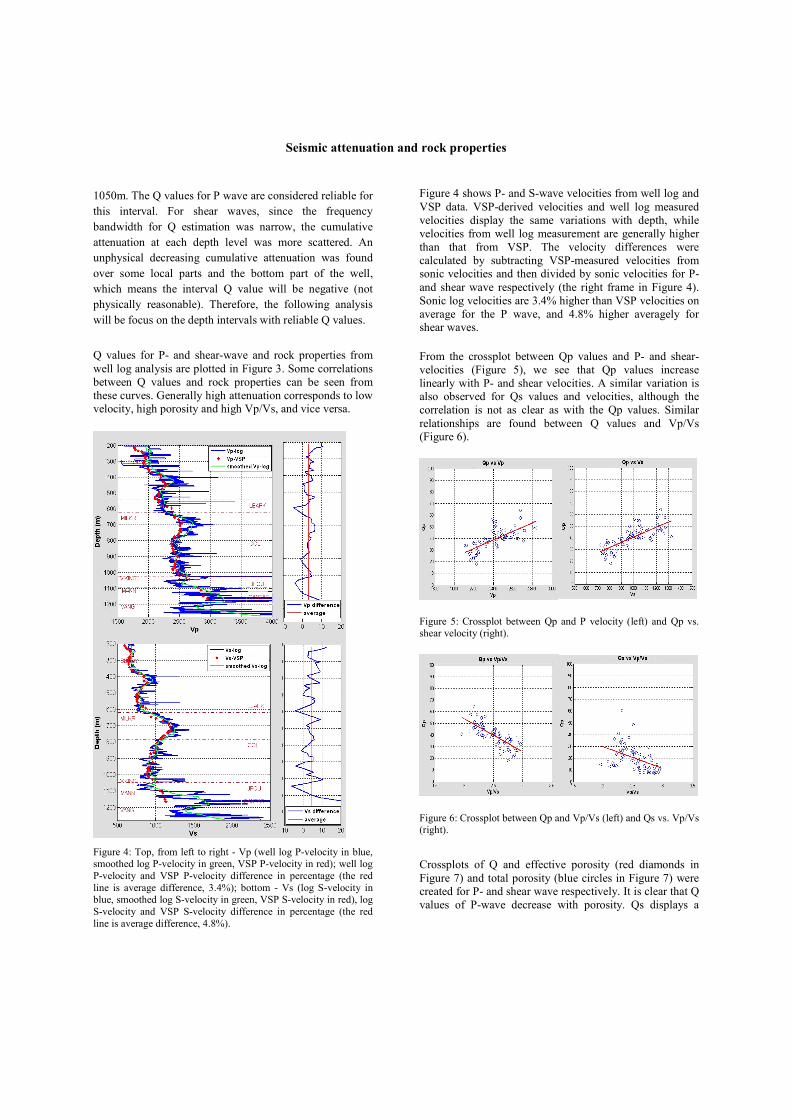
1050m. The Q values for P wave are considered reliable for this interval. For shear waves, since the frequency bandwidth for Q estimation was narrow, the cumulative attenuation at each depth level was more scattered. An unphysical decreasing cumulative attenuation was found over some local parts and the bottom part of the well, which means the interval Q value will be negative (not physically reasonable). Therefore, the following analysis will be focus on the depth intervals with reliable Q values.
Q values for P- and shear-wave and rock properties from well log analysis are plotted in Figure 3. Some correlations between Q values and rock properties can be seen from these curves. Generally high attenuation corresponds to low velocity, high porosity and high Vp/Vs, and vice versa.
Figure 4: Top, from left to right - Vp (well log P-velocity in blue, smoothed log P-velocity in green, VSP P-velocity in red); well log P-velocity and VSP P-velocity difference in percentage (the red line is average difference, 3.4%); bottom - Vs (log S-velocity in blue, smoothed log S-velocity in green, VSP S-velocity in red), log S-velocity and VSP S-velocity difference in percentage (the red line is average difference, 4.8%).
Figure 4 shows P- and S-wave velocities from well log and VSP data. VSP-derived velocities and well log measured velocities display the same variations with depth, while velocities from well log measurement are generally higher than that from VSP. The velocity differences were calculated by subtracting VSP-measured velocities from sonic velocities and then divided by sonic velocities for P- and shear wave respectively (the right frame in Figure 4). Sonic log velocities are 3.4% higher than VSP velocities on average for the P wave, and 4.8% higher averagely for shear waves.
From the crossplot between Qp values and P- and shear-velocities (Figure 5), we see that Qp values increase linearly with P- and shear velocities. A similar variation is also observed for Qs values and velocities, although the correlation is not as clear as with the Qp values. Similar relationships are found between Q values and Vp/Vs (Figure 6).
Figure 5: Crossplot between Qp and P velocity (left) and Qp vs. shear velocity (right).
Figure 6: Crossplot between Qp and Vp/Vs (left) and Qs vs. Vp/Vs (right).
Crossplots of Q and effective porosity (red diamonds in Figure 7) and total porosity (blue circles in Figure 7) were created for P- and shear wave respectively. It is clear that Q values of P-wave decrease with porosity. Qs displays a
Seismic attenuation and rock properties
similar variation, however the trend is not as strong as with Qp. Qp might be influenced more by fluids in the rock.
Figure 7: Crossplot between Qp and porosity (left, effective porosity in red; total porosity in blue) and Qs vs. porosity (right).
From the crossplot between Q value and shale volume (Figure 8), the maximum P-wave attenuation was found in sandy shale. The attenuation of the P wave was less in clean sand and shale. However, it is often observed that Vp/Vs increases with shale volume. This is not obvious in our current case. It is possible that there is an interaction between mobile water in the pores and clay-bound water which could generates attenuation of the P wave. To investigate this idea, a crossplot between Q values and clay-bound water was also created (Figure 9). Neutron porosity responds to the total water volume in the rock, which includes clay-bound water and free water. Thus, the clay-bound water volume was estimated from the difference between neutron porosity and effective porosity and normalized by neutron porosity. When the water is 100% free or bound to clay, the attenuation seems small. When part of the water is free and the other is bound to clay, a larger attenuation seems to be measured. For the shear wave, a similar relation can also be observed, although less distinct. The S-wave might not mobilize the free water as much.
Figure 8: Crossplot between Qp and shale volume (left), and Qs vs. shale volume (right).
Figure 9: Crossplot between Qp and clay-bound water (left), and Qs vs. clay-bound water (right).
Conclusions
Well 11-25-13-17W3 from the Ross Lake heavy oilfield was selected for the analysis of relationship between seismic data attenuation and rock properties. Well log analysis indicates the studied depth interval is mainly shale and shaly sandstone. An interesting correlation between the seismic Q values and rock properties was found over a reliable Q estimation interval. Generally, increasing P- and S-velocities accompany a decreasing attenuation of P- and S-waves. Greater pore space in the rock and higher Vp/Vs coincide with low Qp and Qs values. The crossplot between Qp and clay bound water indicates more attenuation of shaly sandstone possibly related to the interaction between mobile water and clay-bound water.
Acknowledgements
The authors would like to thank Husky Energy Inc. for supporting the work in this study. We appreciate GEDCO, and in particular Andreas Cordsen, Mike Galbraith and Rick Kuzmiski for providing us with the VISTA software package. Many thanks to the CREWES sponsors for their continuing financial support.