Page 1
Malaysian Journal of Civil Engineering 24(2):118-147 (2012)
All rights reserved. No part of contents of this paper may be reproduced or transmitted in any form or by any means
without the written permission of Faculty of Civil Engineering, Universiti Teknologi Malaysia
SEISMIC BEHAVIOUR OF 4-LEGGED SELF-SUPPORTING
TELECOMMUNICATION TOWERS CONSIDERING EARTHQUAKE
EFFECTS IN MALAYSIA
Zawiyah Abdul Razak1*,
Arham Abdullah
1, Azlan Adnan
1, Behzad
Bayat1, Mohammad Reza Vafaei
1, Zubair Khalil
2
1Faculty of Civil Engineering, Universiti Teknologi Malaysia, 81310 Skudai, Malaysia
2Faculty of Mechanical Engineering & Systems, Gifu University, 1-1,Yanagido, Gifu, 501-1193,
Japan.
*Corresponding Author: [email protected]
Abstract: Malaysia’s strategic location has spared it from major seismic activities. Nevertheless,
plethora of far field tremors resulting from earthquakes in neighboring countries can be felt
locally despite the fact that the epicenters of these earthquakes are mostly hundreds of kilometers
away. With increasing frequency and intensity of late, this scenario has raised a major concern
pertaining to the ability of the existing buildings and sensitive structures in the country to
withstand earthquakes events in the future. Considering that no specific study has been
contemplated with particular regards to the effect of earthquakes to telecommunications facilities
in Malaysia, it is requisitely of prime significance to commence this study. The main objective of
the study is to determine the seismic behavior and then evaluate the structural integrity of the
existing telecommunication tower structures considering earthquake effects in Malaysia. The
study covers the analysis of the four (4) legged self supporting steel telecommunication towers
based on different types of seismic zones, peak ground accelerations (PGAs), and soils, using the
SAP2000 finite element software, model development with reference to the International
Building Code (IBC2000) and Euro Standards (EC8). Among the main components of the study
are; data analysis, site visits, model development, analysis and structural evaluation. Linear
static analysis involving joints displacement and base shear reactions with axial forces analysis
are being carried out. In the end, the study has able to determine the seismic behavior
experienced by the modeled towers on the differing type’s conditions exposed on them. With the
results it will enable the researcher to further proceed with the study including developing a
complete maintenance assessment system which also includes the justification/determination of
the types of damages inflicted to the towers as well as the severity of the damages.
Keywords: Structural Integrity Telecommunication Towers, Earthquake Effects, Peak Ground
Acceleration.
Page 2
Malaysian Journal of Civil Engineering 24(2):118-147 (2012) 119
1.0 Introduction
Telecommunication towers are categorised among the tallest man-made structures and
can be found standing high on every parts of the globe with different heights and
purposes. Communication needs during disaster are unique and critical. It becomes
more crucial when disaster such as flood, typhoon, hurricane and earthquake events
happened. In a major emergency caused by an earthquake it is likely that telephone
lines may be down, other alarm and telecommunications facilities are adversely affected,
and a vast increase in the work load imposed upon personnel and equipment in the
control center. One distinguishing characteristics is the dramatic increase in the number
of people who must make use and communicate among them. The malfunction of the
communication facilities immediately after an earthquake that happens in other
countries should be a lesson learned especially for telecommunication service providers.
Malaysia is situated on the southern edge of the Eurasian plate within the most two
seismically active plate boundaries. Several possible active faults have been delineated
and local earthquakes in the country appear to be related to some of them. Due to its
strategic location, Malaysia is generally spared from any major active seismic activities.
However, when earthquakes occur in neighboring countries, the effects can be felt
locally. After the 2004 tsunami disaster that strikes Aceh, the government has taken
early initiatives to look into the impact of earthquake events originating from our
neighbours. Important buildings and sensitive structures such as telecommunication
towers are among the most crucial to be looked upon. These specifically light and
slender structures are particularly sensitive to the environmental loads to which they are
subjected but also to ground movements. With the divergence of the high speed broad
band projects initiated by the Malaysian government in mid 2008, more
telecommunication towers are being and will be erected to cater for the country needs.
Therefore the preservation of serviceable communication infrastructure as critical links
of communication or post disaster networks is essential in the event of an earthquake
disaster.
In this paper the effects of seismic behaviour acting on the 4-legged self-supporting steel
towers have been studied based on detailed linear static analyses of six existing
telecommunication towers.
2.0 Background
The safety issue of building structures including sensitive structures in Malaysia has
always been of public concern and has been highlighted after the 2004 earthquake which
triggered tsunami that caused a number of fatalities. The country too experienced direct
impact by seismic waves emanating from earthquakes in Sumatra. As was mentioned in
the Position Paper report (IEM, 2005) a seismic hazard assessment has been carried out
Page 3
120 Malaysian Journal of Civil Engineering 24(2):118-147 (2012)
in the country in 2004. The outcome indicates that a PGA of 50 gals (for 500 years
return period) has been determined for ‘before Aceh’s event’ and PGA value of 100 gals
has been ascertained for ‘after Aceh’s event’. It was also noted that the earthquake
characteristic that has affected the structures here was of that with a long period of
vibration. Preliminary study carried out by Adnan et al. (2006) on soil samples of five
cities in the West coast of Peninsular Malaysia has shown that the average local soil
amplification ranges from 1.4 to 3.6. Since the soil condition in many parts of the
country is underlain of limestone bedrock the study implies that the local soil effect
could not be neglected. Incident of sinkholes in ex-mining area with loose sand and
tailings have occurred (Komoo, 2005). The geological predisposition was ‘ripe’ for the
popping-up of sinkholes, and the earthquake tremor provided the ‘triggering’ factor.
Reports produced by the Japan Society of Civil Engineers (JSCE, 1995) stated that the
main cause of damage to structures observed during the Great Hanshin earthquake on
January 17, 1995 is due to their response to ground motions which are the loadings at
the base. According to JSCE in order to evaluate the behavior of the structure under this
type of loading condition, the principles of structural dynamics must be applied to
determine the stresses and deflections, which are developed in the structure. Along with
JSCE, the reports produced by the National Institute of Standards and Technology
declared the same conclusion on damage caused by earthquake (NIST, 1995). From the
past earthquakes events in year 2007 and 2009 that happen in neighboring countries,
some buildings already experienced defects such as cracks. Though it is still considered
not a major one for Malaysia, it is utmost important to perform a pre-earthquake
assessment to evaluate their behavior under earthquake loads due to seismic ground
motion. Could the existing structure in the country be able to withstand the tremor?
This has been an unanswered question till today. According to Luin (2008), as for the
ability of local structures in Malaysia to withstand such tremors, the effects would be
minimal for low-rise building structures (up to four or five storeys), whereas for the
inhabitants’ of high-rise buildings (up to 7 storeys and above), they may feel sideways
movements of the structure in response to the tremors. Generally, these buildings would
still be structurally sound.
McClure (1999) quoted a survey of the earthquake performance of communication
structures that summarised documented reports of 16 instances of structural damage
related to seven important earthquakes between 1949 and 1998, none of which were a
direct threat to life safety. However, several towers may have been damaged or have
become unserviceable without having collapsed or suffered damage visible from the
ground during post earthquake inspections. Many strong earthquakes have happened
since then and more damage has been reported as more telecommunication equipment is
deployed worldwide. Indonesia, the country that lies in the Ring of Fire area has
witnessed many of its telecommunication towers failed during earthquakes events. As
mentioned by Smith (2007) the 1995 Kobe earthquake is a good example where
communication facilities malfunction has given a big impact. This event was said to
Page 4
Malaysian Journal of Civil Engineering 24(2):118-147 (2012) 121
have prevented local governments from knowing the level and the scope of casualties
caused by the disaster. According to Faridafshin et al. (2008) the preservation of
serviceable communication infrastructure as critical links of communication or post
disaster networks is essential in the event of an earthquake. According to Bai et al.
(2010) numerical results indicate that seismic responses of transmission towers and
power lines are amplified when considering the local site effect. This makes no
difference for telecommunication towers to have experienced the same. In the 2011
Fukushima earthquake, communications were badly broken and knocked out where
many residents are relying on the small number of surviving pay phones.
In the human society today the telecommunication structure are fundamental
components of communication and post-disaster networks and their preservation in the
case of not only a severe earthquake but also to locations experiencing the far fields’
effect is essential. Telecommunication towers are typically tall structures whose
function is to support elevated antennas for radio and television broadcasting,
telecommunication and two-way radio systems. Therefore, immediate serviceability or
even continuous function of first-aid-station infrastructure is of critically high priority in
the case of a disaster. Because of their unique geometry, telecommunication towers are
categorised as slender-tall multi-support structures. Due to that, they are intrinsically
more sensitive to some physical characteristics of earthquakes which are ignored in
seismic analysis of common self-supporting structures like buildings. In particular, the
effect of the spatial variation of the excitation at ground support is one aspect which
deserves attention. Amiri et.al (2004) confirmed that due to their vital role, the
preservation of these telecommunication structures during natural disaster such as an
earthquake is of utmost priority and hence their seismic performance should be properly
evaluated.
Previous work performed by researches on transmission and telecommunication towers
structures has proven that ground motion due to seismic waves do contribute some
effects on these structures. The seismic behavior and response of telecommunication
towers is very different from any building structures. In areas prone to earthquakes, the
main issue for strategic telecommunication towers is their functionality during or
immediately after an earthquake.
Early study by Konno et. al (1973) who performed on instrumented tower owned by
Nippon Telegraph and Telecom (NTT) and mounted it on a building rooftop during the
1968 Off Tokaichi Earthquake, Japan. It was one of the first studies on the effects of
earthquake loads on the lattice telecommunication towers. The objective of their studies
was to obtain the mode shapes, the natural frequencies and the damping properties of
such structures. It was observed that in some of the members the forces due to
earthquake were greater than those of the wind. Later, their data were analysed and
studied by Sato et. al (1984) on the input seismic force to be used for the design of
appendages, particularly telecommunication towers and found that a maximum
Page 5
122 Malaysian Journal of Civil Engineering 24(2):118-147 (2012)
acceleration amplification of 4 at the rooftop was appropriate. Later Hiramatsu et. al
(1989) reported the continuation of this investigation of the seismic response and in
general their results also agreed with the earlier observations of Sato et al. A seismic
response spectrum method for the analysis of secondary systems while considering the
dynamic interactions between the primary and secondary structures was developed by
Kanazawa et. al (2000). To evaluate their proposed method, they performed time-history
analyses on a building-tower model consisting of a tower mounted on a single degree of
freedom primary system.
Mikus (1994) performed the seismic response of six 3-legged self supporting
telecommunication towers with heights ranges from 20 to 90 meters. The selected
towers were numerically simulated as bare towers. In the analysis three accelerograms
were considered as the real earthquake forces. He concluded that the lowest four modes
of vibration would ascertain the sufficient precision. In addition also, he pointed out that
the vertical component of earthquake-induced forces had no effects on the results.
Galvez and McClure (1995) performed additional studies to introduce simplifying
methods for the seismic analysis of telecommunication towers. They used 45 earthquake
records and investigated on three different numerical models of 3 legged lattice steel
towers with heights ranges from 90 to 121 meters. It was concluded that contribution of
second and third transversal modes of vibration on the maximum acceleration at the top
of the towers, depending on the tower type varies from 15% to 50%. The main
disadvantage of Galvez and McClure method was the bilinear shape of the acceleration
profile, which did not thoroughly include towers with different geometries. A modified
method for the horizontal acceleration profile later was introduced by Khedr et al (1999)
where for every specified tower a separate acceleration profile being obtained. Amiri
(1997) performed work on seismic sensitivity on tall guyed telecommunication towers.
The objective of his work is to propose some seismic sensitivity indicators for tall guyed
masts which would help tower designers decide whether seismic effects are important
and whether detailed dynamic analysis of the structure is required. The indicators
proposed relate to the maximum base shear and the dynamic component of the axial
force in the mast and guy cable tensions. Work done by Faridafshin et. al (2008) with
computational modeling of the dynamic response of tall guyed masts under seismic
loads has shown that different earthquakes records with diverse scenarios of motion may
produce quite different responses in the towers. Also the towers showed sensitivity to
asynchronous shaking of their ground supports. Besides that they also confirmed as the
towers become taller, the sensitivity to asynchronous shaking is initiated on a stiffer soil.
Sackmann (1996) like most of other researchers have performed studies to obtain the
fundamental frequencies of self supporting towers. In most of these studies especially in
the field of seismic effects the researchers were focused on the 3 legged towers and few
studies have been conducted on the 4 legged type towers. Due to the lacking of design
provisions in codes for telecommunication tower structures, Amiri et al. (2007) has
performed linear dynamic analysis for several towers in Iran to obtain the earthquake
Page 6
Malaysian Journal of Civil Engineering 24(2):118-147 (2012) 123
amplification factors for 4 legged self supporting towers. Assi et al. (2007) stated that
in an unpublished report by Shiff (1999) from a survey conducted on earthquake
performance of telecommunication towers it was concluded that tall broadcast towers
and large building-supported microwave towers are the most vulnerable to earthquakes
although none of these towers has been a direct threat to life safety during any event.
There are several codes or guidelines being used globally for these towers. Modern
codes and standards such as International Code Council (ICC) 2000, National Research
Council Canada (NRCC) 2005, ANSI/Electronic Industry Association (EIA)/
Telecommunication Industry Association (TIA) 2005 have recently addressed the
seismic analysis of telecommunication towers on building rooftops by either proposing a
simplified method for the estimation of seismic base shear forces. The TIA/EIA-222-G
is aimed at the communication industry and has been developed by the
Telecommunication Industry Association in association with the Electronic Industry
Association to provide minimum criteria for specifying and designing steel towers and
antennae support structures. This standard applies to all classes of communication
service such as: AM CATV, FM, Microwave, Cellular, TV, UHF, VHR etc. It is a
recognised standard by the major building codes (UBC and IBC) and therefore can
typically be used in most jurisdictions. The wind loads resulting from the antennae and
support platforms are due to their relatively large, concentrated areas. Due to the nature
of the equipment, the overall deflection, twist and sway of the structure are a concern.
Many antennae especially microwave dishes, operate on a line of sight principal with
very narrow beam widths. A relatively small deflection of the tower can seriously
degrade or interrupt the performance of the communication system.
3.0 Scope of Research
In this study the focus had been narrowed down to only on structural related issues for
assessment on four legged self-supporting steel towers. Six (6) steel telecommunication
towers of different height categories have been selected for this purpose. The research
work includes investigating, accessing, analysing and evaluating, including modeling
the selected towers located in various seismic zones in the country. The categories of
towers are tabulated in Table 1.
Page 7
124 Malaysian Journal of Civil Engineering 24(2):118-147 (2012)
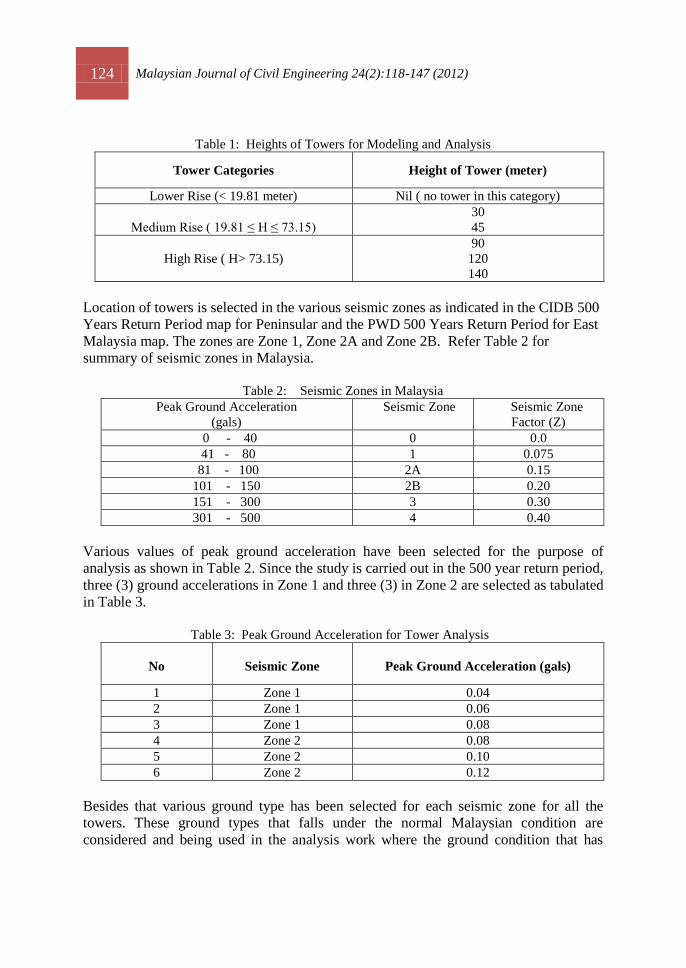
Table 1: Heights of Towers for Modeling and Analysis
Tower Categories Height of Tower (meter)
Lower Rise (< 19.81 meter) Nil ( no tower in this category)
Medium Rise ( 19.81 ≤ H ≤ 73.15)
30
45
High Rise ( H> 73.15)
90
120
140
Location of towers is selected in the various seismic zones as indicated in the CIDB 500
Years Return Period map for Peninsular and the PWD 500 Years Return Period for East
Malaysia map. The zones are Zone 1, Zone 2A and Zone 2B. Refer Table 2 for
summary of seismic zones in Malaysia.
Table 2: Seismic Zones in Malaysia
Peak Ground Acceleration
(gals)
Seismic Zone Seismic Zone
Factor (Z)
0 - 40 0 0.0
41 - 80 1 0.075
81 - 100 2A 0.15
101 - 150 2B 0.20
151 - 300 3 0.30
301 - 500 4 0.40
Various values of peak ground acceleration have been selected for the purpose of
analysis as shown in Table 2. Since the study is carried out in the 500 year return period,
three (3) ground accelerations in Zone 1 and three (3) in Zone 2 are selected as tabulated
in Table 3.
Table 3: Peak Ground Acceleration for Tower Analysis
No
Seismic Zone
Peak Ground Acceleration (gals)
1 Zone 1 0.04
2 Zone 1 0.06
3 Zone 1 0.08
4 Zone 2 0.08
5 Zone 2 0.10
6 Zone 2 0.12
Besides that various ground type has been selected for each seismic zone for all the
towers. These ground types that falls under the normal Malaysian condition are
considered and being used in the analysis work where the ground condition that has
Page 8
Malaysian Journal of Civil Engineering 24(2):118-147 (2012) 125
been applied in Euro Standards (EC8) and International Building Code (IBC) are
referred. The ground types are ground Type A, B, C and D. For this study, two numbers
of 4 legged self supporting steel tower from medium rise category and 4 numbers from
high rise category are selected. In total there are be six (6) numbers of towers in the
respective category to be modeled in four (4) types of ground conditions and analysed
on the different seismic zones.
3.1 Results of Analyses
Analysis that has been done on the selected towers is using two types of codes, namely
IBC and EC8. Analysis involving Joint Displacements and Base Shear has been carried
out for all the modeled towers. Axial forces experienced by the structures too have been
obtained. There are two zones involved i.e. Zone 1 and Zone 2, while four ground types
involved i.e. ground type A, type B, type C and type D. For zone 1 there are three types
of peak ground acceleration being adopted, namely 0.04 gals, 0.06gals and 0.08 gals.
For zone 2, also three types of peak ground acceleration are used for the analysis on all
the ground types; namely 0.08gals, 0.10 gals and 0.12 gals. Results for all the tower
analysis are described in the following paragraphs.
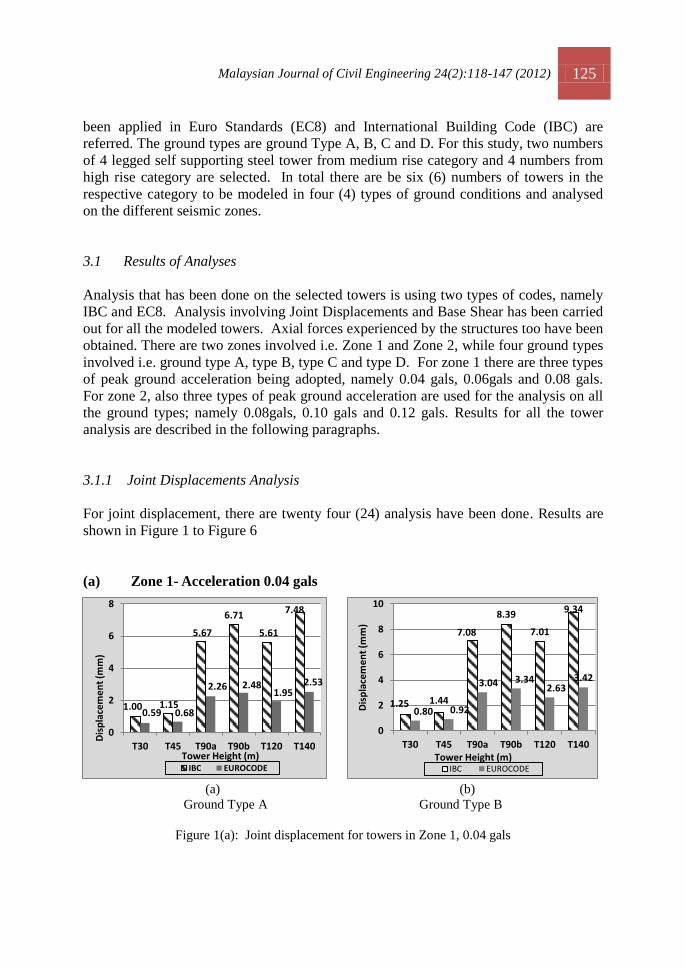
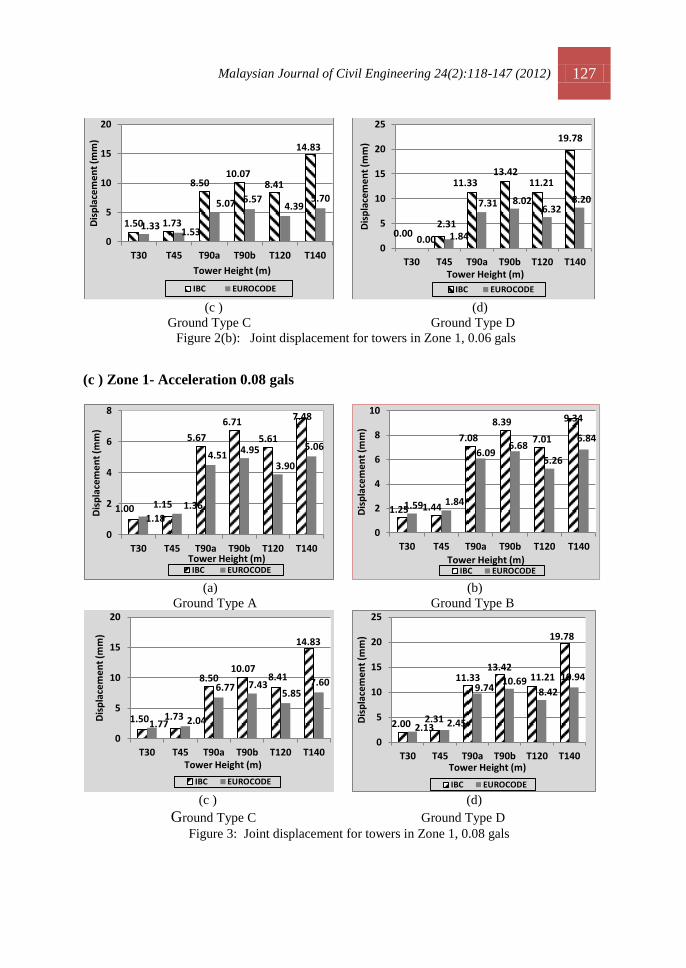
3.1.1 Joint Displacements Analysis
For joint displacement, there are twenty four (24) analysis have been done. Results are
shown in Figure 1 to Figure 6
(a) Zone 1- Acceleration 0.04 gals
(a) (b)
Ground Type A Ground Type B
Figure 1(a): Joint displacement for towers in Zone 1, 0.04 gals
1.00 1.15
5.67
6.71
5.61
7.48
0.59 0.68
2.26 2.48 1.95
2.53
0
2
4
6
8
T30 T45 T90a T90b T120 T140
Dis
pla
cem
en
t (m
m)
Tower Height (m) IBC EUROCODE
1.25 1.44
7.08
8.39
7.01
9.34
0.80 0.92
3.04 3.34 2.63
3.42
0
2
4
6
8
10
T30 T45 T90a T90b T120 T140
Dis
pla
cem
en
t (m
m)
Tower Height (m) IBC EUROCODE
Page 9
126 Malaysian Journal of Civil Engineering 24(2):118-147 (2012)
(c ) (d)
Ground Type C Ground Type D
Figure 1(b): Joint displacement for towers in Zone 1, 0.04 gals
(b) Zone 1- Acceleration 0.06 gals
(a) (b)
Ground Type A Ground Type B
Figure 2(a): Joint displacement for towers in Zone 1, 0.06 gals
1.50 1.73
8.50 10.07
8.41
14.83
0.89 1.02
3.38 3.71 2.92 3.80
0
5
10
15
20
T30 T45 T90a T90b T120 T140
Dis
pla
cem
en
t (m
m)
Tower Height (m)
IBC EUROCODE
2.00 2.31
11.33 13.42
11.21
19.78
1.06 1.23
4.87 5.35 4.21
5.47
0
5
10
15
20
25
T30 T45 T90a T90b T120 T140
Dis
pla
cem
en
t (m
m)
Tower Height (m)
IBC EUROCODE
1.00 1.15
5.67
6.71
5.61
7.48
0.89 1.02
3.38 3.71 2.92
3.80
0
2
4
6
8
T30 T45 T90a T90b T120 T140
Dis
pla
cem
en
t (m
m)
Tower Height (m) IBC EUROCODE
1.25 1.44
7.08
8.39
7.01
9.34
1.20 1.38
4.57 5.01
3.95
5.13
0
2
4
6
8
10
T30 T45 T90a T90b T120 T140
Dis
pla
cem
en
t (m
m)
Tower Height (m)
IBC EUROCODE
Page 10
Malaysian Journal of Civil Engineering 24(2):118-147 (2012) 127
(c ) (d)
Ground Type C Ground Type D
Figure 2(b): Joint displacement for towers in Zone 1, 0.06 gals
(c ) Zone 1- Acceleration 0.08 gals
(a) (b)
Ground Type A Ground Type B
(c ) (d)
Ground Type C Ground Type D
Figure 3: Joint displacement for towers in Zone 1, 0.08 gals
1.50 1.73
8.50 10.07
8.41
14.83
1.33 1.53
5.07 5.57 4.39
5.70
0
5
10
15
20
T30 T45 T90a T90b T120 T140
Dis
pla
cem
en
t (m
m)
Tower Height (m)
IBC EUROCODE
0.00 2.31
11.33 13.42
11.21
19.78
0.00 1.84
7.31 8.02 6.32
8.20
0
5
10
15
20
25
T30 T45 T90a T90b T120 T140
Dis
pla
cem
en
t (m
m)
Tower Height (m)
IBC EUROCODE
1.00 1.15
5.67
6.71
5.61
7.48
1.18 1.36
4.51 4.95
3.90
5.06
0
2
4
6
8
T30 T45 T90a T90b T120 T140
Dis
pla
cem
en
t (m
m)
Tower Height (m) IBC EUROCODE
1.25 1.44
7.08
8.39
7.01
9.34
1.59 1.84
6.09 6.68
5.26
6.84
0
2
4
6
8
10
T30 T45 T90a T90b T120 T140
Dis
pla
cem
en
t (m
m)
Tower Height (m) IBC EUROCODE
1.50 1.73
8.50 10.07
8.41
14.83
1.77 2.04
6.77 7.43 5.85
7.60
0
5
10
15
20
T30 T45 T90a T90b T120 T140
Dis
pla
cem
en
t (m
m)
Tower Height (m)
IBC EUROCODE
2.00 2.31
11.33 13.42
11.21
19.78
2.13 2.45
9.74 10.69
8.42
10.94
0
5
10
15
20
25
T30 T45 T90a T90b T120 T140
Dis
pla
cem
en
t (m
m)
Tower Height (m)
IBC EUROCODE
Page 11
128 Malaysian Journal of Civil Engineering 24(2):118-147 (2012)
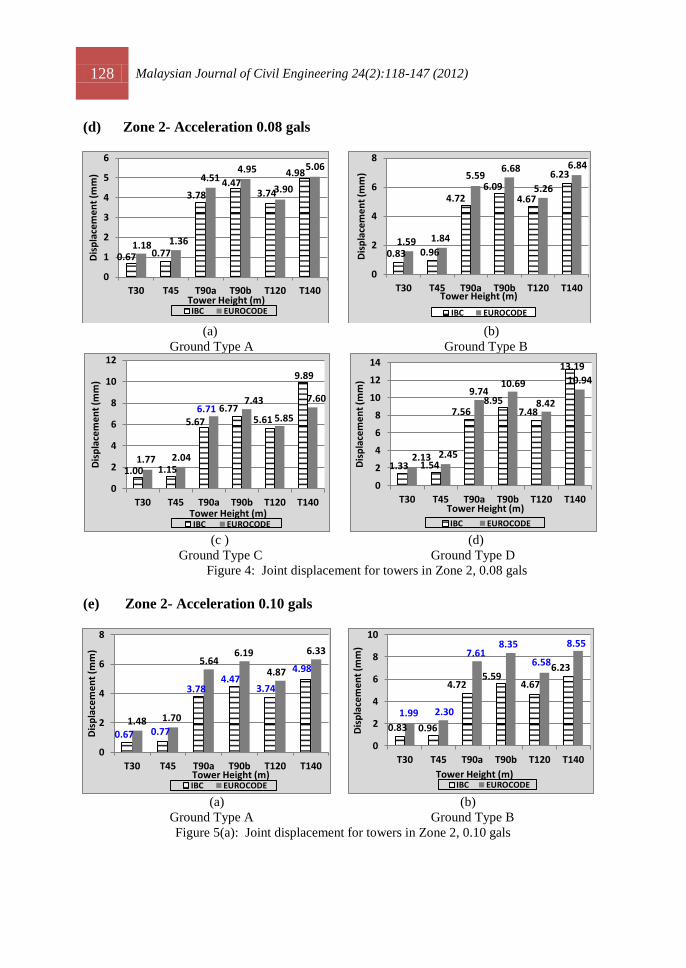
(d) Zone 2- Acceleration 0.08 gals
(a) (b)
Ground Type A Ground Type B
(c ) (d)
Ground Type C Ground Type D Figure 4: Joint displacement for towers in Zone 2, 0.08 gals
(e) Zone 2- Acceleration 0.10 gals
(a) (b)
Ground Type A Ground Type B
Figure 5(a): Joint displacement for towers in Zone 2, 0.10 gals
0.67 0.77
3.78 4.47
3.74
4.98
1.18 1.36
4.51 4.95
3.90
5.06
0
1
2
3
4
5
6
T30 T45 T90a T90b T120 T140
Dis
pla
cem
en
t (m
m)
Tower Height (m) IBC EUROCODE
0.83 0.96
4.72
5.59
4.67
6.23
1.59 1.84
6.09
6.68
5.26
6.84
0
2
4
6
8
T30 T45 T90a T90b T120 T140
Dis
pla
cem
en
t (m
m)
Tower Height (m)
IBC EUROCODE
1.00 1.15
5.67 6.71
5.61
9.89
1.77 2.04
6.77 7.43
5.85
7.60
0
2
4
6
8
10
12
T30 T45 T90a T90b T120 T140
Dis
pla
cem
en
t (m
m)
Tower Height (m) IBC EUROCODE
1.33 1.54
7.56 8.95
7.48
13.19
2.13 2.45
9.74 10.69
8.42
10.94
0
2
4
6
8
10
12
14
T30 T45 T90a T90b T120 T140
Dis
pla
cem
en
t (m
m)
Tower Height (m)
IBC EUROCODE
0.67 0.77
3.78 4.47
3.74
4.98
1.48 1.70
5.64 6.19
4.87
6.33
0
2
4
6
8
T30 T45 T90a T90b T120 T140
Dis
pla
cem
en
t (m
m)
Tower Height (m) IBC EUROCODE
0.83 0.96
4.72 5.59
4.67
6.23
1.99 2.30
7.61 8.35
6.58
8.55
0
2
4
6
8
10
T30 T45 T90a T90b T120 T140
Dis
pla
cem
en
t (m
m)
Tower Height (m) IBC EUROCODE
Page 12
Malaysian Journal of Civil Engineering 24(2):118-147 (2012) 129
(c ) (d)
Ground Type C Ground Type D
Figure 5(b): Joint displacement for towers in Zone 2, 0.10 gals
(f) Zone 2- Acceleration 0.12 gals
(a) (b)
Ground Type A Ground Type B
(c ) (d)
Ground Type C Ground Type D Figure 6: Joint displacement for towers in Zone 2, 0.12 gals
1.00 1.15
5.67 6.71
5.61
9.89
2.21 2.55
8.46 9.28
7.31
9.49
0
2
4
6
8
10
12
T30 T45 T90a T90b T120 T140
Dis
pla
cem
en
t (m
m)
Tower Height (m)
IBC EUROCODE
1.33 1.54
7.56 8.95
7.48
13.19
2.66 3.06
12.18 13.37
10.53
13.67
0
5
10
15
T30 T45 T90a T90b T120 T140
Dis
pla
cem
en
t (m
m)
Tower Height (m) IBC EUROCODE
0.67 0.77
3.78 4.47
3.74
4.98
1.77 2.04
6.77 7.43 7.31 7.60
0
2
4
6
8
T30 T45 T90a T90b T120 T140
Dis
pla
cem
en
t (m
m)
Tower Height (m)
IBC EUROCODE
0.83 0.96
4.72 5.59
4.67
6.23
2.39 2.76
9.13 10.03
7.90
10.25
0
2
4
6
8
10
12
T30 T45 T90a T90b T120 T140
Dis
pla
cem
en
t (m
m)
Tower Height (m) IBC EUROCODE
1.00 1.15
5.67 6.71
5.61
9.89
2.66 3.06
10.15 11.14
8.77
11.39
0
2
4
6
8
10
12
T30 T45 T90a T90b T120 T140
Dis
pla
cem
en
t (m
m)
Tower Height (m) IBC EUROCODE
1.33 1.54
7.56 8.95
7.48
13.19
3.19 3.68
14.62 16.04
12.63
16.41
0
5
10
15
20
T30 T45 T90a T90b T120 T140
Dis
pla
cem
en
t (m
m)
Tower Height (m) IBC EUROCODE
Page 13
130 Malaysian Journal of Civil Engineering 24(2):118-147 (2012)
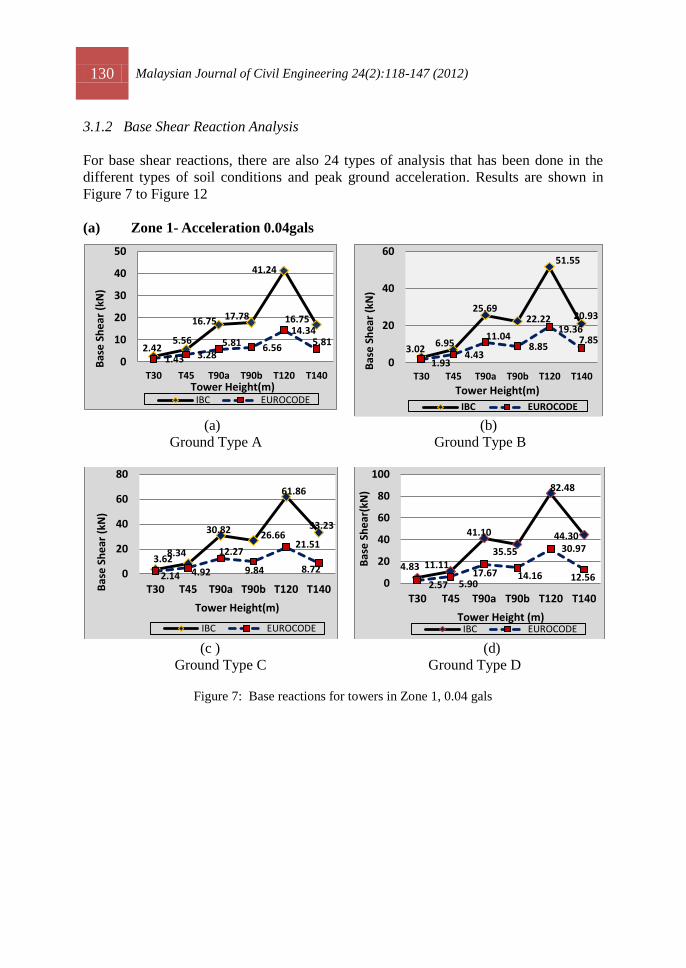
3.1.2 Base Shear Reaction Analysis
For base shear reactions, there are also 24 types of analysis that has been done in the
different types of soil conditions and peak ground acceleration. Results are shown in
Figure 7 to Figure 12
(a) Zone 1- Acceleration 0.04gals
(a) (b)
Ground Type A Ground Type B
(c ) (d)
Ground Type C Ground Type D
Figure 7: Base reactions for towers in Zone 1, 0.04 gals
2.42 5.56
16.75 17.78
41.24
16.75
1.43 3.28 5.81 6.56
14.34 5.81
0
10
20
30
40
50
T30 T45 T90a T90b T120 T140
Bas
e S
he
ar (
kN)
Tower Height(m) IBC EUROCODE
3.02 6.95
25.69 22.22
51.55
20.93
1.93 4.43
11.04 8.85
19.36 7.85
0
20
40
60
T30 T45 T90a T90b T120 T140B
ase
Sh
ear
(kN
)
Tower Height(m)
IBC EUROCODE
3.62 8.34
30.82 26.66
61.86
33.23
2.14 4.92
12.27
9.84
21.51
8.72 0
20
40
60
80
T30 T45 T90a T90b T120 T140Bas
e S
he
ar (
kN)
Tower Height(m)
IBC EUROCODE
4.83 11.11
41.10
35.55
82.48
44.30
2.57 5.90 17.67 14.16
30.97
12.56 0
20
40
60
80
100
T30 T45 T90a T90b T120 T140
Bas
e S
he
ar(k
N)
Tower Height (m) IBC EUROCODE
Page 14
Malaysian Journal of Civil Engineering 24(2):118-147 (2012) 131
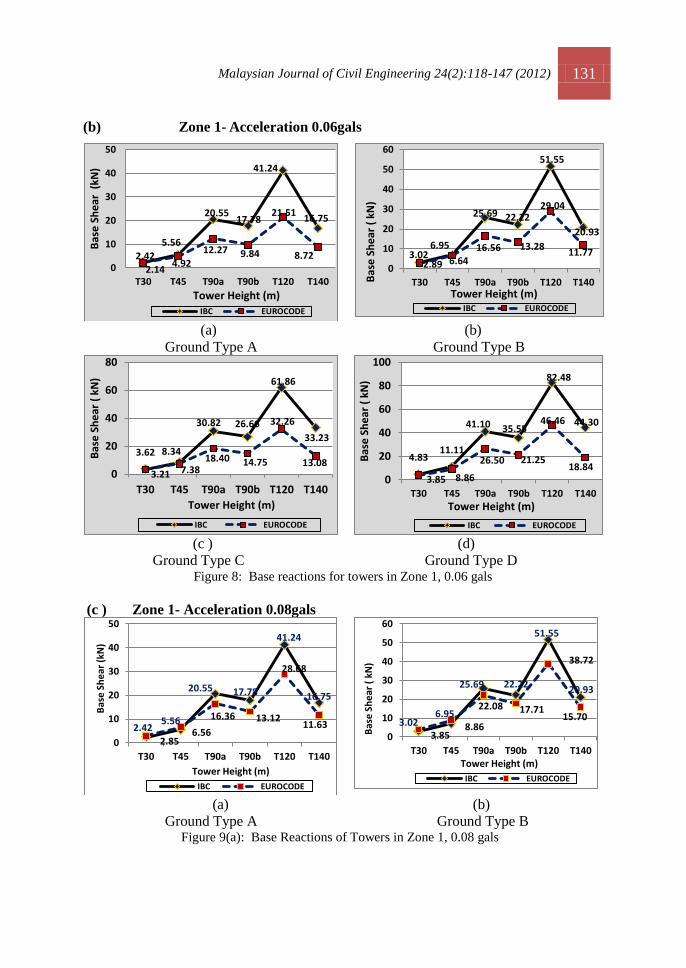
(b) Zone 1- Acceleration 0.06gals
(a) (b)
Ground Type A Ground Type B
(c ) (d)
Ground Type C Ground Type D Figure 8: Base reactions for towers in Zone 1, 0.06 gals
(c ) Zone 1- Acceleration 0.08gals
(a) (b)
Ground Type A Ground Type B Figure 9(a): Base Reactions of Towers in Zone 1, 0.08 gals
2.42
5.56
20.55 17.78
41.24
16.75
2.14 4.92
12.27 9.84
21.51
8.72 0
10
20
30
40
50
T30 T45 T90a T90b T120 T140
Bas
e S
he
ar (
kN)
Tower Height (m) IBC EUROCODE
3.02 6.95
25.69 22.22
51.55
20.93
2.89 6.64 16.56 13.28
29.04
11.77
0
10
20
30
40
50
60
T30 T45 T90a T90b T120 T140Bas
e S
he
ar (
kN
)
Tower Height (m) IBC EUROCODE
3.62 8.34
30.82 26.66
61.86
33.23
3.21 7.38 18.40 14.75
32.26
13.08 0
20
40
60
80
T30 T45 T90a T90b T120 T140
Bas
e S
he
ar (
kN
)
Tower Height (m)
IBC EUROCODE
4.83 11.11
41.10 35.55
82.48
44.30
3.85 8.86
26.50 21.25
46.46
18.84 0
20
40
60
80
100
T30 T45 T90a T90b T120 T140
Bas
e S
he
ar (
kN
)
Tower Height (m)
IBC EUROCODE
2.42 5.56
20.55 17.78
41.24
16.75
2.85 6.56
16.36 13.12
28.68
11.63
0
10
20
30
40
50
T30 T45 T90a T90b T120 T140
Bas
e S
he
ar (
kN)
Tower Height (m)
IBC EUROCODE
3.02 6.95
25.69 22.22
51.55
20.93
3.85 8.86
22.08 17.71
38.72
15.70
0
10
20
30
40
50
60
T30 T45 T90a T90b T120 T140
Bas
e S
he
ar (
kN
)
Tower Height (m)
IBC EUROCODE
Page 15
132 Malaysian Journal of Civil Engineering 24(2):118-147 (2012)
(c ) (d)
Ground Type C Ground Type D Figure 9(b): Base Reactions of Towers in Zone 1, 0.08 gals
(d) Zone 2- Acceleration 0.08gals
(a) (b)
Ground Type A Ground Type B
(c ) (d)
Ground Type C Ground Type D Figure 10: Base Reactions of Towers in Zone 2, 0.08 gals
3.62 8.34
30.82 26.66
61.86
33.23
4.28 9.84
24.53
19.67
43.02
17.44
0
10
20
30
40
50
60
70
T30 T45 T90a T90b T120 T140
Bas
e S
he
ar (
kN
)
Tower Height (m) IBC EUROCODE
4.83 11.11
41.10 35.55
82.48
44.30
5.13 11.81
35.33 28.33
61.94
25.12
0
20
40
60
80
100
T30 T45 T90a T90b T120 T140
Bas
e S
he
ar (
kN
)
Tower Height (m)
IBC EUROCODE
1.61 3.70
13.70 11.85
27.49
11.16
2.85 6.56
16.36 13.12
28.68
11.63
0
5
10
15
20
25
30
35
T30 T45 T90a T90b T120 T140
Bas
e S
he
ar (
kN
)
Tower Height (metres) IBC EUROCODE
2.01 4.63
17.12 13.95
34.37
13.95 3.85
8.86
22.08 15.70
38.72
15.70
0
10
20
30
40
50
T30 T45 T90a T90b T120 T140
Bas
e S
he
ar (
kN)
Tower Height (metres)
IBC EUROCODE
2.42 5.56
20.55
17.78
41.24
22.15
4.28
9.84
24.53
19.67
43.02
17.44
0
10
20
30
40
50
T30 T45 T90a T90b T120 T140
Bas
e S
he
ar (
kN
)
Tower Height (m) IBC EUROCODE
3.22 7.41
27.40 23.70
54.98
29.53
5.13 11.81
35.33 28.33
61.94
25.12
0
20
40
60
80
T30 T45 T90a T90b T120 T140
Bas
e S
he
ar (
kN
)
Tower Height (m)
IBC EUROCODE
Page 16
Malaysian Journal of Civil Engineering 24(2):118-147 (2012) 133
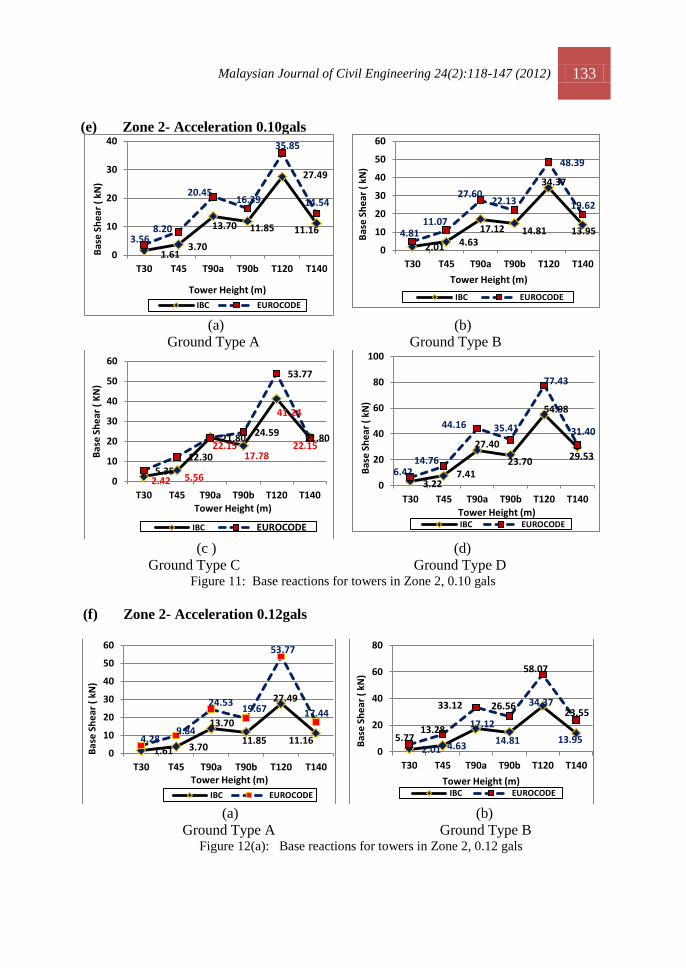
(e) Zone 2- Acceleration 0.10gals
(a) (b)
Ground Type A Ground Type B
(c ) (d)
Ground Type C Ground Type D Figure 11: Base reactions for towers in Zone 2, 0.10 gals
(f) Zone 2- Acceleration 0.12gals
(a) (b)
Ground Type A Ground Type B Figure 12(a): Base reactions for towers in Zone 2, 0.12 gals
1.61 3.70
13.70 11.85
27.49
11.16 3.56
8.20
20.45 16.39
35.85
14.54
0
10
20
30
40
T30 T45 T90a T90b T120 T140
Bas
e S
he
ar (
kN
)
Tower Height (m)
IBC EUROCODE
2.01 4.63 17.12 14.81
34.37
13.95 4.81 11.07
27.60 22.13
48.39
19.62
0
10
20
30
40
50
60
T30 T45 T90a T90b T120 T140
Bas
e S
he
ar (
kN
)
Tower Height (m)
IBC EUROCODE
2.42 5.56
22.15 17.78
41.24
22.15
5.35
12.30
21.80 24.59
53.77
21.80
0
10
20
30
40
50
60
T30 T45 T90a T90b T120 T140
Bas
e S
he
ar (
KN
)
Tower Height (m)
IBC EUROCODE
3.22 7.41
27.40
23.70
54.98
29.53
6.42 14.76
44.16 35.41
77.43
31.40
0
20
40
60
80
100
T30 T45 T90a T90b T120 T140
Bas
e S
he
ar (
kN
)
Tower Height (m) IBC EUROCODE
1.61 3.70
13.70
11.85
27.49
11.16 4.28 9.84
24.53 19.67
53.77
17.44
0
10
20
30
40
50
60
T30 T45 T90a T90b T120 T140
Bas
e S
he
ar (
kN
)
Tower Height (m)
IBC EUROCODE
2.01 4.63
17.12
14.81
34.37
13.95 5.77 13.28
33.12 26.56
58.07
23.55
0
20
40
60
80
T30 T45 T90a T90b T120 T140
Bas
e S
he
ar (
kN
)
Tower Height (m) IBC EUROCODE
Page 17
134 Malaysian Journal of Civil Engineering 24(2):118-147 (2012)
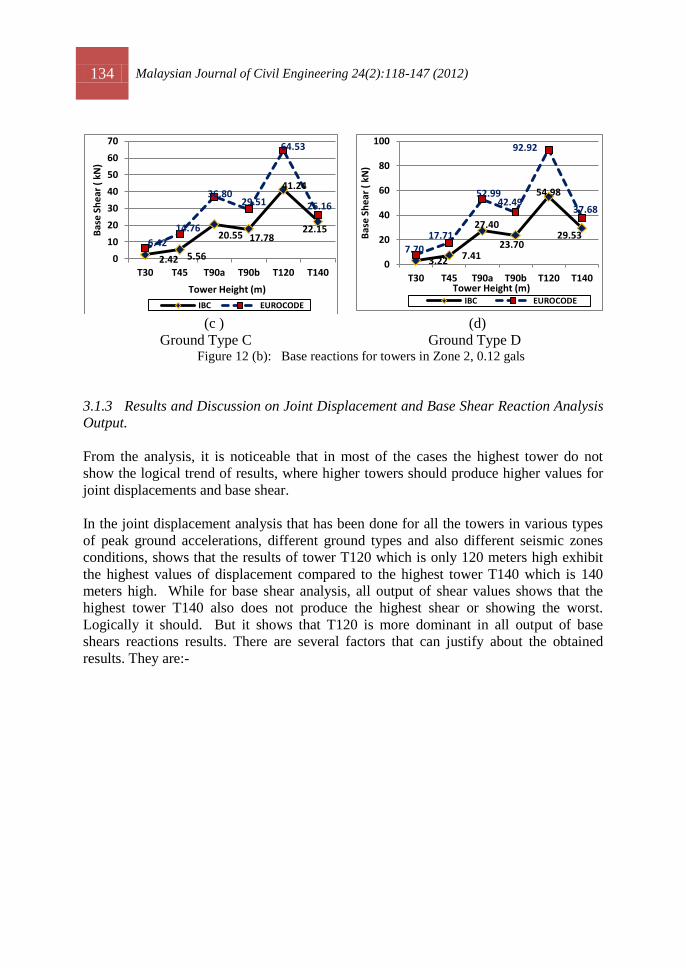
(c ) (d)
Ground Type C Ground Type D Figure 12 (b): Base reactions for towers in Zone 2, 0.12 gals
3.1.3 Results and Discussion on Joint Displacement and Base Shear Reaction Analysis
Output.
From the analysis, it is noticeable that in most of the cases the highest tower do not
show the logical trend of results, where higher towers should produce higher values for
joint displacements and base shear.
In the joint displacement analysis that has been done for all the towers in various types
of peak ground accelerations, different ground types and also different seismic zones
conditions, shows that the results of tower T120 which is only 120 meters high exhibit
the highest values of displacement compared to the highest tower T140 which is 140
meters high. While for base shear analysis, all output of shear values shows that the
highest tower T140 also does not produce the highest shear or showing the worst.
Logically it should. But it shows that T120 is more dominant in all output of base
shears reactions results. There are several factors that can justify about the obtained
results. They are:-
2.42 5.56
20.55 17.78
41.24
22.15
6.42
14.76
36.80 29.51
64.53
26.16
0
10
20
30
40
50
60
70
T30 T45 T90a T90b T120 T140
Bas
e S
he
ar (
kN
)
Tower Height (m)
IBC EUROCODE
3.22 7.41
27.40
23.70
54.98
29.53
7.70
17.71
52.99 42.49
92.92
37.68
0
20
40
60
80
100
T30 T45 T90a T90b T120 T140
Bas
e S
he
ar (
kN
)
Tower Height (m) IBC EUROCODE
Page 18
Malaysian Journal of Civil Engineering 24(2):118-147 (2012) 135
(i) Weight of Towers
Figure 13: Weight of towers (kN) against tower height (m)
As seen from Figure 13, tower T30 has the least weight followed by tower T45,
T90b, T90a, T140 and T120. Tower T120 weighs the heaviest compared with all the
other towers including the highest tower i.e. tower T140. Logically, the highest tower
will be the heaviest and will also produce the highest values in all analysis. But this is
not so for tower T140 and for tower T120.
Results shown earlier in the analysis that has been carried out, exhibits that joint
displacement analysis is increasing based on the increasing height of tower and this
seems logical. Logically the higher tower will produce higher displacement values.
Exceptionally, in this analysis it seems that for tower T120 which is higher but has
lower displacement values compared to tower T90 which is only 90 meters high. The
reason arises from this fact that the stiffness of tower T120 is several times higher than
that of tower T90. From the above graph we observed that the weight of tower T120 is
heavier, which is 608.8kN and this is almost one and half times more than the weight of
tower T90b which is only 444.36kN. So, this is one of the reasons why such
characteristic is seen in the output of joint displacement and base shear analysis.
(ii) Natural Period and Frequency Characteristics of Tower
Figure 14: Height of towers (kN) vs natural period (sec)
As seen in Figure 14 above, in the first mode versus the tower height graph it clearly
shows that the value of natural period increases with increasing tower heights. The
highest tower, T140 shows the highest natural period among all with 0.66 seconds while
60.38 138.92
513.73
444.36
608.85
553.76
0
200
400
600
800
T30 T45 T90a T90b T120 T140
We
igh
t o
f To
we
r (
kN)
Tower Height (m)
0.19 0.19
0.37 0.40 0.42
0.66
0
0.2
0.4
0.6
0.8
T30 T45 T90a T90b T120 T140
Nat
ura
l Pe
rio
d (
T )
se
c
Tower Height (m)
Page 19
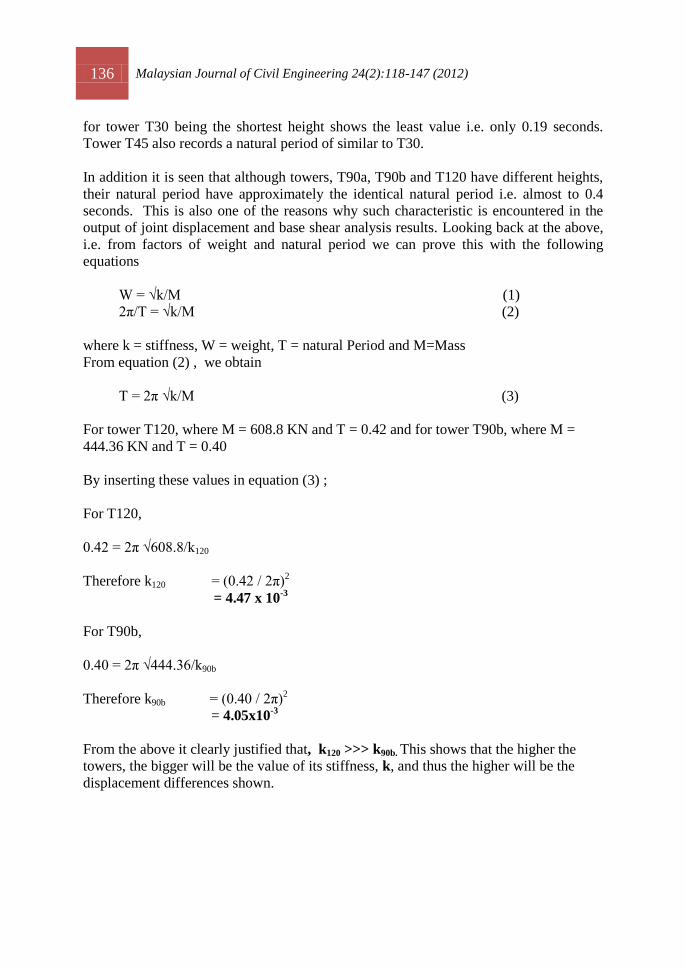
136 Malaysian Journal of Civil Engineering 24(2):118-147 (2012)
for tower T30 being the shortest height shows the least value i.e. only 0.19 seconds.
Tower T45 also records a natural period of similar to T30.
In addition it is seen that although towers, T90a, T90b and T120 have different heights,
their natural period have approximately the identical natural period i.e. almost to 0.4
seconds. This is also one of the reasons why such characteristic is encountered in the
output of joint displacement and base shear analysis results. Looking back at the above,
i.e. from factors of weight and natural period we can prove this with the following
equations
W = √k/M (1)
2π/T = √k/M (2)
where k = stiffness, W = weight, T = natural Period and M=Mass
From equation (2) , we obtain
T = 2π √k/M (3)
For tower T120, where M = 608.8 KN and T = 0.42 and for tower T90b, where M =
444.36 KN and T = 0.40
By inserting these values in equation (3) ;
For T120,
0.42 = 2π √608.8/k120
Therefore k120 = (0.42 / 2π)2
= 4.47 x 10
-3
For T90b,
0.40 = 2π √444.36/k90b
Therefore k90b = (0.40 / 2π)2
= 4.05x10⁻³
From the above it clearly justified that, k120 >>> k90b. This shows that the higher the
towers, the bigger will be the value of its stiffness, k, and thus the higher will be the
displacement differences shown.
Page 20
Malaysian Journal of Civil Engineering 24(2):118-147 (2012) 137
(iii) Shapes / Arrangement of Tower
As seen from Table 4, the shapes of the entire analysed towers are not identical. Some
having a regular shape throughout the whole stretch while others having a broad shape
in the lower part but more tapered towards the peak. The sort of ‘irregular’ shape and
arrangement that varies from each towers also contributes to the inconsistent trend in the
output of displacement and base shear reaction values.
From these analyses, the researcher has come to a suggestion that it is a good point that
for the erection of towers in future, a standardised or by optimizing the shape should be
practiced so that tower owners can improve the seismic performance of their towers.
Table 4: Shapes of modeled towers
Tower
Name
T30
T45
T90a
T90b
T120
T140
From the above discussions, we can conclude that we have been able to retrieve the
displacement and base shear reactions for towers under earthquake conditions using
both IBC and EC8 analysis. Generally, the value of lateral displacement and base shear
reactions are higher when the PGA value increases. Moreover the same trend is
observed also when the ground type changes from ground type A to ground type D.
Page 21
138 Malaysian Journal of Civil Engineering 24(2):118-147 (2012)
In addition, factors such as the weight of towers, shapes or arrangements of members
and the natural period also contributes to the obtained results. But still we could not
confirm as yet whether the existing towers are able to sustain the earthquake effects
experienced in Malaysia or not. To response to this question we should compare the
displacements and reactions already obtained with allowable values. We need to refer to
codes or regulations related to telecommunication tower structures as outlined in
TIA/EIA-222G and ASCE 7-10.
In TIA/EIA-222G, there are some limitations for sway displacement and torsional
rotations of telecommunication towers. However these are for the case when the tower
is under wind action. In case of earthquake, since the telecommunication towers do not
have non-structural elements that will get damage due to seismic action, seismic codes
like ASCE 7-10, do not put limitation for lateral displacement of non-building structures
like telecommunication towers.
Due to this limitation if we want to compare the lateral displacements, we can use the
limitations that we have for common buildings that are found in building codes. Since
these limitations can be considered restrict for telecommunication towers, but if the
towers could pass these limitations then we can assure that they are safe. The
displacement limitation in section 12.12.1 of ASCE 7-10, is stated as 0.02 heights of
structures. In order to prove this we should calculate the towers top displacement
through section 12.8.6 of ASCE 7-10. The displacement at Level x (δx) (in. or mm)
used to compute the design story drift, Δ, shall be determined in accordance with the
following equation:
δx = Cd δxe (4)
Ie
where:
Cd = the displacement amplification factor, δxe = the deflection at the location required
by this section determined by an elastic analysis Ie = the importance factor. In the
analysis carried out earlier, Cd = 3 and Ie = 1.5
Then the obtained result can be compared with 0.02 heights of the towers. It should be
mentioned that, TIA/EIA-222G limits the maximum displacement to 0.03 height which
is 1.5 times more than the proposed value by IBC.
From the displacements limitation, it clearly verified that all maximum displacements of
all the towers is less than the permissible limit as that has been outlined in ASCE/IBC.
This shows that the structural integrity of the self supporting steel towers are in good
condition and suspected to be able to withstand seismic ground movements due to
earthquakes.
Page 22
Malaysian Journal of Civil Engineering 24(2):118-147 (2012) 139
Besides the above factors, the researcher will explore more on the Axial Force
characteristics of the towers that has been modeled. Since these towers are restrained as
hinge therefore the obtained shear force and moment are negligible. So, in this study
only the axial forces in the members are considered. Since only samples of the 489
towers owned by TM are being analysed, there seems that many more numbers of
towers to be thoroughly inspected to determine their state of structural integrity
especially for those towers located near to the more hazardous zone.
3.1.4 Analysis of Axial Forces for Modeled Towers
For axial forces analysis only the maximum peak ground acceleration in each
zone is selected besides two ground types. In Zone 1, peak ground acceleration of 0.08
gals with ground type A and ground type D has been carried out on all the modeled
towers. For Zone 2 only the maximum peak ground acceleration i.e. the 0.12 gals has
been selected for the axial shear analysis on both ground type A and D. The total
number of analysis carried out for the axial forces are twenty four (24). The results for
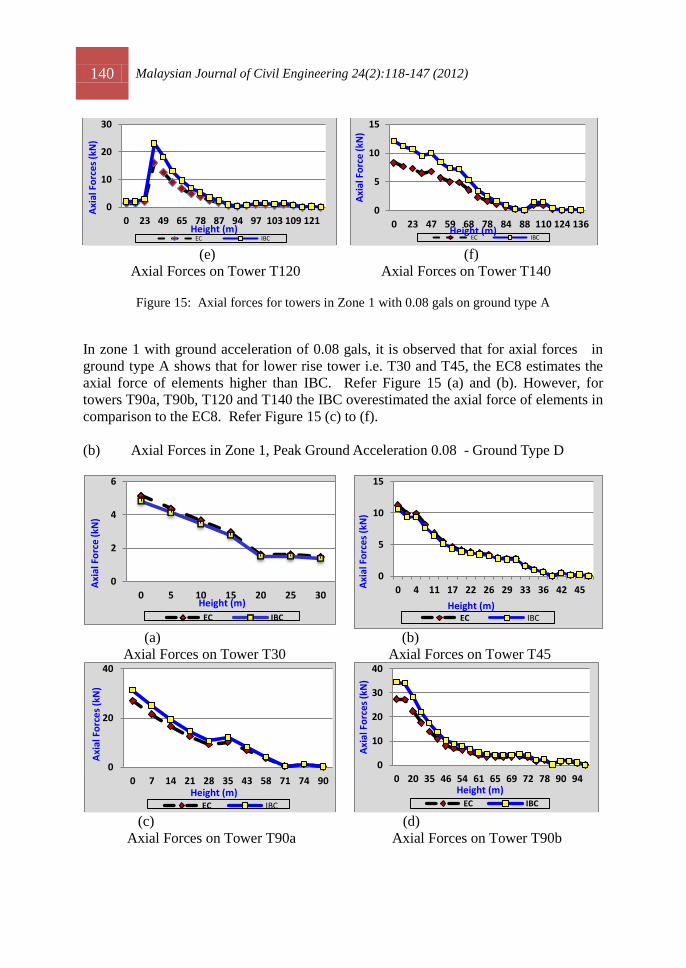
the axial forces are as shown in Figure 15 to Figure 18.
(a) Axial Forces in Zone 1, Peak Ground Acceleration 0.08 - Ground Type A
(a) (b)
Axial Forces on Tower T30 Axial Forces on Tower T45
(c ) (d)
Axial Forces on Tower T90a Axial Forces on Tower T90b
0
2
4
6
0 5 10 15 20 25 30Axi
al F
orc
e (
kN)
Height (m) IBC EC
0
2
4
6
8
0 4 11 17 22 26 29 33 36 42 45
Axi
al F
orc
es
(kN
)
Height (m) EC IBC
0
5
10
15
20
0 7 14 21 28 35 43 58 71 74 90
Axi
al F
orc
es
(kN
)
Height (m) EC IBC
0
5
10
15
20
0 20 35 46 54 61 65 69 72 78 90 94
Axi
al F
orc
es
(kN
)
Height (m) EC IBC
Page 23
140 Malaysian Journal of Civil Engineering 24(2):118-147 (2012)
(e) (f)
Axial Forces on Tower T120 Axial Forces on Tower T140
Figure 15: Axial forces for towers in Zone 1 with 0.08 gals on ground type A
In zone 1 with ground acceleration of 0.08 gals, it is observed that for axial forces in
ground type A shows that for lower rise tower i.e. T30 and T45, the EC8 estimates the
axial force of elements higher than IBC. Refer Figure 15 (a) and (b). However, for
towers T90a, T90b, T120 and T140 the IBC overestimated the axial force of elements in
comparison to the EC8. Refer Figure 15 (c) to (f).
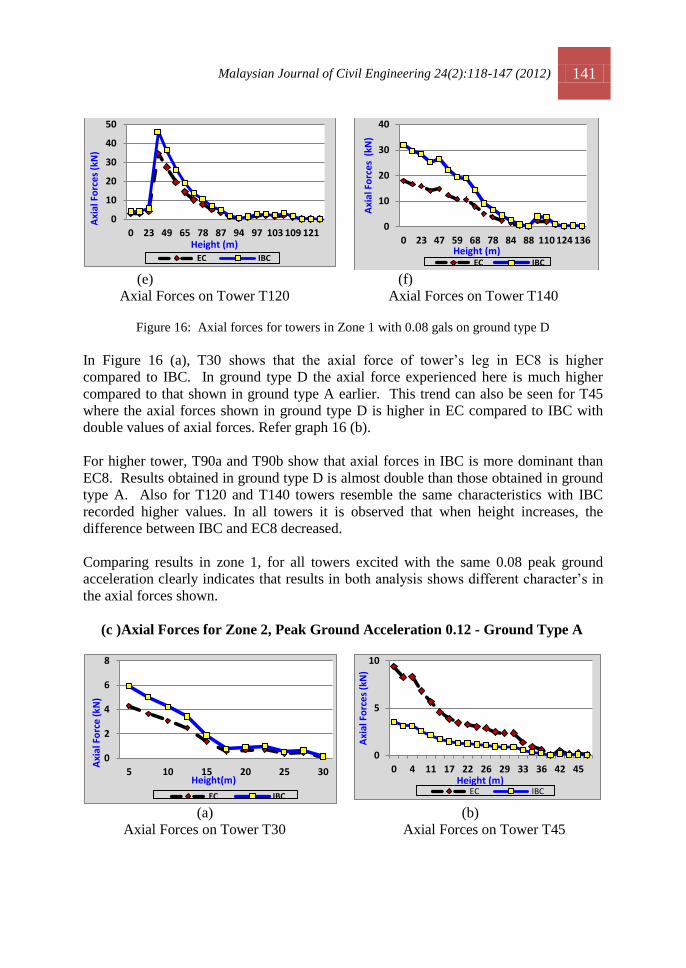
(b) Axial Forces in Zone 1, Peak Ground Acceleration 0.08 - Ground Type D
(a) (b)
Axial Forces on Tower T30 Axial Forces on Tower T45
(c) (d)
Axial Forces on Tower T90a Axial Forces on Tower T90b
0
10
20
30
0 23 49 65 78 87 94 97 103 109 121
Axi
al F
orc
es
(kN
)
Height (m) EC IBC
0
5
10
15
0 23 47 59 68 78 84 88 110 124 136
Axi
al F
orc
e (
kN)
Height (m) EC IBC
0
2
4
6
0 5 10 15 20 25 30
Axi
al F
orc
e (
kN)
Height (m)
EC IBC
0
5
10
15
0 4 11 17 22 26 29 33 36 42 45Axi
al F
orc
es
(kN
)
Height (m) EC IBC
0
20
40
0 7 14 21 28 35 43 58 71 74 90
Axi
al F
orc
es
(kN
)
Height (m)
EC IBC
0
10
20
30
40
0 20 35 46 54 61 65 69 72 78 90 94
Axi
al F
orc
es
(kN
)
Height (m) EC IBC
Page 24
Malaysian Journal of Civil Engineering 24(2):118-147 (2012) 141
(e) (f)
Axial Forces on Tower T120 Axial Forces on Tower T140
Figure 16: Axial forces for towers in Zone 1 with 0.08 gals on ground type D
In Figure 16 (a), T30 shows that the axial force of tower’s leg in EC8 is higher
compared to IBC. In ground type D the axial force experienced here is much higher
compared to that shown in ground type A earlier. This trend can also be seen for T45
where the axial forces shown in ground type D is higher in EC compared to IBC with
double values of axial forces. Refer graph 16 (b).
For higher tower, T90a and T90b show that axial forces in IBC is more dominant than
EC8. Results obtained in ground type D is almost double than those obtained in ground
type A. Also for T120 and T140 towers resemble the same characteristics with IBC
recorded higher values. In all towers it is observed that when height increases, the
difference between IBC and EC8 decreased.
Comparing results in zone 1, for all towers excited with the same 0.08 peak ground
acceleration clearly indicates that results in both analysis shows different character’s in
the axial forces shown.
(c )Axial Forces for Zone 2, Peak Ground Acceleration 0.12 - Ground Type A
(a) (b)
Axial Forces on Tower T30 Axial Forces on Tower T45
0
10
20
30
40
50
0 23 49 65 78 87 94 97 103 109 121
Axi
al F
orc
es
(kN
)
Height (m) EC IBC
0
10
20
30
40
0 23 47 59 68 78 84 88 110 124 136
Axi
al F
orc
es
(kN
)
Height (m) EC IBC
0
2
4
6
8
5 10 15 20 25 30
Axi
al F
orc
e (
kN)
Height(m)
EC IBC
0
5
10
0 4 11 17 22 26 29 33 36 42 45
Axi
al F
orc
es
(kN
)
Height (m) EC IBC
Page 25
142 Malaysian Journal of Civil Engineering 24(2):118-147 (2012)
(c) (d)
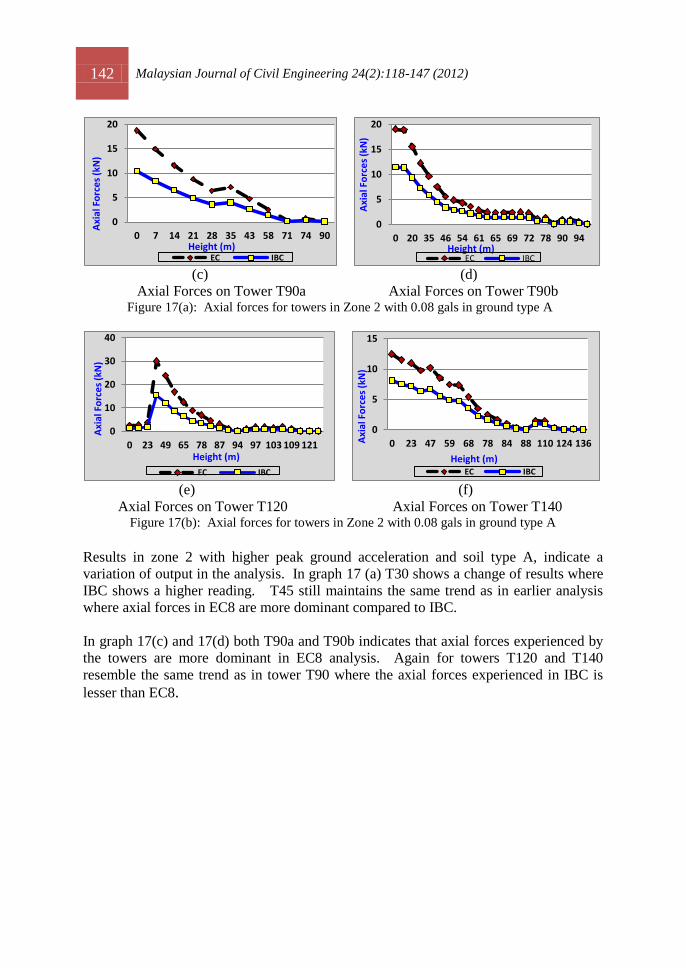
Axial Forces on Tower T90a Axial Forces on Tower T90b Figure 17(a): Axial forces for towers in Zone 2 with 0.08 gals in ground type A
(e) (f)
Axial Forces on Tower T120 Axial Forces on Tower T140 Figure 17(b): Axial forces for towers in Zone 2 with 0.08 gals in ground type A
Results in zone 2 with higher peak ground acceleration and soil type A, indicate a
variation of output in the analysis. In graph 17 (a) T30 shows a change of results where
IBC shows a higher reading. T45 still maintains the same trend as in earlier analysis
where axial forces in EC8 are more dominant compared to IBC.
In graph 17(c) and 17(d) both T90a and T90b indicates that axial forces experienced by
the towers are more dominant in EC8 analysis. Again for towers T120 and T140
resemble the same trend as in tower T90 where the axial forces experienced in IBC is
lesser than EC8.
0
5
10
15
20
0 7 14 21 28 35 43 58 71 74 90
Axi
al F
orc
es
(kN
)
Height (m) EC IBC
0
5
10
15
20
0 20 35 46 54 61 65 69 72 78 90 94
Axi
al F
orc
es
(kN
)
Height (m) EC IBC
0
10
20
30
40
0 23 49 65 78 87 94 97 103 109 121
Axi
al F
orc
es
(kN
)
Height (m)
EC IBC
0
5
10
15
0 23 47 59 68 78 84 88 110 124 136Axi
al F
orc
es
(kN
)
Height (m) EC IBC
Page 26
Malaysian Journal of Civil Engineering 24(2):118-147 (2012) 143
(d) Axial Forces in Zone 2, Peak Ground Acceleration0.12 - Ground Type D
(a) (b)
Axial Forces on Tower T30 Axial Forces on Tower T45 Figure 18(a): Axial forces for towers in Zone 2 with 0.08 gals in ground type D
(c) (d)
Axial Forces on Tower T90a Axial Forces on Tower T90b
(e) (f)
Axial Forces on Tower T120 Axial Forces on Tower T140 Figure 18(b): Axial forces for towers in Zone 2 with 0.08 gals in ground type D
In this analysis, the same characteristics of towers are observed as in ground type A. As
seen in graph 18(a) the axial forces experienced by T30 shown in IBC is higher
compared to EC8. For T45 a reversal trend shows where EC8 is more conservative.
Refer Figure 18 (b), where T45 indicates a higher value in axial compared to T30 which
is lower in height. As seen in Figure 18(c ) and 18(d) above , all higher towers T90a,
0
5
10
15
5 10 15 20 25 30Axi
al F
orc
es
(kN
)
Height (m)
EC IBC
0
5
10
15
20
0 4 11 17 22 26 29 33 36 42 45
Axi
al F
orc
es
(kN
)
Height (m) EC IBC
0
10
20
30
40
50
0 7 14 21 28 35 43 58 71 74 90
Axi
al F
orc
es
(kN
)
Height (m) EC IBC
0
10
20
30
40
50
0 20 35 46 54 61 65 69 72 78 90 94
Axi
al F
orc
es
(kN
)
Height (m) EC IBC
0
20
40
60
0 23 49 65 78 87 94 97 103 109 121
Axi
al F
orc
es
(kN
)
Height (m)
EC IBC
0
10
20
30
0 23 47 59 68 78 84 88 110 124 136
Axi
al F
orc
es
(kN
)
Height (m)
EC IBC
Page 27
144 Malaysian Journal of Civil Engineering 24(2):118-147 (2012)
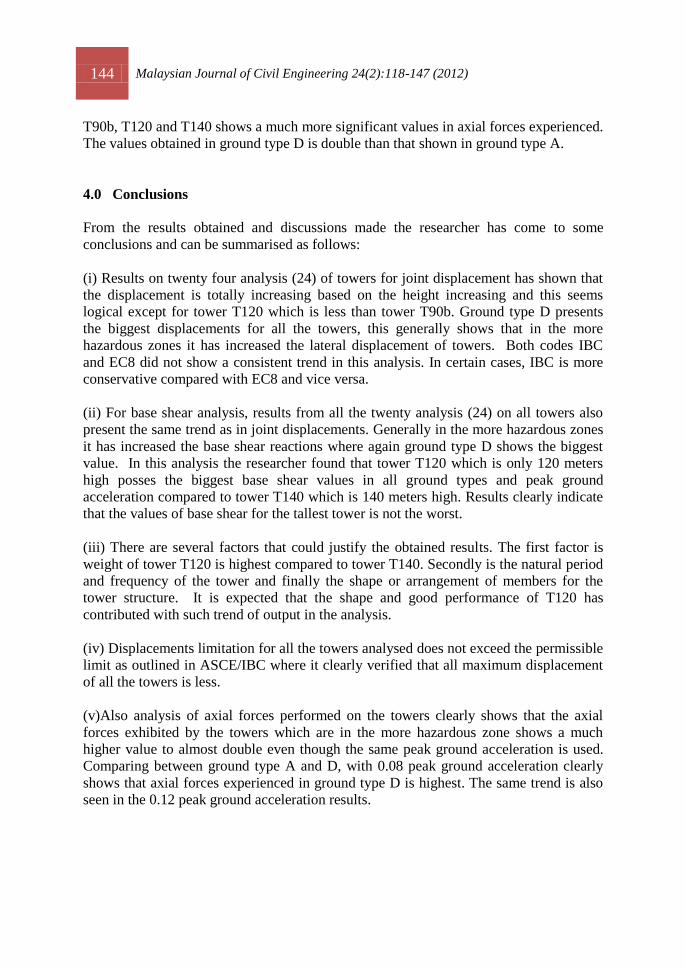
T90b, T120 and T140 shows a much more significant values in axial forces experienced.
The values obtained in ground type D is double than that shown in ground type A.
4.0 Conclusions
From the results obtained and discussions made the researcher has come to some
conclusions and can be summarised as follows:
(i) Results on twenty four analysis (24) of towers for joint displacement has shown that
the displacement is totally increasing based on the height increasing and this seems
logical except for tower T120 which is less than tower T90b. Ground type D presents
the biggest displacements for all the towers, this generally shows that in the more
hazardous zones it has increased the lateral displacement of towers. Both codes IBC
and EC8 did not show a consistent trend in this analysis. In certain cases, IBC is more
conservative compared with EC8 and vice versa.
(ii) For base shear analysis, results from all the twenty analysis (24) on all towers also
present the same trend as in joint displacements. Generally in the more hazardous zones
it has increased the base shear reactions where again ground type D shows the biggest
value. In this analysis the researcher found that tower T120 which is only 120 meters
high posses the biggest base shear values in all ground types and peak ground
acceleration compared to tower T140 which is 140 meters high. Results clearly indicate
that the values of base shear for the tallest tower is not the worst.
(iii) There are several factors that could justify the obtained results. The first factor is
weight of tower T120 is highest compared to tower T140. Secondly is the natural period
and frequency of the tower and finally the shape or arrangement of members for the
tower structure. It is expected that the shape and good performance of T120 has
contributed with such trend of output in the analysis.
(iv) Displacements limitation for all the towers analysed does not exceed the permissible
limit as outlined in ASCE/IBC where it clearly verified that all maximum displacement
of all the towers is less.
(v)Also analysis of axial forces performed on the towers clearly shows that the axial
forces exhibited by the towers which are in the more hazardous zone shows a much
higher value to almost double even though the same peak ground acceleration is used.
Comparing between ground type A and D, with 0.08 peak ground acceleration clearly
shows that axial forces experienced in ground type D is highest. The same trend is also
seen in the 0.12 peak ground acceleration results.
Page 28
Malaysian Journal of Civil Engineering 24(2):118-147 (2012) 145
(vi)The axial forces results shows that there is an indication of a greater sensitivity of
the leg members to the peak ground acceleration of the earth movement and the type of
ground it is situated.
(vii)All the towers studied behaved within serviceability limits.
Though only six samples of towers are being used for the analysis, it does show signs
that there are seismic behaviors acting on the telecommunication towers in Malaysia due
to the earthquake effects. Seismic amplifications of displacements, base shear reactions
and axial forces may affect the top part of the tower where the antennas are attached, but
they should not result in any local permanent deformation after the earthquake. Such
deformations may results to a loss of serviceability resulting in unacceptable signal
attenuation or failure. Therefore it is recommended more studies should be carried out to
further determine the safety and reliability of all towers in the country especially those
located in the more hazardous zones.
Acknowledgement:
The authors are indebted to and also wish to thank Telekom Malaysia Berhad for
permission to use information on towers and Rendang Engineering Sdn. Bhd. for their
cooperation in the research work.
References
Adnan, A., Hendriyawan, Marto, A. and Masyhur, I, (2006). Development of Seismic Hazard
Map for Peninsular Malaysia. Proceeding on Malaysian Science and Technology Congress.
Kuala Lumpur, Malaysia. 18-26 September.
Amiri, G.G.,(1997). Seismic Sensitivity of Tall Guyed Telecommunication Towers. Ph.D Thesis,
Dept. of Civil Engineering and Applied Mechanics, McGill University. Montreal, Quebec,
Canada.
Amiri, G.G., Zahedi, M.A., and Jalali, R.S., (2004). Multiple- Support Seismic Excitation of Tall
Guyed Telecommunication Towers. 13th
World Conference on Earthquake Engineering,
Vancouver, British Colombia, Canada, August 1-6, 2004, Canadian Association for
Earthquake Engineering, Paper No. 212.
Amiri, G.G., Barkhordari, M.A., Massah,S.R., and Vafaei,M.R., (2007). Earthquake
Amplification Factors for Self-Supporting 4-Legged Telecommunication Towers. World
Applied Sciences Journal 2 (6): 635-643.
ASCE Standards [ASCE/SEI 7-10], Minimum Design Loads for Buildings and Other Structures.
American Society of Civil Engineers, Reston, Virginia.
ASCE Manual and Report on Engineering Practice No 72 (ASCE Manual 72). (1990). Design of
Steel Transmission Pole Structures, 2nd
. Ed., American Society of Civil Engineers, Reston,
Virgina.
Page 29
146 Malaysian Journal of Civil Engineering 24(2):118-147 (2012)
ASCE Manual and Report on Engineering Practice No 74 (ASCE Manual 74). (1991).
Guidelines for Electrical Transmission Line Structural Loading, American Society of Civil
Engineers, Reston, Virgina.
Assi,R. and McClure,G. (2007). A Simplified Method for Seismic Analysis of Rooftop
Telecommunication Towers. Canadian Journal. Civil Engineering 34: 1352-1363.
Bai. F.L., Li, H.N. and Hao. H., 2010. Local Site Effect on Seismic Response of Coupled
Transmission Tower-Line Systems. ASCE, 161.139.200.238 [accessed 12 January 2011.
European Standards [EN 1998-1], Eurocode 8: Design of Structures for Earthquake Resistance-
Part 1: General Rules, Seismic Actions and Rules for Buildings. Supersedes ENV 1998-1-
1:1994, ENV 1998-1-2:1994,ENV 1998-1-3:1995, December (2004).
Executive Report on Typhoon and Earthquake Disaster, 30th
September, 2009, (2009). Fire
Department Headquarters, Putrajaya, Malaysia.
Faridafshin,F. and Mc. Clure,G, (2008). Seismic Response of Tall Guyed Masts to Asynchronous
Multiple-Support and Vertical Ground Motions ASCE, Journal of Structural Engineering.
Galvez C, Mc Clure, G. (1995). A Simplifield Method for Aseismic Design of Self-Supporting
Lattice Telecommunication Towers. Proceedings of the 7th
Canadian Conference ob
Earthquake Engineering, Montreal, Canada, p. 541-548.
Hiramtsu,K., Sato, Y., Akagi, H., and Tomita, S. (1989). Seismic Response Observation of
Building Appendage. In Proceedings of the 9th
World Conference on Earthquake Engineering,
Tokyo, 2-9 August 1988. Japan Association for Earthquake Disaster Prevention, Tokyo. Vol.
6, pp.237-242.
International Building Code
Institution of Engineers Malaysia, (2005). Position Paper on Issues Related to Earthquake,
IEM, Malaysia.
Japan Society of Civil Engineers (JSCE). (1995). Preliminary Report on the Great Hanshin
Earthquake January 17, 1995. Japan Society of Civil Engineers 1995.
Kanazawa,K., and Hirata, K. (2000). Seismic Analysis for Telecommunication Towers Built on
the Building. In Proceedings of the 12th
World Conference on Earthquake Engineering,
Auckland, New Zealand, 30 January-4 February, 2000. New Zealand Society for Earthquake
Engineering, Upper Hutt, New Zealand. Paper 0534.
Kehdr,M.A., and McClure,G (1999). Earthquake Amplification Factors for Self-Supporting
Telecommunciation Towers. Canadian Journal of Civil Engineering 1999; 26(2): pp. 208-215.
Komoo, I., Salleh, H., Tjia, H.D., Aziz, S., Tongkul, F., Jamaluddin, T.A. and Lim, C.S., (2005).
Kundasang Landslide Complex: Mechanism, Socio-Economic Impact and Governance (in
Malay).
Konno,T., and Kimura, E. (1973). Earthquake Effects on Steel Structures Atop Buildings. In
Proceedings of the 5th
World Conference on Earthquake Engineering, Rome, 25-29 July 1973.
Ministry of Public Works, Rome. Italy. Vol. 1,pp.184-193.
Luin, C.C (2008). Seismic Effects: A Threat to Local Structures? Jurutera, Institution of
Engineers Malaysia Volume 3, p.6.
Mikus, J. (1994). Seismic Analysis of Self-Supporting Telecommunication Towers. M. Eng.
Project Report G94-10, Department of Civil Engineering and Applied Mechanics, McGill
University, Montreal, Canada.
McClure, G. (1999). “Earthquake-resistant design of towers.” Proc., Meeting of IASS Working
Group 4 on Masts and Towers.
National Institute of Standards and Technology (NIST) (1995). The January 1995 Hyogoken-
Nanbu (Kobe) earthquake performance: performance of structures, lifelines, and fire
Page 30
Malaysian Journal of Civil Engineering 24(2):118-147 (2012) 147
protection systems. NIST Special Publication 901, United States National Institute of
Standards and Technology, Gaithersburg, MD, July 1996.
NRC/IRC National Research Council of Canada / Institute of Research in Construction (2005).
National Building Code of Canada 2005, Ottawa, ON, Canada.
Public Works Department Malaysia, (2008). Seismic Design Guidelines for Concrete Buildings
in Malaysia. (JKR20601-0184-09).
Sato,Y., Fuse,T., and Akagi, H. (1984). Building Appendage Seismic Design Forced Based on
Observed Floor Response. In Proceedings of the 8th
World Conference on Earthquake
Engineering, San Fransisco, California, 21-28 July 1984. Prentice Hall Inc., Englewood
Cliffs, N.J. pp. 1167-1174.
Sackmann, V. (1996). Prediction of Natural Frequencies and Mode Shapes of Self-Supporting
Lattice Telecommunication Tower. M. Eng. Project, 1996. Department of Civil Engineering
and Applied Mechanics, McGill University, Montreal, Canada.
Schiff, S.D. (1988). Seismic Design Studies of Low-Rise Steel Frames. PhD Thesis. Department
of Civil Engineering, University of Illinois at Urbana-Champaign.
Smith, B. W. (2007). Communication Structures, Thomas Telford Publishing Ltd, London.
TIA Standards, Structural Standard for Antenna Supporting Structures and Antennas,
Telecommunication Industry Association, TIA-222-G, (Revision of TIA-22-F) August (2005)
(Revision of TIA-222-F) April (2007).
Telekom Malaysia Asset Management System, TM TeAMS Web Site, http://intra.tm.teams/
[cited January 2009]