6 th International Conference on Earthquake Geotechnical Engineering 1-4 November 2015 Christchurch, New Zealand Seismic Damage Probabilities for Segmented Buried Pipelines in Liquefied Soils S. Toprak 1 , E. Nacaroglu 2 and A.C. Koc 3 ABSTRACT Recent earthquakes showed that pipeline damage is relatively heavy especially in the areas where permanent ground deformations (e.g., liquefaction zones) existed. In this study, the fragility relations relating the probability of buried pipeline damage within the pipeline system to the seismic intensity levels and associated lateral and vertical ground deformations were presented. Data from 6.2 Mw 22 February 2011 Christchurch earthquake were used. The data collected are unprecedented in size and detail, involving high resolution light detection and ranging (LiDAR) measurements of vertical and lateral movements and detailed repair records for thousands of km of underground pipelines with coordinates for the location of each repair. The focus of this paper was the Avonside area of Christchurch city where both LiDAR and air photo measurements were available. The seismic probability of failure curves for cast iron and asbestos cement pipeline damage presented herein can be useful for risk studies of segmented water utility systems by providing the probability that the given facility get damage when subjected to the given hazard intensity from future earthquakes. Introduction Continuous service of lifeline systems such as drinking water and natural gas pipeline systems or getting their functionality quickly back right after an earthquake is very important and crucial for urban societies. It was observed in the past earthquakes that pipeline damage density was much higher at locations where permanent ground deformations (PGD) were observed (Toprak, 1998; Toprak, et al., 2009). The damage state is controlled by several parameters related to pipeline properties, geotechnical properties of the surrounding soil and seismic intensity. Because these parameters show substantial change for a pipeline system, which generally spreads over large areas, geographical information systems (GIS) are used for evaluations. PGD occurs as a result of surface faulting, liquefaction, landslides and differential settlement from consolidation of cohesionless soils. This paper deals with pipeline performance under PGD effects resulting from liquefaction. It is important for utility companies to evaluate their existing systems against PGD effects as well as to design their new systems resistant to these effects. Performance of pipelines in past earthquakes showed that the pipe material and joint type are important for the response to earthquake loading (Toprak et al., 2015b). Pipe compositions of pipeline systems may differ in cities and countries. The comparisons of water distribution 1 Professor, Department, Pamukkale University, Denizli, Turkey, [email protected]2 Research Assistant, Pamukkale University, Denizli, Turkey, [email protected]3 Associate Professor, Pamukkale University, Denizli, Turkey, [email protected]
Transcript
6th International Conference on Earthquake Geotechnical Engineering 1-4 November 2015 Christchurch, New Zealand
Seismic Damage Probabilities for Segmented
Buried Pipelines in Liquefied Soils
S. Toprak1, E. Nacaroglu2 and A.C. Koc3
ABSTRACT Recent earthquakes showed that pipeline damage is relatively heavy especially in the areas where
permanent ground deformations (e.g., liquefaction zones) existed. In this study, the fragility relations relating the probability of buried pipeline damage within the pipeline system to the seismic intensity levels and associated lateral and vertical ground deformations were presented. Data from 6.2 Mw 22 February 2011 Christchurch earthquake were used. The data collected are unprecedented in size and detail, involving high resolution light detection and ranging (LiDAR) measurements of vertical and lateral movements and detailed repair records for thousands of km of underground pipelines with coordinates for the location of each repair. The focus of this paper was the Avonside area of Christchurch city where both LiDAR and air photo measurements were available. The seismic probability of failure curves for cast iron and asbestos cement pipeline damage presented herein can be useful for risk studies of segmented water utility systems by providing the probability that the given facility get damage when subjected to the given hazard intensity from future earthquakes.
Introduction
Continuous service of lifeline systems such as drinking water and natural gas pipeline systems or getting their functionality quickly back right after an earthquake is very important and crucial for urban societies. It was observed in the past earthquakes that pipeline damage density was much higher at locations where permanent ground deformations (PGD) were observed (Toprak, 1998; Toprak, et al., 2009). The damage state is controlled by several parameters related to pipeline properties, geotechnical properties of the surrounding soil and seismic intensity. Because these parameters show substantial change for a pipeline system, which generally spreads over large areas, geographical information systems (GIS) are used for evaluations. PGD occurs as a result of surface faulting, liquefaction, landslides and differential settlement from consolidation of cohesionless soils. This paper deals with pipeline performance under PGD effects resulting from liquefaction. It is important for utility companies to evaluate their existing systems against PGD effects as well as to design their new systems resistant to these effects. Performance of pipelines in past earthquakes showed that the pipe material and joint type are important for the response to earthquake loading (Toprak et al., 2015b). Pipe compositions of pipeline systems may differ in cities and countries. The comparisons of water distribution
networks in various countries (e.g., Toprak et al., 2007) show that pipe compositions (including joint types) in the water distribution networks differ significantly from country to country. The history and development of water supply systems in urban areas of countries affect the existing pipe compositions. For example, the main types of buried water pipes in Japan are ductile cast iron pipes (DIP), grey cast iron pipes (CIP), steel pipes (SP), polyethylene pipes (PE), polyvinyl chloride pipes (PVC), and asbestos cement pipes (ACP). Ductile cast iron pipes account for 60% of the total length of buried water pipes (Miyajima, 2012). The total length of Christchurch pipelines in liquefaction and non-liquefaction areas (about the 6.2 Mw 22 February 2011 Christchurch earthquake) was 1730.3 km and distribution of pipes for pipe types were; 867.2 km AC, 194.4 km CI, 213.6 km PVC, 149.7 km MPVC and 305.4 km other types (Steel, Concrete, DI etc.). In liquefaction areas the length of pipes are; 405.7 km AC, 130.9 km CI, 111.9 km PVC, 48.9 km MPVC and 141.9 km other types. Especially, asbestos cement pipes are well known for their high damage rates during earthquakes. Having aging buried pipeline systems, many lifeline utility (e.g., water) companies worried about the performance of their systems against various hazards. Risk assessment of these systems provides a valuable tool for the mitigation studies. The basic equation for the risk calculation under extreme events is (Vrouwenvelder, 2009): RISK = ∑ P(H) P(D|H) P(S|D) C(S) (1) where H represents the hazard and P(H) is the probability of exceedance of a given intensity over a given time period, D is the damage, P(D|H) is the probability that the given facility get damage when subjected to the given hazard intensity, S is failure scenario, P(S|D) is the probability that the given system fail when subjected to the given damage and C is the cost for the given failure scenario. The summation is over all relevant hazards, damage types and scenarios. The calculated risks can be used to calculate robustness index as proposed by Baker et al. (2008). The objective of this study is to develop fragility correlations relating the probability of pipe failure to the different seismic ground motions, namely lateral ground strain and angular distortion by using ground displacement measurements from air photo and high resolution LiDAR surveys data acquired before and after the 6.2 Mw 22 February 2011 earthquake. In essence, relationships for AC and CI pipelines to determine P(D|H) for earthquake hazard is presented. The 22 February 2011, Christchurch New Zealand earthquake pipeline damage in Avonside area of Christchurch city was used to develop the relationships.
Pipeline Damage Correlations Figure 1 shows coverage of liquefaction and measured LiDAR vertical displacement associated with pipeline distribution and repairs for 22 Feb. 2011 earthquake (O’Rourke et al. 2014). The total length of pipelines in liquefaction areas are; 405.7 km AC, 130.9 km CI, 111.9 km PVC, 48.9 km MPVC and 141.9 km other types. As stated above, this study focuses on performance of AC and CI pipe types in the liquefaction areas.
Figure 1: Coverage of liquefaction and measured LiDAR vertical displacement associated with pipeline distribution and repairs for 22 Feb. 2011 earthquake (O’Rourke et al., 2014).
Figure 2: Ground displacement from LiDAR and air photos superimposed on pipelines and pipe repairs in Avonside (Toprak et al., 2014).
As discussed in Toprak et al. (2014; 2015a), Figure 2 shows the water pipelines and repair locations in Avonside area. Also shown in the figure are air photo and LiDAR horizontal displacements. Measurements of lateral movement derived from the LIDAR surveys are provided as displacement in the east-west (EW) and north- south (NS) directions at 56-m and 4-m intervals. The horizontal spatial accuracy of the LiDAR data is between ± 400 mm and ± 500 mm (CERA, 2012). The data were corrected in this study for tectonic movements, which are also provided through CERA. The vertical movements available through CERA are corrected for tectonic uplift and subsidence, and provided on 5-m intervals. The accuracy of the vertical LiDAR data is between ± 70 mm and ± 150 mm (Tonkin and Taylor, 2012). Horizontal displacements from air photo measurements are provided at 680 locations.
For the purpose of horizontal strain calculations from LiDAR displacements, the horizontal displacement data points are considered as corners of square elements shown in Figure 3 (O’Rourke et al., 2014). The grid with square elements may be regarded as a finite element mesh with bilinear quadrilateral elements. Knowing the coordinates of each corner and the corresponding displacement, the strains in the EW and NS directions (εx and εy, respectively) and shear strains (γxy) can be calculated by computing the spatial derivatives of displacements using linear interpolation.
Figure 3: Procedure of calculating ground strains from horizontal ground displacements (O’Rourke et al. 2014).
Accordingly, finite element formulations were used to determine horizontal ground strains in the center of the elements, following the method described by Cook (1995). The strain matrix is calculated from the 56 x 56m or 4x4m cell displacements as
(2)(2)
in which u1, v1, u2,...,v4 are the corner displacements defined in Fig. 3, x and y are coordinates in two dimensional space, and a is the length of the square cell that is 56 m or 4m. Using the strains from Eqn. 2, the principal strains, ε1 and ε2, were calculated from well-known strain transformations as
2 2
1,2 2 2 2x y x y xyε + ε ε − ε γ
ε = ± + (3)
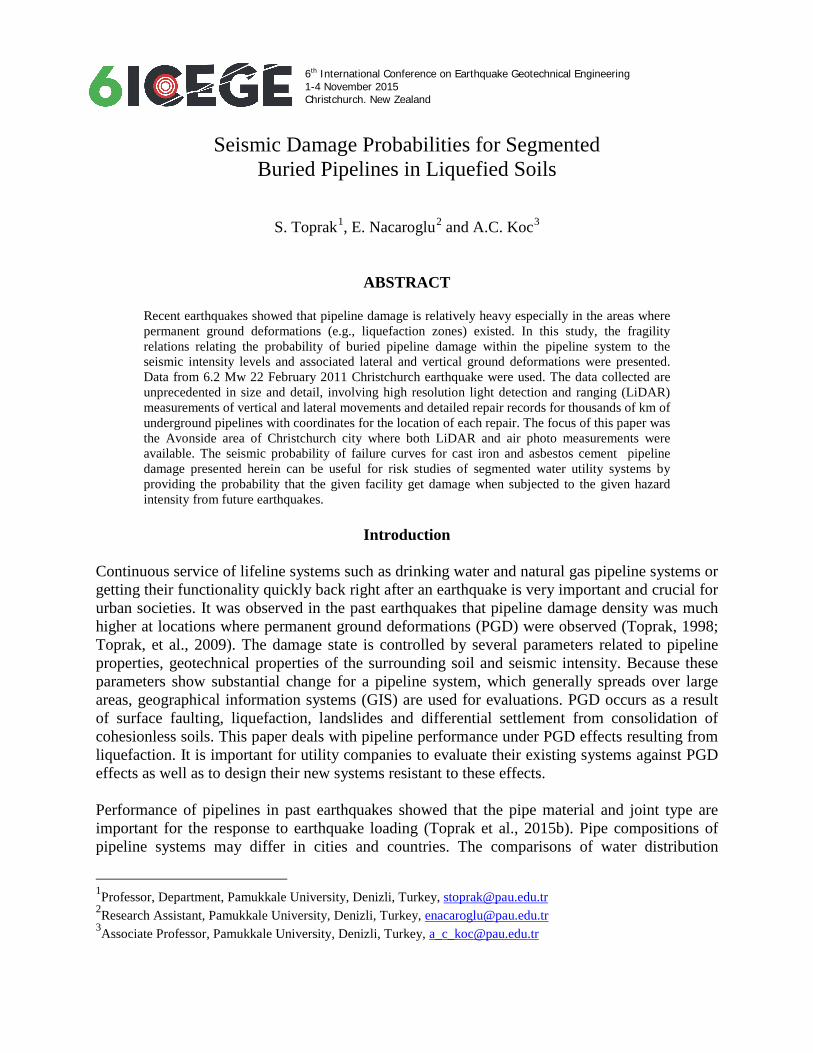
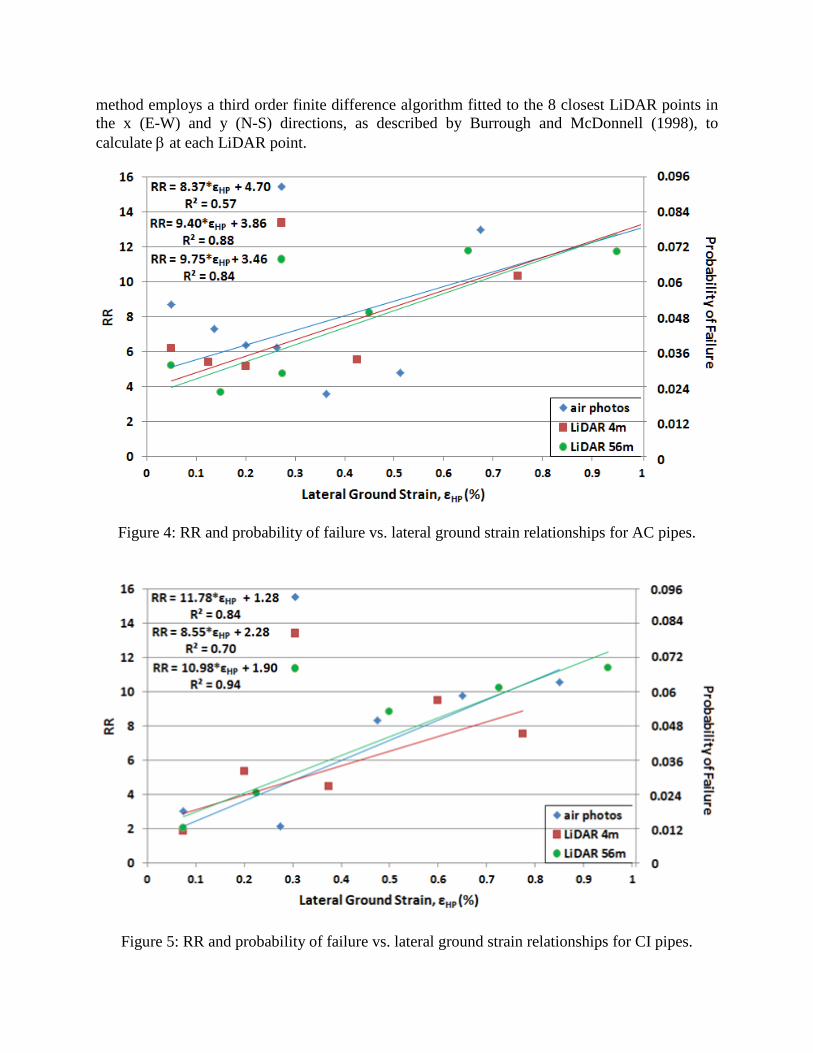
For the purpose of horizontal strain calculations from air photo displacements, the methodology described by Toprak et al. (2014) utilized as the air photo displacement data point locations are not evenly distributed like LiDAR ones. Pipeline damage commonly expressed as repair rate (RR), which is the number of pipeline repairs in an area divided by the length of the pipelines in the same area. Correlations of RR for different pipe types vs. lateral ground strains were developed by counting the number of repairs and pipeline lengths for the particular pipe type in each 56-m and 4-m cell, and then calculating the RR associated with certain strain intervals. Figure 4 presents RR vs. lateral ground strain linear data and regressions for AC water pipelines for 56-m and 4-m LiDAR and air photo measurements. The lateral ground strain is the maximum absolute value of the ground strain, εHP. The RRs were screened following procedures described by O’Rourke et al. (2014). As discussed in O’Rourke et al. (2014), the fidelity of the RR statistics is sensitive to the pipeline length sampled and number of repairs observed within a given sampling length. To select lengths sufficient to produce meaningful correlations, models adopted by O’Rourke et al. (2014) used herein. Figure 5 presents RR vs. lateral ground strain linear data and regressions for CI water pipelines for 56-m and 4-m LiDAR and air photo measurements. Comparison of Figures 4 and 5 shows that asbestos cement pipelines have higher RR per level of ground strain than cast iron pipelines. Figures 4 and 5 also show the probabilities of failure for AC and CI pipelines in the Avonside area, respectively. In order to obtain the probabilities of pipe failure, number of pipelines which failed and did not fail should be determined. For this purpose, it is assumed that the pipe length is about 6 m and the total number of pipes in each strain category is calculated by dividing the length of pipelines by 6. The number of pipes in each strain category that failed is determined by assuming that each repair corresponds to one damaged pipe. This assumption is substantiated by checking the distances between the repairs are greater than 6 m by using GIS. The probability of failure is taken simply as the ratio of the number of damaged pipes to the total number of pipes in the same strain category zone. Angular distortion, β, is defined as the differential vertical movement between two adjacent LiDAR points (dv1 – dv2) divided by the horizontal distance, l, separating them, such that β = (dv1– dv2)/l. It is used in this work to evaluate the effects of differential vertical movement on pipeline damage. There are several advantages associated with this parameter. First, it is dimensionless, and thus can be scaled to the dimensions appropriate for future applications. Second, by subtracting the vertical movements of two adjacent points, one eliminates systematic errors associated with the LiDAR elevation surfaces. Finally, angular distortion is a parameter used widely and successfully in geotechnical engineering to evaluate the effects of ground deformation on buildings (e.g. Boscardin and Cording, 1989; Clough and O’Rourke, 1990). The angular distortion for each 5-m cell associated with the LiDAR measurements was calculated in the GIS analysis with a third order finite difference method proposed by Horn (1981). This
method employs a third order finite difference algorithm fitted to the 8 closest LiDAR points in the x (E-W) and y (N-S) directions, as described by Burrough and McDonnell (1998), to calculate β at each LiDAR point.
Figure 4: RR and probability of failure vs. lateral ground strain relationships for AC pipes.
Figure 5: RR and probability of failure vs. lateral ground strain relationships for CI pipes.
Figure 6: RR and probability of failure vs. angular distortion relationships for AC and CI pipes. Correlations of RR for different pipe types vs. β were developed by counting the number of repairs and pipeline lengths for the particular pipe type in each 5-m cell and calculating the RR associated with β intervals of 1 x 10⁻³. The same screening technique as explained in horizontal strains vs pipeline damage correlations was applied to develop the regression lines and equation shown in Fig. 6. Figure 6 compares the regression of RR vs. β for AC and CI pipelines. The figure shows that AC pipelines are especially vulnerable to the differential vertical movement, with RR approximately 2 times higher than that for CI pipelines at comparable levels of β. This observation is similar to the correlations developed for all Christchurch area in O’Rourke et al. (2012; 2014).
Conclusions In this study, the fragility relations relating the probability of buried pipeline damage and repair rate within the pipeline system to the seismic intensity levels and associated lateral and vertical ground deformations were presented. Comparisons of damage correlations obtained for lateral strains by using 56-m and 4-m LiDAR and air photo ground displacement measurements show that difference is not so significant. This result is confirmed for both AC and CI pipelines. Comparisons of AC and CI probabilities of failure clearly indicated that AC pipelines are more vulnerable to both lateral strains and angular distortions. Asbestos cement and CI pipelines are brittle, and thus subject to damage once a threshold level of deformation has been exceeded. This vulnerability is attributable in part to the uses of a relatively weak AC collar to join adjacent lengths of pipe. This collar is susceptible to cracking in response to relative rotation caused by differential settlement. CI pipelines, in contrast, have additional wall and shell thickness at the bell end of bell-and-spigot joints. Such joints are thus substantially more resistant to stress concentrations associated with relative rotation.
Acknowledgements The research reported in this paper was supported by Scientific and Technological Research Council of Turkey (TUBITAK) under Project No. 114M258. Partial grant provided by PAU BAP to attend the conference is acknowledged. Thanks to Prof. Dr. Thomas O’Rourke, Prof. Dr. Misko Cubrinovski, Prof. Dr. Masanori Hamada and Dr. Dimitra Bouziou for their contributions. Thanks are extended to the Christchurch Earthquake Recovery Authority (CERA), Stronger Christchurch Infrastructure Rebuild Team (SCIRT), Christchurch City Council (CCC), Earthquake Commission (EQC), Contact Energy, and Tonkin and Taylor Ltd for their assistance. Special thanks are extended to John Noonan of SCIRT. All LiDAR survey and liquefaction observation data are available through the CERA (2012) and were provided courtesy of EQC.
References Baker J, Jones JP, Schubert M, Faber MH. On the assessment of robustness. Structural Safety 30 2008;253-267.
Boscardin MD and Cording EJ. Building response to excavation-induced settlement. Journal of Geotechnical Engineering, 1989, ASCE 115(1), 1-21.
Burrough PA and McDonnell RA. Principles of Geographical Information Systems. Oxford University Press, Oxford, U.K, 1998.
Clough GW and O'Rourke TD. Construction induced movements of in-situ walls. In Proceedings, Specialty Conference on Design and Performance of Earth Retaining Structures, ASCE, 1990, 439-470.
Cook RD. Finite Element Modeling for Stress Analysis. John Wiley and Sons, 1995.
Horn BKP. Hill Shading and The Reflectance Map. In Proceedings, IEEE, 1981, 69(1), 14-47.
Miyajima M. Resilient water supply system for earthquake and tsunami. The 9th International Symposium on Water Supply Technology, 20-22 November 2012, Yokohama, Japan.
O’Rourke TD, Jeon SS, Toprak S, Cubrinovski M, Hughes M, Ballegooy S, Bouziou D. Earthquake response of underground pipeline networks in Christchurch, NZ. Earthquake Engineering Research Institute, EERI, 2014.
O'Rourke TD, Jeon SS, Toprak S, Cubrinovski M, Jung JK. Underground lifeline system performance during the Canterbury earthquake sequence. 15th World Conference in Earthquake Engineering, 2012, September. Lisbon, Portugal.
Tonkin and Taylor Ltd. Liquefaction Vulnerability Study. T&T Ref:52020.0200/v1.0, 2013.
Toprak S. Earthquake Effects on Buried Lifeline Systems. Ph.D. Thesis, Cornell University, Ithaca, NY, 1998.
Toprak S, Nacaroglu E, Cetin OA, Koc AC. Pipeline damage assessment using cluster analysis. TCLEE 2009: Lifeline Earthquake Engineering in a Multihazard Environment Proceedings of the 2009 ASCE Technical Council on Lifeline Earthquake Engineering Conference ASCE Conf. Proc. 357, 78 (2009), Oakland, California, DOI:10.1061/41050(357)78, June 28–July 1, 2009.
Toprak S, Koc AC, Taskın F. Evaluation of water distribution pipeline performance against earthquakes. Paper No: 1748, 4th International Conference on Earthquake Geotechnical Engineering, June 25-28, 2007, Greece.
Toprak S, Nacaroglu E, Koç AC, Sari M, Yildirim US, Helva V. Christchurch, New Zealand earthquake effects on buried pipelines in Avonside area. Eighth National Conference on Earthquake Engineering, 11-14 May 2015a, Istanbul, Turkey.
Toprak S, Nacaroglu E, Koç AC. Seismic Response of Underground Lifeline Systems. Perspectives on European Earthquake Engineering and Seismology Vol. 2 Editors: Ansal, Atilla (Ed.), 2015b.
Toprak S, Nacaroglu E, O'Rourke TD, Koc AC, Hamada M, Cubrinovski M, Jeon SS. Pipeline damage assessment using horizontal displacements from air photo and LiDAR measurements in Avonside area, Christchurch, NZ. Second European Conference on Earthquake Engineering and Seismology, 25-29 Aug, 2014, Istanbul, Turkey.
Vrouwenvelder T. Probabilistic modelling of exposure conditions. Proceedings of the Joint Workshop of COST Actions TU0601 and E55 Ljubljana, Slovenia 21 – 22 September 2009.