▲265The Journal of The South African Institute of Mining and Metallurgy JUNE 2004
Introduction
Although there has been considerable workdone on the topic of seismic hazard in mines,there is currently no widely accepted definitionor universal measure for seismic hazard inmines. In this paper, seismic hazard is definedas the likelihood of occurrence of a seismicevent of a certain magnitude. One of the keyissues in evaluating seismic hazard is determi-nation of the maximum potential seismic eventsize, Mmax.
There is a wide range of empirical,statistical, parametric and non-parametricapproaches for estimating seismic hazard orcalculating the maximum potential event size.Detailed discussions of these techniques canbe found in Brink et al.1, Kijko2, Mendecki3,and Kijko et al.4. However, owing to thecomplex nature of most of these techniques,they are rarely utilized by mine site personnelon an operational basis to evaluate seismichazard. Seismic hazard quantification shouldconsider the seismic response of the geologicalfeatures, mine stopes and pillars, and otherlocal mine conditions. Paradoxically, thepeople best equipped with the necessaryknowledge of these local mine conditions aremine site personnel familiar with the geologyand mine design. A seismic hazard technique
that will be accepted and used by mine sitepersonnel is required.
Seismic hazard scale
In 2002, a survey was conducted to investigatethe occurrence and severity of mine seismicityin underground, mechanized, hardrockmines5. One of the requirements for theanalysis of the mine seismicity survey datawas to compare the level of seismicity reportedat different mines. To compare those dataeffectively, a seismic hazard scale was neededthat could reliably quantify levels of mineseismicity ranging from negligible to severe.This requirement was complicated by the factthat half of the 72 mines that responded to thesurvey did not have local seismic monitoringsystems to provide quantitative data related tomine seismicity. The Seismic Hazard Scale(SHS) introduced below was developed for usein comparing and interpreting data from themine seismicity survey.
Defining the Seismic Hazard Scale (SHS)
Kijko and Funk6 discuss some of the mostcommonly used parameters to describe seismichazard. The Seismic Hazard Scale proposeduses two of these parameters:
➤ the rate of events of a given magnitude➤ the b-value parameter from the
Gutenberg-Richter relation7.
The Gutenberg-Richter relation asserts thatthe frequency of occurrence of events increasesaccording to a power law as the magnitude ofevents decreases (Figure 1). This can beexpressed as:
Log10 (Number of Events) = a – b * m
Seismic hazard in Western Australianminesby M. Hudyma* and Y. Potvin*
Synopsis
A Seismic Hazard Scale (SHS) has been developed to provide apractical seismic hazard assessment tool applicable to mine sitepersonnel. It has been applied to seismic data sets from numerousWestern Australian mines. The SHS is applicable when quantifyingseismic hazard on a minewide scale, on a mining block scale, and ona local cluster-by-cluster scale. Spatial mapping of variations inseismic hazard is a particularly powerful application of the scale.
The SHS is sensitive to temporal increases in seismic hazard. Ithas also been shown that the SHS can be applied to estimate seismichazard when seismic monitoring data are not available.
The SHS is a simple derivation of the Gutenberg-Richterrelation. There are assumptions and limitations to the SHS that needto be considered when applying it to mine seismicity data.
Metallurgy, 2004. SA ISSN 0038–223X/3.00 +0.00. The paper was first presented at the SecondInternational Seminar on Deep and High StressMining, 23–25 February 2004
Seismic hazard in Western Australian mines
Wherem is event magnitude,Number of events is the number of events in thepopulation equal or greater than magnitude, m, a is a constant related to the amount of seismicity,andb is the slope of the relation.
This is purely a starting point for relative comparison.Also, assume the b-value of the mine seismicity is approxi-mately 1. Then using the Gutenberg-Richter relation, theaverage daily rate of seismic events with ML ≥ 0 is 0.1, theaverage daily rate of ML ≥ + 1 is 0.01, and the average rate ofmicroseismic events ML ≥ - 2 is 10 per day. This can besimplified to:
[1]
WhereML is the Richter magnitude of the events, andDaily rate of events is the frequency of occurrence ofevents equal or greater than magnitude ML.
A qualitative description of how an event feels in a minewas proposed by Potvin and Hudyma8, and is reproduced inTable I. Using the qualitative descriptions between howevents feel in a mine and Richter magnitude, the daily rate ofevents from the above definition can be compared withmagnitude and event description (Table II).
If significant rates of seismicity are then defined to bepower law increases and decreases compared with thisoriginal definition, a relative ‘Seismic Hazard Scale’ can bedefined (Table III). The scale is designed to include rates ofseismicity from very low to extreme.
The rate of seismic events in the table can be simplified tothe following equation:
[2]
WhereML is Richter magnitude,Daily rate of events is the frequency of occurrence ofevents equal or greater than magnitude ML, andSHS is the seismic hazard scale.
Considering the typical short mine life for most westernAustralian mines, it is reasonable to assume that themaximum event size occurs at a rate of about 0.001 (anevent of this size ‘occurs every few years’). Seismic HazardScale (SHS) for a rate of 0.001 events per day is comparedwith maximum event size in Table IV.
This can be simplified to:
[3]
WhereXMAX is the largest event observed, SHS is the seismic hazard scale,ML is the Richter magnitude of a seismic event, andEvent rate is the daily rate of events with amagnitude equal to or greater than ML.
X SHS MMAX L≈ ≈ ( ) + +log10 3event rate
Daily rate of events SHS ML≥ − −( )10 3
Daily rate of events ML= − −( )10 1
▲
266 JUNE 2004 The Journal of The South African Institute of Mining and Metallurgy
Definition: Let a relatively high daily rate of microseis-micity, in a typical hard rock, mechanized mine, be definedas 1 event with Richter magnitude (ML) ≥ -1 per day
Figure 1—Gutenberg–Richter relation for mine seismicity
Table I
Richter magnitude of events compared with howthese events would be felt at a mine
Approximate DescriptionRichter Magnitude
-2.0 • Felt locally as thumps or bangs at a short distance from the event.
•May be felt more remote from the source of the event (i.e. more than 100 metres away).
•May be detectable by a microseismic monitoring system.
-1.0 • Often felt by many workers throughout the mine (i.e. hundreds of metres away).
• Similar vibration to a distant underground secondary blast.
• Will be detected by a microseismic monitoring system.
0.0 • Vibration felt and heard throughout the mine.• Bump commonly felt on surface (hundreds of
metres away), but may not be audible.• Vibration felt on surface similar to those generated
by a development round.
1.0 • Typically felt and heard very clearly on surface.• Vibrations felt on surface similar to a
major production blast.
2.0 • Vibration felt on surface is greater than large production blasts.
• Vibration detectable with regional earthquake monitoring systems.
Table II
Relative rates of seismic events assuming a powerlaw rate of occurrence and compared withqualitative event descriptions
Mine seismicity frequency per dayQuality description Approx. Richter High rate
magnitude of events
Felt locally ML > = -2 >10Felt in a few parts of a mine, like ML > = -1 >1a secondary blastOften felt on surface, or like a ML > = 0 >0.1development blast
Felt like a production mass blast ML > = +1 >0.01Detected by regional earthquake ML > = +2 >0.001network
Mathematical basis of the seismic hazard scale
The Seismic Hazard Scale is a simple derivation of theGutenberg-Richter relation (Figure 1). For any givenmagnitude, m, the SHS scale is the x-axis intercept of theGutenberg-Richter relation, or
[4]
WhereSHS is the seismic hazard scale,ML is the Richter magnitude,N is the number of events with a Richter magnitudeof at least ML, andb is the slope of the frequency magnitude relation.
Features of the seismic hazard scale
The SHS is conceptually simple. It employs one definition and
relies on the power law relation for defining levels of mineseismicity.
When the power law relation holds true, the SHS will givethe same rating regardless of the magnitude being used toevaluate the scale. This also gives the flexibility to calculatethe SHS using multiple magnitudes, adding confidence to theSHS rating.
There are also some advantages in the SHS when dealingwith data loss or seismic system limitations. The loss of a fewlarge events due to seismic system malfunction is unlikely toaffect the SHS scale dramatically, as the number of smallerevents also gives an equivalent indication of seismic hazard.
For seismic monitoring systems with a limited dynamicrange, it is possible that the magnitude of large events is notproperly calculated by the system owing to waveformclipping. The SHS scale is not dependent upon accuratemagnitude calculation for a small number of large events.The seismic hazard will be reflected in the frequency ofoccurrence of smaller events. For example, in Figure 2, theseismic data from a Western Australian mine are shown in aGutenberg-Richter plot. The seismic system saturates with anupper magnitude bound of about Richter 1.0. However, thesmaller events suggest that the SHS should be close to 2.0.
Assumptions and limitations of the seismic hazardscale
There are important assumptions and related limitations tothe Seismic Hazard Scale:
➤ It is assumed that mine seismicity reflects local rockmass failure mechanisms within the mine. If the
SHS b ML≈ ( ) +log /10 N
Seismic hazard in Western Australian mines
▲267The Journal of The South African Institute of Mining and Metallurgy JUNE 2004
Table III
Seismic Hazard Scale (SHS) defined from daily rates of seismic events and qualitative event descriptions
Mine seismicity frequency per day
Qualitative Felt locally Felt in a few parts of a mine, Often felt on surface, or Felt like a production Detected by regionaldescription like a secondary blast like a development blast mass blast earthquake network
Approx. Richter ML > = -2 ML > = -1 ML > = 0 ML > = +1 ML > = +2
magnitude
Seismic hazard scale and qualitative description
-2 Nil >0.001 0 0 0 0(once every few years) (has never occurred) (has never occurred) (has never occurred) (has never occurred)
-1 Very low > 0.01 >0.001 0 0 0(a few times per year) (once every few years) (has never occurred) (has never occurred) (has never occurred)
0 Low >0.1 >0.01 >0.001 0 0(at least weekly) (a few times per year) (once every few years) (has never occurred) (has never occurred)
0.5 Low to >0.3 >0.03 >0.003 <0.001 0moderate (a few times per week) (monthly) (yearly) (may have happened once) (has never occurred)
1 Moderate >1 >0.1 >0.01 >0.001 0(at least daily) (at least weekly) (a few times a year) (once every few years (has never occurred)
1.5 Moderate >3 >0.3 >0.03 >0.003 <0.001to high (a few a day) (a few times a week) (monthly) (yearly) (may have happened once)
2 High >10 >1 >0.1 >0.01 >0.001(more than 10 a day) (at least daily) (at least weekly) (a few times a year) (once every few years)
2.5 High to >30 >3 >0.3 >0.03 >0.003very high (more than 30 a day) (a few a day) (a few times a week) (monthly) (yearly)
3 Very high >100 >10 >1 >0.1 >0.01(more than 100 a day) (more than 10 a day) (at least daily) (at least weekly) (a few times ayear)
3.5 Very high >300 >30 >3 >0.3 >0.03to extreme (more than 300 a day) (more than 30 a day) (a few aday) (a few times a week) (monthly)
4 Extreme >1000 >100 >10 >1 >0.1(more than 1000 a day) (more than 100 aday) (more than 10 per day) (at least daily) (at least weekly)
Table IV
SHS compared with relative seismic hazard and themagnitude of the largest event that may haveoccurred
SHS Relative Seismic Hazard Approximate Magnitudeof Largest Event
-2 Nil -2-1 Very Low -10 Low 01 Moderate +12 High +23 Very High +3
Seismic hazard in Western Australian mines
seismicity is being driven or caused by regionalinfluences, the local seismic data and the SHS may notreflect the regional influences.
➤ The SHS scale has been used extensively to investigateand describe seismic hazard for data sets with eventsof up to about Richter magnitude +3. The scale islargely untested for extreme levels of seismic hazardand seismic events greater than Richter magnitude +3.It is quite possible that rates of occurrence for seismicevents greater than Richter magnitude +3 may notconform to the SHS scale. Events of this magnitude arecommonly related to regional seismic sourcemechanisms rather than local seismic sourcemechanisms. Many authors have reported non-self-similar behaviour of large seismic events, suggestingthat the mechanisms of large events may befundamentally different from smaller events, i.e. forRichter magnitude ≥ +39–11. Under these circumstances,the SHS methodology could lead to erroneous estimatesof seismic hazard.
➤ The basic premise of the SHS scale is that theoccurrence of seismicity closely follows a power lawwith an exponent (b-value) of 1.0. In most cases, thisis a reasonable assumption. Multimodal data setscontaining very large seismic events and bi-linearGutenberg-Richter relations have been observed partic-ularly in South African mines9–11. The SHS scale isdependent on a well-behaved Gutenberg-Richterrelation. To date, there is little evidence of multimodalbehaviour of large seismic events recorded in westernAustralian mines.
➤ In this paper, SHS is a measure of the past seismicitythat has occurred in the mine. Past seismic response tomining is often used to estimate future seismicresponse. However, future seismic hazard is notguaranteed to be related to past seismic hazard. This isparticularly true if the mechanisms or driving forces offuture seismicity are different from those of pastseismicity. Extrapolation and forecasting using the SHSscale may be unwarranted if the rock mass conditions,or mining influences of future seismicity are signifi-cantly different from past seismicity. This may occur
for a number of reasons, including changing geologicalenvironment, changes in mining method or miningsequence, or owing to the maturing of a miningoperation potentially changing the regionalloading/unloading system stiffness.
➤ An adequate seismic record is necessary. If there arefew seismic events, or the monitoring period is brief, orthere are extended periods of seismic systemdowntime, the seismic record may be inadequate toapply the SHS to evaluate seismic hazard.
Applying the seismic hazard scale
Mine seismicity surveyIn 2002, a survey was created to investigate the occurrenceand severity of mine seismicity5. The 148-question surveywas circulated to 135 underground, mechanized, hardrockmines in 18 countries. The intent of the survey was toidentify and better understand the geotechnical, geologicaland mining factors conducive to mine seismicity specificallyin underground, mechanized, hardrock mines.
Using the mine seismicity survey to evaluate seismichazardThere are six questions in the mine seismicity survey thatcan be used to evaluate the seismic hazard (SHS):
Question 105 – Do underground workers report rocknoise?
Question 106 – Does the ground work (pop, crackle,snap, bang) for more than a few hoursafter development blasting, or afterstope blasting?
Question 107 – Are seismic events felt throughout themine, with a vibration similar to asecondary blast?
Question 108 – Are large seismic events felt throughoutthe mine and on surface similar to adevelopment blast?
Question 109 – Are large seismic events felt throughoutthe mine and on surface, with similarvibrations to a large stope blast?
Question 110 – Are large events in the mine detectedby the Geological Survey (generally >Richter magnitude +2)?
Each of the survey questions relating to seismic hazard isgiven a response from 1 to 9, where: 1 = Has never occurred,2 = Every few years, 3 = Yearly, 4 = A few times per year, 5 =Monthly, 6 = Weekly, 7 = A few times per week, 8 = Daily, 9 = I don’t know.
Table V combines the survey responses, and utilizes theSHS definition in Table III, to estimate SHS for each minesite.
Effectively, the survey respondent was asked 6 times fordata that can be used to evaluate SHS. If the power lawfrequency-magnitude relation holds true, the response of thesix questions should give the same SHS. So, although theremay be a level of inaccuracy in the response of any onequestion (also given the assumptions stated above), theresponses for the six questions give an overall estimate ofseismic hazard.
For the data collected in the mine seismicity survey, itwas found that the responses for the six questions gave areasonably consistent SHS, with the typical SHS range foreach mine rarely varying more than 1.
▲
268 JUNE 2004 The Journal of The South African Institute of Mining and Metallurgy
Figure 2—Seismic data from a Western Australian mine in which theseismic system has a limited dynamic range and saturates at aboutRichter magnitude 1.0. The SHS for this data set is calculated to beabout 2.0
Comparing the mine seismicity survey results with seismicmonitoring data
Seismic monitoring data were available for a number of thecase histories in the mine seismicity survey. Figure 3compares SHS evaluated from the mine seismicity surveywith the largest Richter magnitude event recorded in theseismic data.
The dashed line represents the ideal situation, in whichSHS is equal to the largest event recorded. Figure 3 showsthat SHS is usually within an order of magnitude of themaximum event recorded (grey zone in Figure 3). This is agood result considering the SHS is evaluated using the semi-quantitative survey questions, and without the use of theseismic monitoring data. It adds further confidence that theSHS scale and its method of calculation in the mineseismicity survey is a good estimate of the maximum eventsize expected from a mining block.
Seismic hazard in 72 underground, mechanized, hardrockmines
The Seismic Hazard Scale rating for the 72 mines in thesurvey is summarized in Figure 4. It was found that mineswith seismicity and rockbursting problems were moreinterested in the survey, and more likely to complete it.Consequently, the relative proportion of seismically activecase histories in Figure 4 is an over estimation of thefrequency of occurrence of seismicity in underground,mechanized, hardrock mines.
A total of 135 operating mines were approached tocomplete the mine seismicity survey. The mines that were
approached for the survey were chosen with no regard to thelevel of seismicity in the mine. There were 30 mines thatreported having at least one mining block with a high level ofseismicity (SHS ≥ 2). If we assume that most of the mineswith high levels of seismicity and rockbursting completed thesurvey, this would suggest that the frequency of occurrenceof high seismic hazard (SHS ≥ 2) in underground,mechanized, hardrock mines is about 30/135, or about 22%.
A total of 27 operating mines in Western Australian wereapproached to complete the survey. Nine of the 21 mines thatresponded had a high seismic hazard (SHS ≥ 2). If weassume that most of the mines with high levels of seismicityand rockbursting completed the survey, this would suggestthat the frequency of occurrence of high seismic hazard (SHS≥ 2) in underground, mechanized, hardrock mines is about9/27, or about 33%. The incidence of high seismic hazardappears to be somewhat greater in western Australiacompared with underground, mechanized, hardrock mineselsewhere in the world.
Minewide seismic hazard
The SHS scale can be used in conjunction with data fromseismic monitoring systems to estimate seismic hazard andmaximum event size.
The Seismic Hazard Scale (SHS) was compared with datafrom 11 mines with seismic monitoring systems in Australia.Table VI compares:
➤ the monitoring period of the seismic system➤ the number of seismic events recorded➤ the Gutenberg-Richter b-value of the seismicity in the
mine
Seismic hazard in Western Australian mines
▲269The Journal of The South African Institute of Mining and Metallurgy JUNE 2004
Table V
Mine seismicity survey questions used to estimate seismic hazard
Evaluating SHS
Survey Q105, Q106 Q107 Q108 Q109 Q110question
Qualitative Felt locally Felt in a few parts of Felt weakly on Felt strongly on Detected by regionaldescription a mine, like a surface, like a surface, like earthquake network
secondary blast development blast a large stope blast
Approx. ML > = -2 ML > = -1 ML > = 0 ML > = +1 ML > = +2 SHS Qualitative
Richter scale seismic hazardmagnitude description
2 (every few years) 1 (has never occurred) 1 (has never occurred) 1 (has never occurred) 1 (has never occurred) -2 Nil
4 (a few times a year) 2 (every few years) 1 (has never occurred) 1 (has never occurred) 1 (has never occurred) -1 Very low
6 (weekly) 4 (a few times a year) 2 (every few years) 1 (has never occurred) 1 (has never occurred) 0 Low
7 (a few per week) 5 (monthly) 3 (yearly) 1 (has never occurred) 1 (has never occurred) 0.5 Low to moderate
8 (daily) 6 (weekly) 4 (a few times a year) 2 (every few years) 1 (has never occurred) 1 Moderate
7 (a few a week) 5 (monthly) 3 (yearly) 1 (has never occurred) 1.5 Moderate tohigh
8 (daily) 6 (weekly) 4 (a few times a year) 2 (every few years) 2 High
7 (a few a year) 5 (monthly) 3 (yearly) 2.5 High to very high
8 (daily) 6 (weekly) 4 (a few times a year) 3 Very high
7 (a few a week) 5 (monthly) 3.5 Very high toextreme
8 (daily) 6 (weekly) 4 Extreme
Seismic hazard in Western Australian mines
➤ the largest Richter magnitude event recorded in themine during the monitoring period
➤ the average and maximum SHS calculated fromEquation [4] and calculated for seismic events with 0.5magnitude increment equal or greater than 0, and
assuming b=1.0.The largest Richter magnitude event recorded for each
mine in Table VI is compared with the maximum SHS (Figure5). There is a good agreement between the maximum SHSand the maximum event size, with the maximum SHS
▲
270 JUNE 2004 The Journal of The South African Institute of Mining and Metallurgy
Figure 3—SHS (determined using the mine seismicity survey questions) compared with the largest event recorded in the mining block. The dashed linerepresents the SHS equal to the largest event recorded. The grey zone represents a maximum event size within 1 magnitude unit of the SHS
Figure 4—The range of Seismic Hazard Scale (SHS) for the 72 mines in the mine seismicity survey. There were 21 Western Australian mines thatresponded to the survey
4.0
3.5
3.0
2.5
2.0
1.5
1.0
0.5
0.0-2 -1 0 1 2 3 4
Seismic Hazard Scale (SHS)
SHS = -2 : No Seismicity SHS = 1.5 : Moderate-High Seismic HazardSHS = -1 : Very Low Seismic Hazard SHS = 2 : High Seismic HazardSHS = 0 : Low Seismic Hazard SHS = 2.5 : High-Very High Seismic HazardSHS = 0.5 : Low-Moderate Seismic Hazard SHS = 3 : Very High Seismic HazardSHS = 1 : Moderate Seismic Hazard SHS = 3.5 : Very High-Extreme Seismic Hazard
Max
imu
m E
ven
t M
agn
itu
de
Rec
ord
ed
20
18
16
14
12
10
0
6
4
2
0-2 -1 0 0.5 1 1.5 2 2.5 3 3.5 4
Seismic Hazard Scale (SHS)
100%
90%
80%
70%
60%
50%
40%
30%
20%
10%
0%
WA MinesMines Outside WAPer cent of All Mines
SHS = -2 : No Seismicity SHS = 1.5 : Moderate-High Seismic HazardSHS = -1 : Very Low Seismic Hazard SHS = 2 : High Seismic HazardSHS = 0 : Low Seismic Hazard SHS = 2.5 : High-Very High Seismic HazardSHS = 0.5 : Low-Moderate Seismic Hazard SHS = 3 : Very High Seismic HazardSHS = 1 : Moderate Seismic Hazard SHS = 3.5 : Very High-Extreme Seismic Hazard
Nu
mb
er o
f C
ase
His
tori
es
Cu
mu
lati
ve %
of
Cas
e H
isto
ries
averaging 0.2 magnitude units greater than the largest eventrecorded in the mine. The maximum SHS appears to be areasonable upper bound to the maximum event size recordedin each mine. The data in Table VI also suggests that the SHSfor each of the magnitude ranges gives a reasonable estimateof the maximum event size, with the exception of Mine 8.
The slope of the Gutenberg-Richter frequency-magnituderelation (b-value) is often considered a good estimator ofseismic hazard. The data in Table VI suggest that b-value isinsensitive to seismic hazard and does not correlate well withthe maximum event size recorded in the mine (Figure 6).
Some mines use the total number of events in a timeperiod (such as number of events ar day, or events a month)as an indicator of seismic hazard. The yearly number ofevents recorded by seismic systems in 11 Australian mines iscompared with the maximum event size in Figure 7. The totalnumber of events recorded is a poor indicator of maximumevent size and a poor measure of seismic hazard.
Seismic hazard in a mining block
Seismic hazard varies spatially in a mine. It is stronglyinfluenced by geological, stress and mining factors, all ofwhich vary considerably throughout the mine. It is a conser-vative assumption to presume that the maximum seismichazard in a mine is an adequate measure of seismic hazard
for all of the regions of a mine. Even in very seismicallyactive mines, there will be many regions with relatively lowseismic hazard. From a seismic risk management perspective,knowing the spatial distribution of seismic hazard allowsseismic risk management control measures to focus on theareas of highest risk.
Seismic hazard in Western Australian mines
▲271The Journal of The South African Institute of Mining and Metallurgy JUNE 2004
Table VI
Seismic data from 11 Australian mines compared with the Seismic Hazard Scale
Mine Monitoring Number of b-value Magnitude of Seismic hazard scale (SHS) Ave. Maxperiod events largest for magnitude equal or greater than SHS SHS(years) recorded event recorded 0 0.5 1 1.5 2 2.5 3 3.5
Figure 5—Comparison of maximum SHS to the maximum magnitudeevent recorded in minewide data sets from 11 Australian mines
Figure 6—Comparison of b-value with the maximum event sizerecorded in 11 Australian mines
Figure 7—Comparison of the yearly number of events recorded in amine with the maximum event size recorded in the mine
Table VII
Comparison of mine seismicity in mining blocks in several Western Australian mines
Mine Monitoring Number of b-value Magnitude of Max Seismic hazard scale (SHS) Max Ave.block period events largest SHS for magnitude equal or greater than SHS SHS
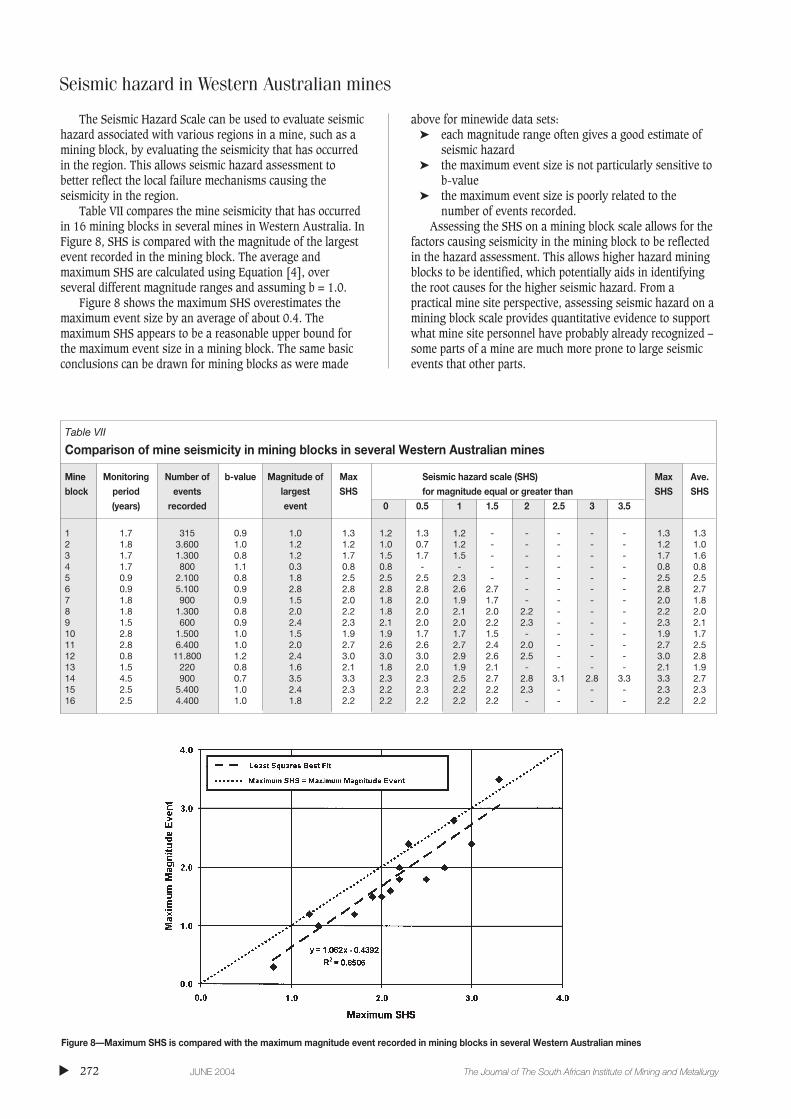
The Seismic Hazard Scale can be used to evaluate seismichazard associated with various regions in a mine, such as amining block, by evaluating the seismicity that has occurredin the region. This allows seismic hazard assessment tobetter reflect the local failure mechanisms causing theseismicity in the region.
Table VII compares the mine seismicity that has occurredin 16 mining blocks in several mines in Western Australia. InFigure 8, SHS is compared with the magnitude of the largestevent recorded in the mining block. The average andmaximum SHS are calculated using Equation [4], overseveral different magnitude ranges and assuming b = 1.0.
Figure 8 shows the maximum SHS overestimates themaximum event size by an average of about 0.4. Themaximum SHS appears to be a reasonable upper bound forthe maximum event size in a mining block. The same basicconclusions can be drawn for mining blocks as were made
above for minewide data sets: ➤ each magnitude range often gives a good estimate of
seismic hazard➤ the maximum event size is not particularly sensitive to
b-value➤ the maximum event size is poorly related to the
number of events recorded.Assessing the SHS on a mining block scale allows for the
factors causing seismicity in the mining block to be reflectedin the hazard assessment. This allows higher hazard miningblocks to be identified, which potentially aids in identifyingthe root causes for the higher seismic hazard. From apractical mine site perspective, assessing seismic hazard on amining block scale provides quantitative evidence to supportwhat mine site personnel have probably already recognized –some parts of a mine are much more prone to large seismicevents that other parts.
▲
272 JUNE 2004 The Journal of The South African Institute of Mining and Metallurgy
Figure 8—Maximum SHS is compared with the maximum magnitude event recorded in mining blocks in several Western Australian mines
Seismic hazard in a cluster of seismic events
Well-located seismic events often exhibit strong spatialclustering12–14. It is proposed that each cluster of seismicevents potentially represents a separate seismic sourcemechanism, as determined by a unique local combination ofstress, structure and mining influences. The magnitudedistribution of seismic events that occur at each seismicsource is dominated by the local failure mechanism.
The SHS can be extrapolated to individual clusters ofseismic events in a mine. Conceptually, each cluster ofseismic events represents a local rock mass failure processoccurring in the mine. Typical failure processes include pillarsdeforming or failing owing to increased average load or dueto loss of confinement, faults displacing, abutments of stopesresponding to stress increase in nearby stoping, etc.
Seismic events from a Western Australian mine areshown on a mine plan in Figure 9. The SHS is applied toclusters of events on a mine plan to create a seismic hazardmap (Figure 10). The data in Figure 10 suggest a higher
seismic hazard near two of the geological features (A and B).Several unpublished case studies of seismic data from
Western Australian mines have found that this seismichazard mapping technique is very effective in understandingspatial variations in seismicity15. It identifies areas of highseismic hazard, as well as areas of low seismic hazard. Itfacilitates interpreting the sources of high hazard by spatialcomparison to geological features, mining structures andhigh stress zones. It is much easier to identify controlmeasures to manage seismic risk when the high-risk areasand the root causes of the high hazard have been identified.
Some of the assumptions associated with seismic hazardmapping by cluster include:
➤ seismic data must be sufficiently well located toidentify clusters of events reliably
➤ seismic hazard is considered to be constant at allpoints within a cluster of seismic events
➤ there must be an adequate seismic record, so that theseismic data adequately reflects the seismic response ateach source of seismic activity.
Seismic hazard in Western Australian mines
▲273The Journal of The South African Institute of Mining and Metallurgy JUNE 2004
Figure 9—Events near a level in a Western Australian mine. The four thin lines (A B C D) represent the location of geological features in the mine
Figure 10—Clusters of events near a level in a mine related to the events in Figure 9. The events are displayed according to the seismic hazard assessed tothe cluster using the Seismic Hazard Scale. The number following the name represents the largest event expected in the cluster
Low (0) Low to Moderate (0.5) Moderate Moderate to High (1.5) High (2)
Seismic hazard in Western Australian mines
Temporal variations in seismic hazardIn the detailed analysis of data on Western Australian mines,it has been found that mines prone to large seismic eventsalmost always have a significant history of smaller andmoderate sized events prior to the large events. Thisobservation is based on detailed analysis of seismicity atseveral mines in Western Australia15. If the power law withrespect to mine seismicity holds true, the frequency ofoccurrence of smaller events could be used as an indicator ofthe maximum event that could occur.
Examples of seismicity in a mining block and a stopingblock in two Australian mines are shown with magnitudetime history charts in Figure 11 and Figure 12. In Figure 11,an incomplete seismic event record is shown for a severalmillion ton mining block (significant seismicity pre-dated theinstallation of the seismic system in May 1994). Figure 12shows the complete seismic record for a several hundredthousand ton stoping block. The occurrence of seismic eventsin both charts is shown as diamond shaped symbols. The
average and maximum SHS (calculated from Equation [4]and using several magnitude ranges) is shown as lines inFigures 11 and 12. In the cases of both the mining block andstoping block, the rate of occurrence of smaller events oftensuggests the occurrence of larger events, before the largerevents occur.
Table VIII shows the occurrence of increasing event sizein the two examples in Figures 11 and 12. At the time ofoccurrence of an event larger than has been previouslyrecorded in the mining and stoping block, the maximum SHSoften gave a good indication of the future event magnitude.For example, in the first row in Table VIII, on 5 July 1994, aRichter magnitude +0.3 event occurred. Prior to this event,the largest event that had occurred in the mining block wasRichter magnitude 0.0. Based on the seismic history prior to5 July 1994, the average SHS was 0.5 and the maximum SHSwas 0.7. In 10 of the 13 cases in Table VIII, the maximumSHS is an indicator of the maximum magnitude of the nextlarge event.
▲
274 JUNE 2004 The Journal of The South African Institute of Mining and Metallurgy
Figure 11—Magnitude time history chart for seismicity in a several million ton mining block in an Australian mine. The time of occurrence of seismic eventsis shown with diamond symbols, while the average and maximum SHS are shown with lines
Figure 12—Magnitude time history chart for seismicity in a several hundred thousand ton stoping block in an Australian mine
The data in Figure 11 and Table VIII also suggest that acomplete seismic history may not be necessary to obtain areasonable estimate of seismic hazard. This implies that ifthere is an adequate monitoring period for the smallerseismic events to reflect the seismic hazard, the frequency ofoccurrence of the smaller events may give a good indicationof long-term seismic hazard potential.
The SHS scale can also be used to investigate temporalchanges for individual clusters of seismic events. Resultsfrom analysis of numerous clusters of seismic events givecomparable results to those found in Figure 11, Figure 12,and Table VIII.
SummaryThe Seismic Hazard Scale (SHS) is a measure built aroundthe Gutenberg-Richter frequency-magnitude relation of mineseismicity. Essentially, SHS is the x-axis intercept of therelation. SHS is strongly related to the frequency ofoccurrence of events of a given magnitude. It is also highlydependent upon a well-behaved frequency-magnituderelation. The data analysed show relative insensitivity to b-value. This suggests that calculating b-value is oftenunnecessary and that it may be reasonable to set b = 1.0.
The SHS is meaningful and useful on three scales ofseismicity: minewide, for a mining block, and on a seismicevent cluster basis. It can potentially be used for seismichazard estimation for data sets of less than 1000 events, andfor time periods as short as several months.
The SHS can be used to estimate seismic hazard withoutthe availability of seismic data, as demonstrated through themine seismicity survey.
There is value in using the SHS to investigate temporalchanges in seismicity. It has been demonstrated that the rateof occurrence of small- and medium-size seismic events oftengives a good indication of long-term seismic hazard potential.
This work shows that, in Western Australian mines, theapplication of the Gutenberg-Richter relation can be veryuseful to understand general seismic hazard as well asspatial variations and temporal increases in seismic hazard.
Acknowledgements
Funding for the work in this paper was provided by the Mine
Seismicity and Rockburst Risk Management research projectat the Australian Centre for Geomechanics. This researchproject was financially supported by:
➤ Barrick Gold of Australia➤ Gold Fields Australia Pty Ltd➤ Harmony Gold Australia Ltd➤ Independence Gold NL➤ Kalgoorlie Consolidated Gold Mines Pty Ltd➤ Minerals and Energy Research Institute of Western
Australia➤ Placer Dome Asia Pacific➤ Sons of Gwalia Limited➤ WMC Resources Limited.
The ACG is greatly indebted to the tremendous sevenyears of continuous funding provided by many of the mineseismicity research sponsors.
The authors thank Chris Langille for numerous commentsand suggestions that improved this paper.
References
1. BRINK, A.V.Z., HAGAN, T.O., SPOTTISWOODE, S.M., MALAN, D.F., GLAZER, S.,and LASOCKI, S. Survey and assessment of techniques used to quantify thepotential for rock mass instability. SIMRAC report on project GAP 608.Johannesburg. 2001.
2. KIJKO, A. Keynote lecture: Seismic hazard assessment in mines.Proceedings 4th International Symposium on Rockburst and Seismicity inMines. Gibowicz, S.J. and Lasocki, S. (eds.), A.A. Balkema, 1997, pp. 247–256.
3. MENDECKI, A.J. Seismic Monitoring in Mines. Chapman and Hall, 1997.
4. KIJKO, A., LASOCKI, S., and GRAHAM, G. Non-parametric seismic hazard inmines. Pure and Applied Geophysics, vol. 158, 2001, pp. 1655–1675.
5. HUDYMA, M.R. Mining-Induced Seismicity in Underground, Mechanised,Hardrock Mines—Results of a World Wide Survey. Australian Centre forGeomechanics Research Report, 2004.
6. KIJKO, A. and FUNK. C.W. The assessment of seismic hazards in mines.Journal of the South African Institute of Mining and Metallurgy, 1994 pp. 179–185.
7. GUTENBERG, B. and RICHTER, C.F. Frequency of earthquakes in California,Bulletin of the Seismological Society of America, vol. 34, 1944 pp. 185–188.
8. POTVIN, Y. and HUDYMA, M.R. Keynote Address: Seismic Monitoring inHighly Mechanised Hardrock Mines in Canada and Australia. Proceedings5th International Conference on Rockburst and Seismicity in Mines. vanAswegen, G., Durrheim, R.J., Ortlepp, W.D. (eds.), South African Instituteof Mining and Metallurgy. Johannesburg, 2001. pp. 267–280.
9. GIBOWICZ, S.J. and KIJKO, A. An introduction to mining seismology. SanDiego: Academic Press, 1994.
10. FINNIE, G.J. Some statistical aspects of mining induced seismic events.Proceedings of SARES99, 2nd South African Rock EngineeringSymposium. T.O. Hagan (ed.). Johannesburg. 1999. pp. 132–139.
11. AMIDZIC, D. Energy-moment relation and its application. In Proceedings5th International Conference on Rockbursts and Seismicity in Mines. vanAswegen, G., Durrheim, R.J., Ortlepp, W.D. (eds.), South African Instituteof Mining and Metallurgy. Johannesburg, 2001. pp. 509–513.
12. HUDYMA, M.R., MIKULA, P.A., and OWEN M. Seismic Hazard Mapping atMount Charlotte Mine. Proceedings of the 5th North American RockMechanics Symposium. Hammah, R., Bawden, W.F., Curran, J., andTelesnicki, M. (eds.), University of Toronto Press. 2002. pp. 1087–1094.
13. LESLIE, I. and VEZINA, F. Seismic data analysis in underground miningoperations using ESG’s Hyperion systems. Proceedings of the 16th QuebecMining Association Ground Control Colloque, Val D'Or. 2001.
14. KIJKO, A., FUNK, C.W., and BRINK, A.V.Z. Identification of anomalouspatterns in time-dependent mine seismicity. Rockbursts and Seismicity inMines, Young, R.P. (ed.). Rotterdam, Balkema. 1993, pp. 205–210.