Page 1
SEISMIC HAZARD ZONE REPORT 113
SEISMIC HAZARD ZONE REPORT FOR THE
SAN MATEO 7.5-MINUTE QUADRANGLE,
SAN MATEO COUNTY, CALIFORNIA
2018
DEPARTMENT OF CONSERVATION
California Geological Survey
STATE OF CALIFORNIA
EDMUND G. BROWN, JR.
GOVERNOR
THE RESOURCES AGENCY
JOHN LAIRD
SECRETARY FOR RESOURCES
DEPARTMENT OF CONSERVATION
DAVID BUNN
DIRECTOR
CALIFORNIA GEOLOGICAL SURVEY
JOHN G. PARRISH, PH.D.
STATE GEOLOGIST
Page 2
Copyright © 2018 by the California Department of Conservation. All rights reserved. No part of this publication may be reproduced without written consent of the Department of Conservation.
The Department of Conservation makes no warrantees as to the suitability of this product for any particular purpose.
Page 3
How to view or obtain Earthquake Zones of Required Investigation
California Geological Survey (CGS) maps of Earthquake Zones of Required Investigation, which
include Seismic Hazard Zones, and Earthquake Fault Zones; their related reports, and GIS data
are available for download and online viewing on the CGS Information Warehouse: http://maps.
conservation.ca.gov/cgs/informationwarehouse/.
These maps and reports are also available for purchase and reference at the CGS office in
Sacramento at the address presented below, or online at: http://www.conservation.ca.gov/cgs/
information/publications/Pages/ordering.aspx.
All Earthquake Zones of Required Investigation are available as a WMS service here: https://
spatialservices.conservation.ca.gov/arcgis/rest/services/CGS_Earthquake_Hazard_Zones.
This Seismic Hazard Zone Report documents the data and methods used to construct the Seismic
Hazard Zone map for the 7.5-minute quadrangle evaluated for earthquake-induced liquefaction
and landslide hazards. The information contained in this report should be helpful to site
investigators and local government reviewers of geotechnical reports.
Information regarding the Seismic Hazard Zonation Program with links to the Seismic Hazards
Mapping Act and the Alquist-Priolo Earthquake Fault Zoning Act are available on the CGS
website: http://www.conservation.ca.gov/cgs/shzp/Pages/Index.aspx.
CALIFORNIA GEOLOGICAL SURVEY'S PUBLICATION SALES OFFICE:
Publications and Information Office
801 K Street, MS 14-34
Sacramento, CA 95814-3531
(916) 445-5716
Page 5
SHZR 113 SEISMIC HAZARD ZONATION OF THE SAN MATEO QUADRANGLE i
TABLE OF CONTENTS
EXECUTIVE SUMMARY ...................................................................................................... v THE CALIFORNIA SEISMIC HAZARDS MAPPING PROGRAM ................................... vi
SECTION 1: EVALUATION REPORT FOR LIQUEFACTION HAZARD ........................ 1
INTRODUCTION ................................................................................................................ 1 Purpose .............................................................................................................................. 1 Background ........................................................................................................................ 2 Methodology ...................................................................................................................... 2 Scope and Limitations ....................................................................................................... 3
PART I: GEOGRAPHIC AND GEOLOGIC SETTING ..................................................... 3
PHYSIOGRAPHY ................................................................................................................ 3 Location ............................................................................................................................. 3
Land Use ............................................................................................................................ 4 GEOLOGY ........................................................................................................................... 4
Bedrock Units .................................................................................................................... 5
Quaternary Sedimentary Deposits ..................................................................................... 5 Geologic Structure ............................................................................................................. 7
ENGINEERING GEOLOGY ............................................................................................... 7 Historic-High Groundwater Mapping ............................................................................... 8 Soil Testing ........................................................................................................................ 9
PART II: LIQUEFACTION HAZARD ASSESSMENT .................................................... 11
MAPPING TECHNIQUES ................................................................................................ 11
LIQUEFACTION SUSCEPTIBILITY ............................................................................... 11 GROUND SHAKING OPPORTUNITY ............................................................................ 12
LIQUEFACTION ANALYSIS .......................................................................................... 12 ZONATION CRITERIA: LIQUEFACTION ..................................................................... 13 DELINEATION OF SEISMIC HAZARD ZONES: LIQUEFACTION ............................ 14
Areas of Past Liquefaction .............................................................................................. 14 Artificial Fills .................................................................................................................. 14 Areas with Sufficient Existing Geotechnical Data .......................................................... 15 Areas with Insufficient Existing Geotechnical Data ....................................................... 15
ACKNOWLEDGMENTS .................................................................................................. 16
REFERENCES ................................................................................................................... 16
SECTION 2: EVALUATION REPORT FOR EARTHQUAKE-INDUCED LANDSLIDE
HAZARD ............................................................................................................ 20
INTRODUCTION .............................................................................................................. 20
Purpose ............................................................................................................................ 20 Background ...................................................................................................................... 21 Methodology .................................................................................................................... 21 Scope and Limitations ..................................................................................................... 22
Page 6
ii CALIFORNIA GEOLOGICAL SURVEY 2018
PART I: GEOGRAPHIC AND GEOLOGIC SETTING .................................................... 22
PHYSIOGRAPHY .............................................................................................................. 22 Location ........................................................................................................................... 22 Topography ...................................................................................................................... 23
Land Use .......................................................................................................................... 23 GEOLOGY ......................................................................................................................... 23
Bedrock Units .................................................................................................................. 24 Quaternary Sedimentary Deposits ................................................................................... 25 Geologic Structure ........................................................................................................... 26
Landslide Inventory ......................................................................................................... 26 ENGINEERING GEOLOGY ............................................................................................. 27
Geologic Material Strength ............................................................................................. 27 Existing Landslides.......................................................................................................... 29
Digital Terrain Data ......................................................................................................... 29
PART II: EARTHQUAKE-INDUCED LANDSLIDE HAZARD ASSESSMENT ........... 29
MAPPING TECHNIQUES ................................................................................................ 29 EARTHQUAKE-INDUCED LANDSLIDE SUSCEPTIBILITY ...................................... 30 GROUND SHAKING OPPORTUNITY ............................................................................ 30
EARTHQUAKE-INDUCED LANDSLIDE HAZARD POTENTIAL .............................. 31 ZONATION CRITERIA: EARTHQUAKE-INDUCED LANDSLIDES .......................... 31
DELINEATION OF SEISMIC HAZARD ZONES: EARTHQUAKE-INDUCED
LANDSLIDES .................................................................................................................... 32 Existing Landslides.......................................................................................................... 32
Hazard Potential Analysis ............................................................................................... 32 ACKNOWLEDGMENTS .................................................................................................. 32
REFERENCES ................................................................................................................... 33 APPENDIX A: SOURCES OF ROCK STRENGTH DATA............................................ 36
SECTION 3: GROUND SHAKING ASSESSMENT .............................................................. 37
INTRODUCTION .............................................................................................................. 37
Purpose ............................................................................................................................ 37 PROBABILISTIC SEISMIC HAZARD ANALYSIS MODEL ........................................ 38 APPLICATION TO LIQUEFACTION AND LANDSLIDE HAZARD ASSESSMENT 39 REFERENCES ................................................................................................................... 40
Page 7
SHZR 113 SEISMIC HAZARD ZONATION OF THE SAN MATEO QUADRANGLE iii
TABLES
Table 1.1. Quaternary units mapped in the San Mateo Quadrangle. .............................................. 7
Table 1.2. Liquefaction susceptibility of Quaternary units in the San Mateo Quadrangle. .......... 10
Table 2.1. Summary of the shear strength statistics for the San Mateo Quadrangle. ................... 28
PLATES
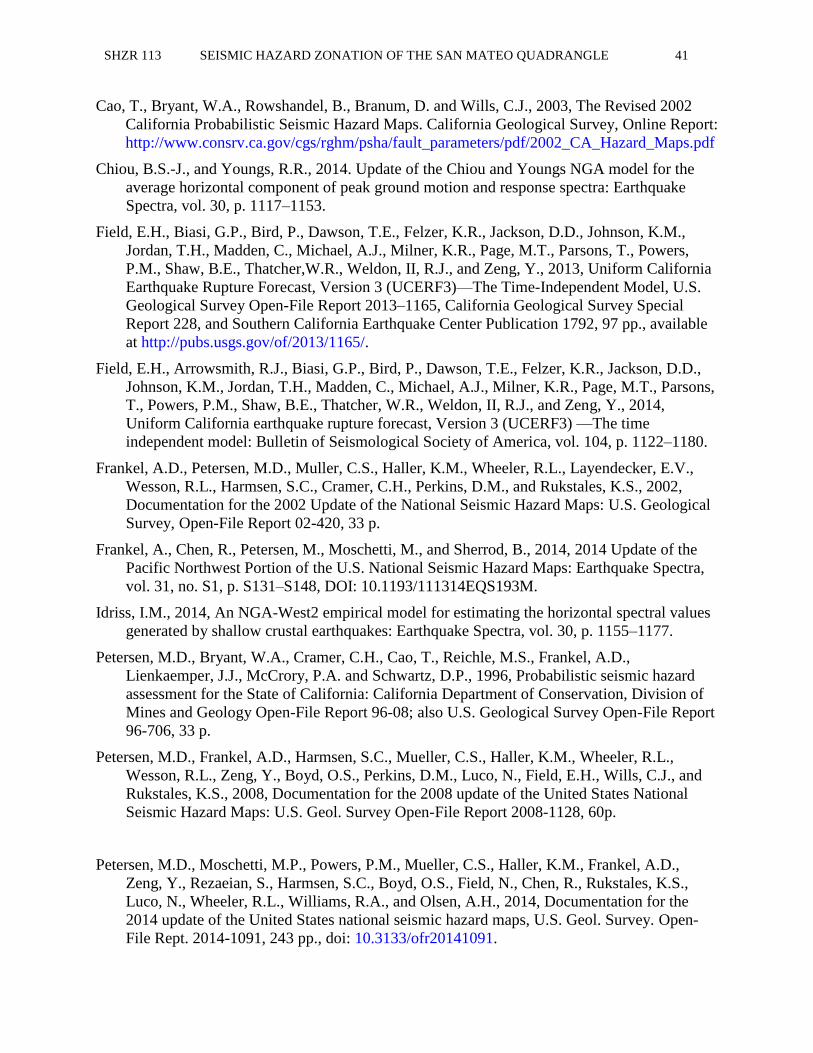
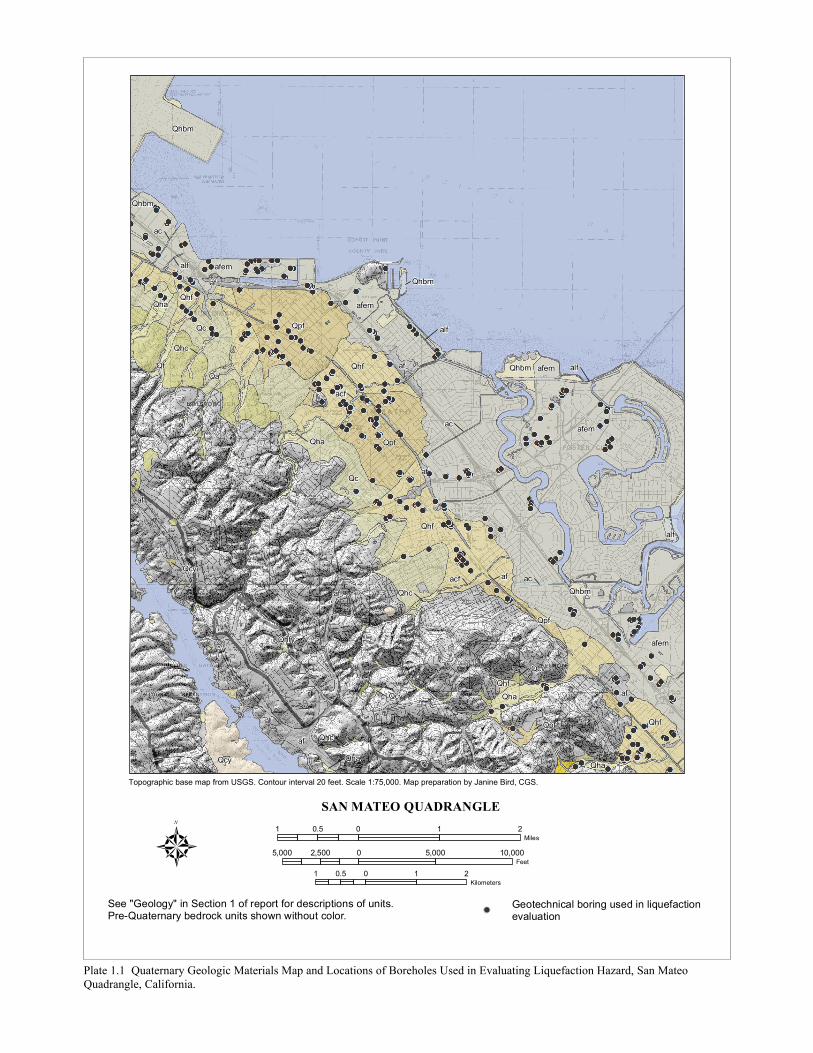
Plate 1.1. Quaternary Geologic Materials Map and Locations of Boreholes used in Evaluating
Liquefaction Hazard, San Mateo Quadrangle, California.
Plate 1.2 Depth to Historic-High Groundwater Levels in Quaternary Alluvial Deposits and
Ground Water Measurement Locations, San Mateo Quadrangle, California.
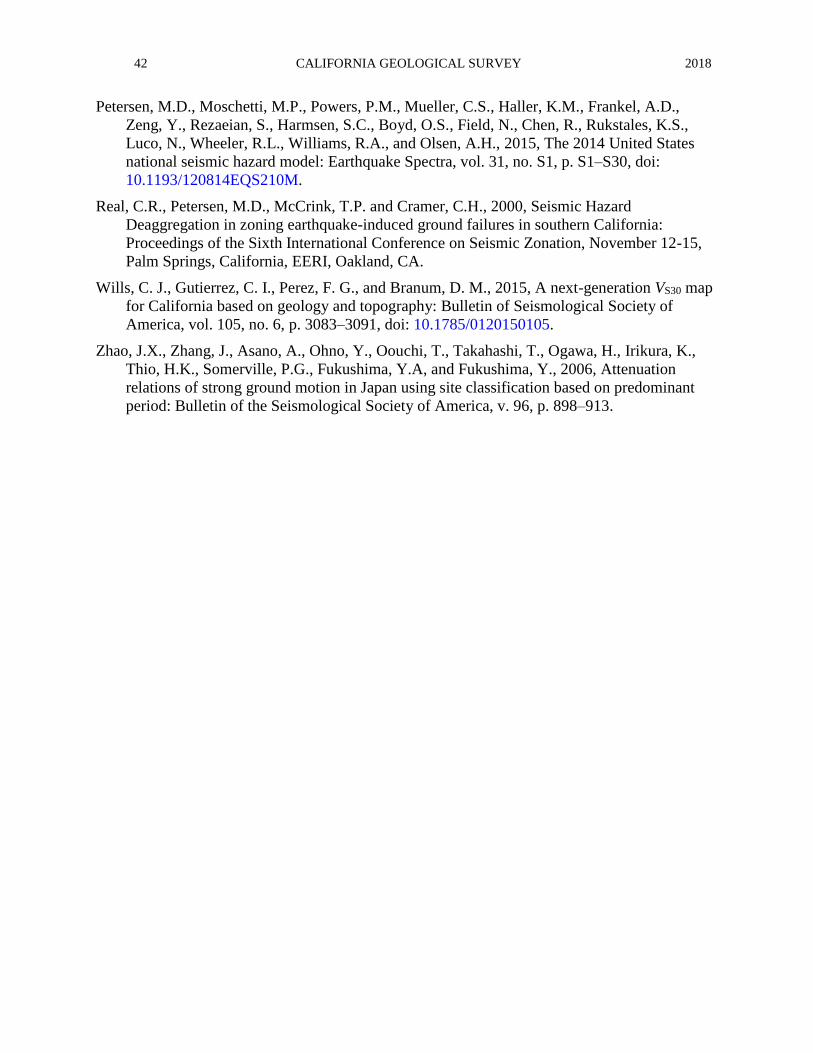
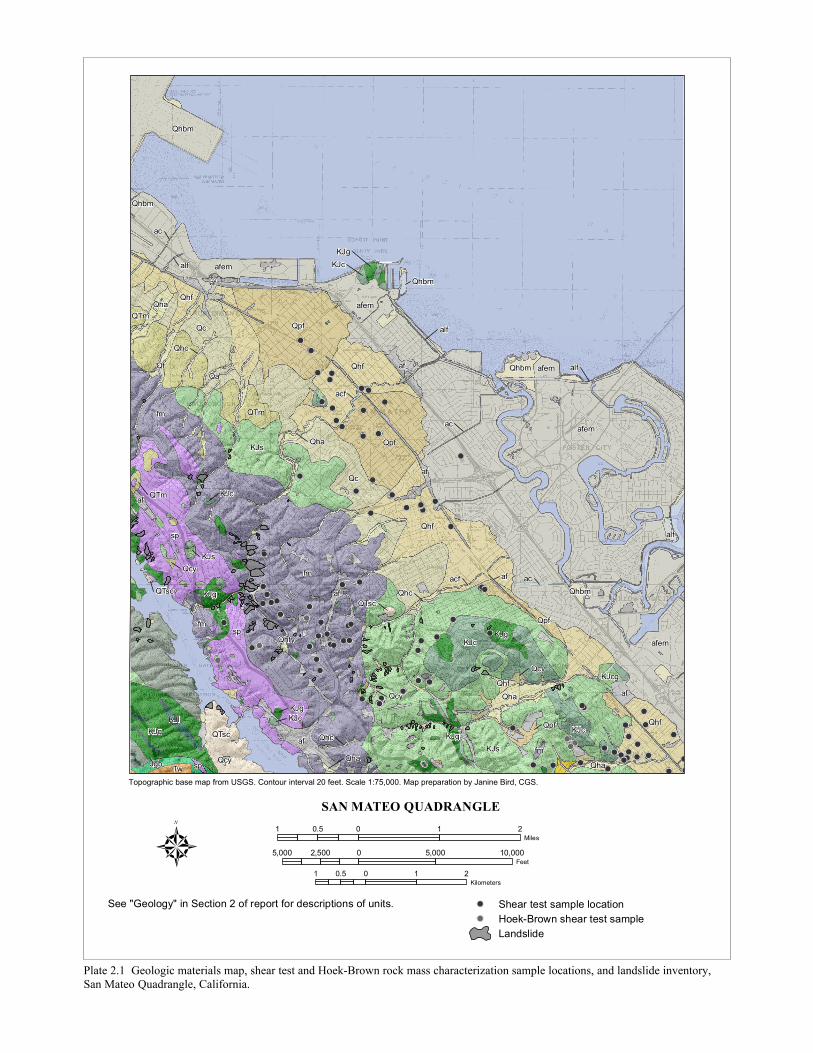
Plate 2.1. Geologic materials map, shear test and Hoek-Brown rock mass characterization
sample locations, and landslide inventory, San Mateo Quadrangle, California.
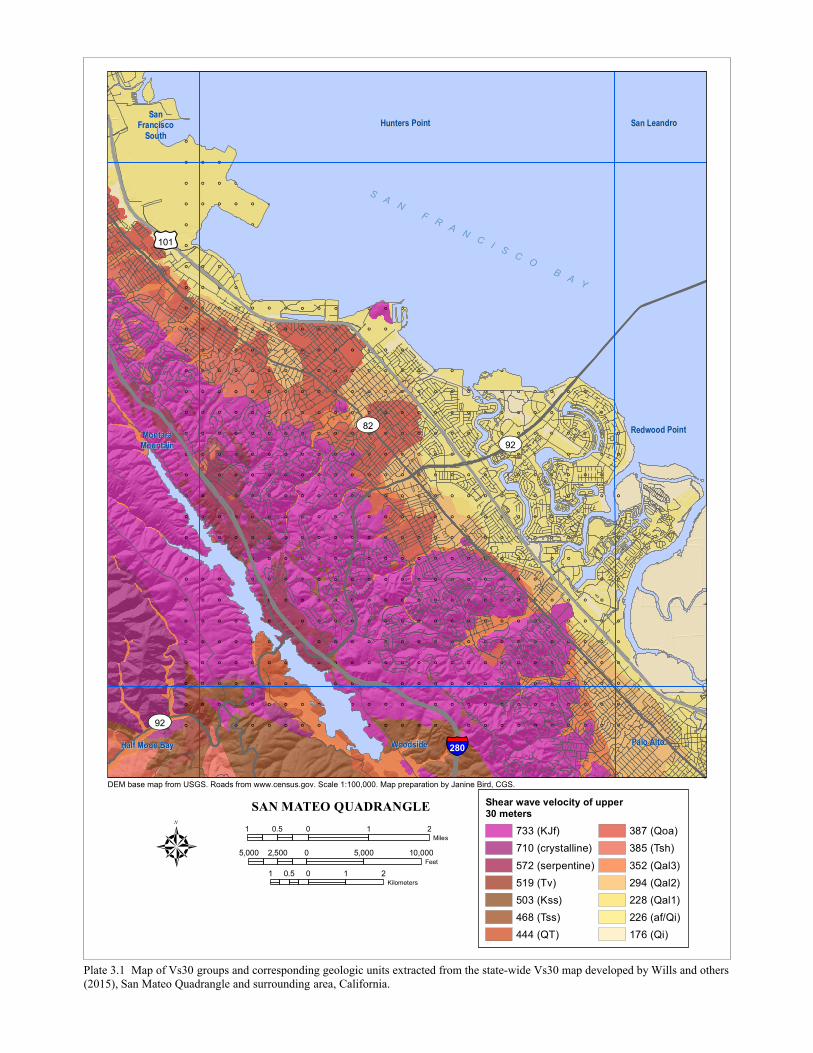
Plate 3.1. Map of VS30 groups and corresponding geologic units extracted from the state-wide
VS30 map developed by Wills and others (2015). San Mateo Quadrangle and
surrounding area, California. Qi, intertidal mud; af/Qi, artificial fill over intertidal
mud; Qal1, Quaternary (Holocene) alluvium in areas of low slopes (< 0:5%); Qal2,
Quaternary (Holocene) alluvium in areas of moderate slopes (0.5%–2.0%); Qal3,
Quaternary (Holocene) alluvium in areas of steep slopes (>2%); Qoa, Quaternary
(Pleistocene) alluvium; QT, Quaternary to tertiary (Pleistocene–Pliocene) alluvial
deposits; Tsh, tertiary shale and siltstone units; Tss, tertiary sandstone units; Tv,
tertiary volcanic units; serpentine, Serpentine; Kss, Cretaceous sandstone; KJf,
Cretaceous-Jurassic Franciscan complex rocks; crystalline, crystalline rocks.
Plate 3.2. Pseudo-PGA for liquefaction hazard mapping analysis, San Mateo Quadrangle and
surrounding area, California.
Plate 3.3. Probabilistic peak ground acceleration for landslide hazard mapping analysis, San
Mateo Quadrangle and surrounding area, California.
Plate 3.4. Modal magnitude for landslide hazard mapping analysis, San Mateo Quadrangle and
surrounding area, California.
Page 8
iv CALIFORNIA GEOLOGICAL SURVEY 2018
Release and Revision History: Seismic Hazard Zone Map and
Evaluation Report of the San Mateo Quadrangle, SHZR 113
August 17, 2017 Preliminary Map Release
January 11, 2018 Official Map Release
Page 9
SHZR 113 SEISMIC HAZARD ZONATION OF THE SAN MATEO QUADRANGLE v
EXECUTIVE SUMMARY
This report summarizes the methods and sources of information used to prepare the map of
Earthquake Zones of Required Investigation (EZRI) for liquefaction and earthquake-induced
landslides (also referred to as Seismic Hazard Zones) for the San Mateo 7.5-Minute Quadrangle,
San Mateo County, California. The topographic quadrangle map, which covers approximately
160 square kilometers (62 square miles) at a scale of 1:24,000 (41.7 mm = 1,000 meters; 1 inch =
2,000 feet), displays the boundaries of the EZRI for liquefaction and earthquake-induced
landslides. The map area includes developed areas along the western shores of San Francisco
Bay: the cities of Belmont, Burlingame, Foster City, Hillsborough, Redwood City, San Carlos,
San Mateo and a small section of the San Francisco International Airport. It also includes
undeveloped and protected areas in the Santa Cruz Mountains: the Crystal Springs watershed and
Golden Gate National Recreation Area.
Seismic Hazard Zone maps are prepared by the California Geological Survey (CGS) using
geographic information system (GIS) technology, which allows the manipulation of three-
dimensional data. Information analyzed in these studies includes topography, surface and
subsurface geology, borehole log data, recorded groundwater levels, existing landslide features,
slope gradient, rock-strength measurements, geologic structure, and probabilistic earthquake
shaking estimates. Earthquake ground shaking inputs are based upon probabilistic seismic
hazard analyses that depict peak ground acceleration, mode magnitude, and mode distance with a
10 percent probability of exceedance in 50 years.
About 42 square kilometers (16 square miles) of land in the San Mateo Quadrangle has been
designated EZRI for liquefaction hazard, encompassing much of the alluvial plain along the
shores of San Francisco Bay and extending along upland alluvial valleys dissecting the Santa
Cruz Mountains. Borehole logs of test holes drilled in these areas indicate the widespread
presence of near-surface soil layers composed of saturated, loose sandy sediments. Geotechnical
tests conducted downhole and in labs indicate that these soils generally have a moderate to high
likelihood of liquefying, given the level of strong ground motions this region could be subjected
to.
About 18 square kilometers (7 square miles) of land in the San Mateo Quadrangle has been
designated EZRI for earthquake-induced landslides, encompassing much of the steep sloped
highland of the Santa Cruz Mountains and mapped landslide features in the south western part of
the study area.
City, county, and state agencies are required by the California Seismic Hazards Mapping Act to
use the seismic hazard zone maps in their land-use planning and permitting processes. They
must withhold building permits for sites being developed within EZRI until the geologic and soil
conditions of the project site are investigated and appropriate mitigation measures, if any, are
incorporated into development plans. The Act also requires sellers of real property within these
zones to disclose that fact at the time such property is sold.
Page 10
vi CALIFORNIA GEOLOGICAL SURVEY 2018
THE CALIFORNIA SEISMIC HAZARDS MAPPING PROGRAM
The Seismic Hazards Mapping Act of 1990 (the Act) (Public Resources Code, Chapter 7.8,
Division 2) directs the State Geologist to prepare maps that delineate Seismic Hazard Zones, a
subset of Earthquake Zones of Required Investigation (EZRI), which include Earthquake Fault
Zones. The purpose of the Act is to reduce the threat to public safety and to minimize the loss of
life and property by identifying and mitigating seismic hazards. City, county, and state agencies
are directed to use the seismic hazard zone maps in their land-use planning and permitting
processes. They must withhold development permits for a site within a zone until the geologic
and soil conditions of the project site are investigated and appropriate mitigation measures, if
any, are incorporated into development plans. The Act also requires sellers (and their agents) of
real property within a mapped hazard zone to disclose at the time of sale that the property lies
within such a zone. Evaluation and mitigation of seismic hazards are to be conducted under
guidelines adopted by the California State Mining and Geology Board (SMGB) (California
Geological Survey, 2008). The text of these guidelines is online at: http://www.conservation.
ca.gov/cgs/shzp/webdocs/documents/sp117.pdf.
The Act directs SMGB to appoint and consult with the Seismic Hazards Mapping Act Advisory
Committee (SHMAAC) in developing criteria for the preparation of the seismic hazard zone
maps. SHMAAC consists of geologists, seismologists, civil and structural engineers,
representatives of city and county governments, the state insurance commissioner and the
insurance industry. In 1991, the SMGB adopted initial criteria for delineating seismic hazard
zones to promote uniform and effective statewide implementation of the Act. These initial
criteria, which were published in 1992 as California Geological Survey (CGS) Special
Publication 118, were revised in 2004. They provide detailed standards for mapping regional
liquefaction and landslide hazards. The Act also directed the State Geologist to develop a set of
probabilistic seismic maps for California and to research methods that might be appropriate for
mapping earthquake-induced landslide hazards.
In 1996, working groups established by SHMAAC reviewed the prototype maps and the
techniques used to create them. The reviews resulted in recommendations that 1) the process for
zoning liquefaction hazards remain unchanged and 2) earthquake-induced landslide zones be
delineated using a modified Newmark analysis. In April 2004, significant revisions of
liquefaction zone mapping criteria relating to application of historic-high groundwater level data
in desert regions of the state were adopted by the SMGB. These modifications are reflected in
the revised CGS Special Publication 118, which is available on online at: http://www.
conservation.ca.gov/cgs/shzp/webdocs/documents/sp118_revised.pdf.
This Seismic Hazard Zone Report summarizes the development of the Seismic Hazard Zone
Map for the San Mateo 7.5-Minute Quadrangle. The process of zonation for liquefaction hazard
involves an evaluation of Quaternary geologic maps, groundwater level records, and subsurface
geotechnical data. The process of zonation for earthquake-induced landslide hazard incorporates
evaluations of earthquake loading, existing landslides, slope gradient, rock strength, and geologic
structure. Ground motion calculations used by CGS exclusively for regional zonation
assessments are currently based on the probabilistic seismic hazard analysis (PSHA) model
developed by USGS for the 2014 Update of the United States National Seismic Hazard Maps
(NSHMs).
Page 11
SHZR 113 SEISMIC HAZARD ZONATION OF THE SAN MATEO QUADRANGLE 1
SECTION 1: EVALUATION REPORT FOR
LIQUEFACTION HAZARD
in the
SAN MATEO 7.5-MINUTE QUADRANGLE,
SAN MATEO COUNTY, CALIFORNIA
by
Maxime Mareschal P.G. 9495
and
Clifton W. Davenport P.G. 4366, C.E.G. 1455, H.G. 335
DEPARTMENT OF CONSERVATION CALIFORNIA GEOLOGICAL SURVEY
INTRODUCTION
Purpose
The Seismic Hazards Mapping Act of 1990 (the Act) (Public Resources Code, Chapter 7.8,
Division 2) directs the California State Geologist to compile maps that identify Seismic Hazard
Zones consistent with requirements and priorities established by the California State Mining and
Geology Board (SMGB) (California Geological Survey, 2004). The text of this report is
available online at: http://www.conservation.ca.gov/cgs/shzp/webdocs/documents/
sp118_revised.pdf.
The Act requires that site-specific geotechnical investigations be performed for most urban
development projects situated within seismic hazard zones before lead agencies can issue the
building permit. The Act also requires sellers of real property within these zones to disclose that
fact at the time such property is sold. Evaluation and mitigation of seismic hazards are to be
conducted under guidelines adopted by the California SMGB (California Geological Survey,
2008). The text of this report is online at: http://www.conservation.ca.gov/cgs/shzp/
webdocs/documents/sp117.pdf.
Following the release of the SMGB Guidelines, local government agencies in the Los Angeles
metropolitan region sought more definitive guidance in the review of geotechnical investigations
addressing liquefaction hazard. The agencies made their request through the Geotechnical
Engineering Group of the Los Angeles Section of the American Society of Civil Engineers
(ASCE). This group convened an implementation committee under the auspices of the Southern
California Earthquake Center (SCEC). The committee, which consisted of practicing
geotechnical engineers and engineering geologists, released an overview of the practice of
liquefaction analysis, evaluation, and mitigation techniques (Southern California Earthquake
Page 12
2 CALIFORNIA GEOLOGICAL SURVEY 2018
Center, 1999). This text is also online at: http://www-scec.usc.edu/resources/catalog/
hazardmitigation.html.
This section of the evaluation report summarizes seismic hazard zone mapping for potentially
liquefiable soils in the San Mateo 7.5-Minute Quadrangle. Section 2 (addressing earthquake-
induced landslide hazard) and Section 3 (addressing potential ground shaking) complete the
evaluation report, which is one of a series that summarizes seismic hazard zone mapping by CGS
in developing areas of the state where there is potential for strong ground motion (Smith, 1996).
Additional information on seismic hazards zone mapping in California can be accessed on
CGS’s web page: http://www.conservation.ca.gov/cgs/shzp/.
Background
Liquefaction-induced ground failure historically has been a major cause of earthquake damage in
northern California. During the 1989 Loma Prieta and 1906 San Francisco earthquakes,
significant damage to roads, utility pipelines, buildings, and other structures in the San Francisco
Bay area was caused by liquefaction-induced ground displacement.
Localities most susceptible to liquefaction-induced damage are underlain by loose, water-
saturated, granular sediment within 40 feet of the ground surface. These geological and
groundwater conditions are widespread in the San Francisco Bay Area, most notably in some
densely populated valley regions and alluviated floodplains. In addition, the potential for strong
earthquake ground shaking is high because of the many nearby active faults. The combination of
these factors constitutes a significant seismic hazard, including areas within the San Mateo
Quadrangle.
Methodology
CGS’s evaluation of liquefaction potential and preparation of Seismic Hazard Zone maps require
the collection, compilation, and analysis of geotechnical information and map data. The data are
processed into a series of geographic information system (GIS) layers using commercially
available software. In brief, project geologists complete the following principal tasks to generate
a Seismic Hazard Zone Map for liquefaction potential:
Compile digital geologic maps to delineate the spatial distribution of Quaternary sedimentary
deposits
Collect geotechnical borehole log data from public agencies and engineering geologic
consultants.
Enter borehole log data into a GIS database.
Generate digital cross sections to evaluate the vertical and lateral extent of Quaternary
deposits and their lithologic and engineering properties.
Evaluate and map historic-high groundwater levels in areas containing Quaternary deposits.
Characterize expected earthquake ground motion, also referred to as ground-shaking
opportunity (see Section 3 of this report).
Perform quantitative analyses of geotechnical and ground motion data to assess the
liquefaction potential of Quaternary deposits.
Page 13
SHZR 113 SEISMIC HAZARD ZONATION OF THE SAN MATEO QUADRANGLE 3
Synthesize, analyze, and interpret above data to create maps delineating Earthquake Zones of
Required Investigation for liquefaction according to criteria adopted by the SMGB
(Department of Conservation, 2004).
Scope and Limitations
Evaluation for potentially liquefiable soils generally is confined to areas covered by Quaternary
(less than about 2.6 million years) sedimentary deposits. Such areas within the San Mateo
Quadrangle consist mainly of alluviated canyons and valleys, floodplains and zones of artificial
fill adjacent to San Francisco bay. CGS’s liquefaction hazard evaluations are based on
information on earthquake ground shaking, surface and subsurface lithology, geotechnical soil
properties, and groundwater depth. This data is gathered from various sources and although its
evaluation was rigorous, the inherent quality of the data selected is variable. The State of
California and the Department of Conservation make no representations or warranties regarding
the accuracy of the data obtained from outside sources.
Liquefaction zone maps are intended to prompt more detailed, site-specific geotechnical
investigations, as required by the Act. As such, liquefaction zone maps identify areas where the
potential for liquefaction is relatively high. They do not predict the amount or direction of
liquefaction-related ground displacements, or the amount of damage to facilities that may result
from liquefaction. Factors that control liquefaction-induced ground failure are the extent, depth,
density, and thickness of liquefiable materials, depth to groundwater, rate of drainage, slope
gradient, proximity to free faces, and intensity and duration of ground shaking. These factors
must be evaluated on a site-specific basis to assess the potential for ground failure at any given
project site.
This section of the report is presented in two parts. Part I addresses the geographic and geologic
setting of the study area while Part II documents the data and parameters used to evaluate
liquefaction hazard and to delineate Seismic Hazard Zones for liquefaction in the San Mateo
Quadrangle.
PART I: GEOGRAPHIC AND GEOLOGIC SETTING
PHYSIOGRAPHY
Location
The San Mateo 7.5-Minute Quadrangle covers an area of approximately 160 square kilometers
(62 square miles) in San Mateo County, California. Located on the San Francisco Peninsula it is
part of the Coast Range Geomorphic Province. The center of the quadrangle is about 26
kilometers (16 miles) south by southeast of the city of San Francisco and about 45 kilometers (28
miles) north by northwest of the city of San Jose. The map area includes developed areas along
the western shores of San Francisco Bay: the cities of Belmont, Burlingame, Foster City,
Hillsborough, Redwood City, San Carlos, San Mateo and a small section of the San Francisco
International Airport. It also includes undeveloped and protected areas in the Santa Cruz
Mountains: the Crystal Springs watershed and Golden Gate National Recreation Area.
Page 14
4 CALIFORNIA GEOLOGICAL SURVEY 2018
The southwestern third of the quadrangle straddles the Montara block of the Santa Cruz
Mountains and is characterized by flat topped northwest trending ridges. Cahill ridge (1100 to
1200 feet in elevation) to the southwest, Buri-Buri, and Las Pulgas ridges (700 feet in elevation)
to the northeast delineate the similarly oriented San Andreas rift zone. In the central part of the
quadrangle the higher terrain extends eastward and forms the Hillsborough, San Mateo, Belmont
and San Carlos hills where ridges dissected by canyons and narrow valleys reach elevations close
to 400 feet. The rest of the quadrangle covers areas of lower elevation and milder relief. Alluvial
fans emanating from the mountains feature gentle slopes extending towards San Francisco Bay.
The topography flattens out eastward to the shoreline resulting from the development of tidal
marshes and the artificial filling of mudflats.
To the west of the Buri-Buri and Las Pulgas ridges the water collects in the lower and upper
Crystal springs reservoirs along the San Andreas rift zone. To the east, streams collect in creeks
that drain into San Francisco Bay. Larger creeks in the map area are Easton, Sanchez, Cherry,
San Mateo, Pohlemus, Lourel, Belmont and Pulgas Creeks.
Land Use
Many of the cities and towns located on the San Mateo Quadrangle had originally been centers
of rural life until the post-World War II era. Since the 1980s the San Francisco Peninsula has
seen a large growth rate as part of the technology boom of the Silicon Valley. The majority of
the industrial, commercial and residential development is located on relatively flat areas along
the shoreline of San Francisco Bay while development in hill slope areas favors low density
residential structures.
Major transportation routes in the map area include northwest-trending State Highway 280,
which runs through the southwest corner of the quadrangle and northwest-trending State
Highway 101 that runs near the shoreline of San Francisco Bay through the northeast part of the
quadrangle. They connect the Peninsula to San Francisco to the north and San Jose to the south.
The northeast-trending State Highway 92 in the center of the quadrangle connects the map area
to the East Bay through San Mateo. Additional access is provided by a network of city, county,
and private roads in the developed areas and by fire roads and trails in undeveloped areas.
GEOLOGY
Geologic units that generally are susceptible to liquefaction are late Quaternary alluvial and
fluvial sedimentary deposits and artificial fill. The primary source used to evaluate the areal and
vertical distribution of Quaternary deposits in the San Mateo Quadrangle was USGS Open-File
Report 2006-1037, by Witter and others, 2006. Other regional geologic maps (Brabb and others,
1998a and 1998b; Bonilla and others, 1998) were crucial in the identification of bedrock and
Quaternary contacts.
CGS staff also used interpretation of topographic maps, digital terrain models, aerial
photographs, and soil surveys to modify geologic units and boundaries. The ages of deposits
were estimated using landform shape, relative geomorphic position, cross cutting relationships,
superposition, depth and degree of surface dissection, and relative degree of soil profile
development. The geologic maps and interpreted layers covering the San Mateo quadrangle were
combined to form a single, 1:24,000-scale geologic materials map that displays map unit
Page 15
SHZR 113 SEISMIC HAZARD ZONATION OF THE SAN MATEO QUADRANGLE 5
polygons only (i.e. no faults, fold axes, or point data). The distribution of Quaternary deposits on
the final geologic materials map (summarized on Plate 1.1) was used in combination with other
data, discussed below, to evaluate liquefaction susceptibility and develop the Seismic Hazard
Zone Map.
Bedrock Units
Although bedrock units are not generally considered subject to liquefaction, they are briefly
described in this section because the composition and texture of sediments that accumulate in
lowland basins are governed in large part by the lithology of older rocks exposed in surrounding
highlands. For more detail on bedrock exposed in the San Mateo Quadrangle, see Section 2 of
this report.
In the southwestern part of the quadrangle, flanking the San Andreas Fault, rocks of the
Franciscan Complex (age ranging from about 200 to 80 million years old) form the basement of
the Santa Cruz Mountains. The Franciscan primarily consists of graywacke sandstone, argillite
and shale (KJs, KJf) but also contains lessor amounts of greenstone (KJg), radiolarian ribbon
chert (KJc), limestone (KJl), serpentinite (Sp), and a variety of high-grade metamorphic rocks
(KJm, fm) such as blueschist, amphibolite, and eclogite. These rocks are typically highly
fractured and disrupted and may be mixed together on a local scale to create what is called a
mélange (French for “mixture” or “blend”). Further east, more recent bedrock units are mapped
at the transitional boundary between the Santa Cruz Mountains and the flatlands. These gently
sloping hills present detrital sedimentary rocks of various composition and cohesion. The
Merced formation (QTm, Upper Pliocene-Lower Pleistocene) is mapped on slopes east of the
Buri-Buri ridge and consists of sandstone, siltstone and claystone with some conglomerate lenses
and a few friable beds of white volcanic ash. The Santa Clara Formation (QTsc, Upper Pliocene-
Lower Pleistocene) is mapped on a single outcrop in the Belmont Hills and consists of
conglomerate, sandstone and mudstone. The Colma Formation (Qc, Pleistocene) is mapped on
the slopes east of the Buri-Buri and Pulgas ridges and consists of consolidated arkosic sand with
subordinate amounts of gravel, silt and clay.
Quaternary Sedimentary Deposits
Approximately 21 square miles of the San Mateo Quadrangle are covered by Quaternary
sediments, of which approximately 19 square miles are latest Pleistocene to Holocene age. In
total, 13 different Quaternary units are mapped in the San Mateo Quadrangle (Plate 1.1). These
sedimentary units are divided into four groups based on age, origin, and composition (see Table
1.1). The liquefaction susceptibility evaluation and development of the Seismic Hazard Zone
Map for the quadrangle was based on the distribution of these deposits at a scale of 1:24,000
(Plate 1.1) and analyses of associated geotechnical data as discussed under the Engineering
Geology heading of this section.
Old alluvial fans (Qpf, late Pleistocene) are mapped on gentle slopes throughout the city of San
Mateo and extend to the shoreline. Sediments are carried by streams and deposited onto alluvial
valley floors. They consist of debris flow, hyperconcentrated mud flow and stream deposits and
typically include sand, gravel, silt and clay moderately to poorly sorted and moderately to poorly
Page 16
6 CALIFORNIA GEOLOGICAL SURVEY 2018
bedded. Sediment clast size and general particle size decreases downslope from the fan apex and
the deposits are very stiff to hard or medium dense to very dense.
Late Pleistocene to Holocene detrital/alluvial sediments include stream channel deposits (Qhc,
Holocene) mapped along the main creeks running through the Santa Cruz Mountains. They
consist of loose, unconsolidated, poorly to well sorted sand, gravel and cobbles with minor silt
and clay. These deposits are reworked by frequent flooding and grade finer downstream.
Undifferentiated alluvium (Qa, late Pleistocene to Holocene; Qha, Holocene) are mapped where
separate types of alluvial deposits could not be delineated either due to complex interfingering of
depositional environments, or the small size of the area. These sediments are typically deposited
on modern flood plains, active stream channels, undissected active alluvial fans, terraces and
flood prone areas. Deposits are loose sand, gravel, silt and clay that are poorly to moderately
sorted. Alluvial fans (Qhf, Holocene) are deposited by streams emanating from mountain
canyons onto alluvial floors. These stream channels are typically incised into older fan deposits
near the fan apex, and are gradually less incised down fan until the stream becomes unconfined
and distributes young sediment across the toe of the fan. Sediment is moderately to poorly sorted
and bedded and may be composed of gravel, sand, silt and clay. Alluvial terraces (Qt, late
Pleistocene-Holocene) are mapped along Belmont Creek. These deposits include sand, gravel
and silt with minor clay and are moderately to well sorted and moderately to well bedded.
Colluvium (Qcy, Holocene) is mapped on lower slopes and consist of friable unsorted sand, silt,
clay, gravel, rock debris and organic materials in varying proportions.
San Francisco Bay Mud (Qhbm, Holocene) is mapped in the area between the modern shoreline
and the historical limits of tidal marshes and mudflats. Bay mud sediment typically has low bulk
density and includes silt, clay, peat, and fine sand. Also included within this map unit are areas
that are presently, or were recently, used as salt evaporation ponds as well as small areas of
artificial fill and Holocene alluvial deposits too small to be mapped at the map scale used in this
project. Especially relevant to the evaluation of liquefaction susceptibility are the many small
marsh channels that are too small to map, yet likely contain sandy substrates and may be more
susceptible to liquefaction than the silt, clay and peat of the marsh deposits. Bay mud deposits
near the mouths of larger streams likely contain more sand and silt than the deposits that are
distant from stream and river mouths.
Artificial undifferentiated fill (af) is material deposited by human activity. Fill may be
engineered and/or non-engineered material and may occur within the same area on the map.
Most of the highway and railroad embankments consist of engineered fill up to approximately
100 feet thick. Large earthen dams are mapped separately as artificial dam fill (adf). Artificial
fill over estuarine mud (afem) is material deposited by humans over sediments along the margins
of San Francisco Bay. The thickness of the fill overlying estuarine sediment is typically five to
twenty feet. Artificial levee fill (alf) are constructed levees bordering rivers, streams, salt ponds
and sloughs for the purpose of containing flood or tidal waters. Some are compacted and quite
firm, but levees built before the 1965 enactment of the Uniform Building Code are likely to be
uncompacted and made of poor quality fill. Artificial stream channels (ac) are modified stream
channels including straightened or realigned channels, flood control channels, and concrete
canals. Deposits within artificial channels can range from almost none in some concrete canals,
to significant thicknesses of loose, unconsolidated sand, gravel and cobbles, similar to deposits
of modern stream channel deposits.
Page 17
SHZR 113 SEISMIC HAZARD ZONATION OF THE SAN MATEO QUADRANGLE 7
Table 1.1. Quaternary units mapped in the San Mateo Quadrangle.
Map Unit Environment of Deposition Age
af Artificial historical
ac Artificial historical
adf Artificial historical
afem Artificial historical
alf Artificial historical
Qa Fluvial Late Pleistocene to Holocene
Qha Fluvial Holocene
Qcy Slope Holocene
Qhbm Estuarine Holocene
Qhc Fluvial Holocene
Qhf Alluvial fan Holocene
Qpf Alluvial fan Late Pleistocene
Qt Fluvial Late Pleistocene to Holocene
Geologic Structure
The San Mateo Quadrangle is located within the Coast Ranges geomorphic province. The Coast
Ranges are northwest-trending mountain ranges and valleys subparallel to the San Andreas Fault
system marking the transform boundary between the Pacific and North American plates.
Shearing is distributed across a complex system of primarily northwest-trending, right-lateral,
Tertiary and Quaternary strike-slip faults truncating and juxtaposing stratigraphic assemblages.
The Peninsula section of the San Andreas Fault crosses the southwestern part of the San Mateo
Quadrangle. A northwest trending 3.5-mile-long segment of the fault is mapped along the
Crystal Springs Reservoir. This portion of the San Andreas Fault ruptured during the 1906 San
Francisco earthquake (Lawson and others, 1908) and is zoned by CGS under the Alquist-Priolo
Earthquake Fault Zoning Act.
ENGINEERING GEOLOGY
Late Quaternary and Holocene alluvial and fluvial sedimentary deposits and non-engineered
artificial fill contain saturated loose sandy and silty soils that are the most susceptible to
liquefaction. The identification and characterization of these specific lithologies and
density/cohesion conditions are key to the liquefaction hazard assessment. Lithologic
descriptions and soil test results reported in geotechnical borehole logs provide valuable
Page 18
8 CALIFORNIA GEOLOGICAL SURVEY 2018
information regarding subsurface geology and the engineering characteristics of sedimentary
deposits.
Historic-High Groundwater Mapping
Saturated soil conditions are required for liquefaction to occur, and the susceptibility of a soil to
liquefaction varies with the depth to groundwater. Saturation reduces the effective normal stress
of near-surface sediment, thereby increasing the likelihood of earthquake-induced liquefaction
(Youd, 1973). CGS compiles and interprets current and historical groundwater data to identify
areas characterized by, or anticipated to have in the future, near-surface saturated soils. For
purposes of seismic hazard zonation, "near-surface" means at depths less than 40 feet.
Natural hydrologic processes and human activities can cause groundwater levels to fluctuate over
time. Therefore, it is impossible to predict depths to saturated soils during future earthquakes.
One method of addressing time-variable depth to saturated soils is to establish a historic-high
groundwater level based on historical groundwater data. In areas where groundwater is either
currently near-surface or could return to near-surface levels within a land-use planning interval
of 50 years, CGS constructs regional contour maps that depict these historic-high groundwater
levels. Plate 1.2 depicts areas characterized by present or historic-high groundwater elevation
surface levels within the San Mateo Quadrangle.
The study area lies within the San Francisco Bay hydrologic region and covers the southeastern-
most part of the California Department of Water Resources (DWR) designated Westside
Groundwater Basin (number 2-35) and the northwestern-most part of the Santa Clara Valley
Groundwater basin, San Mateo subbasin (number 2-9.03). Water bearing formations in both
basins are divided in two groups: unconsolidated Plio-Pleistocene materials overlying bedrock
(Merced, Colma and Santa Clara formations) and Quaternary alluvial deposits. Aquifer storage
coefficients typically indicate unconfined conditions at depths less than 100 feet. Natural
recharge occurs by infiltration of water from streams emanating from the upland areas and
rainfall percolation. Mean annual precipitation is in the range of 20 to 24 inches. Additionally,
artificial recharge includes infiltration of irrigation water and leakage from water and sewer
pipes.
During the course of this study, groundwater conditions were investigated for alluvial basins and
plains within the San Mateo Quadrangle. The evaluation was based on first-encountered,
unconfined water noted in geotechnical borehole logs acquired from San Mateo County and the
cities of Belmont, Burlingame, Foster City, Hillsborough, Redwood City, San Carlos and San
Mateo. These datasets reflect water levels from 1970 to present. As they represent a
measurement at a point in time, this information is only valuable when compared to
measurements in neighboring boreholes with an understanding of local seasonal variability.
Additional groundwater measurements were collected from the California Water Department
(California Statewide Groundwater Elevation Monitoring, well completion reports), the State
Water Resources Control Board (Geotracker) and the San Francisco Water District. The data
collected from these sources is generally of higher quality as it consists of monitoring wells with
strict measurement protocols. Water levels are recorded on hydrographs and account for
variability throughout the last decade.
Groundwater data from all available records were spatially and temporally evaluated in a GIS
database to constrain the estimate of historically shallowest groundwater for the project area. The
Page 19
SHZR 113 SEISMIC HAZARD ZONATION OF THE SAN MATEO QUADRANGLE 9
historic-high groundwater map was modified, where warranted, with input from current ground-
surface water, such as active creeks, recharge ponds, detention basins, other water impoundments,
and reservoirs. The depth to groundwater contours depicted on Plate 1.2 do not represent present-
day conditions, as usually presented on typical groundwater contour maps, but rather the historic-
high groundwater levels anticipated for the San Mateo Quadrangle.
Along the shoreline and adjoining flatlands groundwater levels measurements are shallow (0-10
feet below the surface) reflecting the water levels in San Francisco Bay. Mapped artificial and
alluvial materials below 20 feet in elevation in these areas have been assigned a historic-high
groundwater depth of 0 feet below ground surface. As the topography increases to the southwest,
away from the bay and into the Santa Cruz mountains, the depth to measured groundwater
typically increases. The water table generally is a subdued replica of the surface topography.
Water contours to the depth of 30 feet have been mapped in the unconsolidated materials
covering the gentle slopes of the San Mateo, Belmont and San Carlos Hills. The contours were
not extended in pre-Quaternary formations mapped at the surface as these areas were not
evaluated for liquefaction hazard potential. Shallow water levels ranging from 0 to 20 feet below
ground surface were observed in areas mapped as Holocene alluvial fans and in alluvium filled
valleys and canyons. These materials are seasonally saturated with increased precipitation, heavy
runoff and stream flow. They have been assigned a historic-high groundwater depth of 0 feet
below ground surface.
Soil Testing
Soils reports were collected for this investigation from the files of San Mateo County and the
cities of Belmont, Burlingame, Foster City, Hillsborough, Redwood City, San Carlos and San
Mateo. The data was entered in the CGS geotechnical geographical information system (GIS)
database. After an initial review, process and data quality controls, 402 borehole logs were
selected for the liquefaction potential analysis.
Of particular value in liquefaction evaluations are logs that report the results of downhole
standard penetration tests in alluvial materials. The standard penetration test (SPT) provides a
standardized measure of the penetration resistance of soil and, therefore, is commonly used as a
tool to index soil density. SPT is an in-situ test that is based on counting the number of blows
required to drive a split-spoon sampler (1.375-inch inside diameter) one foot into the soil. The
driving force is provided by dropping a 140-pound hammer weight a distance of 30 inches. The
SPT method is formally defined and specified by the American Society for Testing and Materials
in test method D1586 (American Society for Testing and Materials, 2004). Recorded blow
counts for non-SPT geotechnical sampling where the sampler diameter, hammer weight or drop
distance differs from that specified for an SPT (ASTM D1586), are converted to SPT-equivalent
blow counts, if reliable conversions can be made. The actual and converted SPT blow counts are
normalized to a common reference, effective-overburden pressure of one atmosphere
(approximately 1 ton per square foot) and a hammer efficiency of 60 percent using a method
described by Seed and Idriss (1982) and Seed and others (1985). This normalized blow count is
referred to as (N1)60. Geotechnical borehole logs provide information on lithologic and
engineering characteristics of Quaternary deposits the study area. The characteristics reported in
Table 1.2 summarize conditions in the San Mateo Quadrangle.
Page 20
10 CALIFORNIA GEOLOGICAL SURVEY 2018
Borehole logs show that Holocene and latest Pleistocene alluvial layers contain variable amounts
of gravel in the subsurface of valley areas and upland adjacent stream valleys. In the past,
gravelly soils were considered not to be susceptible to liquefaction because the high permeability
of these soils presumably would allow the dissipation of pore pressures before liquefaction could
occur. However, liquefaction in gravelly soils has been observed during earthquakes, and recent
laboratory studies have shown that gravelly soils are susceptible to liquefaction (Ishihara, 1985;
Harder and Seed, 1986; Budiman and Mohammadi, 1995; Evans and Zhou, 1995; and Sy and
others, 1995). SPT-derived density measurements in gravelly soils are unreliable and generally
too high. They are likely to lead to overestimation of the density of the soil and, therefore, result
in an underestimation of the liquefaction susceptibility. To identify potentially liquefiable units
where the N values appear to have been affected by gravel content, correlations were made with
boreholes in the same unit where the N values do not appear to have been affected by gravel
content.
Of the 402 geotechnical borehole logs analyzed in this study, most include blow-count data from
SPT or penetration tests that allow reasonable blow count conversions to SPT-equivalent values.
Few of the borehole logs collected, however, include all of the information (e.g. soil density,
moisture content, sieve analysis, etc.) required for an ideal analysis using the Seed-Idriss
Simplified Procedure. For boreholes having acceptable penetration tests, liquefaction analysis is
performed using recorded density, moisture, and sieve test values or averaged test values of
similar materials.
Table 1.2. Liquefaction susceptibility of Quaternary units in the San Mateo Quadrangle.
Geologic Map
Unit Age
Sediment/Material
Type Consistency
Liquefaction
Susceptibility*
af, ac, adf,
afem, alf Historical
Sand, silt, gravel, clay,
cobbles, concrete Loose to dense yes
Qa Holocene Sand, gravel, silt, clay Loose to dense yes
Qcy Holocene Sand, gravel, silt, clay Loose to medium dense yes
Qhbm Holocene Silt, clay, peat, sand Loose yes
Qhc Holocene Sand, gravel, cobbles,
silt, clay Loose yes
Qhf Holocene Gravel, sand, silt, clay Loose to dense yes
Qpf Late Pleistocene Gravel, sand, silt, clay Medium dense to very
dense no
Qt Late Pleistocene
to Holocene Sand, gravel, silt, clay Loose to dense yes
Page 21
SHZR 113 SEISMIC HAZARD ZONATION OF THE SAN MATEO QUADRANGLE 11
PART II: LIQUEFACTION HAZARD ASSESSMENT
MAPPING TECHNIQUES
Liquefaction may occur in water-saturated sediment during moderate to great earthquakes.
When this occurs, sediment loses strength and may fail, causing damage to buildings, bridges,
and other structures. Many methods for mapping liquefaction hazard have been proposed. Youd
(1991) highlights the principal developments and notes some of the widely used criteria. Youd
and Perkins (1978) demonstrate the use of geologic criteria as a qualitative characterization of
liquefaction susceptibility and introduce the mapping technique of combining a liquefaction
susceptibility map and a liquefaction opportunity map to produce a liquefaction potential map.
Liquefaction susceptibility is a function of the capacity of sediment to resist liquefaction,
whereas liquefaction opportunity is a function of potential seismic ground shaking intensity.
The method applied in this study to evaluate liquefaction potential is similar to that Tinsley and
others (1985) used to map liquefaction hazards in the Los Angeles region. These investigators,
in turn, applied a combination of the techniques developed by Seed and others (1983) and Youd
and Perkins (1978). CGS’s method combines geotechnical analyses, geologic and hydrologic
mapping, and probabilistic earthquake shaking estimates employing criteria adopted by the
SMGB (Department of Conservation, 2004).
LIQUEFACTION SUSCEPTIBILITY
Liquefaction susceptibility reflects the relative resistance of a soil to loss of strength when
subjected to ground shaking. Physical properties of soil such as sediment grain-size distribution,
compaction, cementation, saturation, and depth from the surface govern the degree of resistance
to liquefaction. Some of these properties can be correlated to a sediment’s geologic age and
environment of deposition. With increasing age, relative density may increase through
cementation of the particles or compaction caused by the weight of the overlying sediment.
Grain-size characteristics of a soil also influence susceptibility to liquefaction. Sand is more
susceptible than silt or gravel, although silt of low plasticity is treated as liquefiable in this
investigation. Cohesive soils generally are not considered susceptible to liquefaction. Such soils
may be vulnerable to strength loss with remolding and represent a hazard that is not specifically
addressed in this investigation. Soil characteristics that result in higher measured penetration
resistances generally indicate lower liquefaction susceptibility. In summary, soils that lack
resistance (susceptible soils) typically are saturated, loose, and granular. Soils resistant to
liquefaction include all soil types that are dry, cohesive, or sufficiently dense.
CGS’s inventory of areas containing soils susceptible to liquefaction begins with evaluation of
historical occurrences, geologic maps, cross-sections, geotechnical test data, geomorphology,
and groundwater hydrology. Soil properties and soil conditions such as type, age, texture, color,
and consistency, along with historic-high depths to groundwater are used to identify,
characterize, and correlate susceptible soils. Because Quaternary geologic mapping is based on
observable similarities between soil units, liquefaction susceptibility maps typically are often
similar to Quaternary geologic maps, depending on local groundwater levels. CGS’s qualitative
relations among susceptibility, geologic map unit, and depth to groundwater are summarized in
Table 1.2.
Page 22
12 CALIFORNIA GEOLOGICAL SURVEY 2018
In the San Mateo quadrangle, loose, saturated artificial fills (af, afem, alf, ac) are highly
susceptible to liquefaction while compacted engineered fills are considered more resistant.
Holocene to Late Pleistocene alluvial fans and terraces (Qhf, Qt) typically have a high clay
content, however these deposits can contain lenses of granular loose material and are therefore
susceptible to liquefaction. Undifferentiated alluvial deposits (Qa, Qha) typically contain more
fines and are assigned a moderate susceptibility. Despite the Holocene Bay Mud (Qhbm) being
mostly fine-grained, it is soft with high water content and may contain lenses of liquefiable
material especially near the mouth of creeks. Pleistocene alluvial fans (Qpf) are generally
unsaturated at shallow depths and display higher density values. They are not susceptible to
liquefaction.
GROUND SHAKING OPPORTUNITY
Ground shaking opportunity is a calculated measure of the intensity and duration of strong
ground motion normally expressed in terms of peak horizontal ground acceleration (PGA).
Ground motion calculations used by CGS exclusively for regional liquefaction zonation
assessments are currently based on the probabilistic seismic hazard analysis (PSHA) model
developed by USGS (Petersen and others, 2014; 2015) for the 2014 Update of the United States
National Seismic Hazard Maps (NSHMs). The model is set to calculate ground motion hazard at
a 10 percent in 50 years exceedance probability level. CGS calculations incorporate additional
programming that modifies probabilistic PGA by a scaling factor that is a function of magnitude
at a post-PSHA step. Calculation of the scaling factor is based on binned magnitude-distance
deaggregation and is weighted by the contribution of each earthquake-distance bin to the total
shaking hazard. The result is a magnitude-weighted, pseudo-PGA that CGS refers to as
Liquefaction Opportunity (LOP). This approach provides an improved estimate of liquefaction
hazard in a probabilistic sense, ensuring that large, infrequent, distant earthquakes, as well as
smaller, more frequent, nearby events are appropriately accounted for (Real and others, 2000).
These LOP values are then used to calculate cyclic stress ratio (CSR), the seismic load imposed
on a soil column at a particular site. A more detailed description of the development of ground
shaking opportunity data and parameters used in liquefaction hazard zoning can be found in
Section 3 of this report.
LIQUEFACTION ANALYSIS
CGS performs quantitative analysis of geotechnical data to evaluate liquefaction potential using
an in-house computer program based on the Seed-Idriss Simplified Procedure (Seed and Idriss,
1971; Seed and others, 1983; National Research Council, 1985; Seed and others, 1985; Seed and
Harder, 1990; Youd and Idriss, 1997; Youd and others, 2001; Idriss and Boulanger, 2008). The
procedure first calculates the resistance to liquefaction of each soil layer penetrated at a test-
drilling site, expressed in terms of cyclic resistance ratio (CRR). The calculations are based on
standard penetration test (SPT) results, groundwater level, soil density, grain-size analysis,
moisture content, soil type, and sample depth. The procedure then estimates the factor of safety
relative to liquefaction hazard for each of the soil layers logged at the site by dividing their
calculated CRR by the pseudo PGA-derived CSR described in the previous section.
CGS uses a factor of safety (FS) of 1.0 or less, where CSR equals or exceeds CRR, to indicate
the presence of potentially liquefiable soil layers. The liquefaction analysis program calculates
Page 23
SHZR 113 SEISMIC HAZARD ZONATION OF THE SAN MATEO QUADRANGLE 13
an FS for each geotechnical sample where blow counts were collected. Typically, multiple
samples are collected for each borehole. The program then independently calculates an FS for
each non-clay layer that includes at least one penetration test using the minimum (N1)60 value for
that layer. The minimum FS value of the layers penetrated by the borehole is used to determine
the liquefaction potential for each borehole location. The reliability of FS values varies
according to the quality of the geotechnical data. In addition to FS, consideration is given to the
proximity to stream channels, which accounts in a general way for factors such as sloping ground
or free face that contribute to severity of liquefaction-related ground deformation.
The Seed-Idriss Simplified Procedure for liquefaction evaluation was developed primarily for
clean sand and silty sand. As described above, results depend greatly on accurate evaluation of
in-situ soil density as measured by the number of soil penetration blow counts using an SPT
sampler. However, borehole logs show that Holocene alluvial layers are present in the
subsurface of the San Mateo Quadrangle. In the past, gravel and gravelly materials were
considered not to be susceptible to liquefaction because the high permeability of these soils
presumably would allow the dissipation of pore pressures before liquefaction could occur.
However, liquefaction in gravel has, in fact, been reported during earthquakes and recent
laboratory studies have confirmed the phenomena (Ishihara, 1985; Harder and Seed, 1986;
Budiman and Mohammadi, 1995; Evans and Zhou, 1995; and Sy and others, 1995). SPT-
derived density measurements in gravelly soils are unreliable and generally artificially high.
They are likely to lead to over-estimation of the density of the soil and, therefore, result in an
underestimation of the liquefaction susceptibility. To identify potentially liquefiable units where
blow counts appear to have been affected by gravel content, correlations are made with
boreholes in the same unit where the tests do not appear to have been affected by gravel content.
ZONATION CRITERIA: LIQUEFACTION
Areas underlain by materials susceptible to liquefaction during an earthquake are included in
liquefaction zones using criteria developed by the Seismic Hazards Mapping Act Advisory
Committee and adopted by the SMGB (CGS, 2004). Under those guideline criteria, liquefaction
zones are areas meeting one or more of the following:
1) Areas known to have experienced liquefaction during historical earthquakes
2) All areas of uncompacted artificial fill that are saturated, nearly saturated, or may be
expected to become saturated
3) Areas where sufficient existing geotechnical data and analyses indicate that the soils are
potentially liquefiable
4) Areas where existing subsurface data are not sufficient for quantitative evaluation of
liquefaction hazard. Within such areas, zones may be delineated by geologic criteria as
follows:
a) Areas containing soil deposits of late Holocene age (current river channels and their
historic floodplains, marshes and estuaries), where the M7.5-weighted peak acceleration
that has a 10 percent probability of being exceeded in 50 years is greater than or equal to
0.10 g and the anticipated depth to saturated soil is less than 40 feet; or
b) Areas containing soil deposits of Holocene age (less than 11,700 years), where the M7.5-
weighted peak acceleration that has a 10 percent probability of being exceeded in 50
Page 24
14 CALIFORNIA GEOLOGICAL SURVEY 2018
years is greater than or equal to 0.20 g and the anticipated depth to saturated soil is less
than 30 feet; or
c) Areas containing soil deposits of latest Pleistocene age (11,700 to 15,000 years), where
the M7.5-weighted peak acceleration that has a 10 percent probability of being exceeded
in 50 years is greater than or equal to 0.30 g and the anticipated depth to saturated soil is
less than 20 feet.
Application of the above criteria allows compilation of Earthquake Zones of Required
Investigation for liquefaction hazard, which are useful for preliminary evaluations, general land-
use planning and delineation of special studies zones (Youd, 1991).
DELINEATION OF SEISMIC HAZARD ZONES: LIQUEFACTION
Upon completion of a liquefaction hazard evaluation within a project quadrangle, CGS applies
the above criteria to its findings in order to delineate Seismic Hazard Zones for liquefaction.
Following is a description of the criteria-based factors that governed the construction of the
Seismic Hazard Zone Map for the San Mateo Quadrangle.
Areas of Past Liquefaction
Knudsen and others (2000a) developed a spatial database of historical earthquake-related ground
failures containing historical observations of earthquake-triggered damage, including the two
most damaging events: the 1906 San Francisco earthquake (Mw=7.7-7.9) (Youd and Hoose,
1978), and the 1989 Loma Prieta earthquake (Mw=7) (Plafker and Galloway, 1989; Seed and
others, 1990; Tinsley and others, 1998). Other earthquakes that generated liquefaction failures in
the study area include the 1838, 1865, 1868, and 1957 earthquakes (Youd and Hoose, 1978).
Four features have been recorded in the San Mateo quadrangle close to the shoreline in artificial
fill over estuarine mud (afem) and Holocene Bay Mud (Qhbm).
The greatest number of historical ground failures, 34% of the total observed effects in the core
Bay area, occurred in the map unit artificial fill over estuarine mud (afem). In many cases it is
not known whether the failures were in the fill or in the underlying estuarine deposits. The high
percentage of failures occurring in artificial fill over estuarine mud also may reflect amplified
shaking levels due to the physical characteristics of Bay Mud.
Artificial Fills
In the San Mateo Quadrangle, artificial fill areas large enough to show at the scale of mapping
consists of engineered fill for river levees and elevated freeways, as well as isolated bodies of fill
typically associated with construction projects of various sizes. Since these fills are considered to
be properly engineered, zoning for liquefaction in such areas depends on soil conditions in
underlying strata.
Artificial fill mapped over bedrock in the Santa Cruz mountains and the gently sloping hills over
San Mateo, Belmont and San Carlos and artificial fill mapped over Pleistocene alluvial deposits
along El Camino Real in Burlingame, San Mateo, Belmont and San Carlos are not included in
the Seismic Hazard Zone.
Page 25
SHZR 113 SEISMIC HAZARD ZONATION OF THE SAN MATEO QUADRANGLE 15
Artificial fill mapped over Holocene alluvial deposits along river channels in the Santa Cruz
Mountains and on the alluvial plain in the flatlands between the shoreline and the Santa Cruz
Mountains are included in the zone because these deposits are commonly coarse grained, loose,
and likely to be saturated.
The San Francisco Bay is defined by an active margin that has been and continues to be modified
by both natural processes and human activities. Artificial fill has been placed over estuarine flats
since the 1850’s and is mapped along the shoreline of San Francisco Bay and under the cities of
Redwood Shores and Foster City. These deposits historically have been particularly susceptible
to liquefaction. These areas are therefore included in the Seismic Hazard Zone.
Areas with Sufficient Existing Geotechnical Data
The majority of the 402 Borehole logs evaluated for liquefaction potential using the Seed Idriss
simplified procedure are located in Quaternary alluvial deposits that cover approximately half of
the San Mateo Quadrangle between the bay shores and the Santa Cruz Mountains.
Analysis of blow count values and other soil property measurements reported in the logs indicate
that most of the boreholes mapped in Holocene alluvial deposits present saturated layers of loose
sand, gravel and silt that may liquefy under the expected earthquake loading. These deposits are
modern stream channel deposits (Qhc), Holocene alluvial fans (Qhf) and Late Pleistocene to
Holocene undifferentiated alluvial sediments (Qa, Qha) mapped along and adjacent to the
downstream end of the Easton, Sanchez, Cherry, San Mateo, Pohlemus, Lourel, Belmont and
Pulgas creeks. Liquefiable sand and silt layers were also identified in boreholes displaying
Holocene Bay Mud (Qhbm) capped or not by artificial deposits and mapped between El Camino
Real and the shoreline.
The Colma Formation (Qc), and Late Pleistocene (Qpf) alluvial fan deposits did not present
liquefiable layers according to the Seed-Idriss Simplified Procedure. Boreholes recording these
lithologies display saturated and unsaturated layers of sand, silt, clay and gravels with high
densities resistant to liquefaction under the expected earthquake loading.
The boundary for the Seismic Hazard Zone for liquefaction is defined by the contact between
Holocene alluvial deposits and bedrock/Pleistocene deposits. It runs at the base of the foothills in
Burlingame, San Mateo, Belmont and San Carlos and extends along the creeks dissecting the
alluvial plain and along alluviated valleys and canyons of the Santa Cruz Mountains.
Areas with Insufficient Existing Geotechnical Data
Adequate geotechnical borehole information is lacking for the Holocene sediments deposited in
creeks, valleys and canyons of the Santa Cruz Mountains in the southwestern regions of the San
Mateo Quadrangle. These deposits include modern stream channel deposits (Qhc), Holocene
alluvial fan (Qhf), Holocene alluvial terrace (Qt), and Late Pleistocene to Holocene
undifferentiated alluvium (Qa and Qha).
These Holocene deposits contain varying amounts of loose, granular materials that are likely to
be saturated because of the presence of near-surface groundwater and the proximity to stream
channels. Those conditions, along with the ground motions expected to occur in the region,
Page 26
16 CALIFORNIA GEOLOGICAL SURVEY 2018
combine to form a sufficient basis for including areas underlain by these types of deposits in the
Seismic Hazard Zone for liquefaction.
ACKNOWLEDGMENTS
The authors would like to thank James Mazzetta with the department of Public Works for San
Mateo County, Mark Nolfi, Joe Cyr, Marty Cooper, Christopher Valley, Stephen Lau and
personnel with the cities of Belmont, Burlingame, Foster City, Redwood City, San Carlos and
San Mateo, Ted Sayer with Cotton, Shires and Associates, Inc. and David Hall Connell with
Connell Geotechnical, Inc. for their assistance in obtaining the data necessary to complete this
project. At the California Geological Survey, the authors would like to thank Tim McCrink, Ante
Mlinarevic, Ante Perez, Anne Rosinski, Mike Silva and Eleanor Spangler for providing valuable
feedback and their technical reviews of this report. Thanks to Terilee McGuire and Bob
Moskovitz for their database support. Thanks to Janine Bird, Kate Thomas and Jim Thompson
for their GIS support. And thanks to Ron Rubin, David Olsen and Nathaniel Barrett for their
help with the geotechnical data collection effort.
REFERENCES
American Society for Testing and Materials, 2004, Standard test method for penetration test and
split-barrel sampling of soils, Test Method D1586-99, in Annual Book of ASTM Standards,
v. 4.08.
Bonilla, M.G., 1998, Preliminary geologic map of the San Francisco South 7.5-minute
quadrangle and part of the Hunters Point 7.5-minute quadrangle, California: a digital
database: U.S. Geological Survey Open-File Report 98-354; scale 1:24,000.
Brabb, E.E., Graymer, R.W., and Jones, D.L., 1998, Geology of the onshore part of San Mateo
County, California: A digital database: U.S. Geological Survey Open-File Report 98-137.
Brabb, E.E., Graymer, R.W. and Jones, D.L., 1998, Geology of the Palo Alto 30 x 60 Minute
Quadrangle, California: a digital database; U. S Geological Survey Open File Report 98-
348.
Budiman, J.S., and Mohammadi, J., 1995, Effect of large inclusions on liquefaction of sands, in
Evans, M.D., and Fragaszy, R.J., editors, Static and Dynamic properties of Gravelly Soils:
American Society of Civil Engineers Geotechnical Special Publication no. 56, p. 48-63.
California Department of Conservation, Division of Mines and Geology, 2004, Recommended
criteria for delineating seismic hazard zones in California: California Division of Mines and
Geology Special Publication 118, 12 p.
California Department of Water Resources, 2003, California’s Groundwater, Bulletin 118,
http://www.groundwater.water.ca.gov/bulletin118/update2003.
California Geological Survey, 2004, Recommended criteria for delineating seismic hazard zones
in California: California Geological Survey Special Publication 118, 12 p. Available on-line
at: http://www.conservation.ca.gov/cgs/shzp/webdocs/documents/sp118_revised.pdf.
Page 27
SHZR 113 SEISMIC HAZARD ZONATION OF THE SAN MATEO QUADRANGLE 17
California Geological Survey, 2008, Guidelines for evaluating and mitigating seismic hazards in
California: California Geological Survey Special Publication 117a, 98 p. Available on-line
at: http://www.conservation.ca.gov/cgs/shzp/webdocs/documents/sp117.pdf.
Evans, M.D., and Zhou, S., 1995, Liquefaction behaviour of sand-gravel composites: American
Society of Civil Engineers, Journal of Geotechnical Engineering, v. 121, no. 3, p. 287-298.
Harder, L.F., and Seed, H.B., 1986, Determination of penetration resistance for coarse-grained
soils using the Becker hammer drill: University of California at Berkeley, College of
Engineering, Earthquake Engineering Research Center, report no. UCB/EERC-86/06, 126 p.
Idriss, I.M. and Boulanger, R.W., 2008, Soil liquefaction during earthquakes: Monograph Series,
MNO-12, Earthquake Engineering Research Institute, Berkeley, California, 237p.
Ishihara, K., 1985, Stability of natural deposits during earthquakes, in Proceedings of the
Eleventh International Conference on Soil Mechanics and Foundation Engineering, San
Francisco, v. 1, p. 321-376.
Knudsen, K.L., Sowers, J.M., Witter, R.C., Wentworth, C.M., and Helley, E.J., 2000a,
Preliminary Maps of Quaternary Deposits and Liquefaction Susceptibility, Nine-County San
Francisco Bay Region, California: A Digital Database, U.S. Geological Survey Open-File
Report 00-444. Digital Database by Wentworth, C.M., Nicholson, R.S., Wright, H.M., and
Brown, K.H. Online Version 1.0.
Lawson, A. C., and others, 1908, The California earthquake of April 18, 1906: Report of the
State Earthquake Investigation Commission: Carnegie Inst. Washington Pub. 87, 3 vols., 1
atlas.
National Research Council, 1985, Liquefaction of soils during earthquakes: National Research
Council Special Publication, Committee on Earthquake Engineering, National Academy
Press, Washington, D.C., 240 p.
Petersen, M.D., Moschetti, M.P., Powers, P.M., Mueller, C.S., Haller, K.M., Frankel, A.D.,
Zeng, Y., Rezaeian, S., Harmsen, S.C., Boyd, O.S., Field, N., Chen, R., Rukstales, K.S.,
Luco, N., Wheeler, R.L., Williams, R.A., and Olsen, A.H., 2014, Documentation for the
2014 update of the United States national seismic hazard maps, U.S. Geol. Survey. Open-
File Rept. 2014-1091, 243 pp., doi: 10.3133/ofr20141091.
Petersen, M.D., Moschetti, M.P., Powers, P.M., Mueller, C.S., Haller, K.M., Frankel, A.D.,
Zeng, Y., Rezaeian, S., Harmsen, S.C., Boyd, O.S., Field, N., Chen, R., Rukstales, K.S.,
Luco, N., Wheeler, R.L., Williams, R.A., and Olsen, A.H., 2015, The 2014 United States
national seismic hazard model: Earthquake Spectra, vol. 31, no. S1, p. S1–S30, doi:
10.1193/120814EQS210M.
Plafker, G., and Galloway, J.P., eds., 1989, Lessons learned from the Loma Prieta, California,
earthquake of October 17, 1989: U.S. Geological Survey Circular 1045, 48 p.
Real, C.R., Petersen, M.D., McCrink, T.P., and Cramer, C.H., 2000, Seismic Hazard
Deaggregation in zoning earthquake-induced ground failures in southern California:
Proceedings of the Sixth International Conference on Seismic Zonation, November 12-15,
Palm Springs, California, EERI, Oakland, CA.
Page 28
18 CALIFORNIA GEOLOGICAL SURVEY 2018
Seed, H.B., and Idriss, I.M., 1971, Simplified procedure for evaluating soil liquefaction
potential: Journal of the Soil Mechanics and Foundations Division of ASCE, v. 97: SM9, p.
1,249-1,273.
Seed, H.B., and Idriss, I.M., 1982, Ground motions and soil liquefaction during earthquakes:
Monograph Series, Earthquake Engineering Research Institute, Berkeley, California, 134 p.
Seed, H.B., Idriss, I.M., and Arango, I., 1983, Evaluation of liquefaction potential using field
performance data: Journal of Geotechnical Engineering, v. 109, no. 3, p. 458-482.
Seed, H.B., Tokimatsu, Kohji, Harder, L.F., and Chung, R.M., 1985, Influence of SPT
procedures in soil liquefaction resistance evaluations: Journal of Geotechnical Engineering,
ASCE, v. 111, no. 12, p. 1,425-1,445.
Seed, R.B., and Harder, L.F., 1990, SPT-based analysis of cyclic pore pressure generation and
undrained residual strength: Proceedings of the H. Bolton Seed Memorial Symposium, v. 2,
p. 351-376.
Smith, T.C., 1996, Preliminary maps of seismic hazard zones and draft guidelines for evaluating
and mitigating seismic hazards: California Geology, v. 49, no. 6, p. 147-150.
Southern California Earthquake Center, 1999, Recommended procedures for implementation of
DMG Special Publication 117 guidelines for analyzing and mitigating liquefaction in
California: Southern California Earthquake Center, University of Southern California, 63 p.
Sy, A., Campanella, R.G., and Stewart, R.A., 1995, BPT-SPT correlations for evaluations of
liquefaction resistance in gravelly soils, in Evans, M.D., and Fragaszy, R.J., editors, Static
and Dynamic Properties of Gravelly Soils: American Society of Civil Engineers
Geotechnical Special Publication no. 56, p. 1-19.
Tinsley, J.C., Youd, T.L., Perkins, D.M., and Chen, A.T.F., 1985, Evaluating liquefaction
potential, in Ziony, J.I., editor, Evaluating earthquake hazards in the Los Angeles region —
An earth science perspective: U.S. Geological Survey Professional Paper 1360, p. 263-316.
Tinsley, J.C., III, Egan, J.A., Kayen, R.E., Bennett, M.J., Kropp, A., and Holzer, T.L., 1998,
Appendix: Maps and descriptions of liquefaction and associated effects: in Holzer, T.L., ed.,
The Loma Prieta, California, Earthquake of October 17, 1989 - Liquefaction: U.S.
Geological Survey Professional Paper 1551-B.
Witter, R.C., Knudsen, K.L, Sowers, J.M., Wentworth, C.M., Koehler, R.D., Randolph, C.E.,
Brooks, S.K., and Gans, K.D., 2006, Maps of Quaternary deposits and liquefaction
susceptibility in the central San Francisco Bay region, California: U.S. Geological Survey
Open-File Report 2006-1037, http://pubs.usgs.gov/of/2006/1037/.
Youd, T.L., 1973, Liquefaction, flow and associated ground failure: U.S. Geological Survey
Circular 688, 12 p.
Youd, T.L., and Perkins, D.M., 1978, Mapping liquefaction-induced ground failure potential:
Journal of Geotechnical Engineering, v. 104, p. 433-446.
Youd, T.L., and Hoose, S.N., 1978, Historical ground failures in Northern California triggered
by earthquakes: U.S. Geological Survey Professional Paper 993.
Page 29
SHZR 113 SEISMIC HAZARD ZONATION OF THE SAN MATEO QUADRANGLE 19
Youd, T.L., 1991, Mapping of earthquake-induced liquefaction for seismic zonation: Earthquake
Engineering Research Institute, Proceedings, Fourth International Conference on Seismic
Zonation, v. 1, p. 111-138.
Youd, T.L., and Idriss, I.M., 1997, editors, Proceedings of the NCEER workshop on evaluation
of liquefaction resistance of soils: National Center for Earthquake Engineering Research
Technical Report NCEER-97-0022, 276 p.
Youd, T.L., Idriss, I.M., Andrus, R.D., Arango, I., Castro, G., Christian, J.T., Dobry, R., Finn,
W.D.L., Harder, L.F. Jr., Hynes, M.E., Ishihara, K., Koester, J.P., Liao, S.S.C., Marcusson,
W.F., Martin, G.R., Mitchell, J.K., Moriwaki, Y., Power, M.S., Robertson, P.K., Seed, R.B.,
and Stokoe, K.H., 2001, Liquefaction resistance of soils; Summary report from the 1996
NCEER and 1998 NCEER/NSF workshops on evaluation of liquefaction resistance of soils:
Journal of Geotechnical and Geoenvironmental Engineering, October 2001, p. 817-833.
Page 30
20 CALIFORNIA GEOLOGICAL SURVEY 2018
SECTION 2: EVALUATION REPORT FOR
EARTHQUAKE-INDUCED LANDSLIDE HAZARD
in the
SAN MATEO 7.5-MINUTE QUADRANGLE,
SAN MATEO COUNTY, CALIFORNIA
by
Maxime Mareschal P.G. 9495
Florante G. Perez P.G. 6972, CMS R136RS (ASPRS)
Clifton W. Davenport P.G. 4366, C.E.G. 1455, H.G. 335
and
Michael W. Manson P.G. 3690, C.E.G. 1720
DEPARTMENT OF CONSERVATION
CALIFORNIA GEOLOGICAL SURVEY
INTRODUCTION
Purpose
The Seismic Hazards Mapping Act of 1990 (the Act) (Public Resources Code, Chapter 7.8,
Division 2) directs the California State Geologist to compile maps that identify Seismic Hazard
Zones consistent with requirements and priorities established by the California State Mining and
Geology Board (SMGB) (California Geological Survey, 2004). The text of this report is
available online at: http://www.conservation.ca.gov/cgs/shzp/webdocs/documents/
sp118_revised.pdf.
The Act requires that site-specific geotechnical investigations be performed for most urban
development projects situated within Seismic Hazard Zones before lead agencies can issue the
building permit. The Act also requires sellers of real property within these zones to disclose that
fact at the time such property is sold. Evaluation and mitigation of seismic hazards are to be
conducted under guidelines adopted by the California SMGB (California Geological Survey,
2008). The text of this report is online at: http://www.conservation.ca.gov/cgs/shzp/
webdocs/documents/sp117.pdf.
Following the release of the SMGB Guidelines, local government agencies in the Los Angeles
metropolitan region sought more definitive guidance in the review of geotechnical investigations
addressing liquefaction hazard. The agencies made their request through the Geotechnical
Page 31
SHZR 113 SEISMIC HAZARD ZONATION OF THE SAN MATEO QUADRANGLE 21
Engineering Group of the Los Angeles Section of the American Society of Civil Engineers
(ASCE). This group convened an implementation committee under the auspices of the Southern
California Earthquake Center (SCEC). The committee, which consisted of practicing
geotechnical engineers and engineering geologists, released an overview of the practice of
liquefaction analysis, evaluation, and mitigation techniques (Southern California Earthquake
Center, 1999). This text is also online at: http://www-scec.usc.edu/resources/catalog/
hazardmitigation.html.
This report is one of a series that summarizes the preparation of Seismic Hazard Zone maps
within the state (Smith, 1996). This particular part of the report, Section 2, summarizes seismic
hazard zone mapping for earthquake-induced landslides in the San Mateo 7.5-minute
Quadrangle. Section 1, which addresses liquefaction hazard, and Section 3, which addresses
earthquake-shaking hazard, completes the report. Additional information on seismic hazard zone
mapping in California can be accessed online at: http://www.conservation.ca.gov/cgs/shzp/.
Background
Landslides triggered by earthquakes historically have been a significant cause of earthquake
damage. In California, large earthquakes such as the 1971 San Fernando, 1989 Loma Prieta, and
1994 Northridge earthquakes triggered landslides that were responsible for destroying or
damaging numerous structures, blocking major transportation corridors, and damaging lifeline
infrastructure. Areas that are most susceptible to earthquake-induced landslides are steep slopes
in poorly cemented or highly fractured rocks, sloped areas underlain by loose, weak soils, and
areas on or adjacent to existing landslide deposits. These geologic and terrain conditions exist in
many parts of California, including numerous hillside areas that have been developed or are
likely to be developed in the future. The opportunity for strong earthquake ground shaking is
high in many parts of California because of the presence of numerous active faults. The
combination of these factors constitutes a significant seismic hazard throughout much of
California, including the hillside areas within San Mateo Quadrangle.
Methodology
The delineation of earthquake-induced landslide hazard zones presented in this report is based on
the best available terrain, geologic, geotechnical, and seismological data. If unavailable or
significantly outdated, new forms of these data were compiled or generated specifically for this
project. The following were collected or generated for this evaluation:
• Digital terrain data were collected or generated to provide an up-to-date representation of
slope gradient and slope aspect in the study area.
• Geologic mapping was compiled to provide an accurate representation of the spatial
distribution of geologic materials in the study area. In addition, a map of existing
landslides, whether or not triggered by earthquakes, was prepared.
• Geotechnical laboratory test data were collected and statistically analyzed to
quantitatively characterize the strength properties and dynamic slope stability of geologic
materials in the study area.
Page 32
22 CALIFORNIA GEOLOGICAL SURVEY 2018
• Ground motion from the latest USGS probabilistic shaking map were calculated to
characterize future earthquake shaking within the mapped area, also referred to as
ground-shaking opportunity (see Section 3).
The data collected for this evaluation were processed into a series of geographical information
system (GIS) layers using commercially available software. A slope stability analysis was
performed using the Newmark method (Newmark, 1965), in order to generate a map showing
landslide hazard potential. The earthquake-induced landslide hazard zone was derived from the
landslide hazard potential map according to criteria developed in a CGS pilot study (McCrink
and Real, 1996; McCrink, 2001) and subsequently adopted by the SMGB (CGS, 2004).
Scope and Limitations
The methodology used to make this map is based on earthquake ground-shaking estimates,
geologic material-strength characteristics and slope gradient. These data are gathered from a
variety of outside sources. Although the selection of data used in this evaluation was rigorous,
the quality of the data is variable. The State of California and the Department of Conservation
make no representations or warranties regarding the accuracy of the data gathered from outside
sources.
Earthquake-induced landslide zone maps are intended to prompt more detailed, site-specific
geotechnical investigations as required by the Act. As such, these zone maps identify areas
where the potential for earthquake-induced landslides is relatively high. Due to limitations in
methodology, it should be noted that these zone maps do not necessarily capture all potential
earthquake-induced landslide hazards. Earthquake-induced ground failures that are not
addressed by this map include those associated with ridge-top spreading and shattered ridges. It
should also be noted that no attempt has been made to map potential run-out areas of triggered
landslides. It is possible that run out areas extend beyond the zone boundaries. The potential for
ground failure resulting from liquefaction-induced lateral spreading of alluvial materials,
considered by some to be a form of landsliding, is not specifically addressed by the earthquake-
induced landslide zone or this report.
This section of the report is presented in two parts. Part I addresses the geographic and geologic
setting of the study area while Part II documents the data and parameters used to evaluate
earthquake-induced landslide hazard and to delineate Seismic Hazard Zones for earthquake-
induced landslides in the San Mateo 7.5-Minute Quadrangle.
PART I: GEOGRAPHIC AND GEOLOGIC SETTING
PHYSIOGRAPHY
Location
The San Mateo 7.5-Minute Quadrangle covers an area of approximately 160 square kilometers
(62 square miles) in San Mateo County, California. Located on the San Francisco Peninsula it is
part of the Coast Range Geomorphic Province. The center of the quadrangle is about 26
kilometers (16 miles) south by southeast of the City of San Francisco and about 45 kilometers
Page 33
SHZR 113 SEISMIC HAZARD ZONATION OF THE SAN MATEO QUADRANGLE 23
(28 miles) north by northwest of the City of San Jose. The map area includes developed areas
along the western shores of San Francisco Bay: the cities of Belmont, Burlingame, Foster City,
Hillsborough, Redwood City, San Carlos, San Mateo and a small section of the San Francisco
International Airport. It also includes undeveloped and protected areas in the Santa Cruz
Mountains: the Crystal Springs watershed and Golden Gate National Recreation Area.
Topography
The southwestern third of the quadrangle straddles the Montara block of the Santa Cruz
Mountains and is characterized by flat topped northwest trending ridges. Cahill Ridge (1100 to
1200 feet in elevation) to the southwest, Buri-Buri, and Las Pulgas ridges (700 feet in elevation)
to the northeast delineate the similarly oriented San Andreas Rift Zone. In the central part of the
quadrangle the higher terrain extends eastward and forms the Hillsborough, San Mateo, Belmont
and San Carlos hills where mounds dissected by canyons and narrow valleys reach elevations
close to 400 feet. The rest of the quadrangle covers areas of lower elevation and milder relief.
Alluvial fans emanating from the mountains feature gentle slopes extending towards San
Francisco Bay. The topography flattens out eastward to the shoreline resulting from the
development of tidal marshes and the artificial filling of mudflats.
To the west of the Buri-Buri and Las Pulgas ridges the water collects in the lower and upper
Crystal Springs Reservoirs along the San Andreas Rift Zone. To the east, streams collect in
creeks that drain into San Francisco Bay. Larger creeks in the map area are Easton, Sanchez,
Cherry, San Mateo, Pohlemus, Lourel, Belmont and Pulgas creeks.
Land Use
Many of the cities and towns located on the San Mateo Quadrangle had originally been centers
of rural life until the post-World War II era. Since the 1980s the San Francisco peninsula has
seen a large growth rate as part of the technology boom of the Silicon Valley. The majority of
the industrial, commercial and residential development is located on relatively flat areas along
the shoreline of San Francisco Bay while development in hill slope areas favors low density
residential structures.
Major transportation routes in the map area include northwest-trending State Highway 280 which
runs through the southwest corner of the quadrangle and northwest-trending State Highway 101
that runs near the shoreline of San Francisco Bay through the northeast part of the quadrangle.
They connect the Peninsula to San Francisco to the north and San Jose to the south. The
northeast-trending State Highway 92 in the center of the quadrangle connects the map area to the
East Bay through the San Mateo Bridge. Additional access is provided by a network of city,
county, and private roads in the developed areas and by fire roads and trails in undeveloped
areas.
GEOLOGY
The primary source of bedrock geologic materials map generated for this slope stability
evaluation was U.S. Geological Survey Open-File Report 08-137 (Brabb and others, 1998),
which was obtained from the USGS in digital format. Additionally, USGS Open-File Report 08-
Page 34
24 CALIFORNIA GEOLOGICAL SURVEY 2018
354 (Bonilla and others, 1998) was used as a source for geologic unit nomenclature and USGS
Open-File Report 2006-1037 (Witter and others, 2006) was crucial in the identification of
bedrock/Quaternary contacts. The regional geologic maps bedrock units are described in detail in
this section.
CGS geologists modified the digital geologic map in the following ways. Landslide deposits
were deleted from the map so that the distribution of bedrock formations and the newly created
landslide inventory would exist on separate layers for the hazard analysis. Contacts between
bedrock and surficial units were revised to better conform to the topographic contours of the U.S.
Geological Survey 7.5-minute quadrangle. Air-photo interpretation, digital ortho-photo quarter
quadrangle review, satellite imagery review, and field reconnaissance were performed to assist in
adjusting contacts between bedrock and surficial geologic units and to review geologic unit
lithology and geologic structure. Young alluvial valleys were added or modified by CGS
geologists in some areas to refine the map and ensure continuity of geologic mapping with
adjacent quadrangles. In addition, the relation of the various geologic units to the development
and abundance of landslides was recorded. The distribution of bedrock deposits on the final
geologic materials map was used in combination with other data, discussed below, to evaluate
landslide susceptibility and develop the Seismic Hazard Zone Map.
The geology of the San Mateo County has been divided into ten individual stratigraphic
assemblages that lie within a series of fault-bounded bedrock structural blocks (Brabb and others,
1998). Each stratigraphic assemblage differs from its neighbors in depositional and
deformational history. Two of these stratigraphic assemblages extend into the San Mateo
Quadrangle, separated by the northwest trending San Andreas Fault. The Portola Valley
Assemblage covers an area of approximately 6.4 square kilometers (2.5 square miles) southwest
of the fault in the southwestern corner of the quadrangle. The Woodside Assemblage occupies
most of the quadrangle: 98 square kilometers (38 square miles) northeast of the fault.
The following descriptions of geologic units exposed in the San Mateo Quadrangle are taken
primarily from Brabb and others (1998). Map unit names for Franciscan complex rocks are
taken from Bonilla and others (1998). Quaternary geologic units are briefly described here and
are discussed in more detail in Section 1.
Bedrock Units
Portola Valley Assemblage
The Portola Valley Assemblage consists of Tertiary marine sediments that uncomformably
overlie a composite Mesozoic basement of Franciscan Complex and Coast Range ophiolites.
Several distinct units of the Franciscan Complex from the Portola Valley Assemblage are
mapped in the San Mateo Quadrangle. Greenstone (KJg) consists of basaltic flows, pillow lavas,
breccias, tuffs and minor related intrusive rocks. Limestone (KJl) is fine to coarsely crystalline
limestone and crops out in lenticular bodies usually associated with greenstone. Sandstone (KJs)
consists of fine- to coarse-grained graywacke with interbedded siltstone and shale. Undivided
Franciscan Complex (KJf) consists mostly of graywacke and shale.
Two lithologies of the Coast Range Ophiolite from the Portola Valley Assemblage are mapped in
the San Mateo Quadrangle. Serpentinite (sp) is exposed in small fault-bounded bodies enclosed
by Franciscan rocks. It is extensively to slightly sheared and contains some altered ultramafic
Page 35
SHZR 113 SEISMIC HAZARD ZONATION OF THE SAN MATEO QUADRANGLE 25
rock. Gabbro (Jgb) consists of mafic intrusive rocks, mostly gabbro but can locally include
diabase.
The Whiskey Hill Formation (Tw) of middle and lower Eocene age consists of coarse-grained
arkosic sandstone, with silty claystone, glauconitic sandstone and tuffaceous siltstone. The Santa
Clara Formation (QTsc) of lower Pleistocene and upper Pliocene age consists of poorly
indurated conglomerate, sandstone, and mudstone in irregular and lenticular beds.
Woodside Assemblage
The Woodside Assemblage includes a sequence of Eocene through Plio-Pleistocene rocks that
uncomformably overlie a composite Mesozoic basement consisting of Franciscan Complex and
Coast Range ophiolites.
Several distinct units of the Franciscan Complex from the Woodsdide Assemblage are mapped in
the San Mateo Quadrangle. Sheared rock or mélange (fm, KJm) consists of sandstone, siltstone
and shale that has been extensively sheared but locally contains resistant blocks of relatively
unsheared rock. Chert (KJc) consists of thin to thick chert layers commonly interbedded with
thin shale layers. Conglomerate (KJcg) consists of well−rounded pebbles and cobbles in a
graywacke matrix. Pebbles and cobbles are composed of quartz diorite, arkose, quartzite, chert,
graywacke, and minor amounts of shale, serpentinite, and glaucophane schist. Greenstone (KJg)
consists of basaltic flows, pillow lavas, breccias, tuffs and minor related intrusive rocks.
Limestone (KJl) is fine to coarsely crystalline limestone and crops out in lenticular bodies
usually associated with greenstone. Sandstone (KJs) consists of fine- to coarse-grained
graywacke with interbedded siltstone and shale. Undivided Franciscan Complex (KJf) consists
mostly of graywacke and shale.
One lithology of the Coast Range Ophiolite from the Woodside Assemblage is mapped in the
San Mateo Quadrangle. Serpentinite (sp) is exposed in small fault-bounded bodies enclosed by
Franciscan rocks. Serpentinite is extensively to slightly sheared and contains some altered
ultramafic rock.
The Colma formation (Qc) of Pleistocene age consists of friable to loose, fine to medium-
grained arkosic sand with subordinate amounts of gravel, silt, and clay. The Monterey Formation
(QTm) of middle Miocene age consists of porcelaneous mudstone and shale, impure diatomite,
calcareous claystone with small amounts of sandstone and siltstone near the base. The Santa
Clara Formation (QTsc) of upper Pliocene to lower Pleistocene age consists of non-marine,
poorly indurated conglomerate, sandstone and mudstone in irregular and lenticular beds.
Quaternary Sedimentary Deposits
The flatlands of the San Mateo Quadrangle are covered by Quaternary alluvial sediments and
artificial fill deposits. The alluvial materials were eroded from surrounding hills, then
transported and deposited into the inter-ridge valleys and alluvial plains. Quaternary units in the
San Mateo Quadrangle include: latest Pleistocene alluvial fan deposits (Qpf); Holocene stream
channel deposits (Qhc), Late Pleistocene to Holocene undifferentiated alluvium (Qa, Qha),
Holocene alluvial fans (Qhf), Late Pleistocene to Holocene alluvial terraces (Qt), Holocene
colluvium (Qcy), Holocene San Francisco Bay Mud (Qhbm), undifferentiated artificial fill (af),
artificial fill over estuarine mud (afem), artificial dam fill (adf), artificial levee fill (alf) and
Page 36
26 CALIFORNIA GEOLOGICAL SURVEY 2018
artificial stream channels (ac). See Section 1 and Plate 1.1 for descriptions and distribution of
Quaternary units.
Geologic Structure
The San Mateo Quadrangle is located within the Coast Ranges geomorphic province. The Coast
Ranges are northwest-trending mountain ranges and valleys subparallel to the San Andreas Fault
system marking the transform boundary between the Pacific and North American plates.
Shearing is distributed across a complex system of primarily northwest-trending, right-lateral,
Tertiary and Quaternary strike-slip faults truncating and juxtaposing stratigraphic assemblages.
The Peninsula section of the San Andreas fault crosses the southwestern part of the San Mateo
Quadrangle. A northwest trending 3.5-mile-long segment of the fault is mapped along the
Crystal Springs Reservoir. This portion of the San Andreas Fault ruptured during the 1906 San
Francisco earthquake (Lawson and others, 1908) and is zoned by CGS as an Earthquake Fault
Zone.
Landslide Inventory
As a part of the geologic data compilation, an inventory of existing landslides in the San Mateo
Quadrangle was prepared by analysis of lidar-derived hillshade data, 3D Google Earth Pro
DigitalGlobe and historical imagery, limited field reconnaissance, and a review of previously
published (Wentworth and others, 1985) and unpublished (Manson and others, 2013, Delattre,
2016) geologic-landslide mapping. Landslides were mapped using the 2005 USGS lidar as base
map with a cell size of 1.5 m. For each landslide included on the map a number of
characteristics (attributes) were collected and compiled in a geodatabase. These characteristics
include recency of activity, type, thickness, associated geologic unit(s), and the confidence of
interpretation (definite, probable and questionable). Landslides rated as definite and probable
were incorporated into the landslide zoning as described later in this report. Landslides rated as
questionable were not carried into the landslide zoning due to the uncertainty of their existence.
A small-scale version of the landslide inventory map is shown on Plate 2.1.
A total of 142 landslides were mapped in the San Mateo Quadrangle covering about 1.25% of
the bedrock geologic units. There are 5 historic landslides and the rest are dormant-young and
dormant-mature consisting of 129 rock slides, 10 debris flows, 2 debris fans and one earth flow.
These landslides have developed on moderate to steep slopes and adverse bedding conditions
appear not to be a significant factor in any of the slope failures. Brabb (1983) on his investigation
of direction and amount of bedding dip of sedimentary rocks in San Mateo County has
categorized the dips of the bedrock geologic units within the San Mateo Quadrangle as too
variable to generalize.
The majority of the landslides occur in Metamorphic Rocks (fm) covering about 510,075 m2
(126 acres), serpentinite (sp) 458,074 m2 (113 acres), Franciscan Sandstone and Shale (KJs)
300,912 m2 (74 acres), and Franciscan Metamorphics (KJm) 4,915 m2 (1.2 acres) in the form of
rock slides. In terms of area percentage affected by landslides, the bedrock geologic units most
susceptible to landsliding are the Franciscan Metamorphics (24.44%) and serpentinite (9.19%).
A cluster of dormant rock slides occurs on the moderate to steep slopes along Crystal Springs
Road in the southeastern part of the quadrangle that is underlain by the Metamorphic Rocks
Page 37
SHZR 113 SEISMIC HAZARD ZONATION OF THE SAN MATEO QUADRANGLE 27
(fm). Two large questionable landslides are mapped on the serpentinite (sp) near the Bunker Hill
Drive and Skyline Boulevard encroaching the Lower Crystal Springs Reservoir. Small rock
slides on Franciscan Sandstone and Shale (KJs) are also mapped in the middle-southern part of
the quadrangle.
Because it is not within the scope of the Act to review and monitor grading practices to ensure
past slope failures have been properly mitigated, all documented slope failures, whether or not
the surface expression currently exists, are included in the landslide inventory.
ENGINEERING GEOLOGY
Geologic Material Strength
To evaluate the stability of geologic materials under earthquake conditions, shear strengths were
assigned to the geologic map units described above. Generally, the primary source for shear-
strength measurements is geotechnical reports prepared by consultants on file with local
government permitting departments. Shear-strength data for the units identified on the San
Mateo Quadrangle geologic map were obtained from the county of San Mateo and the cities of
Belmont, Burlingame, Foster City, Hillsborough, Redwood City, San Carlos, and San Mateo (see
Appendix A). Shear tests from the adjoining Palo Alto Quadrangle were extracted from previous
seismic hazard assessment and zoning efforts and used to augment data for several geologic
formations for which little or no shear test information was available within the San Mateo
Quadrangle. Additionally, a statistical analysis of the shear strength parameters reported for the
same lithologies in the San Francisco, Mountain View, Mindego Hill, and Cupertino quadrangles
was used to compare and complete the San Mateo dataset.
In an effort to better represent heterogeneous lithological units, additional shear strength
information was collected applying the Hoek-Brown Failure Criterion (Hoek and others, 2002).
The non-linear Hoek-Brown criterion is a rock mass characterization method which uses
equations to relate rock mass classification through a Geological Strength Index (GSI) to the
angle of internal friction of a rock mass. This method allows strength assessment based on
collected data, mainly discontinuity density, discontinuity condition, and geologic material
properties (Hoek and others, 2002; Marinos and others, 2007). In particular, this method was
applied for the serpentinite geologic unit (sp) because of the very limited laboratory tests
available that yielded very high phi values that do not correspond to the lithologic characteristics
of this rock unit as observed in the field.
Shear strength data gathered from the above sources were compiled for each geologic map unit.
Mean phi values in the San Mateo and adjacent quadrangles are presented and compared in
Table 2.1. The mean phi value used in our slope stability analysis is selected from the shear
strength measurements in the San Mateo Quadrangle. Geologic map units that do not have
laboratory shear strength data are assigned phi values from shear strengths reported in the Palo
Alto and/or San Francisco, Mountain View, Mindego Hill, Cupertino quadrangles.
The locations of rock and soil samples taken for shear testing and for Hoek-Brown rock mass
characterization within the San Mateo Quadrangle are shown on Plate 2.1. A geologic material
strength map was made based on the values presented in Table 2.1 and this map provides a
spatial representation of material strength used in the slope stability analysis.
Page 38
28 CALIFORNIA GEOLOGICAL SURVEY 2018
Table 2.1. Summary of the shear strength statistics for the San Mateo Quadrangle.
SAN MATEO QUADRANGLE
SHEAR STRENGTH DATA SUMMARY
Formation
Name
Number Tests
(shear
test/Hoek
Brown Failure
Criterion)
Mean Phi (deg)
Mean Phi in adjacent and neighboring
quadrangles
No Data: Similar
Lithology
Phi Values
Used in
Stability
Analyses Palo Alto
San Francisco
Palo Alto
Mountain View
Mindego Hill
Cupertino
af 29/0 24 25 22 ac; alf; afem; acf;
adf 24
Qa 7/0 21 21 22 21
Qc 3/0 32 36 32
Qcy 23*
Qha 33/0 25 23 22 25
Qhbm 26 20 26
Qhc 27 24 27
Qhf 46/0 22 22 21 22
Qpf 15/0 27 29 27
Qt 29 29
QTsc 137/0 29 29 29 29
QTm 29 29
Tw 171 34 34 34 34
fm 24/3 26 34 29 KJm 26
KJf 29 29 29
KJc 15/3 31 30 31 31
KJs 27/1 23 36 23
KJg 19/0 31 36 31
KJl 34 34 34
KJcg 36 36
sp 3/3 25 30 30 25
Jgb 29 29 29
Formation name abbreviations from Brabb (1998) and Bonilla (1998)
* No data available; phi value based on age, lithology, and geologic properties
Page 39
SHZR 113 SEISMIC HAZARD ZONATION OF THE SAN MATEO QUADRANGLE 29
Existing Landslides
As discussed later in this report, the criteria for landslide zone mapping state that all existing
landslides that are mapped as definite or probable are automatically included in the Seismic
Hazard Zone for earthquake-induced landslides. Therefore, an evaluation of shear strength
parameters for existing landslides is not necessary for the preparation of the zone map.
However, in the interest of completeness for the material strength map, to provide relevant
material strength information to project plan reviewers, and to allow for future revisions of our
zone mapping procedures, we collect and compile shear strength data considered representative
of existing landslides within the quadrangle, if available.
The strength characteristics of existing landslides (Qls) must be based on tests of the materials
along the landslide slip surface. Ideally, shear tests of slip surfaces formed in each mapped
geologic unit would be used. However, this amount of information is rarely available. We
collect and compile primarily “residual” strength parameters from laboratory tests of slip surface
materials tested in direct shear or ring shear test equipment. For the San Mateo Quadrangle,
strength parameters applicable to existing landslide planes were not available, so the strength
parameter for existing landslides (Qls) is not included in this analysis.
Digital Terrain Data
The calculation of slope gradient is an essential part of the evaluation of slope stability under
earthquake conditions. An accurate slope gradient calculation begins with an up-to-date map
representation of the earth’s surface. Within the San Mateo Quadrangle, 1.5 m Lidar Digital
Terrain Model (DTM) was obtained from the USGS (U.S. Geological Survey, 2005). This DTM
is originally in geographic coordinate system and later reprojected to Teale Albers NAD 1983
using the bilinear resampling technique to minimize horizontal and vertical striping and stair-
stepping artifacts. A slope gradient map was made from the reprojected DTM, using the average
maximum technique (also known as neighborhood-slope algorithm), where the maximum rate of
change for each cell is calculated over the distance between the cell and its eight neighbors to
identify the steepest downhill descent (Burrough and McDonnell, 1998).
Areas in the hilly parts of the quadrangle that have undergone modification after the lidar
acquisition were revalidated using recent 3D Google Earth Pro imagery. Lidar bare earth terrain
data is also liable to contain misclassified point data that can give rise to facet artifacts and false
topography especially on man-made features such as highway interchanges and flyovers. Care
must be taken when landslide hazard zone is mapped over these features.
PART II: EARTHQUAKE-INDUCED LANDSLIDE HAZARD
ASSESSMENT
MAPPING TECHNIQUES
To evaluate earthquake-induced landslide hazard potential in the study area, a method of
dynamic slope stability analysis developed by Newmark (1965) was used. The Newmark
method as originally implemented analyzes dynamic slope stability by calculating the cumulative
Page 40
30 CALIFORNIA GEOLOGICAL SURVEY 2018
down-slope displacement for a given earthquake strong-motion time history. The double
integration of the earthquake acceleration recording to derive displacement considers only
accelerations above a threshold value that represents the inertial force required to initiate slope
movement (Factor of Safety = 1). This threshold value, called the “yield acceleration,” is a
function of the strength of the earth materials and the slope gradient, and therefore represents the
susceptibility of a given area to earthquake-induced slope failure.
As implemented for the preparation of earthquake-induced landslide zones, susceptibility is
derived by combining a geologic map modified to reflect material strength estimates with a slope
gradient map. Ground shaking opportunity is derived from the CGS/USGS statewide
probabilistic shaking map, and Newmark displacements are estimated from a regression equation
developed by Jibson (2007) that uses susceptibility and ground motion parameters.
Displacement thresholds that define earthquake-induced hazard zones are from McCrink and
Real (1996) and McCrink (2001).
EARTHQUAKE-INDUCED LANDSLIDE SUSCEPTIBILITY
Earthquake-induced landslide susceptibility, defined here as Newmark’s yield acceleration
(1965), is a function of the Factor of Safety (FS) and the slope gradient. To derive a Factor of
Safety, an infinite-slope failure model under unsaturated slope conditions was assumed. In
addition, material strength is characterized by the angle of internal friction (Ф) and cohesion is
ignored. As a result of these simplifying assumptions, the calculation of FS becomes
𝐹𝑆 =tan Ф
tan 𝛽
where β is the slope gradient. The yield acceleration (ay) is then calculated from Newmark’s
equation:
𝑎𝑦 = (𝐹𝑆 − 1)𝑔 sin 𝛼
where FS is the Factor of Safety, g is the acceleration due to gravity, and is the direction of
movement of the slide mass, in degrees measured from the horizontal, when displacement is
initiated (Newmark, 1965). For an infinite slope failure is the same as the slope gradient angle
(β).
These calculations are conducted on a GIS by converting the vector (lines, points and polygons)
digital geologic map to a raster (regular spaced grid) material strength map that contains the Ф values assigned to the mapped geologic units (Table 2.1). The slope gradient generated from the
USGS Lidar was used in this equation.
GROUND SHAKING OPPORTUNITY
Ground shaking opportunity is a calculated measure of the intensity and duration of strong
ground motion anticipated to occur. Ground motion calculations used by CGS for regional
earthquake-induced landslide zonation assessments are currently based on the USGS
probabilistic seismic hazard analysis (PSHA) model for the 2014 Update of the United States
Page 41
SHZR 113 SEISMIC HAZARD ZONATION OF THE SAN MATEO QUADRANGLE 31
National Seismic Hazard Maps (NSHM) (Petersen and others, 2014; 2015). The model is set to
calculate ground motion hazard at a 10 percent in 50 years exceedance level. Raster versions of
the PSHA PGA and Modal Magnitude maps for the San Mateo Quadrangle were calculated from
the statewide model and applied in the Newmark displacement calculations, as described below.
A more detailed description of the development of ground shaking opportunity data and
parameters used in the preparation of the Seismic Hazard Zone for earthquake-induced landslides
can be found in Section 3 of this report
EARTHQUAKE-INDUCED LANDSLIDE HAZARD POTENTIAL
Earthquake-induced landslide hazard potential is derived by combining the susceptibility map
(ay) with the ground shaking opportunity maps (PGA and Modal Magnitude) to estimate the
amount of permanent displacement that a modeled slope might experience. The permanent slope
displacement is estimated using a regression equation developed by Jibson (2007). That
equation is:
log 𝐷𝑁 = −2.710 + log [(1 −𝑎𝑦
𝑃𝐺𝐴)
2.335
(𝑎𝑦
𝑃𝐺𝐴)
−1.478
] + 0.424𝑴 ± 0.454
where DN is Newmark displacement and M is magnitude. Jibson’s (2007) nomenclature for
yield acceleration (ac) and peak ground acceleration (amax) have been replaced here by ay and
PGA, respectively, to be consistent with the nomenclature used in this report.
The above equation was applied using ay, PGA and Modal Magnitude maps as input, resulting in
mean values of Newmark displacement at each grid cell (the standard deviation term at the end
of the equation is ignored). The amount of displacement predicted by the Newmark analysis
provides an indication of the relative amount of damage that could be caused by earthquake-
induced landsliding. Displacements of 30, 15 and 5 cm were used as criteria for rating levels of
earthquake-induced landslide hazard potential based on the work of Youd (1980), Wilson and
Keefer (1983), and a CGS pilot study for earthquake-induced landslides (McCrink and Real,
1996; McCrink, 2001).
ZONATION CRITERIA: EARTHQUAKE-INDUCED LANDSLIDES
Earthquake-induced landslide zones were delineated using criteria adopted by the California
State Mining and Geology Board (CGS, 2004). Under these criteria, earthquake-induced
landslide hazard zones are defined as areas that meet one or both of the following conditions:
1. Areas that have been identified as having experienced landslide movement in the past,
including all mappable landslide deposits and source areas as well as any landslide that is
known to have been triggered by historic earthquake activity.
2. Areas where the geologic and geotechnical data and analyses indicate that the earth
materials may be susceptible to earthquake-induced slope failure.
These conditions are discussed in further detail in the following sections.
Page 42
32 CALIFORNIA GEOLOGICAL SURVEY 2018
DELINEATION OF SEISMIC HAZARD ZONES: EARTHQUAKE-
INDUCED LANDSLIDES
Upon completion of an earthquake-induced landslide hazard evaluation within a project
quadrangle, CGS applies the above criteria to its findings in order to delineate the Seismic
Hazard Zone for earthquake-induced landslides. Following is a description of the criteria-based
factors that governed the construction of the Seismic Hazard Zone Map for the San Mateo
Quadrangle.
Existing Landslides
Existing landslides typically consist of disrupted soils and rock materials that are generally
weaker than adjacent undisturbed rock and soil materials. Previous studies indicate that existing
landslides can be reactivated by earthquake movements (Keefer, 1984). Earthquake-triggered
movement of existing landslides is most pronounced in steep head scarp areas and at the toe of
existing landslide deposits. Although reactivation of deep-seated landslide deposits is less
common (Keefer, 1984), a significant number of deep-seated landslide movements have
occurred during, or soon after, several recent earthquakes. Based on these observations, all
existing landslides with a definite or probable confidence rating are included within the Seismic
Hazard Zone.
Hazard Potential Analysis
Based on the conclusions of a pilot study performed by CGS (McCrink and Real, 1996;
McCrink, 2001), the Seismic Hazard Zone encompass all areas that have calculated Newmark
displacements of 5 centimeters or greater.
ACKNOWLEDGMENTS
The authors would like to thank James Mazzetta with the department of Public Works for San
Mateo County, Mark Nolfi, Joe Cyr, Marty Cooper, Christopher Valley, Stephen Lau and
personnel with the cities of Belmont, Burlingame, Foster City, Redwood City, San Carlos and
San Mateo, Ted Sayer with Cotton, Shires and Associates, Inc. and David Hall Connell with
Connell Geotechnical, Inc. for their assistance in obtaining the data necessary to complete this
project. At the California Geological Survey, the authors would like to thank Tim McCrink, Ante
Mlinarevic, Anne Rosinski, Mike Silva and Eleanor Spangler for providing valuable feedback
and their technical reviews of this report. Marc Delattre peer-reviewed the landslide inventory.
Thanks to Terilee McGuire and Bob Moskovitz for their database support. Thanks to Janine
Bird, Kate Thomas and Jim Thompson for their GIS support. And thanks to Ron Rubin, David
Olsen and Nathaniel Barrett for their help with the geotechnical data collection effort.
Page 43
SHZR 113 SEISMIC HAZARD ZONATION OF THE SAN MATEO QUADRANGLE 33
REFERENCES
Bonilla, M.G., 1998, Preliminary geologic map of the San Francisco South 7.5-minute
Quadrangle and part of the Hunters Point 7.5-minute Quadrangle, California: a digital
database: U.S. Geological Survey Open-File Report 98-354; scale 1:24,000.
Brabb, E.E., 1983, Map showing direction and amount of bedding dip of sedimentary rocks in
San Mateo County, California, U.S. Geological Survey Miscellaneous Investigations Map I-
1257C, scale 1: 62,500.
Brabb, E.E., Graymer, R.W., and Jones, D.L., 1998, Geology of the onshore part of San Mateo
County, California: A digital database: U.S. Geological Survey Open-File Report 98-137.
Brabb, E.E., Graymer, R.W. and Jones, D.L., 1998, Geology of the Palo Alto 30 x 60 Minute
Quadrangle, California: a digital database; U. S Geological Survey Open File Report 98-
348.
Burrough. P.A., and McDonnell, R.A. 1998, Principles of Geographic Information Systems:
New York, Oxford university Press, 190 p.
California Geological Survey, 2004, Recommended criteria for delineating seismic hazard zones
in California: California Geological Survey Special Publication 118, 12 p. Available on-line
at: http://www.conservation.ca.gov/cgs/shzp/webdocs/sp118_revised.pdf.
California Geological Survey, 2008, Guidelines for evaluating and mitigating seismic hazards in
California: California Geological Survey Special Publication 117a, 98 p. Available on-line
at: http://www.conservation.ca.gov/cgs/shzp/webdocs/sp117.pdf.
Delattre, M., 2016, Digital landslide mapping of San Mateo 7.5-Minute Quadrangle, San Mateo
County, California, California Geological Survey Landslide Inventory Database,
unpublished digital map.
Hoek. E., Caranza-Torres, C.T., and Corkum, B., 2002, Hoek–Brown failure criterion—2002
edition in Bawden, H.R., Bawden, W., Curran, J., and Telesnicki, M., editors, Proceedings
of the Fifth North American Rock Mechanics Symposium (NARMS-TAC), University of
Toronto Press, Toronto, pp 267–273.
Jibson, R.W., 2007, Regression models for estimating coseismic landslide displacement:
Engineering Geology, vol. 91, issue 2-4, p. 209-218.
Keefer, D.K., 1984, Landslides caused by earthquakes: Geological Society of America Bulletin,
v. 95, no. 4, p. 406-421.
Knudsen, K.L., J.M. Sowers, R.C. Witter, C.M. Wentworth, and E.J. Helley, 2000a, Preliminary
Maps of Quaternary Deposits and Liquefaction Susceptibility, Nine-County San Francisco
Bay Region, California: A Digital Database, U.S. Geological Survey Open-File Report 00-
444. Digital Database by Wentworth, C.M., Nicholson, R.S., Wright, H.M., and Brown,
K.H. Online Version 1.0. Manson, M., Delattre, M., and Perez, F.G., 2013, Digital landslide
mapping of San Mateo 7.5-Minute Quadrangle, San Mateo County, California, California
Geological Survey, unpublished digital map.
Lawson, A. C., and others, 1908, The California earthquake of April 18, 1906: Report of the
State Earthquake Investigation Commission: Carnegie Inst. Washington Pub. 87, 3 vols., 1
atlas.
Page 44
34 CALIFORNIA GEOLOGICAL SURVEY 2018
Manson, M., Delattre, M., and Perez, F.G., 2013, Digital landslide mapping of San Mateo 7.5-
Minute Quadrangle, San Mateo County, California, California Geological Survey,
unpublished digital map.
Marinos, P., Marinos, V., and Hoek, E., 2007, Geological Strength Index (GSI). A
characterization tool for assessing engineering properties for rock masses in Olalla, C.,
Perucho, A., and Romana, M., editors, proceedings of the ISRM workshop W1: Madrid,
Spain 2007: Taylor & Francis, p.13-21.
McCrink, T.P., 2001, Mapping earthquake-induced landslide hazards in Santa Cruz County in
Ferriz, H., and Anderson, R., editors, Engineering geology practice in northern California:
California Geological Survey Bulletin 210 / Association of Engineering Geologists Special
Publication 12, p. 77-94.
McCrink, T.P., and Real, C.R., 1996, Evaluation of the Newmark method for mapping
earthquake-induced landslide hazards in the Laurel 7.5-minute Quadrangle, Santa Cruz
County, California: California Division of Mines and Geology Final Technical Report for
U.S. Geological Survey Contract 143-93-G-2334, U.S. Geological Survey, Reston, Virginia,
31 p.
Newmark, N.M., 1965, Effects of earthquakes on dams and embankments: Geotechnique, v. 15,
no. 2, p. 139-160.
Petersen, M.D., Moschetti, M.P., Powers, P.M., Mueller, C.S., Haller, K.M., Frankel, A.D.,
Zeng, Y., Rezaeian, S., Harmsen, S.C., Boyd, O.S., Field, N., Chen, R., Rukstales, K.S.,
Luco, N., Wheeler, R.L., Williams, R.A., and Olsen, A.H., 2014, Documentation for the
2014 update of the United States national seismic hazard maps, U.S. Geol. Survey. Open-
File Rept. 2014-1091, 243 pp., doi: 10.3133/ofr20141091.
Petersen, M.D., Moschetti, M.P., Powers, P.M., Mueller, C.S., Haller, K.M., Frankel, A.D.,
Zeng, Y., Rezaeian, S., Harmsen, S.C., Boyd, O.S., Field, N., Chen, R., Rukstales, K.S.,
Luco, N., Wheeler, R.L., Williams, R.A., and Olsen, A.H., 2015, The 2014 United States
national seismic hazard model: Earthquake Spectra, vol. 31, no. S1, p. S1–S30, doi:
10.1193/120814EQS210M.
Smith, T.C., 1996, Preliminary maps of seismic hazard zones and draft guidelines for evaluating
and mitigating seismic hazards: California Geology, v. 49, no. 6, p. 147-150.
Southern California Earthquake Center, 1999, Recommended procedures for implementation of
DMG Special Publication 117 guidelines for analyzing and mitigating landslide hazards in
California: T.F. Blake, R.A. Hollingsworth, and J.P. Stewart, editors, Southern California
Earthquake Center, University of Southern California, 108 p.
U.S. Geological Survey, 2005, Digital Surface and Terrain Models (DSM, DTM), lidar-derived
digital terrain model for San Mateo County: https://catalog.data.gov/dataset/digital-surface-
and-terrain-models-dsmdtm-lidar-derived-digital-terrain-model-for-san-mateo-couc2700.
Wentworth, C.M., Ellen, S., Frizzel, Jr., V.A., and Schlocker, J., 1985, Map of hillside materials
and description of their engineering character, San Mateo, County, California, U.S.
Geological Survey Miscellaneous Investigations Map I-1257D, 2 sheets, scale 1: 62,500.
Page 45
SHZR 113 SEISMIC HAZARD ZONATION OF THE SAN MATEO QUADRANGLE 35
Wilson, R.C., and Keefer, D.K., 1983, Dynamic analysis of a slope failure from the 1979 Coyote
Lake, California, earthquake: Bulletin of the Seismological Society of America, v. 73, p.
863-877
Witter, R.C., Knudsen, K.L., Sowers, J.M., Wentworth, C.M., Koehler, R.D., Randolph, C.E.,
Brooks, S, K., and Gans, K.D., 2006, Maps of Quaternary deposits and liquefaction
susceptibility in the central San Francisco Bay region, California, U.S. Geological Survey
Open-File Report 2006-1037, 43p.
Youd, T.L., 1980, Ground failure displacement and earthquake damage to buildings: American
Society of Civil Engineers Conference on Civil Engineering and Nuclear Power, 2d,
Knoxville, Tennessee, 1980, v. 2, p. 7-6-2 to 7-6-26.
Air Photos and Imagery
Google Earth Pro DigitalGlobe, >1-m resolution, 2003-2005, 2007, and 2009.
Google Earth Pro Historical Imagery, various resolutions, 1991, 1993, 2002-2010, and 2014.
Lidar Hillshade derived from the 1.5 m Lidar Digital Terrain Model (2005), source of
illumination: 45° sun angle, and 90° and 315° sun azimuths.
USGS 7.5-minute Digital Raster Graphics, 1;24000 scale, scanned at 250 dpi, 2001.
Page 46
36 CALIFORNIA GEOLOGICAL SURVEY 2018
APPENDIX A: SOURCES OF ROCK STRENGTH DATA
SOURCE NUMBER OF TESTS
SELECTED
San Mateo County 19
City of Burlingame 7
City of San Mateo 50
City of Belmont 19
City of San Carlos 34
Palo Alto Quadrangle 435
San Francisco Quadrangle 79
Mountain View Quadrangle 61
Cupertino Quadrangle 202
Mindego Hill Quadrangle 201
Total Number of Shear Tests 1107
Page 47
SHZR 113 SEISMIC HAZARD ZONATION OF THE SAN MATEO QUADRANGLE 37
SECTION 3: GROUND SHAKING ASSESSMENT
for the
SAN MATEO 7.5-MINUTE QUADRANGLE,
SAN MATEO COUNTY, CALIFORNIA
using the
2014 Probabilistic Seismic Hazard Assessment Model
by
Rui Chen P.G. 8598
DEPARTMENT OF CONSERVATION
CALIFORNIA GEOLOGICAL SURVEY
INTRODUCTION
Purpose
The Seismic Hazards Mapping Act of 1990 (the Act) (Public Resources Code, Chapter 7.8,
Division 2) directs the California State Geologist to compile maps that identify Seismic Hazard
Zones consistent with requirements and priorities established by the California State Mining and
Geology Board (SMGB) (California Geological Survey, 2004). The text of this report is
available online at: http://www.conservation.ca.gov/cgs/shzp/webdocs/documents/
sp118_revised.pdf.
The Act requires that site-specific geotechnical investigations be performed for most urban
development projects situated within Seismic Hazard Zones before lead agencies can issue the
building permit. The Act also requires sellers of real property within these zones to disclose that
fact at the time such property is sold. Evaluation and mitigation of seismic hazards are to be
conducted under guidelines adopted by the California SMGB (California Geological Survey,
2008). The text of this report is online at: http://www.conservation.ca.gov/cgs/shzp/
webdocs/documents/sp117.pdf.
This section of the evaluation report summarizes the ground motions used to evaluate
liquefaction and earthquake-induced landslide potential for zoning purposes. Site-specific ground
motions can be calculated using U.S. Geological Survey (USGS) Unified Hazard Tool available
online at: https://earthquake.usgs.gov/hazards/interactive/.
This section and Sections 1 and 2, which address liquefaction and earthquake-induced landslide
hazards, respectively, constitute a report series that summarizes development of Seismic Hazard
Zone maps in the state. Additional information on seismic hazard zone mapping in California
can be accessed on the California Geological Survey's website: http://conservation.ca.gov/
CGS/shzp.
Page 48
38 CALIFORNIA GEOLOGICAL SURVEY 2018
PROBABILISTIC SEISMIC HAZARD ANALYSIS MODEL
Probabilistic ground motions are calculated using the USGS probabilistic seismic hazard analysis
(PSHA) model for the 2014 Update of the United States National Seismic Hazard Maps (NSHM)
(Petersen and others, 2014; 2015). This model replaces ground-motion models of Petersen and
others (2008), Frankel and others (2002), Cao and others (2003), and Petersen and others (1996)
used in previous official Seismic Hazard Zone Maps. Like previous models, the 2014 USGS
PSHA model utilizes the best available science, models and data, and is the product of an
extensive effort to obtain consensus within the scientific and engineering communities regarding
earthquake sources and ground motions. In California, two earthquake source models control
ground motion hazards, namely version three of the Uniform California Earthquake Rupture
Forecast Model (UCERF3) (Field and others, 2013; 2014) and the Cascadia Subduction Zone
model (Frankel and others, 2014). For shallow crustal earthquakes, ground motions are
calculated using the Next Generation Attenuation Relations for Western U.S. (NGA-West2)
developed from a Pacific Earthquake Engineering Research Center ground motion research
project (Bozorgnia and others, 2014). The NGA-West2 includes five ground motion attenuation
equations (GMPEs): Abrahamson and others (2014), Boore and others (2014), Campbell and
Bozorgnia (2014), Chiou and Youngs (2014), and Idriss (2014). For subduction zone
earthquakes and earthquakes of other deep sources, GMPEs developed specifically for such
sources are used, including Atkinson and Boore (2003) global model, Zhao and others (2006),
Atkinson and Macias (2009), and BC Hydro (Addo and others, 2012).
In PSHA, ground motion hazards from potential earthquakes of all magnitudes and distances on
all potential seismic sources are integrated. GMPEs are used to calculate shaking level from each
earthquake based on earthquake magnitude, rupture distance, type of fault rupture (strike-slip,
reverse, normal, or subduction), and other parameters such as time-average shear-wave velocity
in the upper 30 m beneath a site (VS30). In previous applications, a uniform firm-rock site
condition was assumed in PSHA calculation and, in a separate post-PSHA step, National
Earthquake Hazard Reduction Program (NEHRP) amplification factors were applied to adjust all
sites to a uniform alluvial soil condition to approximately account for the effect of site condition
on ground motion amplitude. In the current application, site effect is directly incorporated in
PSHA via GMPE scaling. Specifically, VS30 is built into GMPEs as one of the repressors and,
therefore, it is an input parameter in PSHA calculation. VS30 value at each grid point is assigned
based on a geology- and topography-based VS30 map for California developed by Wills and
others (2015). The statewide VS30 map consists of fifteen VS30 groups with group mean VS30 value
ranging from 176 m/s to 733 m/s. It is to be noted that these values are not determined from site-
specific velocity data. Some group values have considerable uncertainties as indicated by a
coefficient of variation ranging from 11% in Quaternary (Pleistocene) sand deposits to 55% in
crystalline rocks.
For zoning purpose, ground motions are calculated at each grid point of a 0.005-degree grid
(approximately 500-m spacing) that adequately covers the entire quadrangle. VS30 map and grid
points in the San Mateo Quadrangle are depicted in Plate 3.1. For site investigation, it is strongly
recommended that VS30 be determined from site-specific shear wave velocity profile data.
PSHA provides more comprehensive characterizations of ground motion hazards compared to
traditional scenario-based analysis by integrating hazards from all earthquakes above a certain
Page 49
SHZR 113 SEISMIC HAZARD ZONATION OF THE SAN MATEO QUADRANGLE 39
magnitude threshold. However, many applications of seismic hazard analyses, including
liquefaction and induced landslide hazard mapping analyses, still rely on scenario earthquakes or
some aspects of scenario earthquakes. Deaggregation enables identification of the most
significant scenario or scenarios in terms of magnitude and distance pair. Deaggregation is often
performed for a particular site, a chosen ground motion parameter (such as peak ground
acceleration or PGA), and a predefined exceedance probability level (i.e., hazard level). Like in
previous regulatory zone maps, ground motion hazard level for liquefaction and landslide hazard
zoning is 10% exceedance probability in 50 years or 475-year return period.
Probabilistic ground motion calculation and hazard deaggregation are performed using a new
USGS hazard codebase, nshmp-haz version 1.0.0, a Java library developed in support of the
USGS NSHM project. The Java code library is hosted in GitHub and is publically available at:
https://github.com/usgs/nshmp-haz/releases/tag/v1.0.0). It is also the codebase that support
USGS web-based site-specific ground motions calculator, the Unified Hazard Tool
(https://earthquake.usgs.gov/hazards/interactive/). The source model used for the published 2014
NSHMs is adopted in its entirety. The 2014 source model is also hosted in GitHub and publically
available at: https://github.com/usgs/nshmp-model-cous-2014/.
APPLICATION TO LIQUEFACTION AND LANDSLIDE HAZARD
ASSESSMENT
The current CGS liquefaction hazard analysis approach requires PGA be scaled by an earthquake
magnitude weighting factor (MWF) to incorporate a magnitude-correlated duration effect
(California Geological Survey, 2004; 2008). The MWF-scaled PGA is referred to as pseudo-
PGA and is used as Liquefaction Opportunity (see Section 1 of this report). MWF calculation is
straight forward for a scenario earthquake. In PSHA, however, earthquakes of different
magnitudes and distances contribute differently to the total hazard at a chosen probabilistic PGA
level. The CGS approach to MWF calculation is based on binned magnitude-distance
deaggregation. An MWF is calculated for each magnitude-distance bin and is weighted by the
contribution of that magnitude-distance bin to the total hazard. The total MWF is the sum of
probabilistic hazard-weighted MWFs from all magnitude-distance bins. This approach provides
an improved estimate of liquefaction hazard in a probabilistic sense. All magnitudes contributing
to the hazard estimate are used to weight the probabilistic calculation of PGA, effectively
causing the cyclic stress ratio liquefaction threshold curves to be scaled probabilistically when
computing factor of safety. This procedure ensures that large, distant earthquakes that occur less
frequently but contribute more, and smaller, more frequent events that contribute less to the
liquefaction hazard are appropriately accounted for (Real and others, 2000).
The current CGS landslide hazard analysis approach requires the probabilistic PGA and a
predominant earthquake magnitude to estimate cumulative Newmark displacement for a given
rock strength and slope gradient condition using a regression equation, described more fully in
Section 2 of this report. The predominant earthquake magnitude is chosen to be the modal
magnitude from deaggregation.
Pseudo-PGA and probabilistic PGA at grid points are depicted in Plates 3.2 and 3.3, respectively.
Modal magnitude is depicted in Plate 3.4. Ground motion hazards in San Mateo Quadrangle are
controlled mainly by the Northern San Andreas fault. Other sources that contribute to ground
motion hazards include Hayward fault, San Gregorio fault, Calaveras fault, Monte Vista –
Page 50
40 CALIFORNIA GEOLOGICAL SURVEY 2018
Shannon fault, and background seismicity. Modal magnitude generally reflects the magnitudes of
earthquakes that these contributing seismic sources are capable of producing. Ground motion
distribution also is affected significantly by subsurface geology. In general, expected PGA and
pseudo-PGA are higher where there are softer Quaternary sediments (lower VS30 values) such as
in flat areas adjacent to San Francisco Bay and along the San Andreas fault valley. Ground
motions are lower in hilly areas where there are harder rocks (higher VS30 values). The table
below summarizes ranges of PGA, pseudo-PGA, modal magnitude, and VS30 values expected in
the quadrangle.
PGA
(g)
Pseudo-PGA
(g)
Modal Magnitude VS30
(m/s)
0.47 to 0.72 0.45 to 0.70 7.5 to 7.9 176 to 733
REFERENCES
Abrahamson, N.A., Silva, W.J., and Kamai, R., 2014, Summary of the ASK14 ground motion
relation for active crustal regions: Earthquake Spectra, vol. 30, p. 1025–1055.
Addo, K., Abrahamson, N., and Youngs, R. (BC Hydro), 2012, Probabilistic seismic hazard
analysis (PSHA) model—Ground motion characterization (GMC) model: Report E658,
published by BC Hydro.
Atkinson, G.M., and Boore, D.M., 2003, Empirical ground-motion relations for subduction-zone
earthquakes and their application to Cascadia and other regions: Bulletin of the
Seismological Society of America, vol. 93, p. 1,703–1,729.
Atkinson, G.M., and Macias, M., 2009, Predicted ground motions for great interface earthquakes
in the Cascadia subduction zone: Bulletin of the Seismological Society of America, vol. 99,
p. 1,552–1,578.
Boore, D.M., Stewart, J.P., Seyhan, E., and Atkinson, G.M., 2014. NGA-West2 equations for
predicting PGA, PGV, and 5% damped PSA for shallow crustal earthquakes: Earthquake
Spectra, vol. 30, p. 1057–1085.
Bozorgnia Y., Abrahamson, N.A., Atik, L.A., Dawson T.D., and others, 2014, NGA-West2
Research Project: Earthquake Spectra, vol 30, no. 3, p. 973 –987, DOI:
10.1193/072113EQS209M.
California Geological Survey, 2004, Recommended criteria for delineating seismic hazard zones
in California: California Geological Survey Special Publication 118, 12 p. Available on-line
at: http://www.conservation.ca.gov/cgs/shzp/webdocs/sp118_revised.pdf.
California Geological Survey, 2008, Guidelines for evaluating and mitigating seismic hazards in
California: California Geological Survey Special Publication 117a, 98 p. Available on-line
at: http://www.conservation.ca.gov/cgs/shzp/webdocs/sp117.pdf.
Campbell, K.W., and Bozorgnia, Y., 2014, NGA-West2 ground motion model for the average
horizontal components of PGA, PGV, and 5% damped linear acceleration response spectra:
Earthquake Spectra, vol. 30, p. 1087–1115.
Page 51
SHZR 113 SEISMIC HAZARD ZONATION OF THE SAN MATEO QUADRANGLE 41
Cao, T., Bryant, W.A., Rowshandel, B., Branum, D. and Wills, C.J., 2003, The Revised 2002
California Probabilistic Seismic Hazard Maps. California Geological Survey, Online Report:
http://www.consrv.ca.gov/cgs/rghm/psha/fault_parameters/pdf/2002_CA_Hazard_Maps.pdf
Chiou, B.S.-J., and Youngs, R.R., 2014. Update of the Chiou and Youngs NGA model for the
average horizontal component of peak ground motion and response spectra: Earthquake
Spectra, vol. 30, p. 1117–1153.
Field, E.H., Biasi, G.P., Bird, P., Dawson, T.E., Felzer, K.R., Jackson, D.D., Johnson, K.M.,
Jordan, T.H., Madden, C., Michael, A.J., Milner, K.R., Page, M.T., Parsons, T., Powers,
P.M., Shaw, B.E., Thatcher,W.R., Weldon, II, R.J., and Zeng, Y., 2013, Uniform California
Earthquake Rupture Forecast, Version 3 (UCERF3)—The Time-Independent Model, U.S.
Geological Survey Open-File Report 2013–1165, California Geological Survey Special
Report 228, and Southern California Earthquake Center Publication 1792, 97 pp., available
at http://pubs.usgs.gov/of/2013/1165/.
Field, E.H., Arrowsmith, R.J., Biasi, G.P., Bird, P., Dawson, T.E., Felzer, K.R., Jackson, D.D.,
Johnson, K.M., Jordan, T.H., Madden, C., Michael, A.J., Milner, K.R., Page, M.T., Parsons,
T., Powers, P.M., Shaw, B.E., Thatcher, W.R., Weldon, II, R.J., and Zeng, Y., 2014,
Uniform California earthquake rupture forecast, Version 3 (UCERF3) —The time
independent model: Bulletin of Seismological Society of America, vol. 104, p. 1122–1180.
Frankel, A.D., Petersen, M.D., Muller, C.S., Haller, K.M., Wheeler, R.L., Layendecker, E.V.,
Wesson, R.L., Harmsen, S.C., Cramer, C.H., Perkins, D.M., and Rukstales, K.S., 2002,
Documentation for the 2002 Update of the National Seismic Hazard Maps: U.S. Geological
Survey, Open-File Report 02-420, 33 p.
Frankel, A., Chen, R., Petersen, M., Moschetti, M., and Sherrod, B., 2014, 2014 Update of the
Pacific Northwest Portion of the U.S. National Seismic Hazard Maps: Earthquake Spectra,
vol. 31, no. S1, p. S131–S148, DOI: 10.1193/111314EQS193M.
Idriss, I.M., 2014, An NGA-West2 empirical model for estimating the horizontal spectral values
generated by shallow crustal earthquakes: Earthquake Spectra, vol. 30, p. 1155–1177.
Petersen, M.D., Bryant, W.A., Cramer, C.H., Cao, T., Reichle, M.S., Frankel, A.D.,
Lienkaemper, J.J., McCrory, P.A. and Schwartz, D.P., 1996, Probabilistic seismic hazard
assessment for the State of California: California Department of Conservation, Division of
Mines and Geology Open-File Report 96-08; also U.S. Geological Survey Open-File Report
96-706, 33 p.
Petersen, M.D., Frankel, A.D., Harmsen, S.C., Mueller, C.S., Haller, K.M., Wheeler, R.L.,
Wesson, R.L., Zeng, Y., Boyd, O.S., Perkins, D.M., Luco, N., Field, E.H., Wills, C.J., and
Rukstales, K.S., 2008, Documentation for the 2008 update of the United States National
Seismic Hazard Maps: U.S. Geol. Survey Open-File Report 2008-1128, 60p.
Petersen, M.D., Moschetti, M.P., Powers, P.M., Mueller, C.S., Haller, K.M., Frankel, A.D.,
Zeng, Y., Rezaeian, S., Harmsen, S.C., Boyd, O.S., Field, N., Chen, R., Rukstales, K.S.,
Luco, N., Wheeler, R.L., Williams, R.A., and Olsen, A.H., 2014, Documentation for the
2014 update of the United States national seismic hazard maps, U.S. Geol. Survey. Open-
File Rept. 2014-1091, 243 pp., doi: 10.3133/ofr20141091.
Page 52
42 CALIFORNIA GEOLOGICAL SURVEY 2018
Petersen, M.D., Moschetti, M.P., Powers, P.M., Mueller, C.S., Haller, K.M., Frankel, A.D.,
Zeng, Y., Rezaeian, S., Harmsen, S.C., Boyd, O.S., Field, N., Chen, R., Rukstales, K.S.,
Luco, N., Wheeler, R.L., Williams, R.A., and Olsen, A.H., 2015, The 2014 United States
national seismic hazard model: Earthquake Spectra, vol. 31, no. S1, p. S1–S30, doi:
10.1193/120814EQS210M.
Real, C.R., Petersen, M.D., McCrink, T.P. and Cramer, C.H., 2000, Seismic Hazard
Deaggregation in zoning earthquake-induced ground failures in southern California:
Proceedings of the Sixth International Conference on Seismic Zonation, November 12-15,
Palm Springs, California, EERI, Oakland, CA.
Wills, C. J., Gutierrez, C. I., Perez, F. G., and Branum, D. M., 2015, A next-generation VS30 map
for California based on geology and topography: Bulletin of Seismological Society of
America, vol. 105, no. 6, p. 3083–3091, doi: 10.1785/0120150105.
Zhao, J.X., Zhang, J., Asano, A., Ohno, Y., Oouchi, T., Takahashi, T., Ogawa, H., Irikura, K.,
Thio, H.K., Somerville, P.G., Fukushima, Y.A, and Fukushima, Y., 2006, Attenuation
relations of strong ground motion in Japan using site classification based on predominant
period: Bulletin of the Seismological Society of America, v. 96, p. 898–913.
Page 53
alf
Qhf
af
af Qhbm
Qha
Qha
Qhbm
Qhbm
Qpf
alf
af
ac
ac
Qha
afem
Qc Qpf
afQhf
afem
acf
Qhf
Qhc
Qa
QhcQf
Qcy
Qcy
afem
afem
Qhbm
afem
alfQhbm
af
acaf
Qpf
Qha
QpfQhcaf
Qcy
Qc
acf
Qha
QhfQcy
Qhfy
Qhf
af
alf
SAN MATEO QUADRANGLE
!Geotechnical boring used in liquefactionevaluation
See "Geology" in Section 1 of report for descriptions of units. Pre-Quaternary bedrock units shown without color.
N
31 0 1 20.5
Miles5,000 0 5,000 10,0002,500
Feet1 0 1 20.5
Kilometers
Topographic base map from USGS. Contour interval 20 feet. Scale 1:75,000. Map preparation by Janine Bird, CGS.
Plate 1.1 Quaternary Geologic Materials Map and Locations of Boreholes Used in Evaluating Liquefaction Hazard, San Mateo Quadrangle, California.
Page 54
alf
Qhf
af
af Qhbm
Qha
Qha
Qhbm
Qhbm
Qpf
alf
af
ac
ac
Qha
afem
Qc Qpf
afQhf
afem
acf
Qhf
Qhc
Qa
QhcQf
Qcy
Qcy
afem
afem
Qhbm
afem
alfQhbm
af
acaf
Qpf
Qha
QpfQhcaf
Qcy
Qc
acf
Qha
QhfQcy
Qhfy
Qhf
af
alf
10
20
10
20
20
10
20
1020 10
10
1020
20
1010
2020
20
SAN MATEO QUADRANGLE
! Groundwater measurement locationDepth to groundwater (in feet)
See "Geology" in Section 1 of report for descriptions of units. Pre-Quaternary bedrock units shown without color.
N
31 0 1 20.5
Miles5,000 0 5,000 10,0002,500
Feet1 0 1 20.5
Kilometers
Topographic base map from USGS. Contour interval 20 feet. Scale 1:75,000.
Plate 1.2 Depth to Historic-High Groundwater Levels in Quaternary Alluvial Deposits and Groundwater Measurement Locations, San Mateo Quadrangle, California.
10
jbird
Typewritten Text
Map preparation by Janine Bird, CGS.
Page 55
!!!!
!!
!
!!!
!
!
!
!
!!!
!
!!
!
!
!!!
!
!
!
!
!
!
!
!!!!
!
!
!
!!
!!
!
!
!
!
!!
!
!!
!
!
!
!
!
!
!!
!!!
!!
!!!!!!
!
!
!
!!
!!
!! !!!
!
!!!
!!!
!!!!!!
!
!
!
!
!
!!!!
!
!!
!!!!
!
!!
!
!
!
!!
!
!!
!
!!
!!!
!
!
!
!
!!!
!!
!
KJcg
KJg
KJgKJc
KJc
KJs
QTm
KJc
fm
alf
Qhf
af
sp
af Qhbm
Qha
Qha
Qhbm
Qhbm
Qpf
alf
af
ac
ac
QhaQTm
afem
Qc
QTm
Qpf
afQhf
afem
acf
Qhf
QhcQTsc
KJs
fm
Qa
QhcQf
Qcy
KJlKJg
Qcy
afem
afem
Qhbm
afem
alfQhbm
af
acaf
KJgQpf
KJc
KJg
Qha
QpfQhc
fm
af
sp
QTsc
sp
Jgb
QTsc
Qcy
Qc
KJs
acf
fm
Qha
QhfQcy
Qhfy
KJg
KJc Qhf
af
Tw
alf
SAN MATEO QUADRANGLE
! Shear test sample location! Hoek-Brown shear test sample
Landslide
See "Geology" in Section 2 of report for descriptions of units.
N
31 0 1 20.5
Miles5,000 0 5,000 10,0002,500
Feet1 0 1 20.5
Kilometers
Topographic base map from USGS. Contour interval 20 feet. Scale 1:75,000. Map preparation by Janine Bird, CGS.
Plate 2.1 Geologic materials map, shear test and Hoek-Brown rock mass characterization sample locations, and landslide inventory, San Mateo Quadrangle, California.
Page 56
° ° ° ° ° ° ° ° ° ° ° ° ° ° ° ° ° ° ° ° ° ° ° ° ° ° °° ° ° ° ° ° ° ° ° ° ° ° ° ° ° ° ° ° ° ° ° ° ° ° ° ° °° ° ° ° ° ° ° ° ° ° ° ° ° ° ° ° ° ° ° ° ° ° ° ° ° ° °° ° ° ° ° ° ° ° ° ° ° ° ° ° ° ° ° ° ° ° ° ° ° ° ° ° °° ° ° ° ° ° ° ° ° ° ° ° ° ° ° ° ° ° ° ° ° ° ° ° ° ° °° ° ° ° ° ° ° ° ° ° ° ° ° ° ° ° ° ° ° ° ° ° ° ° ° ° °° ° ° ° ° ° ° ° ° ° ° ° ° ° ° ° ° ° ° ° ° ° ° ° ° ° °° ° ° ° ° ° ° ° ° ° ° ° ° ° ° ° ° ° ° ° ° ° ° ° ° ° °° ° ° ° ° ° ° ° ° ° ° ° ° ° ° ° ° ° ° ° ° ° ° ° ° ° °° ° ° ° ° ° ° ° ° ° ° ° ° ° ° ° ° ° ° ° ° ° ° ° ° ° °° ° ° ° ° ° ° ° ° ° ° ° ° ° ° ° ° ° ° ° ° ° ° ° ° ° °° ° ° ° ° ° ° ° ° ° ° ° ° ° ° ° ° ° ° ° ° ° ° ° ° ° °° ° ° ° ° ° ° ° ° ° ° ° ° ° ° ° ° ° ° ° ° ° ° ° ° ° °° ° ° ° ° ° ° ° ° ° ° ° ° ° ° ° ° ° ° ° ° ° ° ° ° ° °° ° ° ° ° ° ° ° ° ° ° ° ° ° ° ° ° ° ° ° ° ° ° ° ° ° °° ° ° ° ° ° ° ° ° ° ° ° ° ° ° ° ° ° ° ° ° ° ° ° ° ° °° ° ° ° ° ° ° ° ° ° ° ° ° ° ° ° ° ° ° ° ° ° ° ° ° ° °° ° ° ° ° ° ° ° ° ° ° ° ° ° ° ° ° ° ° ° ° ° ° ° ° ° °° ° ° ° ° ° ° ° ° ° ° ° ° ° ° ° ° ° ° ° ° ° ° ° ° ° °° ° ° ° ° ° ° ° ° ° ° ° ° ° ° ° ° ° ° ° ° ° ° ° ° ° °° ° ° ° ° ° ° ° ° ° ° ° ° ° ° ° ° ° ° ° ° ° ° ° ° ° °° ° ° ° ° ° ° ° ° ° ° ° ° ° ° ° ° ° ° ° ° ° ° ° ° ° °° ° ° ° ° ° ° ° ° ° ° ° ° ° ° ° ° ° ° ° ° ° ° ° ° ° °° ° ° ° ° ° ° ° ° ° ° ° ° ° ° ° ° ° ° ° ° ° ° ° ° ° °° ° ° ° ° ° ° ° ° ° ° ° ° ° ° ° ° ° ° ° ° ° ° ° ° ° °° ° ° ° ° ° ° ° ° ° ° ° ° ° ° ° ° ° ° ° ° ° ° ° ° ° °° ° ° ° ° ° ° ° ° ° ° ° ° ° ° ° ° ° ° ° ° ° ° ° ° ° °° ° ° ° ° ° ° ° ° ° ° ° ° ° ° ° ° ° ° ° ° ° ° ° ° ° °° ° ° ° ° ° ° ° ° ° ° ° ° ° ° ° ° ° ° ° ° ° ° ° ° ° °
Half Moon Bay
Hunters Point
MontaraMountain
Palo Alto
Redwood Point
SanFrancisco
SouthSan Leandro
Woodside
S A N F R A N C I S C O B A Y
§̈¦280
£¤101
UV92
UV82
UV92
SAN MATEO QUADRANGLEN
31 0 1 20.5
Miles5,000 0 5,000 10,0002,500
Feet1 0 1 20.5
Kilometers
DEM base map from USGS. Roads from www.census.gov. Scale 1:100,000. Map preparation by Janine Bird, CGS.
Plate 3.1 Map of Vs30 groups and corresponding geologic units extracted from the state-wide Vs30 map developed by Wills and others (2015), San Mateo Quadrangle and surrounding area, California.
Shear wave velocity of upper30 meters
733 (KJf)710 (crystalline)572 (serpentine)519 (Tv)503 (Kss)468 (Tss)444 (QT)
387 (Qoa)385 (Tsh)352 (Qal3)294 (Qal2)228 (Qal1)226 (af/Qi)176 (Qi)
Page 57
Half Moon Bay
Hunters Point
MontaraMountain
Palo Alto
Redwood Point
SanFrancisco
SouthSan Leandro
Woodside
S A NF R A N C I S C O
B A Y
§̈¦280
£¤101
UV92
UV84
UV82
UV92
£¤101
UV82
SAN MATEO QUADRANGLE Pseudo-PGA (g)10% in 50 yrs
0.70 - 0.720.69 - 0.700.67 - 0.680.65 - 0.660.63 - 0.640.61 - 0.620.59 - 0.60
0.57 - 0.580.55 - 0.560.53 - 0.540.51 - 0.520.49 - 0.500.47 - 0.480.45 - 0.47
N
31 0 1 20.5
Miles5,000 0 5,000 10,0002,500
Feet1 0 1 20.5
Kilometers
DEM base map from USGS. Roads from www.census.gov. Scale 1:100,000.
Plate 3.2 Pseudo-PGA for liquefaction hazard mapping analysis, San Mateo Quadrangle and surrounding area, California.
jbird
Typewritten Text
Map preparation by Janine Bird, CGS.
Page 58
Half Moon Bay
Hunters Point
MontaraMountain
Palo Alto
Redwood Point
SanFrancisco
SouthSan Leandro
Woodside
S A NF R A N C I S C O
B A Y
§̈¦280
£¤101
UV92
UV84
UV82
UV92
£¤101
UV82
SAN MATEO QUADRANGLE Probabilistic PGA (g)10% in 50 yrs
0.72 - 0.740.71 - 0.720.69 - 0.700.67 - 0.680.65 - 0.660.63 - 0.640.61 - 0.62
0.59 - 0.600.57 - 0.580.55 - 0.560.53 - 0.540.51 - 0.520.49 - 0.500.47 - 0.49
N
31 0 1 20.5
Miles5,000 0 5,000 10,0002,500
Feet1 0 1 20.5
Kilometers
DEM base map from USGS. Roads from www.census.gov. Scale 1:100,000.
Plate 3.3 Probabilistic peak ground acceleration for landslide hazard mapping analysis, San Mateo Quadrangle and surrounding area, California.
jbird
Typewritten Text
Map preparation by Janine Bird, CGS.
Page 59
Half Moon Bay
Hunters Point
MontaraMountain
Palo Alto
Redwood Point
SanFrancisco
SouthSan Leandro
Woodside
S A NF R A N C I S C O
B A Y
§̈¦280
£¤101
UV92
UV82
UV92
SAN MATEO QUADRANGLE Modal Magnitude (g)10% in 50 yrs
7.877.867.51
N
31 0 1 20.5
Miles5,000 0 5,000 10,0002,500
Feet1 0 1 20.5
Kilometers
DEM base map from USGS. Roads from www.census.gov. Scale 1:100,000. Map preparation by Janine Bird, CGS.
Plate 3.4 Modal magnitude for landslide hazard mapping analysis, San Mateo Quadrangle and surrounding area, California.