690 The Leading Edge June 2009 Seismic inversion using a geostatistical, petrophysical, and acoustic model I nterpretation of seismic data for structure and stratigraphy is commonly based on the geological knowledge of the area and the correlation of seismic reflections with well-log data. However, the relation between the seismic image and the well-log data is not straightforward, being often obscured by the wave-propagation phenomenon. Part of the problem is that reflectivities do not measure the interval properties but result from the property contrasts of consecutive strata. Seismic inversion provides insight into the interpretation process, transforming reflection amplitudes into physically meaningful variations in interval properties, which can be directly related to the well-log data after appropriate scale considerations. In the present work, we combine well-log and seismic re- flection data for delineation of the major stratification in a producing oil reservoir in Ecuador. Production in this field is obtained from sandstone strata; the stratification involves several sequences of shale, carbonates, and sands. Based on the relationship between the acoustic impedance and the to- tal porosity, we jointly estimate both properties in the seismic inversion. In addition, by constraining the seismic inversion with well-log data, we improve the vertical resolution of the estimated fields beyond normal seismic resolution, and the correlation between the estimated fields and the well-log in- formation. We analyze the seismic data under the acoustic approxi- mation. Further extension of this type of integrated analysis that considers elastic modeling of prestack or partial-stacked data is envisaged in this area in future, with the acquisition of new seismic data with longer offsets. Petrophysical relationships Figure 1 shows a crossplot of the acoustic impedance against the total porosity as calculated from the well-log data and plotted at well-log resolution for a typical well in this area. e colors categorize the major lithotypes in the stratigraphic sequence. e variation of the acoustic impedance is largely anticorrelated with the total porosity, as expected from com- mon petrophysical models. Also, it is evident that in this area high total porosity (> 0.2) or low acoustic impedance (< 9 ⋅ 10 6 kg/m 2 s) are good indicators for shale, whereas the high- impedance or low-porosity rocks mostly correspond to sands and carbonates. To integrate the seismic and well-log data, we develop a two-scale model: e acoustic impedance is parameterized at two different time intervals related by an appropriate scale transform. is transform determines the low-resolution level of the model as a function of the high-resolution level, i.e., the equivalent properties of a thick layer as a function MIGUEL BOSCH, Universidad Central de Venezuela CORAL CAMPOS, Suelopetrol ELSA FERNÁNDEZ, Info-Gestión Consultores of the properties of the finer constitutive layers. We set the low-resolution-model scale commensurate with the seismic resolution, which depends on the frequency content of the reflected wavelet. It is used for reflectivity calculation and fixed to a 4-ms sampling interval for the results shown in this work. e objective function, as given by Equation 1, is for- mulated at the high-resolution level. For computational and interpretational reasons, we set the high-resolution scale at an intermediate point between the original well-log resolu- tion and the seismic resolution. In this work, we use a 1-ms sampling interval for the model’s high-resolution scale, with an improvement of four times in the resolution of the vertical model. Figure 2a shows a crossplot of the acoustic impedance and total porosity upscaled to a 1-ms time-sampling interval for the well-log data in Figure 1. e deviations of the samples are smaller, and the dependency trend is clearer in the res- caled crossplot. Using a petrophysical model that combines the Wyllie and Wood relationships, we parameterize and cali- brate to the experimental rescaled data a statistical model for the dependency between the impedance and porosity. Figure 2a also shows the calibrated petrophysical transform fitting the experimental impedance versus porosity data obtained by regression, and the gray band that indicates the deviations of the experimental data from the model (plus or minus one standard deviation). For building up the statistical porosity- impedance model, we also characterize the time covariances for the porosity and for the acoustic impedance deviations from the calibrated petrophysical transform. SPECIAL SECTION: L a t i n A m e r i c a Figure 1. Crossplot of well-log-derived acoustic impedance against total porosity at the original sampling interval for one well in the area. Colors show classification of the samples according to major lithological groups. Downloaded 03/01/13 to 141.117.79.62. Redistribution subject to SEG license or copyright; see Terms of Use at http://library.seg.org/
Transcript
690 The Leading Edge June 2009
SPECIAL SECTION: L a t i n A m e r i c aL a t i n A m e r i c a
Seismic inversion using a geostatistical, petrophysical, and acoustic model
Interpretation of seismic data for structure and stratigraphy is commonly based on the geological knowledge of the
area and the correlation of seismic refl ections with well-log data. However, the relation between the seismic image and the well-log data is not straightforward, being often obscured by the wave-propagation phenomenon. Part of the problem is that refl ectivities do not measure the interval properties but result from the property contrasts of consecutive strata. Seismic inversion provides insight into the interpretation process, transforming refl ection amplitudes into physically meaningful variations in interval properties, which can be directly related to the well-log data after appropriate scale considerations.
In the present work, we combine well-log and seismic re-fl ection data for delineation of the major stratifi cation in a producing oil reservoir in Ecuador. Production in this fi eld is obtained from sandstone strata; the stratifi cation involves several sequences of shale, carbonates, and sands. Based on the relationship between the acoustic impedance and the to-tal porosity, we jointly estimate both properties in the seismic inversion. In addition, by constraining the seismic inversion with well-log data, we improve the vertical resolution of the estimated fi elds beyond normal seismic resolution, and the correlation between the estimated fi elds and the well-log in-formation.
We analyze the seismic data under the acoustic approxi-mation. Further extension of this type of integrated analysis that considers elastic modeling of prestack or partial-stacked data is envisaged in this area in future, with the acquisition of new seismic data with longer off sets.
Petrophysical relationshipsFigure 1 shows a crossplot of the acoustic impedance against the total porosity as calculated from the well-log data and plotted at well-log resolution for a typical well in this area. Th e colors categorize the major lithotypes in the stratigraphic sequence. Th e variation of the acoustic impedance is largely anticorrelated with the total porosity, as expected from com-mon petrophysical models. Also, it is evident that in this area high total porosity (> 0.2) or low acoustic impedance (< 9 × 10⁶ kg/m2 s) are good indicators for shale, whereas the high-impedance or low-porosity rocks mostly correspond to sands and carbonates.
To integrate the seismic and well-log data, we develop a two-scale model: Th e acoustic impedance is parameterized at two diff erent time intervals related by an appropriate scale transform. Th is transform determines the low-resolution level of the model as a function of the high-resolution level, i.e., the equivalent properties of a thick layer as a function
MIGUEL BOSCH, Universidad Central de VenezuelaCORAL CAMPOS, SuelopetrolELSA FERNÁNDEZ, Info-Gestión Consultores
of the properties of the fi ner constitutive layers. We set the low-resolution-model scale commensurate with the seismic resolution, which depends on the frequency content of the refl ected wavelet. It is used for refl ectivity calculation and fi xed to a 4-ms sampling interval for the results shown in this work. Th e objective function, as given by Equation 1, is for-mulated at the high-resolution level. For computational and interpretational reasons, we set the high-resolution scale at an intermediate point between the original well-log resolu-tion and the seismic resolution. In this work, we use a 1-ms sampling interval for the model’s high-resolution scale, with an improvement of four times in the resolution of the vertical model.
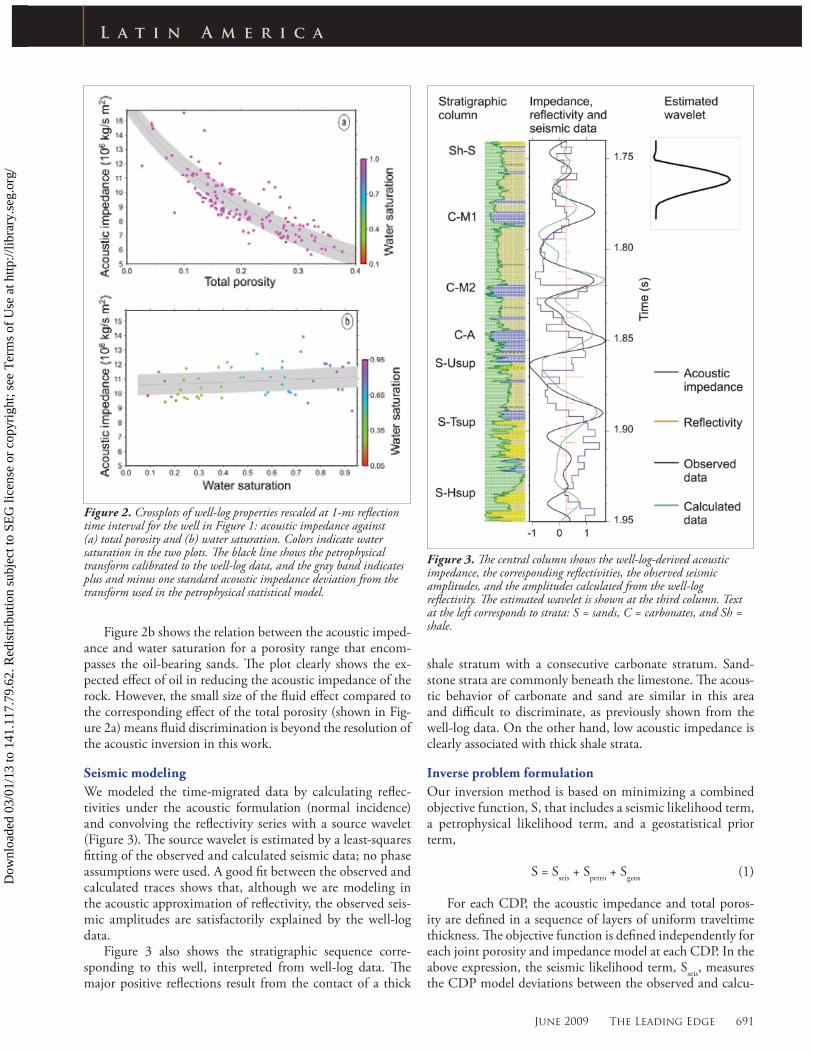
Figure 2a shows a crossplot of the acoustic impedance and total porosity upscaled to a 1-ms time-sampling interval for the well-log data in Figure 1. Th e deviations of the samples are smaller, and the dependency trend is clearer in the res-caled crossplot. Using a petrophysical model that combines the Wyllie and Wood relationships, we parameterize and cali-brate to the experimental rescaled data a statistical model for the dependency between the impedance and porosity. Figure 2a also shows the calibrated petrophysical transform fi tting the experimental impedance versus porosity data obtained by regression, and the gray band that indicates the deviations of the experimental data from the model (plus or minus one standard deviation). For building up the statistical porosity-impedance model, we also characterize the time covariances for the porosity and for the acoustic impedance deviations from the calibrated petrophysical transform.
SPECIAL SECTION: L a t i n A m e r i c a
Figure 1. Crossplot of well-log-derived acoustic impedance against total porosity at the original sampling interval for one well in the area. Colors show classifi cation of the samples according to major lithological groups.
Dow
nloa
ded
03/0
1/13
to 1
41.1
17.7
9.62
. Red
istr
ibut
ion
subj
ect t
o SE
G li
cens
e or
cop
yrig
ht; s
ee T
erm
s of
Use
at h
ttp://
libra
ry.s
eg.o
rg/
June 2009 The Leading Edge 691
L a t i n A m e r i c a
Figure 2b shows the relation between the acoustic imped-ance and water saturation for a porosity range that encom-passes the oil-bearing sands. Th e plot clearly shows the ex-pected eff ect of oil in reducing the acoustic impedance of the rock. However, the small size of the fl uid eff ect compared to the corresponding eff ect of the total porosity (shown in Fig-ure 2a) means fl uid discrimination is beyond the resolution of the acoustic inversion in this work.
Seismic modelingWe modeled the time-migrated data by calculating refl ec-tivities under the acoustic formulation (normal incidence) and convolving the refl ectivity series with a source wavelet (Figure 3). Th e source wavelet is estimated by a least-squares fi tting of the observed and calculated seismic data; no phase assumptions were used. A good fi t between the observed and calculated traces shows that, although we are modeling in the acoustic approximation of refl ectivity, the observed seis-mic amplitudes are satisfactorily explained by the well-log data.
Figure 3 also shows the stratigraphic sequence corre-sponding to this well, interpreted from well-log data. Th e major positive refl ections result from the contact of a thick
shale stratum with a consecutive carbonate stratum. Sand-stone strata are commonly beneath the limestone. Th e acous-tic behavior of carbonate and sand are similar in this area and diffi cult to discriminate, as previously shown from the well-log data. On the other hand, low acoustic impedance is clearly associated with thick shale strata.
Inverse problem formulationOur inversion method is based on minimizing a combined objective function, S, that includes a seismic likelihood term, a petrophysical likelihood term, and a geostatistical prior term,
S = Sseis
+ Spetro
+ Sgeos
(1)
For each CDP, the acoustic impedance and total poros-ity are defi ned in a sequence of layers of uniform traveltime thickness. Th e objective function is defi ned independently for each joint porosity and impedance model at each CDP. In the above expression, the seismic likelihood term, S
seis, measures
the CDP model deviations between the observed and calcu-
Figure 2. Crossplots of well-log properties rescaled at 1-ms refl ection time interval for the well in Figure 1: acoustic impedance against (a) total porosity and (b) water saturation. Colors indicate water saturation in the two plots. Th e black line shows the petrophysical transform calibrated to the well-log data, and the gray band indicates plus and minus one standard acoustic impedance deviation from the transform used in the petrophysical statistical model.
Figure 3. Th e central column shows the well-log-derived acoustic impedance, the corresponding refl ectivities, the observed seismic amplitudes, and the amplitudes calculated from the well-log refl ectivity. Th e estimated wavelet is shown at the third column. Text at the left corresponds to strata: S = sands, C = carbonates, and Sh = shale.
Dow
nloa
ded
03/0
1/13
to 1
41.1
17.7
9.62
. Red
istr
ibut
ion
subj
ect t
o SE
G li
cens
e or
cop
yrig
ht; s
ee T
erm
s of
Use
at h
ttp://
libra
ry.s
eg.o
rg/
692 The Leading Edge June 2009
L a t i n A m e r i c a
lated seismic data. Th e petrophysical likelihood term, Spetro
, measures the CDP model deviations between the acoustic impedance model and the petrophysical transform of the po-rosity, i.e., the theoretical impedances calculated from the po-rosity model with the petrophysical function calibrated in a preceding section. Th e geostatistical term, S
geos, measures the
deviations of the CDP model porosity and impedance from the prior fi elds, which play the role of background model for the seismic and petrophysical inversion. In the case of well-log conditioning, the prior porosity and impedance fi elds are obtained from geostatistical interpolation of the well-log data (cokriging) at the high-resolution-model scale. Th e joint inverse formulation combines the information across non-linearly related parameters, improving the exactitude of the estimated reservoir properties.
Th e three terms in Equation 1 are quadratic and include: the data covariance associated to the observation and calcu-lation uncertainties; the property covariance across diff erent time layers of the same CDP model; and the spatial covari-ance between the well-log data and the CDP properties. For the results in the next sections, we use a data standard devia-tion of 2% of the maximum range of the trace amplitude for the seismic likelihood term. More detail on this method can be found in Bosch et al. (2009).
Seismic petrophysical inversionIf no conditioning to well-log data is considered, the geo-statistical term reduces to a prior information term measur-ing deviations of the impedance and porosity fi elds from the prior background model. We used a uniform prior model for the acoustic impedance and the total porosity, which corre-sponded to the mean values of the well logs at the inversion window. In this case, the petrophysical objective function term still enforces the petrophysical model that relates poros-ity and impedance for joint estimation of the two properties. Th is formulation can be named “petrophysical seismic inver-sion” as it integrates the seismic and petrophysical steps of inference.
We illustrate this inversion approach with a seismic line in the area. Figure 4 shows the observed seismic data calculated from the estimated property model obtained with the inver-sion, and a well. Th is well will be useful when comparing the inversion results with the well-log-derived properties for the petrophysical seismic inversion with no well conditioning.
Figure 5 shows the estimated acoustic impedance and to-tal porosity for the petrophysical seismic inversion. No spatial conditioning to the well-log data is used in this case. Th e cor-responding well-log-derived acoustic impedance and total po-rosity, upscaled to 1-ms sampling, are superposed. Th e fi gure shows that the inversion adequately maps major stratifi cation in the reservoir in the acoustic-impedance and total-porosity fi elds, and agree at the seismic resolution scale with the well-log-derived properties. Resolution of the estimated fi elds cor-responds to the seismic frequency content as expected from a seismic inversion. Th in strata, like sand S-M2 for instance, are not present in the estimated section. Also, major strata de-lineated in the inversion results do not show their particular
inner stratifi ed structure, which is evident in the superposed well logs.
Seismic geostatistical and petrophysical inversionIn this approach, we condition the seismic inversion to the well-log data using a geostatistical model. Th e covariance function used in the inversion is characterized in the time direction from the actual rescaled well-log data. To guide the lateral covariance between the model property and well-log-derived property, the covariance function follows the geometry of a major horizon which is picked, in this case, from a continuous event in the seismic section. In the lateral directions, we use a Gaussian covariance model with large range considering the continuity that the stratifi cation shows in the area. Figure 4 shows the reference horizon and the cor-responding picked polygon used to mark appropriate time shifts for the lateral correlation between model and well-log properties. As the seismic inversion considers the spatial cor-relation with additional data (well logs) for the estimation of the impedance and porosity, this procedure can be named geostatistical and petrophysical seismic inversion.
Well-log-derived properties have higher spatial resolu-tion along the well path than the inverted seismic proper-
Figure 4. Observed stacked and time-migrated data for one line and the corresponding data calculated from the acoustic impedance obtained from the inversion and shown in Figure 5. Th e solid black line shows a polygon picked to follow a reference refl ector on the seismic section. Th e dashed line indicates a well.
Dow
nloa
ded
03/0
1/13
to 1
41.1
17.7
9.62
. Red
istr
ibut
ion
subj
ect t
o SE
G li
cens
e or
cop
yrig
ht; s
ee T
erm
s of
Use
at h
ttp://
libra
ry.s
eg.o
rg/
694 The Leading Edge June 2009
L a t i n A m e r i c a
ties, and they often are considered as hard data (exact data). However, the exactitude and precision of the well-log-derived properties are subject to diff erent uncertainty sources such as the tool calibration, eff ect of mud, wall geometry, and sev-eral corrections that are applied to the collected data. Hence, considering the well-log data as exact may bias the combined estimation problem. In our method, we calculate the well-log and seismic property covariance, including a correlation fac-tor between the two types of properties, to account for the uncertainty of the well-log data. Th is is the maximum cor-relation that applies at the same spatial location of the well and model; for points away from the well, this correlation decreases according to the covariance function.
Figures 6b and 6c show results for the acoustic impedance obtained with 0.5 and 0.7 well log-to-model correlation and the geostatistical covariance model already described. Figure 6a shows the acoustic impedance model estimated with no correlation to the well-log data, as obtained in the previous section, for comparison with the inversion results spatially conditioned to the well-log data. Th e well-log-derived acous-tic impedance is superposed. Th e estimated acoustic imped-ance obtained with the geostatistical and petrophysical seis-mic inversions agrees with the major stratifi cation estimated without well conditioning. However, one relevant feature is the improved vertical resolution of the estimated property fi elds, which is inherited from the conditioning well-log in-formation via the lateral covariance in the statistical model. In Figures 6b and 6c, sand strata S-M2, for instance, is present,
and the inner stratifi ed structure of major layers is shown, beyond normal seismic resolution, in many places.
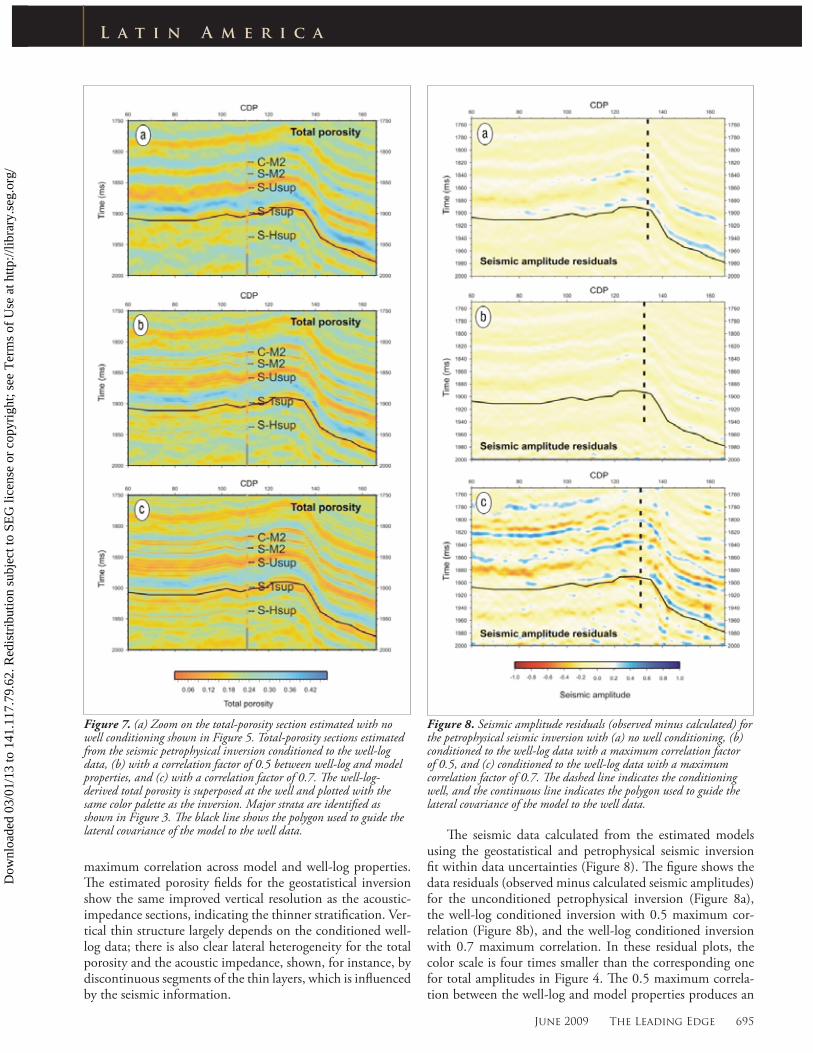
Th e inversion jointly estimates the total-porosity fi eld conditioned to the corresponding well-log porosities. Figure 7a shows the total porosity for no well conditioning, as ob-tained in the previous section. Figures 7b and 7c show the result of the total-porosity fi elds obtained with 0.5 and 0.7
Figure 5. Acoustic-impedance and total-porosity sections resulting from the petrophysical inversion of the data in Figure 4 with no well-log conditioning. Th e acoustic impedance and total porosity calculated from the well-log data are superposed.
Figure 6. (a) Zoom of acoustic-impedance section with no well conditioning shown in Figure 5. Acoustic impedance sections estimated from the seismic petrophysical inversion conditioned to the well-log data, (b) with a correlation factor of 0.5 between well-log and model properties, and (c) with a correlation factor of 0.7. Th e well-log acoustic impedance is superposed at the well and plotted with the same color palette as the inversion. Major strata are identifi ed as shown in Figure 3. Th e black line shows the polygon used to guide the lateral covariance of the model to the well data.
Dow
nloa
ded
03/0
1/13
to 1
41.1
17.7
9.62
. Red
istr
ibut
ion
subj
ect t
o SE
G li
cens
e or
cop
yrig
ht; s
ee T
erm
s of
Use
at h
ttp://
libra
ry.s
eg.o
rg/
June 2009 The Leading Edge 695
L a t i n A m e r i c a
maximum correlation across model and well-log properties. Th e estimated porosity fi elds for the geostatistical inversion show the same improved vertical resolution as the acoustic-impedance sections, indicating the thinner stratifi cation. Ver-tical thin structure largely depends on the conditioned well-log data; there is also clear lateral heterogeneity for the total porosity and the acoustic impedance, shown, for instance, by discontinuous segments of the thin layers, which is infl uenced by the seismic information.
Th e seismic data calculated from the estimated models using the geostatistical and petrophysical seismic inversion fi t within data uncertainties (Figure 8). Th e fi gure shows the data residuals (observed minus calculated seismic amplitudes) for the unconditioned petrophysical inversion (Figure 8a), the well-log conditioned inversion with 0.5 maximum cor-relation (Figure 8b), and the well-log conditioned inversion with 0.7 maximum correlation. In these residual plots, the color scale is four times smaller than the corresponding one for total amplitudes in Figure 4. Th e 0.5 maximum correla-tion between the well-log and model properties produces an
Figure 7. (a) Zoom on the total-porosity section estimated with no well conditioning shown in Figure 5. Total-porosity sections estimated from the seismic petrophysical inversion conditioned to the well-log data, (b) with a correlation factor of 0.5 between well-log and model properties, and (c) with a correlation factor of 0.7. Th e well-log-derived total porosity is superposed at the well and plotted with the same color palette as the inversion. Major strata are identifi ed as shown in Figure 3. Th e black line shows the polygon used to guide the lateral covariance of the model to the well data.
Figure 8. Seismic amplitude residuals (observed minus calculated) for the petrophysical seismic inversion with (a) no well conditioning, (b) conditioned to the well-log data with a maximum correlation factor of 0.5, and (c) conditioned to the well-log data with a maximum correlation factor of 0.7. Th e dashed line indicates the conditioning well, and the continuous line indicates the polygon used to guide the lateral covariance of the model to the well data.
Dow
nloa
ded
03/0
1/13
to 1
41.1
17.7
9.62
. Red
istr
ibut
ion
subj
ect t
o SE
G li
cens
e or
cop
yrig
ht; s
ee T
erm
s of
Use
at h
ttp://
libra
ry.s
eg.o
rg/
696 The Leading Edge June 2009
L a t i n A m e r i c a
optimal fi t with the observed data. Th e seismic data fi tting slightly degrades for the 0.7 maximum correlation, indicating that the model is, in this case, overconstrained to the well-log data.
Discussion and conclusionsWe have applied a seismic and petrophysical inversion meth-od to estimate acoustic impedance and total porosity in an oil-producing area of Ecuador. Th e information provided by the inversion proved useful for the delineation of major strata: shale on one side, characterized by high porosity and low impedance; limestone and sandstone on the other side, characterized by lower porosities and higher impedances. Th e same analysis indicates that the fl uid eff ect (oil brine) is beyond the resolution of the acoustic inversion in this case. More information could be obtained with an elastic formu-lation of the inverse problem using data at several off sets or incidence angles.
Th e petrophysical seismic inversion allowed us to jointly map the acoustic impedance and the total porosity fi elds, which showed good correlation with the corresponding im-pedance and porosity estimated directly from well logs. Th eir agreement is a good indication of the adequate results ob-tained with the petrophysical seismic inversion.
In a second step, we apply a geostatistical constraint to the petrophysical seismic inversion (assuming a positive correla-tion between well logs and seismic-derived property fi elds). Th e results of the geostatistical and petrophysical seismic in-
version show higher-resolution features away from the well path, imprinted from the well log’s thinner vertical structure but also controlled by the lower-resolution information from seismic.
Well-log-derived properties and medium properties are correlated. However, they should not be considered identical as well logs are subject to uncertainties. Adjusting a correla-tion factor across the model and well-log properties produces an optimal explanation of the seismic data and avoids over-constraining the model to the well-log data. On the other hand, inversion results adequately conditioned to the well-log data improve the seismic data fi t in comparison with the inversion without well-log constraints.
Suggested reading. “Th e optimization approach to lithological
inversion: Combining seismic data and petrophysics for porosity
prediction” by Bosch (Geophysics, 2004). Seismic Amplitude Interpretation by Hilterman (SEG, 2001). “Petrophysical seis-
mic inversion conditioned to well-log data: Methods and ap-
plication to a gas reservoir” by Bosch et al. (Geophysics, 2009).
Acknowledgments: We thank Suelopetrol (Venezuela) and the Con-sorcio Petrolero Amazónico (Ecuador) for their interest in this work and the authorization to publish the results.