Page 1
SUNY Buffalo
24 June 2008
SUNY Buffalo
24 June 2008
Seismic performance quantification of steel corrugated shear wall systemLaszlo Gergely Vigh, (Geri)Laszlo Gergely Vigh, (Geri)Visiting scholar, Stanford, CAAsst. Prof., Budapest University of Technology and Economics,Dept. Of Structural Engineering, Hungary
andProfessor Gregory Deierlein,Professor Eduardo Miranda,Abbie Liel (Stanford)Stephen Tipping (Tipping Mar + Associates)
Thanks are due to:The Thomas Cholnoky Foundation, Inc.
Page 2
Little background…
• Hard to work at Dept. of Structural Engineering
SU
NY
Buf
falo
24Ju
ne 2
008
SU
NY
Buf
falo
24Ju
ne20
08
Page 3
Little background…
• Hard to work at Dept. of Structural Engineering
SU
NY
Buf
falo
24Ju
ne 2
008
SU
NY
Buf
falo
24Ju
ne20
08
Page 4
Little background…
• Hard to work at Dept. of Structural Engineering
SU
NY
Buf
falo
24Ju
ne 2
008
SU
NY
Buf
falo
24Ju
ne20
08
Page 5
Little background…
• Budapest University of Technology and Economics
SU
NY
Buf
falo
24Ju
ne 2
008
SU
NY
Buf
falo
24Ju
ne20
08
Source: www.bme.hu
Page 6
Little background…
• Budapest University of Technology and Economics
SU
NY
Buf
falo
24Ju
ne 2
008
SU
NY
Buf
falo
24Ju
ne20
08
Page 7
Little background…
• Budapest University of Technology and Economics:
- 8 faculties and several innovation centers- Faculty of Civil Engineering :
• 10 departments
SU
NY
Buf
falo
24Ju
ne 2
008
SU
NY
Buf
falo
24Ju
ne20
08
• Dept. of Structural Engineering:•staffs: 57 (incl. appr. 25 of asst. prof – prof)•22 BSc, 16 MSc courses + optionals
Page 8
Little background…
• Dept. of Structural Engineering
1. Education2. Research – national research funds, and ‘selfish’
researches3. Industry & University
SU
NY
Buf
falo
24Ju
ne 2
008
SU
NY
Buf
falo
24Ju
ne20
08
3. Industry & University• R&D• Co-designer• Expert• Independent checks• Laboratory and site testing – Accredited laboratory
4. Student life…
Page 9
SUNY Buffalo
24 June 2008
SUNY Buffalo
24 June 2008
Seismic performance quantification of steel corrugated shear wall systemscorrugated shear wall systems
Page 10
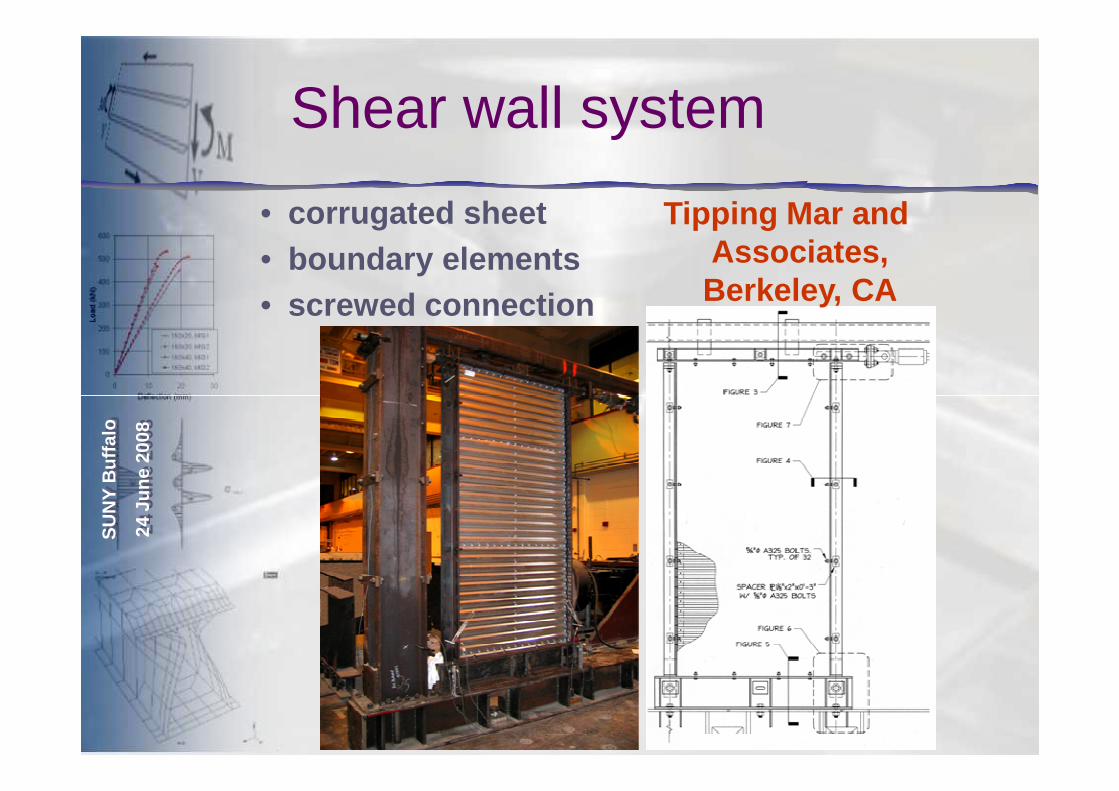
Shear wall system
• corrugated sheet• boundary elements• screwed connection
Tipping Mar and Associates, Berkeley, CA
SU
NY
Buf
falo
24Ju
ne 2
008
SU
NY
Buf
falo
24Ju
ne20
08
Page 11
Shear wall system
• corrugated sheet• boundary elements• screwed connection
SU
NY
Buf
falo
24Ju
ne 2
008
SU
NY
Buf
falo
24Ju
ne20
08
Page 12
Seismic performance quantification by ATC-63
• performance quantification by cyclic testsor
• Applied Technology Council, Project 63• achieves primary life safety performance objective by
requiring an acceptably low probability of collapse• R, ΩΩΩΩ , C factors
SU
NY
Buf
falo
24Ju
ne 2
008
SU
NY
Buf
falo
24Ju
ne20
08
• R, ΩΩΩΩ0, Cd factors
1) idealized archetypical systems: realization, design (assume R)2) analytical model development and calibration3) nonlinear static (pushover) analysis ΩΩΩΩ0
4) nonlinear incremental dynamic analysis (IDA)5) fragility curves;
adjusted collapse margin ratio (ACMR) vs. acceptabl e ACMR↓
R, Cd
Page 13
Experimental results
• Stojadinovic et al. at UC Berkeley• 44 specimens
SU
NY
Buf
falo
24Ju
ne 2
008
SU
NY
Buf
falo
24Ju
ne20
08
Page 14
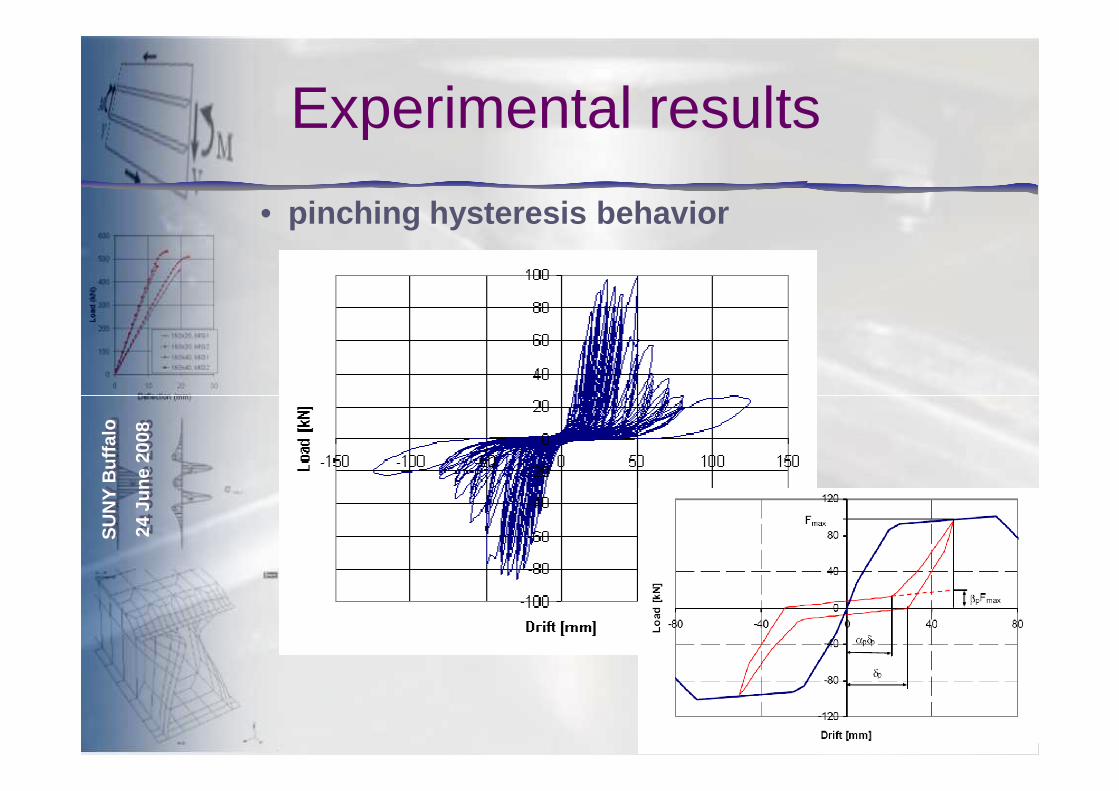
Experimental results
• pinching hysteresis behavior
SU
NY
Buf
falo
24Ju
ne 2
008
SU
NY
Buf
falo
24Ju
ne20
08
Page 15
Experimental results
• failure modes
SU
NY
Buf
falo
24Ju
ne 2
008
SU
NY
Buf
falo
24Ju
ne20
08
Page 16
Experimental results
• failure modes
SU
NY
Buf
falo
24Ju
ne 2
008
SU
NY
Buf
falo
24Ju
ne20
08
Page 17
Shear wall behavior –estimation of monotonic backbone curve
• challenge:- cyclic behavior is path-dependent- calibration to test results – we should know the monotonic behavior
SU
NY
Buf
falo
24Ju
ne 2
008
SU
NY
Buf
falo
24Ju
ne20
08
rigid
nonlin. spring
rigid lean
ing
colu
mn
Page 18
Shear wall behavior –estimation of monotonic backbone curve
• modelling technique
ANSYS
SU
NY
Buf
falo
24Ju
ne 2
008
SU
NY
Buf
falo
24Ju
ne20
08
ANSYSshell, beam &
spring elements
Page 19
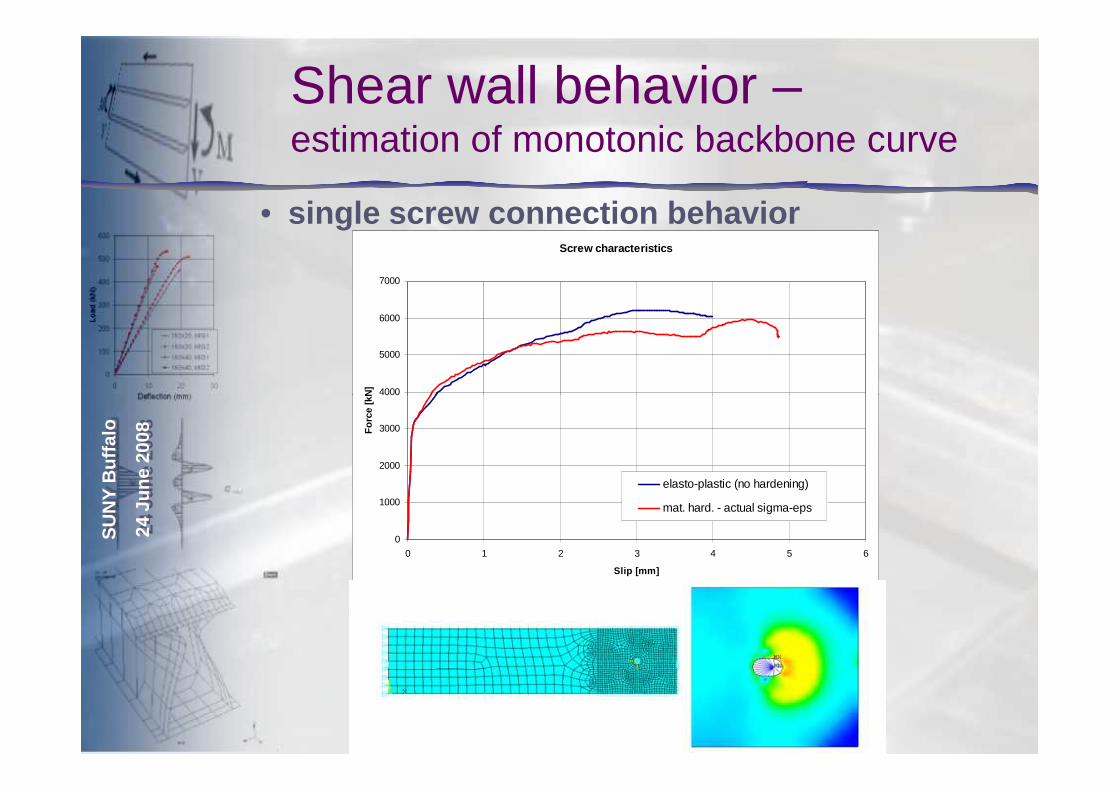
Shear wall behavior –estimation of monotonic backbone curve
• single screw connection behavior
SU
NY
Buf
falo
24Ju
ne 2
008
SU
NY
Buf
falo
24Ju
ne20
08
Source: Dubina et al.
• literature• EC3• published experimental data
Page 20
Shear wall behavior –estimation of monotonic backbone curve
• single screw connection behavior
Screw characteristics
4000
5000
6000
7000
For
ce [k
N]
SU
NY
Buf
falo
24Ju
ne 2
008
SU
NY
Buf
falo
24Ju
ne20
08
0
1000
2000
3000
4000
0 1 2 3 4 5 6
Slip [mm]
For
ce [k
N]
elasto-plastic (no hardening)
mat. hard. - actual sigma-eps
Page 21
Shear wall behavior –estimation of monotonic backbone curve
• single screw connection behavior
Screw characteristics
4000
5000
6000
7000
For
ce [k
N]
SU
NY
Buf
falo
24Ju
ne 2
008
SU
NY
Buf
falo
24Ju
ne20
08
0
1000
2000
3000
4000
0 2 4 6 8 10 12 14 16 18 20
Slip [mm]
For
ce [k
N]
with drop
no drop
no drop, adjusted
0
20
40
60
80
100
120
0 25 50 75 100
Drift [mm]
Load
[kN
]test averageenvelope
adjusted FEMbackbone
FEM with rigidconnection
estimatedcapping point
Page 22
Shear wall behavior –estimation of monotonic backbone curve
• analysis of tested shear walls
SU
NY
Buf
falo
24Ju
ne 2
008
SU
NY
Buf
falo
24Ju
ne20
08
Page 23
Shear wall behavior –estimation of monotonic backbone curve
• extension to longer walls
Group #14 - Wall length effect
500
600
all models include nonlinear screw
SU
NY
Buf
falo
24Ju
ne 2
008
SU
NY
Buf
falo
24Ju
ne20
08
0
100
200
300
400
0 20 40 60 80 100 120
Drift [mm]
Load
[kN
]
test, avg.
adjusted FEM
4 ft - eq. orthotropic
8 ft - eq. orthotropic
16 ft - eq. orthotropic
1
behavior and imperfection
Page 24
Model calibration
• OpenSees• Ibarra – Medina – Krawinkler model
Load
Mat. #2
Combined mat.
Fy 2
Fu
αH2
αH = αH2
0
40
80
120
-80 -40 0 40 80Load
[kN
]
Fmax
βpFmax
SU
NY
Buf
falo
24Ju
ne 2
008
SU
NY
Buf
falo
24Ju
ne20
08
Drift, δδδδ
Mat. #1
δy 1 δy 2 δm
Fy 1residual
αC
αH1 = 0-120
-80
-40
-80 -40 0 40 80
Drift [mm]
Load
[kN
]
δp
αpδp
-120
-80
-40
0
40
80
120
-150 -100 -50 0 50 100 150
Drift [mm]
Load
[kN
]
γA γS
γK
γD
-100
-80
-60
-40
-20
0
20
40
60
80
100
-150 -100 -50 0 50 100 150
Drift [mm]
Load
[kN
]
#29 (group #14)
#26 (group #8)
#18 (group #1)
group #14 test avg.
group #8 test avg.
group #1 test avg.
Page 25
Model calibration
• calibration: GA
encoding: sequence e.g.: possible values of
γ A = [10 15 … 240 250]1xN
alleles for γ A : 1..N
variables:
α C , α p , β p , γ A , γ S , γ D , γ K
SU
NY
Buf
falo
24Ju
ne 2
008
SU
NY
Buf
falo
24Ju
ne20
08
popu
latio
n si
ze:
20 selection: roulette wheel
crossover :simple (4)
arithmetic (4)heuristic (4)
mutation:multi-non-uniform (8)
alleles for γ A : 1..N
(i.e. based on the sequence number of the possible values)encoding for a chromosome:
[2 4 12 1 55 8 8]elitism
Page 26
Model calibration
• final – uniform – model
0
5
10
15
20
25
Load
[kN
]
Spec #18
-50
0
50
100
Load
[kN
]
Spec #42
SU
NY
Buf
falo
24Ju
ne 2
008
SU
NY
Buf
falo
24Ju
ne20
08
-200 -100 0 100 200-25
-20
-15
-10
-5
Drift [mm]
Load
[kN
]
-200 -100 0 100 200-60
-40
-20
0
20
40
60
Drift [mm]
Load
[kN
]
Spec #44
-200 -100 0 100 200-100
Drift [mm]
Page 27
0
5
10
15
20
25
Load
[kN
]
Spec #18
-50
0
50
100
Load
[kN
]
Spec #42
Model calibration
• final – uniform – model
SU
NY
Buf
falo
24Ju
ne 2
008
SU
NY
Buf
falo
24Ju
ne20
08
-200 -100 0 100 200-25
-20
-15
-10
-5
Drift [mm]
Load
[kN
]
-200 -100 0 100 200-60
-40
-20
0
20
40
60
Drift [mm]
Load
[kN
]
Spec #44
-200 -100 0 100 200-100
Drift [mm]
Page 28
Building archetypes
• Archetype definitions• building function, configurations• number of stories• seismic zone
SU
NY
Buf
falo
24Ju
ne 2
008
SU
NY
Buf
falo
24Ju
ne20
08
Page 29
Building archetypes
• Archetype definitions R = 4 High seismic (SDC Dmax)
SS = 1.5, S1 = 0.9 (SDS = 1.0, SD1 = 0.6)
Afloorseismic weight
Appr. period
Upper limit of period
SMT
(at Ta)Cs
Design base shear
wall length
[sqft] [psf] [s] [s] [g] [-] [kip] [ft]
1 1 Commercial 1600 30 0.112 0.16 1.50 0.25 12 12
5 2 Commercial 1600 30 0.19 0.27 1.50 0.25 24 24
Archetype Story # Function
SU
NY
Buf
falo
24Ju
ne 2
008
SU
NY
Buf
falo
24Ju
ne20
08
9 3 Commercial 1600 30 0.26 0.36 1.50 0.25 36 20
2 1 1&2 Family 500 10 0.112 0.16 1.50 0.25 1.25 8
6 2 1&2 Family 500 10 0.19 0.27 1.50 0.25 2.5 8
10 3 Multi-Family 500 30 0.26 0.36 1.50 0.25 11.25 12
13 4 Multi-Family 500 30 0.32 0.45 1.50 0.25 15 16
15 5 Multi-Family 500 30 0.38 0.53 1.50 0.25 18.75 20
Page 30
Building archetypes
• seismic design− based on assumed R− simplified proc: equivalent static loading
EQ loading demand, Vu
wall type Vnom VASD VLRFD
Story [kip] [lbs] [plf] (group#) [plf] [plf] [plf]
SU
NY
Buf
falo
24Ju
ne 2
008
SU
NY
Buf
falo
24Ju
ne20
08
[kip] [lbs] [plf] (group#) [plf] [plf] [plf]
R 6250 312 1 1173 469 657
4 11250 563 1 1173 469 657
3 15000 750 25 1505 602 843
2 17500 875 7 1836 734 1028
1
6250 lbs
1250
2500
3750
5000
18750 937 7 1836 734 1028
Page 31
Analytical model
• 2D truss structure
SU
NY
Buf
falo
24Ju
ne 2
008
SU
NY
Buf
falo
24Ju
ne20
08
rigid
nonlin. spring
rigid lean
ing
colu
mn
Page 32
Pushover analysis
250
300Archetype #15
Vmax
Vmax
= 214 kN; Vdesign
= 84 kN
Ω0 = 2.57
δy = 60.7 mm; δ
u = 165.2 mm
µC
= 2.72
T = 0.526 s
Vmax
= 214 kN (roof displ. = 138 mm)
Archetype #15
SU
NY
Buf
falo
24Ju
ne 2
008
SU
NY
Buf
falo
24Ju
ne20
08
0 50 100 150 200 250 3000
50
100
150
200
Vdesign
Roof displacement [mm]
Bas
e sh
ear
forc
e [k
N]
Vmax
V60%
δy
V80%
δu
ΩΩΩΩ 0 = 2.57
T = 0.526 sSSF = 1.20
Pushover analysis
design base shear
0 6.1 m
(displ. factor x10)
Page 33
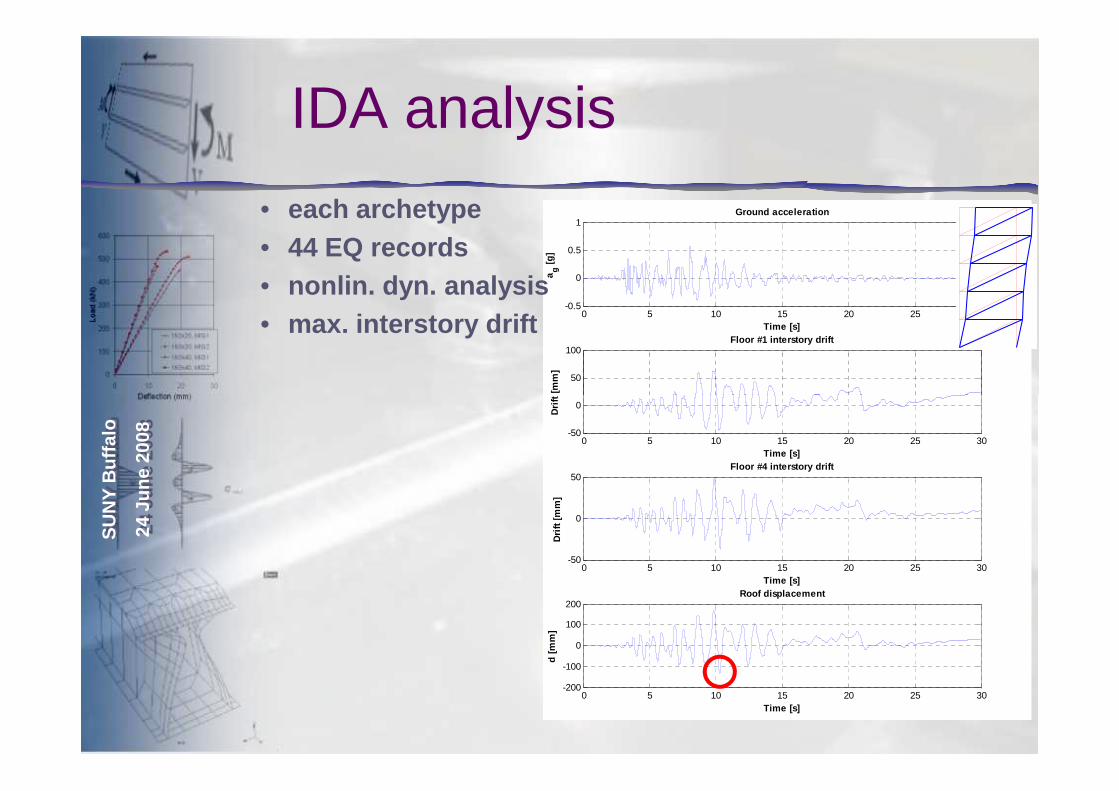
IDA analysis
0 5 10 15 20 25 30-0.5
0
0.5
1
Time [s]
ag [g
]
Ground acceleration
50
100
Drif
t [m
m]
Floor #1 interstory drift(displ. factor x10)
• each archetype• 44 EQ records• nonlin. dyn. analysis• max. interstory drift
SU
NY
Buf
falo
24Ju
ne 2
008
SU
NY
Buf
falo
24Ju
ne20
08 0 5 10 15 20 25 30-50
0
Time [s]
Drif
t [m
m]
0 5 10 15 20 25 30-50
0
50
Time [s]
Drif
t [m
m]
Floor #4 interstory drift
0 5 10 15 20 25 30-200
-100
0
100
200
Time [s]
d [m
m]
Roof displacement
Page 34
IDA analysisS
UN
Y B
uffa
lo
24Ju
ne 2
008
SU
NY
Buf
falo
24Ju
ne20
08
Page 35
IDA analysis
• each archetype• each record• scaled up to collapse
5
Archetype #15 1
Archetype #15
SU
NY
Buf
falo
24Ju
ne 2
008
SU
NY
Buf
falo
24Ju
ne20
08
0 1 2 3 4 5 6 7 8 9 10 11 12 13 14 150
0.5
1
1.5
2
2.5
3
3.5
4
4.5
SMT = 1.5g (at T = 0.526s)
SCT,median = 2.93g
Interstory drift [%]
SC
T [g
]
0 1 2 3 4 5 60
0.1
0.2
0.3
0.4
0.5
0.6
0.7
0.8
0.9
SMT = 1.5g (at T = 0.526s)
SCT,median = 2.93g
CMR = 1.956σσσσx
2 = 0.96σσσσx = 0.98
SCT [g]
Pro
babi
lity
[-]
(adjusted) collapse margin ratio
Page 36
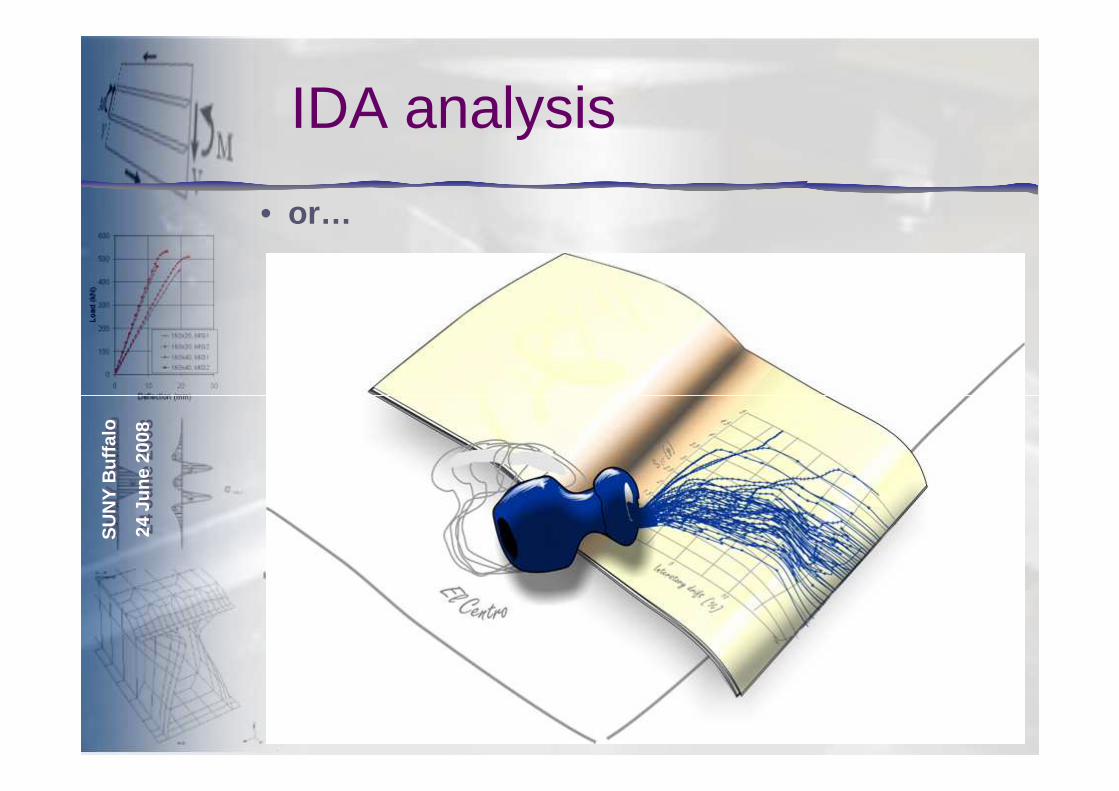
IDA analysis
• or…
SU
NY
Buf
falo
24Ju
ne 2
008
SU
NY
Buf
falo
24Ju
ne20
08
Page 37
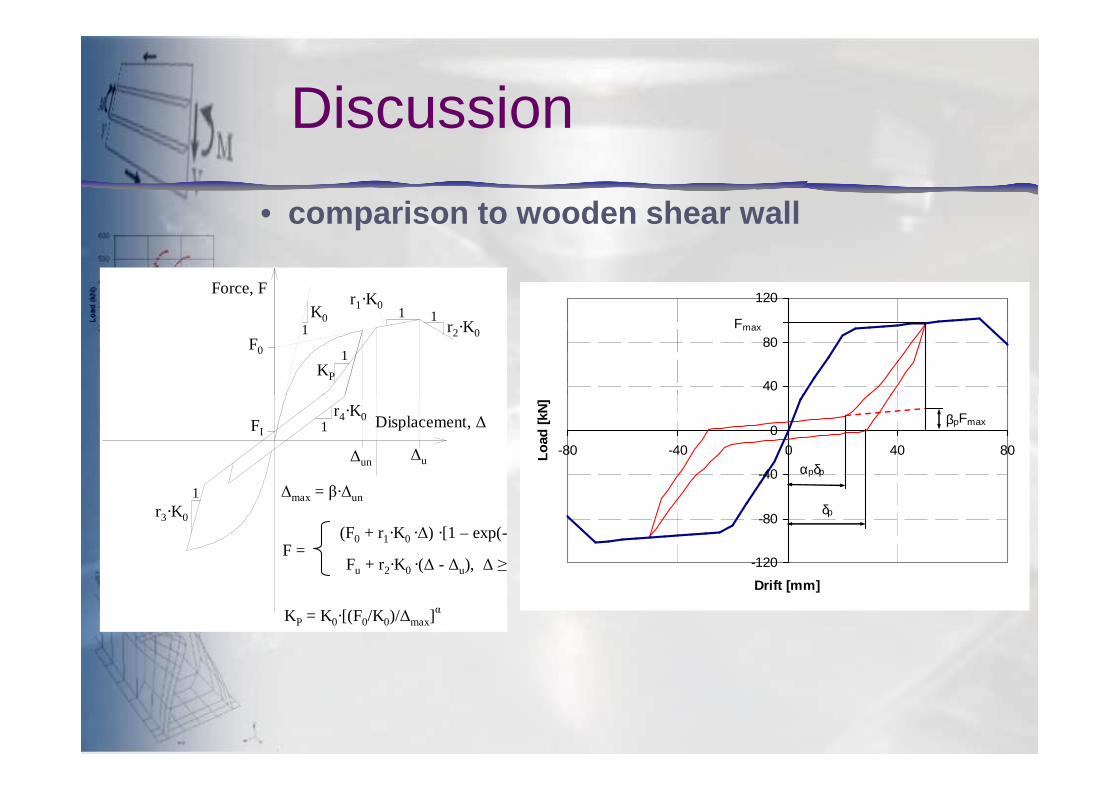
Discussion
• comparison to wooden shear wall
K01
r1·K01
r2·K0
1
KP
1F0
Force, F
40
80
120
Fmax
SU
NY
Buf
falo
24Ju
ne 2
008
SU
NY
Buf
falo
24Ju
ne20
08
r3·K0
1
r4·K01FI
Displacement, ∆
∆u
∆max = β·∆un
∆un
KP = K0·[(F0/K0)/∆max]α
F = (F0 + r1·K0 ·∆) ·[1 – exp(-
Fu + r2·K0 ·(∆ - ∆u), ∆ ≥ -120
-80
-40
0
-80 -40 0 40 80
Drift [mm]
Load
[kN
]
δp
αpδp
βpFmax
Page 38
Discussion
• comparison to wooden shear wall
5.0
6.0
7.0 a
t T
= 0
.19
sec
(g)
CMR = 2.15/1.50 = 1.43
0.26
4
4.5
5Archetype #5
SU
NY
Buf
falo
24Ju
ne 2
008
SU
NY
Buf
falo
24Ju
ne20
08
0.0
1.0
2.0
3.0
4.0
0 1 2 3 4 5 6 7 8 9 10Maximum Interstory Drift Ratio (%)
Med
ian
Sa
at T
= 0
.19
sec
(g)
SCT(T = 0.26 s) = 2.15 g
SMT(T = 0. 26 s) = 1.50 g
X 1.43
0.26
0 1 2 3 4 5 6 7 8 9 10 11 12 13 14 150
0.5
1
1.5
2
2.5
3
3.5
SMT = 1.5g (at T = 0.265s)
SCT,median = 3.05g
Interstory drift [%]S
CT [g
]
• in general, very similar results
Page 39
Further observations
• Effect of ‘scaling’ fundamental period
3
4
5
SCT,median = 2.43g [g]
Archetype #19
3
4
5
SCT,median = 2.93g
[g]
Archetype #19
SU
NY
Buf
falo
24Ju
ne 2
008
SU
NY
Buf
falo
24Ju
ne20
08
0 5 10 150
1
2
3
SMT = 1.2g (at T = 0.749s)
SCT,median = 2.43g
Interstory drift [%]
SC
T [g
]
0 5 10 150
1
2
3
SMT = 1.5g (at T = 0.495s)
Interstory drift [%]S
CT [g
]
a) scaled at Tupper = 0.749 s b) scaled at Tmodel = 0.495 s
Page 40
Further observations
• Effect of ‘scaling’ fundamental period
3
4
5
SCT,median = 2.45g [g]
Archetype #17
3
4
5
SCT,median = 2.98g
[g]
Archetype #17
SU
NY
Buf
falo
24Ju
ne 2
008
SU
NY
Buf
falo
24Ju
ne20
08
0 5 10 150
1
2 SMT = 1.49g (at T = 0.603s)
SCT,median = 2.45g
Interstory drift [%]
SC
T [g
]
0 5 10 150
1
2 SMT = 1.5g (at T = 0.423s)
Interstory drift [%]S
CT [g
]
a) scaled at Tupper = 0.604 s b) scaled at Tmodel = 0.423 s
Page 41
Further observations
• Model parameter sensitivity
• capping displ. 50 75 mmcapping slope -0.15 -0.05 +6%
• .ααααP 0.75 0.40
SU
NY
Buf
falo
24Ju
ne 2
008
SU
NY
Buf
falo
24Ju
ne20
08
• .ααααP 0.75 0.40ββββP 0.25 0.21 +8%
• adjusted initial stiffness +6%
• 1.4 x strength +30%
Page 42
Performance quantification
• check R = 4 High seismic (SDC Dmax)SS = 1.5, S1 = 0.9 (SDS = 1.0, SD1 = 0.6)
ΩΩΩΩ0 µµµµC SSFSMT
(Tupper )SFanchor ββββtot ŜCT CMR ACMR
[-] [-] [-] [g] [-] [-] [g] [-] [-]
1 1 Commercial 2.38 6.25 1.31 1.50 2.1 0.70 2.79 1.86 2.44 >
Archetype Story # Function
SU
NY
Buf
falo
24Ju
ne 2
008
SU
NY
Buf
falo
24Ju
ne20
08
5 2 Commercial 2.40 4.37 1.26 1.50 1.89 0.70 3.06 2.04 2.57 >
9 3 Commercial 2.39 3.36 1.22 1.50 1.98 0.70 2.88 1.92 2.34 >
Mean 2.45 >
2 1 1&2 Family 9.91 6.31 1.31 1.50 2.1 0.70 6.00 4.00 5.24 >
6 2 1&2 Family 4.91 4.95 1.27 1.50 1.89 0.70 4.63 3.09 3.92 >
10 3 Multi-Family 2.52 4.06 1.25 1.50 1.98 0.70 3.16 2.11 2.64 >
13 4 Multi-Family 2.56 3.00 1.20 1.50 2 0.70 2.94 1.96 2.35 >
15 5 Multi-Family 2.57 2.72 1.20 1.50 2.1 0.70 2.93 1.96 2.35 >
Mean 3.30 >
Page 43
Performance quantification
• even for taller buildingsR = 4 High seismic (SDC Dmax)
SS = 1.5, S1 = 0.9 (SDS = 1.0, SD1 = 0.6)
ΩΩΩΩ0 µµµµC SSFSMT
(Tupper )SFanchor ββββtot ŜCT
[-] [-] [-] [g] [-] [-] [g]
Archetype Story # Function
2 1 1&2 Family 9.91 6.31 1.31 1.50 2.1 0.70 6.00
SU
NY
Buf
falo
24Ju
ne 2
008
SU
NY
Buf
falo
24Ju
ne20
08
6 2 1&2 Family 4.91 4.95 1.27 1.50 1.89 0.70 4.63
10 3 Multi-Family 2.52 4.06 1.25 1.50 1.98 0.70 3.16
13 4 Multi-Family 2.56 3.00 1.20 1.50 2 0.70 2.94
15 5 Multi-Family 2.57 2.72 1.20 1.50 2.1 0.70 2.93
17 6 Multi-Family 2.57 2.48 1.22 1.49 2.49 0.70 2.45
18 7 Multi-Family 2.08 2.40 1.22 1.33 2.37 0.70 2.54
19 8 Multi-Family 2.34 2.34 1.22 1.20 2.46 0.70 2.43
21 10 Multi-Family 2.42 2.31 1.23 1.02 2.49 0.70 2.25
Page 44
Performance quantification
• R = 4 !
• results and component behavior are very similar to wooden shear wall – as good as wood
• R = 6 is in code for wooden shear wall• additional finishing, partition walls?
+
SU
NY
Buf
falo
24Ju
ne 2
008
SU
NY
Buf
falo
24Ju
ne20
08
• additional finishing, partition walls?
• short period bldgs!• ASD design strength derivation from test
• uncertainties in the monotonic backbone estimation
-
+/-
Page 45
Performance quantification
conventional R factor vs. ATC -63
SU
NY
Buf
falo
24Ju
ne 2
008
SU
NY
Buf
falo
24Ju
ne20
08
conventional R factor vs. ATC -63
?
Page 46
SUNY Buffalo
24 June 2008
SUNY Buffalo
24 June 2008
Thank you for your attention!
But don’t go anywhere…