Selecting and Designing Instruments: Item Development, Reliability, and Validity John D. Hathcoat, PhD & Courtney B. Sanders, MS, Nikole Gregg, BA This document consists of an introduction to the selection and design of instruments in educational assessment. An overview of basic considerations in selecting/designing an instrument, item development, reliability, and validity is provided.
Transcript
Selecting and Designing Instruments: Item Development, Reliability, and Validity John D. Hathcoat, PhD & Courtney B. Sanders, MS, Nikole Gregg, BA
This document consists of an introduction to the selection and design of instruments in
educational assessment. An overview of basic considerations in selecting/designing an
instrument, item development, reliability, and validity is provided.
SELECTING AND/OR DESIGNING AN ASSESSMENT INSTRUMENT ................................................. 5
Direct versus Indirect ..................................................................................................................................... 5
Important Assumptions .............................................................................................................................. 14
Sources of Error ............................................................................................................................................. 15
Alternate Forms ............................................................................................................................................. 20
SPSS Alternate Forms .................................................................................................................................. 21
Definition and Displacing Common Misconceptions ....................................................................... 28
Tests are not valid or invalid ............................................................................................................... 28
Validity is a matter of degree ............................................................................................................... 29
Validity is a unitary concept ................................................................................................................. 29
Each interpretation must be supported .......................................................................................... 29
Each use of a test must be supported ............................................................................................... 29
Threats to Validity ........................................................................................................................................ 30
Sources of Validity Evidence ..................................................................................................................... 30
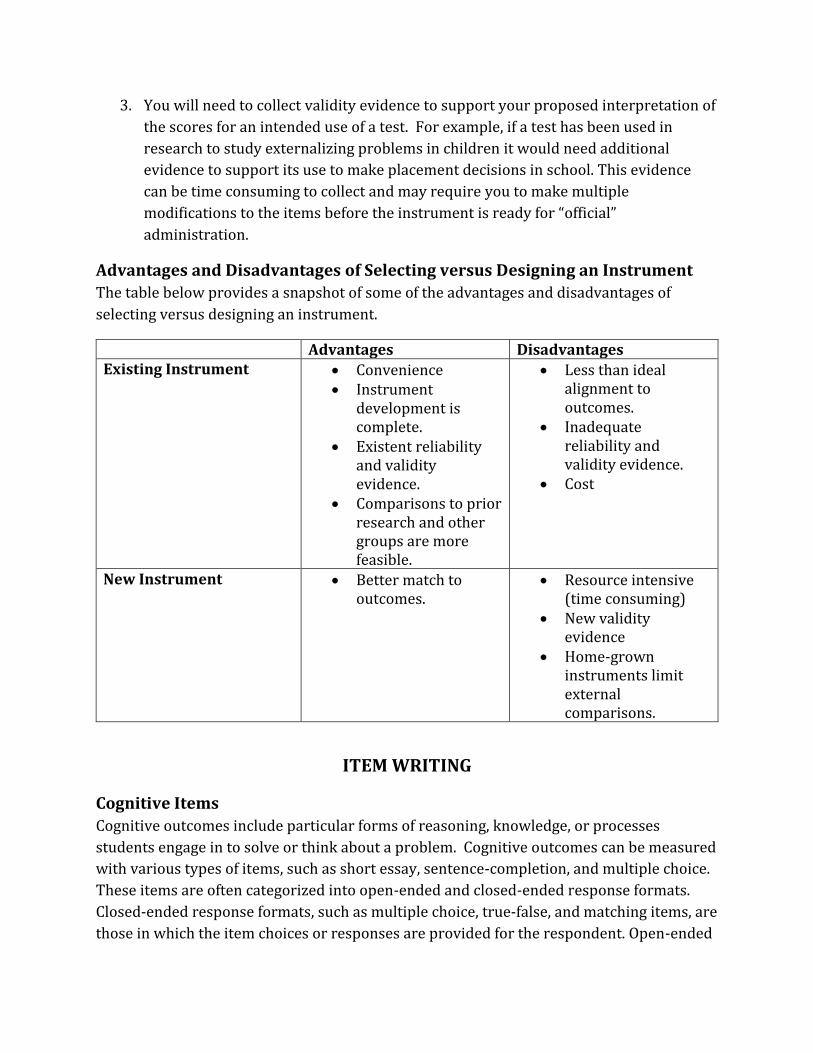
Cognitive outcomes include particular forms of reasoning, knowledge, or processes
students engage in to solve or think about a problem. Cognitive outcomes can be measured
with various types of items, such as short essay, sentence-completion, and multiple choice.
These items are often categorized into open-ended and closed-ended response formats.
Closed-ended response formats, such as multiple choice, true-false, and matching items, are
those in which the item choices or responses are provided for the respondent. Open-ended
formats, such as short answer and essay, require the respondent to construct their own
answer. These items are also called constructed-response items.
Closed-ended Items
Multiple choice items are typically considered the most versatile type of item. Although
these types of items are often criticized for only measuring rote memorization, multiple
choice items can be constructed in such a way as to tap into higher level cognitive
processes, such as synthesis and analysis of information. Items that ask respondents to
interpret tables or graphs, make comparisons, or identify similarities or differences, focus
on higher level cognitive processes. Another advantage of multiple choice items is that they
can provide the test administrator with helpful diagnostic information about respondents’
misunderstandings of the subject matter. To do this, incorrect answer choices (known as
distractors) must be written to include common errors or misconceptions.
True-false items are also common cognitive because they are considered easier to write
than multiple choice items. This is because true-false items do not contain distractors.
However, true-false items are more susceptible to being influenced by guessing than
multiple choice items. Matching items, which typically involve a list or set of related
responses, can be used to measure a wide range of skills (from simple to complex
knowledge) and are often used to assess knowledge of specific facts.
Open-ended Items
Open-ended or constructed response items require the respondent to formulate and write
an answer to a prompt. Open-ended items include short answer/essay and sentence
completion items. An advantage of these items is that they are not susceptible to guessing.
However, since these items allow more freedom for respondents to answer the question,
they are not as easy to score as closed-ended items. These items are typically scored using
a rubric or checklist. It is also important to note that one should examine inter-rater
agreement or reliability when using a rubric.
Inter-rater reliability is not addressed within
this handbook. However, a reference to this
issue is provided at the end of the guidebook.
Non-Cognitive or Attitudinal Items
Non-cognitive or attitudinal items measure
the preferences and/or interests of
respondents. An attitude typically refers to
how one feels toward an object, idea, or
person. Other non-cognitive outcomes may
include beliefs and values. There are no right
or wrong answers to these type of items.
While item writers do not need to be concerned about respondents guessing the correct
answers (as in cognitive items), they should be concerned about other issues, such as social
desirability. Social desirability refers to a response pattern in which respondents select
answers that they believe are socially desirable options. For example, if an assessment
practitioner aimed to measure “risky” or “illegal” behavior, students may be hesitant to
provide truthful responses. Social desirability can, at least in part, be addressed by
ensuring confidentiality or anonymity to participants.
Similar to cognitive items, attitudes can be assessed in several ways. These items can be
open-ended (e.g., short answer) or closed-ended (e.g., ranking scale or multiple response).
Closed-ended item types are described in greater detail below.
Closed-ended Items
Type of Item Description
Checklists Can be used to obtain a great deal of information at one time. A checklist can be used to indicate the presence or absence of something of interest.
Multiple-response Items These items present a problem and offer the examinee response options. Typically these items allow respondents to select more than one response. (e.g., “select all that apply”).
Ranking Scales Used to rank-order things as they relate to one another. For example, a respondent orders a list of beverages according to the preferences. Should be limited to no more than five items to avoid confusion and misnumbering by respondents.
Likert-type Scales Composed of items that ask respondents to rate a statement using a scale, such as 1 = strongly agree to 5 = strongly agree. The items may yield a total score or several subscale scores.
General Guidelines for Item Writing
The following guidelines apply to the writing of cognitive or attitudinal items. The item
format is specified where appropriate.
Cognitive Items
Offer 3-4 well-developed answer choices for multiple choice items. The aim is to
provide variability in responses and to include plausible distractors.
Distractors should not be easily identified as wrong choices.
Use boldface to emphasize negative wording.
Make answer choices brief, not repetitive.
Avoid the use of all of the above, none of the above, or a combinations such as A and B
options. It is tempting to use them because they are easy to write, but there are
several reasons for avoiding their use:
o Students with partial knowledge of the question may be able to answer the
question correctly by process of elimination. For example, a student may
know that two out of the three response options are correct, causing them to
correctly select all of the above.
o These items may make it more difficult to discriminate between those
students who fully know the subject matter and those who do not, which may
lower reliability.
For matching items, provide more response options than items in the list (e.g., offer
10 response options for a list of seven items). This decreases the likelihood of
participants getting an answer correct through the process of elimination.
List response options in a set order. Words can be listed in alphabetical order; dates
and numbers can be arranged in either ascending or descending order. This makes
it easier for a respondent to search for the correct answer.
Make sure do not give hints about the correct answer to other items on the
instrument.
Attitudinal Items
Avoid “loading” the questions by inadvertently incorporating your own opinions
into the items.
Avoid statements that are factual or capable of being interpreted as such.
Avoid statements that are likely to be endorsed by almost everyone or almost no
one.
Statements should be clearly written -- avoid jargon, colloquialisms, etc.
Each item should focus on one idea.
Items should be concise. Try to avoid the words “if” or “because”, which complicates
the sentence.
Common Mistakes when Writing Items
Double-barreled items
These are items that express two or more ideas.
Example: “I like to exercise at the gym at least 3-5 times per week.” (i.e., Is the item
addressing whether respondents like to exercise at the gym or how often they like
to exercise?
Reworded: I like to exercise at the gym.
I like to exercise at least 3-5 times per week.
Items that give clues to the correct answer in the wording
Example: When the two main characters went outside they tossed around an
_____________________.
a. baseball
b. tomato
c. apple
d. football
Reworded: When the two main characters went outside they tossed around a(n)
_____________________.
OR
When the two main characters went outside they tossed around the
______________________.
Loaded questions
These questions inadvertently incorporate your own opinion into the item.
Example: Is there any reason to keep this program?
Reworded: Does this program offer material not obtained in other courses?
RELIABILITY There are various approaches for examining “reliability-like” coefficients within
measurement literature. Our discussion focuses on Classical Test Theory (CTT) since this
is perhaps the most widely used approach among assessment practitioners. We do not
address measurement error from the perspective of generalizability theory or item
response theory within this guide.
We begin by providing a conceptual overview of reliability which is followed by a summary
of how it is assessed. This section concludes by discussing some practical considerations in
reliability estimation.
Conceptual Overview
Reliability is concerned about the consistency of scores. Imagine an individual who
repeatedly stands on a bathroom scale within a few minutes and records each number.
Further imagine that each time this person stood on the scale a random number appeared.
We may obtain something like the following numbers: 10,
40, 95, 120, 123, 140, 150, and 205.
A similar problem exists when we think about assessment.
Imagine that Student 1 took a test and received a score of
85. Ideally, if Student 1 were to take the same test under the
same conditions their new score should be close to 85. If
these scores were widely inconsistent across independent
replications of testing then we would should be concerned
about using these scores to make judgments about Student
Most measurement theorists believe that reliability (i.e. consistency) is a necessary but
insufficient condition for measurement. If scores were entirely inconsistent then they are
random. If scores are random, then nothing is being measured.
Conceptual Overview of Classical Test Theory
Classical Test Theory (CTT) is an axiomatic system that allows us to estimate reliability in a
population if in fact particular assumptions are true. According to CTT each person’s score
can be described by the following equation:
𝑋 = 𝑇 + 𝐸 (1)
In this equation X refers to a person’s observed score. For Student 1 the observed score
refers to the 85 on the test described above. Their score of 85 reflects the composite of a
true score (i.e., T in the equation) and error (i.e., E in the equation).
The term “true” in CTT can be misleading. A true score does not reflect the true or actual
level of an attribute. In other words, if this were a math test Student 1’s true score does not
indicate their actual math ability. Instead the true score is something like an average, or
more precisely an expected value, across repeated replications of administering the same test
to Student 1. Error is by definition random.
By conducting simple manipulations of equation 1 we can see that a true score can also be
conceived as the difference between an observed score and error (i.e., T = X -E) and that
error can also be conceived as the difference between a true score and observed score (i.e.,
E = T - X).
Since we are interested in populations, as opposed to a particular student, we apply the
following equation:
𝜎𝑋2 = 𝜎𝑇
2 + 𝜎𝐸2 (2)
Equation 2 indicates that observed score variance (𝜎𝑋2) is composed of true score
variance(𝜎𝑇2) plus error variance (𝜎𝐸
2).
Reliability Defined
From equation 2 we can derive different, though mathematically equivalent, ways to
conceptualize reliability according to CTT. Two equivalent ways to conceptualize
reliability are provided in the Table below.
Reliability Equation Interpretation
Reliability = 𝜎𝑇2
𝜎𝑋2
Ratio of true score variance to observed score variance. In other words, it is the amount of observed score variance that we can attribute to true score variance. A value of .80 indicates that we can attribute 80% of the observed score variance to true score variance.
Reliability = 1 −𝜎𝐸2
𝜎𝑋2
This is the absence of error variance. In other words, it is the amount of observed score variance that is systematic as opposed to random. A reliability estimate of .80 indicates that 20% of the observed score variance may be attributed to error.
Reliability estimates range from 0 to 1. A value of 0
indicates that all of the variance may be attributed to
error. A value of 1 indicates that all of the variance
can be attributed to true score variation.
Important Assumptions
As previously mentioned, CTT consists of a set of
axioms, along with assumptions, that allow us to
estimate reliability. It is important to know when such assumptions may be violated to be
able to evaluate the appropriateness of reliability estimates in different situations.
The table below provides an overview of important axioms and assumptions used in CTT.
This table also describes a scenario in which each assumption/axiom may be violated.
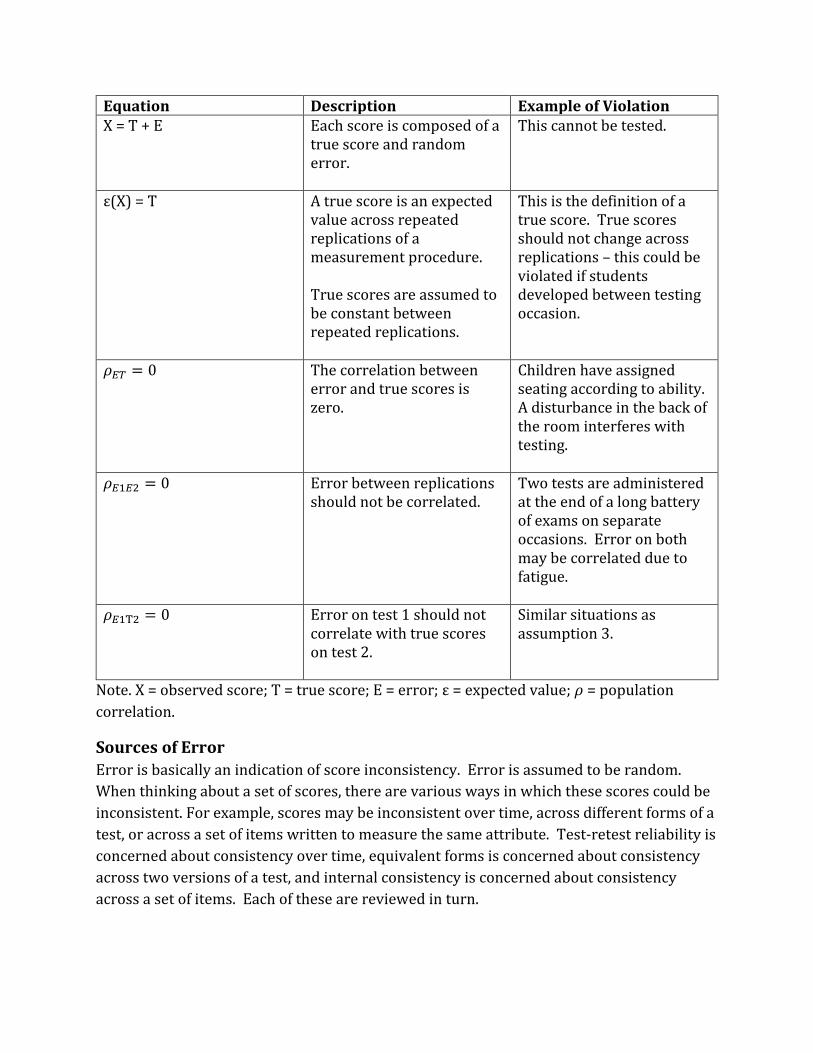
Equation Description Example of Violation X = T + E
Each score is composed of a true score and random error.
This cannot be tested.
ε(X) = T
A true score is an expected value across repeated replications of a measurement procedure. True scores are assumed to be constant between repeated replications.
This is the definition of a true score. True scores should not change across replications – this could be violated if students developed between testing occasion.
𝜌𝐸𝑇 = 0
The correlation between error and true scores is zero.
Children have assigned seating according to ability. A disturbance in the back of the room interferes with testing.
𝜌𝐸1𝐸2 = 0
Error between replications should not be correlated.
Two tests are administered at the end of a long battery of exams on separate occasions. Error on both may be correlated due to fatigue.
𝜌𝐸1T2 = 0
Error on test 1 should not correlate with true scores on test 2.
Similar situations as assumption 3.
Note. X = observed score; T = true score; E = error; ε = expected value; 𝜌 = population
correlation.
Sources of Error
Error is basically an indication of score inconsistency. Error is assumed to be random.
When thinking about a set of scores, there are various ways in which these scores could be
inconsistent. For example, scores may be inconsistent over time, across different forms of a
test, or across a set of items written to measure the same attribute. Test-retest reliability is
concerned about consistency over time, equivalent forms is concerned about consistency
across two versions of a test, and internal consistency is concerned about consistency
across a set of items. Each of these are reviewed in turn.
Test-Retest
As previously mentioned, test-retest reliability is concerned with the consistency of scores
across two points in time. This reliability estimate is obtained by examining the correlation
between both sets of scores across each point in time (i.e. scores at Time 1 with scores at
Time 2). This is often referred to as a stability coefficient since it indicates the extent to
which the relative position of students tends to be stable across measurement occasions.
The following is a list of issues to consider when using this method:
Test-retest reliability is particularly important in situations in which we want to
take scores at Time 1 and use them at Time 2. For example, if students complete a
math placement test in the early summer and these scores are used to place
students into particular courses in August then the scores should be consistent
across this interval of time.
Test-retest reliability should not be estimated before and after an experimental
intervention. This includes any situation in which students have received
instruction. We do not expect scores to be consistent in this situation because we
would like for the intervention to be effective.
Test-retest reliability is inappropriate in situations where we expect an attribute to
change over time such as moods or other psychological states. Participant
sensitization (e.g. they become aware that you are examining test anxiety) and
practice effects (e.g. students score increase due to familiarity with the instrument)
may also be a concern when administering the same instrument twice.
Selecting an ideal interval of time between testing is perhaps the most challenging
issue facing individuals using this technique. Unfortunately there are no simple
answers to this question. In general, one should consider whether it is reasonable
for scores to be stable over a given time interval and how you plan to use the scores
to make decisions.
There are no clear guidelines for acceptable test-retest correlations since these
values depend on a number of contextual factors (e.g. type of attribute, length of
interval, etc.).
SPSS Test-Retest
In this example, we have 20 students who were administered a math placement test in
May. These students were administered the same test in August.
This data would be displayed as follows in SPSS. In this file, each row is a person.
Variables, which in this case represent scores at Time 1 and Time 2, are columns.
Prior to estimating our reliability coefficient, we may wish to examine our data using a
scatterplot. This is provided below.
Scatterplot of Student Scores at Time 1 and Time 2
The scatterplot displays each score across both points in time. This plot suggests that
there is a tendency for students who score high at Time 1 to also score high at Time 2.
Similarly, students who score low at Time 1 tend to score low at Time 2.
Before examining the correlation between each form we may wish to examine the
scatterplot. The scatterplot indicates that there is a tendency for students who score high
on Form A to also score high on Form B. Similarly, students who have low scores on Form
A also tend to have low scores on Form B.
Scatterplot of Student Scores for Form A and Form B
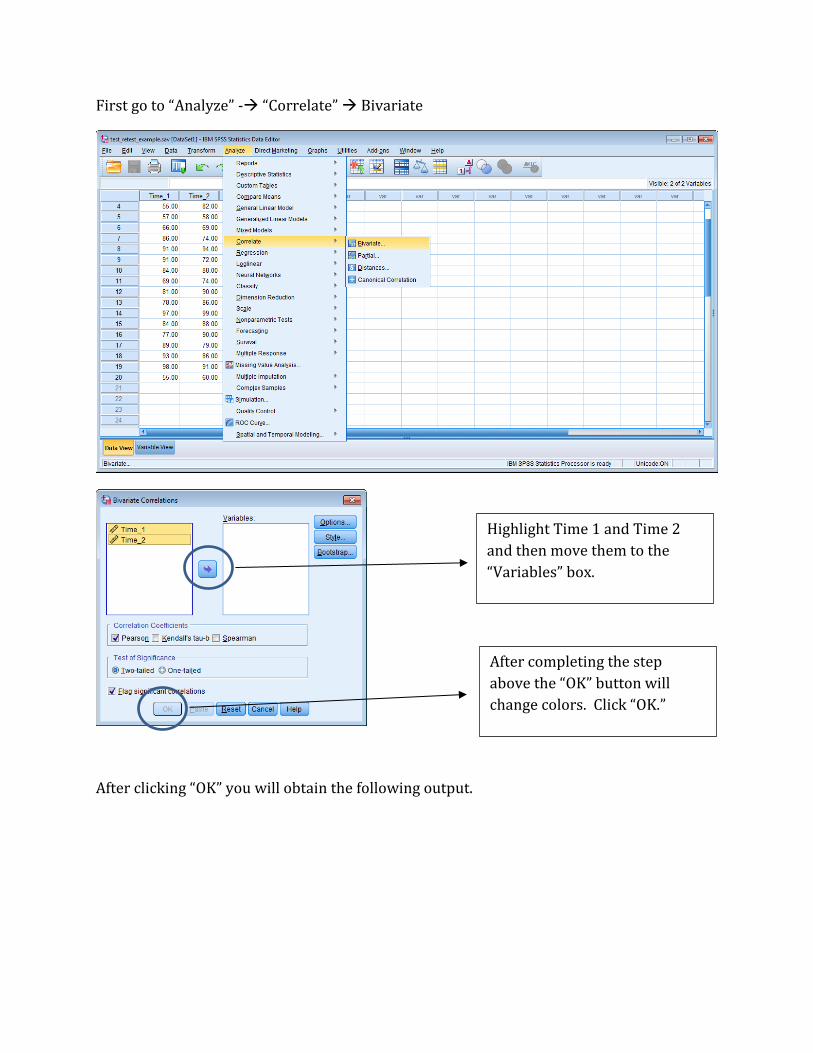
To obtain the test-retest reliability estimate we need to obtain the correlation between
scores at Time 1 and scores at Time 2. The steps in SPSS are described as follows:
First go to “Analyze” - “Correlate” Bivariate
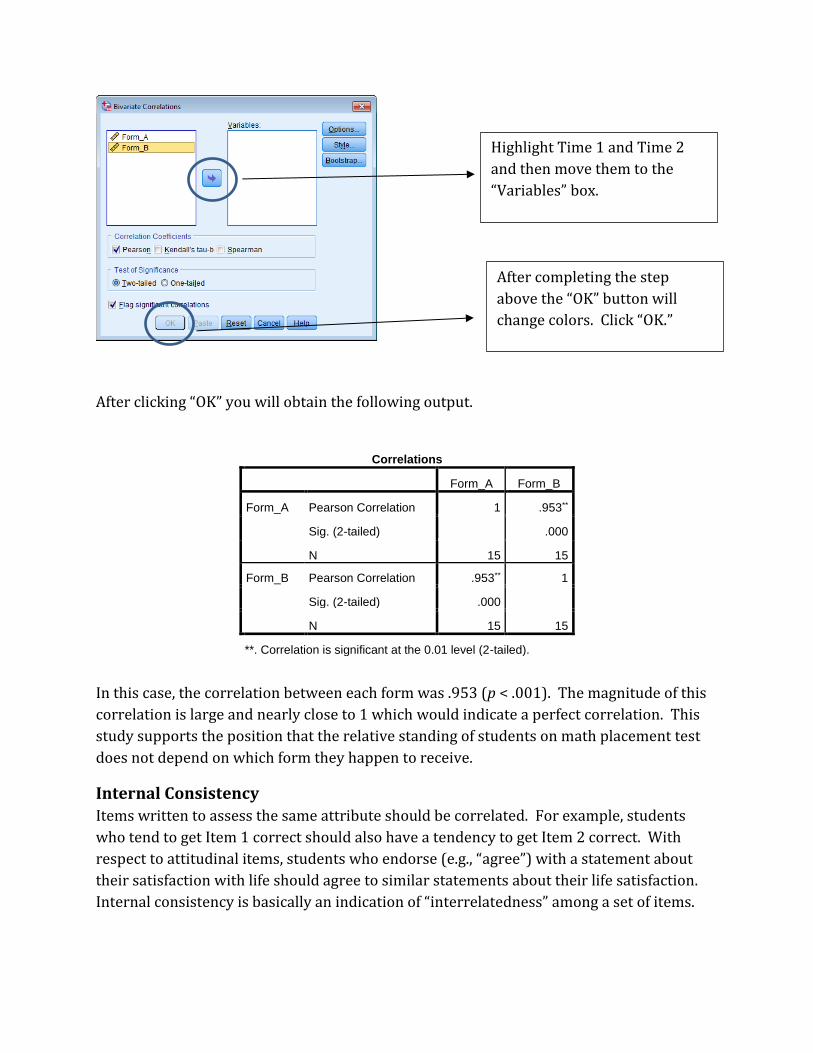
After clicking “OK” you will obtain the following output.
Highlight Time 1 and Time 2
and then move them to the
“Variables” box.
After completing the step
above the “OK” button will
change colors. Click “OK.”
Correlations
Time_1 Time_2
Time_1 Pearson Correlation 1 .605**
Sig. (2-tailed) .005
N 20 20
Time_2 Pearson Correlation .605** 1
Sig. (2-tailed) .005
N 20 20
**. Correlation is significant at the 0.01 level (2-tailed).
In this example, our test-retest correlation was .605. Though this value was statistically
significant, since the p-value (i.e., sig. 2-tailed) is .005, the magnitude of the reliability estimate
is relatively small for making placement decisions. There are no strict rules-of-thumb for such
decisions. However if our estimate was closer to .80 or .90 we would have more confidence that
the scores in May could be used to make placement decisions in August.
Such inconsistencies may occur for various reasons. For example, it is possible that students
simply fail to remember important math skills if they take a break during the summer.
Irrespective of the reasons for such inconsistencies, we would recommend for the students to
take the placement test in August since these scores may be a better indication of skills before
the fall semester.
Alternate Forms
There are situations in which a practitioner may wish to create two versions of a test or
they may be interested in the consistency of scores between two versions of a test that
have already been created. In such instances, scores should not depend upon which test an
examinee happens to receive. For example, the score of Student 1 should not depend on
which form of the test they happened to receive.
Similar to the test-retest estimate, this source of error is examined by correlating scores
between Form A and Form B among the same sample of students. This reliability estimate
is often referred to as a “coefficient of equivalence” since it examines the extent to which
the relative standing, or position, of students is consistent between two versions of a test.
The following is a list of issues to consider when using this method:
This reliability estimate is important when we would like to be able to substitute
one test for another test.
Controlling for potential fatigue is an issue with this technique. For example, it is
unlikely that students will be able to take both tests on the same day due to fatigue.
It is generally recommended to administer both forms as closely as possible without
evoking fatigue.
In some cases, simply being exposed to the content of test can increase scores on
subsequent testing (i.e., practice effect). It is therefore recommended to
counterbalance the administration of each form. In other words, half of the
participants are assigned to complete Form A followed by Form B and the other half
are assigned to complete Form B followed by Form A.
A lack of consistency between forms may be due to differences in: (a) difficulty, (b)
content, (c) cognitive complexity, and/or (d) issues with fatigue.
We would like to see correlations around .80 to .90.
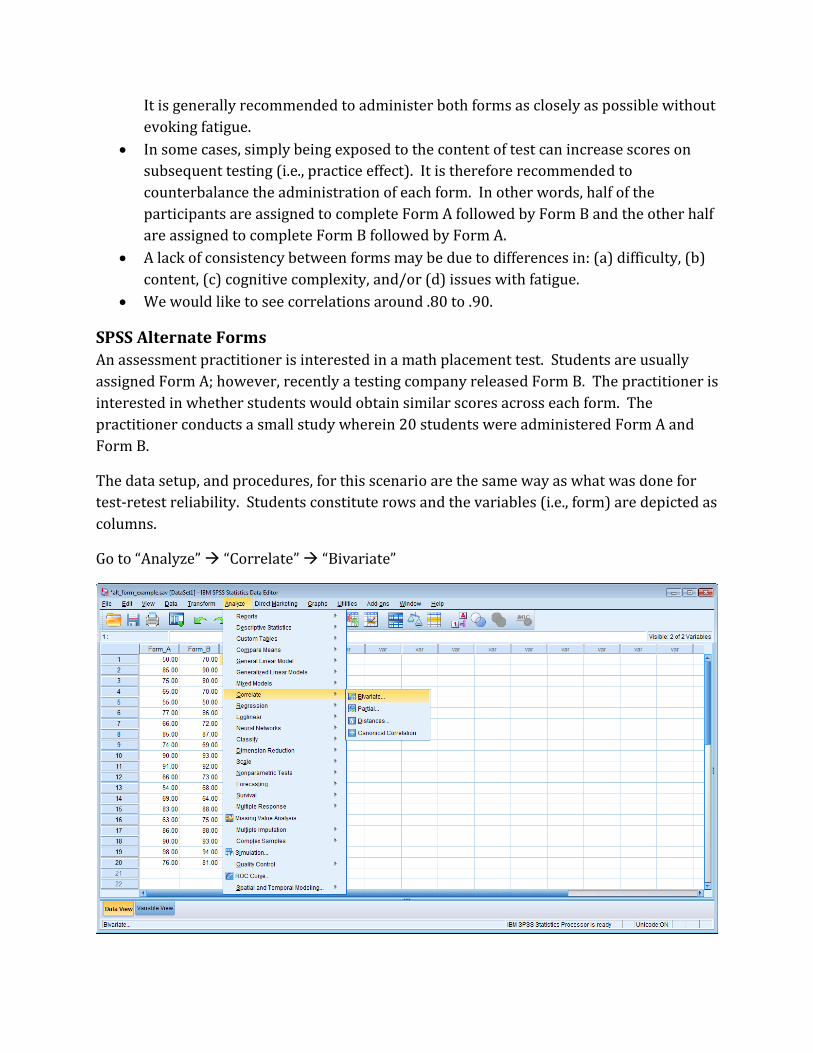
SPSS Alternate Forms
An assessment practitioner is interested in a math placement test. Students are usually
assigned Form A; however, recently a testing company released Form B. The practitioner is
interested in whether students would obtain similar scores across each form. The
practitioner conducts a small study wherein 20 students were administered Form A and
Form B.
The data setup, and procedures, for this scenario are the same way as what was done for
test-retest reliability. Students constitute rows and the variables (i.e., form) are depicted as
columns.
Go to “Analyze” “Correlate” “Bivariate”
After clicking “OK” you will obtain the following output.
Correlations
Form_A Form_B
Form_A Pearson Correlation 1 .953**
Sig. (2-tailed) .000
N 15 15
Form_B Pearson Correlation .953** 1
Sig. (2-tailed) .000
N 15 15
**. Correlation is significant at the 0.01 level (2-tailed).
In this case, the correlation between each form was .953 (p < .001). The magnitude of this
correlation is large and nearly close to 1 which would indicate a perfect correlation. This
study supports the position that the relative standing of students on math placement test
does not depend on which form they happen to receive.
Internal Consistency
Items written to assess the same attribute should be correlated. For example, students
who tend to get Item 1 correct should also have a tendency to get Item 2 correct. With
respect to attitudinal items, students who endorse (e.g., “agree”) with a statement about
their satisfaction with life should agree to similar statements about their life satisfaction.
Internal consistency is basically an indication of “interrelatedness” among a set of items.
Highlight Time 1 and Time 2
and then move them to the
“Variables” box.
After completing the step
above the “OK” button will
change colors. Click “OK.”
Coefficient alpha is perhaps the most frequently reported estimate of internal consistency
for attitudinal items. KR-20 is a similar estimate reported for dichotomous items (e.g.
right/wrong, yes/no, etc.). SPSS uses the label “coefficient alpha” for both estimates.
Alpha is a function of “interrelatedness” and the number of items. Consequently,
alpha can be high simply because there are a lot items on an instrument.
Alpha is often interpreted as a lower-bound estimate of reliability. Alpha can
actually be an overestimate of reliability in some situations (e.g. mistakes on an item
are correlated). Additionally, alpha fails to consider other sources of error, such as
time.
Alpha does not indicate that the items are measuring the same thing. Instead, alpha
assumes that items are measuring the same thing. Items can be correlated for
multiple reasons, only one of which is due to measuring the same attribute.
Alpha should not be reported when a test is speeded. This will result in an
overestimate of reliability. With speeded tests, it is more appropriate to split the
test in two and correlate each half. This correlation will need to be corrected using
the Spearman-Brown prophecy formula to estimate reliability across the entire test
(located in more technical books).
Values below .70 are generally acceptable for research purposes. In high-stakes
testing contexts, these values may need to much higher such as around .80 or .90.
SPSS Alpha Coefficient and Item Analysis
Here we provide an overview of how to obtain an alpha coefficient in SPSS. In situations in
which you have dichotomous data, you indicate in SPSS that the variable is categorical as
opposed to being on a scale. SPSS reports KR-20 as coefficient alpha. This section will also
review some basic item analyses that one may choose to conduct when examining alpha.
In this example, we are using real data obtained from a sample of 652 undergraduate
students at a large university in the Midwest. These students were administered 5 items
from a satisfaction with life scale as part of a larger study. Each item is scored on a Likert-
type scale ranging from 1 = strongly disagree to 7 = strongly agree.
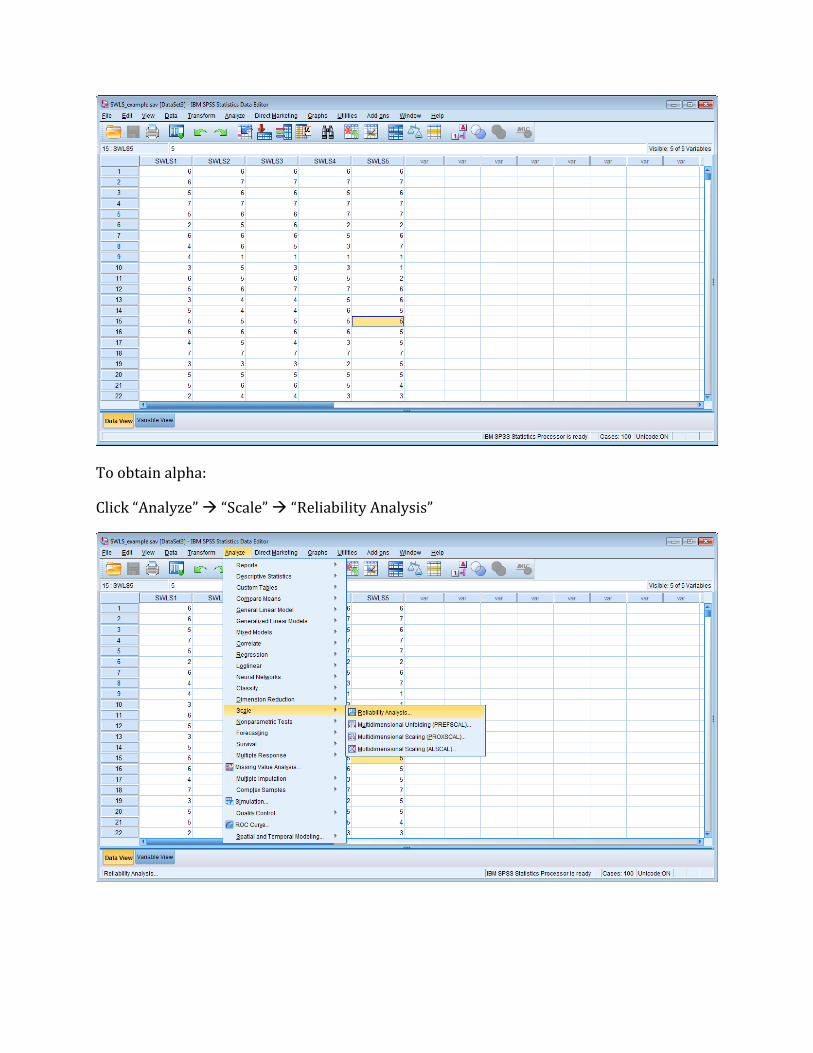
The SPSS data file is set up in the same way as previous examples. Students constitute
rows and their responses to the five items are depicted in the columns. SWLS1 is response
to item 1, SWLS2, is response to item 2, etc.
To obtain alpha:
Click “Analyze” “Scale” “Reliability Analysis”
A brief review of inter-item correlations, alpha, and some of the item-total statistics will be
provided.
Move each variable into the
“Items” box.
Click “Statistics” to open up a
new box.
Before clicking “Continue” put a check in any box for which you like to see output. In
this case, we checked descriptives for item, scale, and scale if item deleted. We also
checked the box to obtain inter-item correlations and the overall mean, variance, and
average inter-item correlation. After clicking “continue” a new box will appear. Click
“OK” to obtain the output.
Inter-Item Correlation Matrix
SWLS1 SWLS2 SWLS3 SWLS4 SWLS5
SWLS1 1.000 .676 .611 .549 .358
SWLS2 .676 1.000 .674 .579 .380
SWLS3 .611 .674 1.000 .661 .446
SWLS4 .549 .579 .661 1.000 .424
SWLS5 .358 .380 .446 .424 1.000
Summary Item Statistics
Mean Minimum Maximum Range Maximum / Minimum Variance N of Items