www.itcon.org - Journal of Information Technology in Construction - ISSN 1874-4753
ITcon Vol. 18 (2013), Chen, pg. 1
SELECTION AND EVALUATION OF COLOR SCHEME FOR 4D CONSTRUCTION MODELS
SUBMITTED: March 2012
PUBLISHED: February 2013 at http://www.itcon.org/2013/1
EDITOR: Amor R.
Ya-Hsin Chen, Graduate Student,
Department of Civil Engineering, National Taiwan University, Taiwan
[email protected]
Meng-Han Tsai, Postdoctoral Researcher,
Center for Weather Climate and Disaster Research, National Taiwan University, Taiwan
[email protected]
Shih-Chung Kang, Associate Professor,
Department of Civil Engineering, National Taiwan University, Taiwan
[email protected]
Chin-Wei Liu, Graduate Student,
Department of Civil Engineering, National Taiwan University, Taiwan
[email protected]
SUMMARY: Four-dimensional models have proven to be an effective tool in construction management. The 3D
models within these change color according to changes in the corresponding construction schedule. Color
schemes play a crucial role in the design and representation of a 4D model. Good color schemes enhance an
engineer’s understanding of the situation at hand. Therefore, this research aims to develop effective and
affordable tools for selecting and evaluating color schemes in 4D models. We proposed a two-step method of
color selection. The first step is to determine the number of construction statuses and their relationships with
each other. The second step is to select the colors to fit these statuses. In this research, we also developed three
types of simulators to facilitate color evaluation. The display simulator is the first type of simulator developed
and includes a LED monitor simulator, a projector simulator, and a printout simulator. The second type of
simulator is the viewer simulator, which simulates protanopic blindness and tritanope blindness. The third type
of simulator is the rendering simulator. This simulates the rendering results from the two major 3D viewers:
NavisWorks and SmartPlant Review. Using the two-step selection method and the three types of simulators, we
identified 21 color schemes (3 for 3 statuses, 12 for 5 statuses, and 6 for 6 statuses) ideal for presenting 4D
models. We summarized our experiences by providing six guidelines for color selections. The color schemes and
simulators were also implemented as a reference tool on a website (http://4Dcolor.caece.net). Future 4D model
builders can refer to this website to select the color scheme that is most appropriate for their projects.
KEYWORDS: 4D model, color scheme, selection, evaluation
REFERENCE: Ya-Hsin Chen, Meng-Han Tsai, Shih-Chung Kang, Chin-Wei Liu (2013) Selection and
evaluation of color scheme for 4D construction models, Journal of Information Technology in Construction
(ITcon), Vol. 18, pg. 1-19, http://www.itcon.org/2013/1
COPYRIGHT: © 2013 The authors. This is an open access article distributed under the terms of the Creative
Commons Attribution 3.0 unported (http://creativecommons.org/licenses/by/3.0/), which
permits unrestricted use, distribution, and reproduction in any medium, provided the
original work is properly cited.
ITcon Vol. 18 (2013), Chen, pg. 2
1. INTRODUCTION
1.1 4D models
Four-dimensional models combine 3D models with a time schedule, and have been widely used for project
planning and construction management. By using 4D models, engineers and stakeholders are able to visually
explore construction activities and communicate more effectively. The added time schedule allows engineers to
“scrub through” the duration of the project enabling them to foresee potential problems in construction progress
and facilitate project management. Some Researchers found that 4D models can reduce model abstraction by
linking 3D construction models to its schedule through associative relationships, as well as displaying more
clearly the construction plan and the model’s actual status (McKinney and Fischer 1998, Kuo et al. 2011). Koo
and Fischer (2000) also found that 4D models can effectively integrate and display design and construction
information, as well as promoting interaction and collaboration between team members within the project. Kim
(2012) also indicated that 4D models can be a good tool for planning, analysis, and communication in civil
engineering construction by carrying out a case study of a cable-stayed bridge project. These research results
clearly show that 4D models are potential tool for construction management.
Previous studies have been based on the use of 4D models for different purposes in the project lifecycle. Many
researchers have investigated the applicability of 4D models for site planning. Akinci et al. (2002) developed a
tool that automatically generates site plans based on 4D models. Wang et al. (2004) extended the use of 4D
technology into other related areas such as resource management and site space utilization. Dawood and Mallasi
(2006) developed a tool named PECASO (patterns execution and critical analysis of site-space organization) to
be used during site planning. Furthermore, some studies have developed 4D models for detecting spatial and
temporal conflicts, as well as to understand construction logistics and demonstrate to the owners the planned
progress (Tabesh and Staub-French 2006, Kam et al. 2003). Bosche and Hass (2008) proposed a 3D/4D CAD
model with geo-referencing technologies for construction progress monitoring. Kubota and Mikami (2010)
developed a 4D information management system to handle spatial and temporal information effectively, and
verified its functionality by using actual data on road maintenance. These related works demonstrate that 4D
models have multiple applications in construction management.
Some researchers have focused on the problems associated with the application of 4D models on actual
constructions. According to the GSA (General Services Administration) building modeling guide series 04 (GSA
2009), 4D models can be used for the analysis of the temporal aspects of construction coordination and
constructability review. Chang et al. (2012) used a 4D crane model to simulate site planning. Chau et al. (2004)
implemented a 4D management approach to construction planning and site space utilization. Tsai et al.
(2012)conducted a series of field studies to identify the benefits and problems of introducing 4D models in actual
projects, discovering a vital issue regarding the application of 4D models, especially in large and complex
projects (Dawood et al. 2002, Dawood et al. 2005). Tsai et al. (2010) developed a SUM (System Evaluation,
Usability Study and Management Plan) framework to assist with the introduction of a 4D tool to a consulting
firm. Hallberg and Tarandi (2011) used 4D models to present the life cycle information of a construction project
and to analyze the different components of the building at different moments in time. Golparvar-Fard et al. (2009)
presented a visualization model that integrates the 4D model and photographs within an augmented reality (AR)
environment in order to allow for progress monitoring. Golparvar-Fard et al. (2011) and Yeh et al. (2012) also
integrated a 4D/BIM as-built and as-planned model with AR as a tool for site management and construction
maintenance. Nevertheless, with the increasing utilization of IT-based planning in the construction industry and,
in particular, 4D modeling, the usability issue and effects of 4D modeling are becoming more noticeable and
worthy of research.
ITcon Vol. 18 (2013), Chen, pg. 3
1.2 Color schemes
Many researchers have noticed the impact of using colors in modeling for engineering purposes. Akinci et al.
(2002) used particular colors to highlight spatial conflicts in a model and used them to notify users of
constructability problems in their prototype system during time-space conflict analyses of construction sites.
Song et al. (2003) suggested that a consistent application of colors would allow project performance metrics to
be represented easily. Ahlstrom and Arend (2005) presented a prototype color palette that used color-coding to
prioritize display information whilst maintaining good legibility in air traffic control displays. Gao et al. (2006)
studied the importance of applying color drawings in construction, which facilitates designers and contractors
with more efficient and accurate communication. This research indicates that, the selection of colors is an
important consideration when developing 4D tools.
Four-dimensional models traditionally use color schemes to represent the corresponding construction status, with
the schemes aiding engineers in visualizing the amount of progress that has been made. Dawood and Sikka
(2008) noted that appropriate colors can be used as a tool to communicate more information to users. Puhalla
(2008) pointed out that colors are an intrinsic attribute and the combination of various colors allows people to
communicate visually to reinforce information hierarchy. However, the selection of the color schemes used
currently is often based on engineers’ personal preferences without considering the usability of these color
schemes.
There have been many years of significant research into the question of how colors could be used to present
information more effectively. Morgan (1995) believed that color was not simply an afterthought, but a
potentially powerful means of conveying information by grouping or by drawing on a user’s prior experience in
encoding information. Zeng (2010) drew our attention towards the encoding of information through the use of
color schemes in digital maps. Chen (2005) pointed out that usability is one of the ten unsolved problems in
information visualization. Roh et al. (2011) proposed an object-based approach by using 2D or 3D charts with
volume or color rendering. Plaisant (2005) reported that addressing the usability problem of information
visualization needs a larger and more diverse group of users. Plaisant also indicated that using an appropriate
color scheme would be necessary, providing an immediate benefit for users in applications. These results clearly
show the need for usability tests in effective color presentations. In other words, rigorous usability tests may be
beneficial in the selection of colors for 4D models.
Several studies have revealed that colors can affect the way users work and feel, and their personal experiences
and mental state may affect their own perception of colors. A notable example of using colors to deliver
information is the temperature world map, which is shown by Tufte (1997). Using unintuitive colors, which do
not consider the relationship of information, may not be efficient or may even mislead. Ou (2004) concluded that
colors may play different roles for different people in making decisions on what they like and dislike. The
investigation in Lee et al. (2008) found that colors and shapes can affect the preference and feelings of 2D and
3D objects. Madden (2000) conducted a cross-culture study to indicate the relationships between cultures, color
meanings, and color preferences.
The use of various colors simultaneously has also been documented. Cohen-Or (2006) presented a method for
enhancing harmony amongst colors, which is aesthetically pleasing to human visual perception. Tokumaru (2002)
developed a system to design and evaluate harmonic color schemes using fuzzy rules. At present, researchers
have focused their study of color schemes on better integration in industrial practice. Harrower and Brewer
(2003) proposed an online tool called ColorBrewer, which was designed to help cartographers select an effective
color scheme for thematic maps. The Adobe Kuler system (Adobe 2008) is a web-based application developed
for generating color schemes.
Evidently, color schemes have already been purposefully integrated into different kinds of engineering
applications. A color scheme not only represents a set of attributes on a computer screen, but also acts as a
cognitive tool linking information with a user’s understandings. A well-chosen set of colors may assist users to
process the information more effectively and efficiently. By considering the effects of color schemes,
communication between engineers and engineering systems may also be improved.
ITcon Vol. 18 (2013), Chen, pg. 4
1.3 Factors that may influence color schemes in 4D models
The usability of color schemes may be influenced by four main factors: data, device, viewer, and rendering
algorithm.
The first factor is whether the color schemes are meaningful and intuitive in representing data. Rainbow colors
are treated as the basic color scheme to visualize sequential data. However, Tufte (1997) indicated that the use of
rainbow colors may sometimes misrepresent the nature of the data. Light and Bartlein (2004) pointed out that
rainbow colors are not appropriate for representing sequential data. They revealed that when designing a data
graphic, the relationships between the data should be considered in the selection of color schemes, which deliver
information to users.
The second factor is that colors can be distorted while being shown on different display media, which may
mislead engineer’s interpretations of construction status. According to MacDonald (1999), the cause of this color
distortion is that different kinds of display media, such as LCD monitors, projectors and printers, each have a
different color gamut. To maintain color consistency, we refer to the standard defined by the International Color
Consortium (ICC) (Fairchild 2005) and introduce the concept of color management. However, the concept of
color management may not be suitable for the construction industry. It is difficult to require the wide variety of
4D users, including owners, engineers, construction managers, and subcontractors, to calibrate their devices
solely to read the 4D model. For this reason, we must find a more robust color scheme, which can be displayed
properly across different devices commonly used in the construction industry. The robust color scheme can
convey the information correctly and serve as a good reference for making correct decisions more easily.
The third factor is the potential color vision deficiency of viewers. Research shows that about 8% of men and
0.4% of women have encountered color deficiency problems (MacDonald 1990, Tanaka 2010). Accommodating
color deficiency into color selection can improve the usability of color schemes and applications. Many
researchers have considered the usability of applications and implemented tools to design color schemes for
color-blind viewers (Jenny 2007, Cui et al. 2008). In the field of civil engineering, the population is largely male,
and thus accommodating color-blindness cannot be neglected. Another issue with the potential color is that most
common color vision deficiency issues causes problems in distinguishing red and green colors (Ware 2004).
These two colors are very commonly used by the researchers and engineers in the construction monitor to
represent works as ahead or behind schedule (Bosche et al. 2008, Golparvar et al. 2009, Roh et al. 2011).
The final factor is the rendering algorithm that may influence the color schemes in 3D viewers and 4D models.
Rheingans (2000) pointed out that three-dimensional visualizations impose different constraints than those in
two-dimensional visualizations. Specifically, viewers use shading to judge the 3D shape of a representational
object. Fitzhugh et al. (2009) conducted a study to establish effective 3D perspective interfaces. However,
Forsyth and Ponce (2002) revealed that the rendering algorithms lead to a variety of complex shading effects,
which is currently poorly understood and occurs widely. Therefore, to solve the influence of these factors, Chang
et al. (2009) developed a systematic procedure to select color schemes for 4D models, called the SEUT
(Selection, Examination, and User Test) procedure. Although the SEUT procedure can solve the usability
problems of 4D models, the whole procedure is often too time consuming to be practical for regular developers
or users of 4D models. In particular, following the procedure requires many hours to test the color schemes
interactively. Each test involves real users and needs to set up the different use scenarios of 4D modeling,
including projectors, LCD monitors and printers. Although SEUT is an ideal method to determine the colors for
4D models, it is still far from practical. The development of facilitating tools to reduce the procedure can be
helpful. In particular, research, which can directly provide color suggestions to help users in the reduction of this
procedure, is helpful.
1.4 Research objectives
One objective of this research is to develop a series of color schemes, which can maintain the usability,
comprehensibility and consistency of 4D models under different use scenarios. The color schemes can ensure the
proper presentation of the 4D models so that the users can clearly and easily interpret the information from the
model. The other objective is to develop simulators to simulate different user scenarios for 4D users. These can
be also used to facilitate color selection processes. In particular, three simulators will be developed in this
research. The first simulator validates the influence caused by different software with different graphical
ITcon Vol. 18 (2013), Chen, pg. 5
algorithms. The second simulator is to test the inevitable color distortions caused by different devices, such as
projectors, LCD monitors and printers. The third simulator visualizes the view of color blindness, as
approximately 8% of the male population suffers from color deficiency. The research results, including the
validated color schemes and simulators will be published on the Internet as a reference for future 4D modelers.
2. RESEARCH METHOD
In this research, we first proposed a two-step method for color selection. After color selection, we selected
effective color schemes that served as the visual metaphor for construction statuses. Next, we developed three
simulators to evaluate the color schemes in color evaluation. Using the simulators, it was possible to grasp the
trend of the color distortions and determine effective color schemes for 4D models. Color selection and
evaluation is an integration of color scheme determination. If a color scheme cannot pass the color evaluation
examination, it should be reselected in the color selection. After selecting and evaluating color schemes in 4D
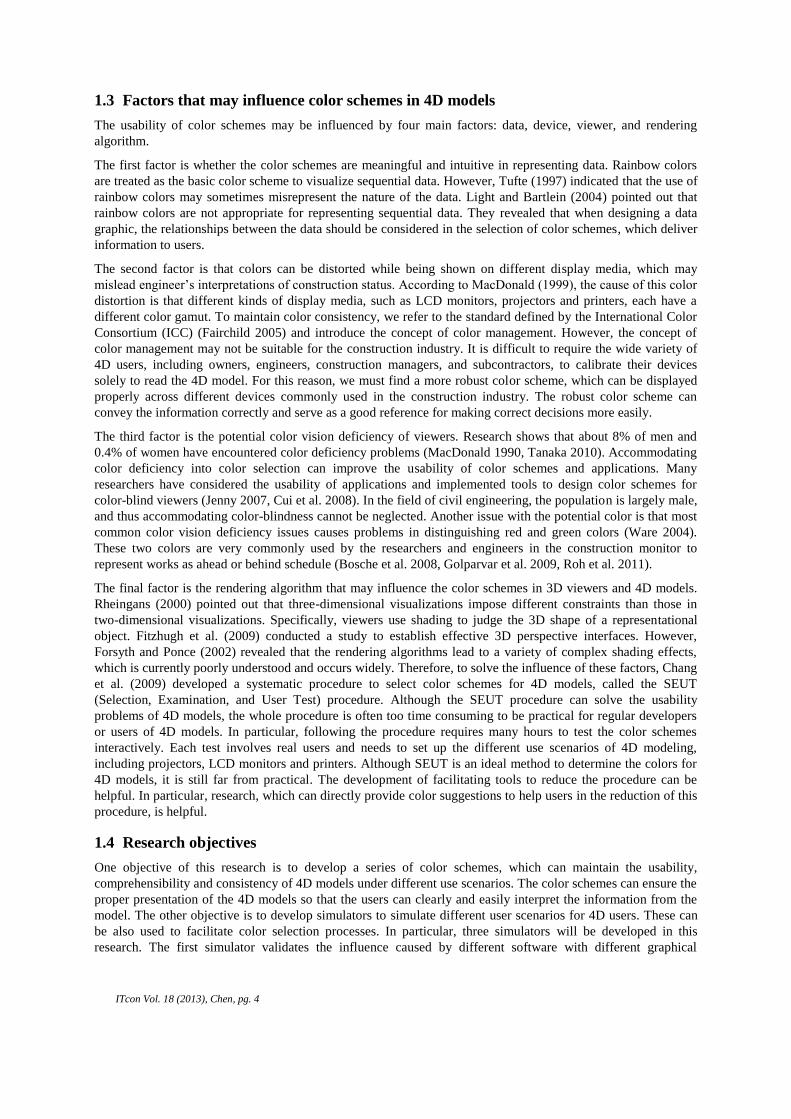
models, we accomplished three major results. Figure 1 shows the framework for selecting and evaluating color
schemes for 4D models.
FIG 1. Framework for selecting and evaluating color schemes for 4D models
The color selection method can generally be classified into two steps. We first determined the application
purposes and the number of statuses by analyzing the information that 4D models deliver. After analysis of the
4D models, we determined the relationships between statuses and found corresponding colors for each status in
the second step. Performing this two-step method in color selection, effective color schemes for 4D models were
selected according to schedule information.
We conducted color evaluation to examine the distinctiveness of color schemes under different viewing
situations. The color evaluation had three types of simulators: a rendering simulator, a display simulator and a
viewer simulator. The rendering simulator provided the results of color schemes with different rendering
algorithms. The second simulator is the display simulator and simulated a view of color schemes when displayed
on display media. The viewer simulator was the final simulator and examined whether color schemes are
distinguishable for colorblindness in color deficient vision.
After going through the integration of color schemes determination, three major research results were identified.
A suggested color scheme was selected by considering the needs of 4D models and evaluating the usability of
different color schemes, thereby reducing users’ time in selecting color schemes for their 4D models. A
web-based tool was developed for users to assess the suggested color schemes and the simulations of color
schemes in different scenarios. The selection guidelines summarized our experience in selecting and evaluating
color schemes for 4D models, which can help users in selecting their own color schemes more efficiently. The
following sections will introduce the details of each part of the research method.
ITcon Vol. 18 (2013), Chen, pg. 6
3. COLOR SELECTION
To select ideal color schemes for 4D models, we proposed a two-step method for selecting color schemes that
can efficiently improve engineers’ understanding of the construction progress. For the purpose of selecting
effective and intuitive color schemes, the first step was to determine the application purposes of the 4D models
and its number of statuses. In the second step, we determined the relationships between statuses and the
corresponding colors to represent each status. After following the principle of color selection in color schemes,
we selected the respective schedule information of construction. The following sections will discuss the details
of each step in color selection.
Step 1: Determine the application purposes and the number of statuses
Colors were displayed sequentially to represent the schedule information of construction progress, which may
vary according to different purposes. As a result, the usability requirements of 4D models should be identified
before selecting color schemes. The information from the time schedule can first be categorized into two factors:
the application purposes and the number of construction statuses. Considering both of these two factors, we can
determine the usability requirements to implement in 4D models.
The purpose of each application had different objectives and needs. After analyzing the 4D models, the key
aspects of the application purposes can be summarized into two main objectives: project planning and
construction management. For the purpose of project planning, the 4D models were used to predict potential
interruptions between different activities to reorganize the sequence of activities. In order to figure out potential
interruptions in the proper sequence of works before a project starts, the color schemes may clearly and
efficiently deliver schedule information, allowing engineers to foresee potential problems before making
decisions. On the other hand, for the purpose of construction management, 4D models were required to show
contemporary situations of construction activities. As a result, 4D modelers were asked especially to pay detailed
attention to the delay-group whenever a delay of construction activities occurred. In order to manage the
construction’s progress, 4D models should coordinate subcontractors and activities during construction. When
4D models were used to compare the actual schedule against the planned schedule, this helped engineers to
better understand and control the project’s progress.
The number of construction statuses plays an important role in color selection. The use of 4D models in
construction planning and management vary with the number of statuses. The number of statuses varies with
different purposes and different levels of information detail depending on the specific information the engineers
would like to emphasize. For instance, the typical planning of 4D models may have three statuses: (1)
pre-construction, (2) under construction, and (3) completion. Another example typical of 4D models for
managing six statuses: (1) pre-construction, (2) under construction, (3) completion, (4) pre-construction delay, (5)
under-construction delay, and (6) completion delay. To confirm the baseline of construction activities, engineers
check the finish-group to plan the next step of their project using activity labels such as finished, finished ahead
of schedule and finished within schedule. The projects referred to in the literature review and the interviews with
engineers appeared to have 3, 5, or 6 statuses that we used to categorize the projects (Benjaoran and Bhokha
2009, Liao et al. 2007). We then selected appropriate number of colors to represent the corresponding
construction statuses.
Step 2: Determine relationships between statuses and corresponding colors
After determining the application purposes and the number of construction statuses, we selected color schemes
to match the construction statuses. The details for selecting effective color schemes for representing the schedule
information are described below.
According to the relationships between constructions statuses, we can select effective color schemes to be fitted
to visualize schedule information. In this research, we adopted diverging and sequential data to select our color
schemes, following the ideas and data investigated by Harrower and Brewer (2003). We also proposed the
inclusion of an additional data type, i.e. independent data. The use of independent data is similar to the pair
schemes used in Harrower and Brewer’s research. It presents the colors for construction tasks, which have a
relationship but are not in an explicitly ordered relationship. Figure 2 shows examples of using sequential color,
ITcon Vol. 18 (2013), Chen, pg. 7
diverging color and independent color. After selecting appropriate color schemes based on the construction stages,
the effect of the display can then be simulated by using ICC profiles. Each ICC profile contains the parameters
related to the feature of the display.
Data type Sequential data Diverging data Independent data
Color scheme
Construction stages Pre-construction
Under-construction
Completion
Pre-construction (Structure department)
Under-construction (Structure department)
Completion (Structure department)
Pre-construction (Pipeline department)
Under-construction (Pipeline department)
Completion (Pipeline department)
Pre-construction
Under-construction
Completion (emphasize)
Pre-construction delay
Under-construction delay
Completion delay
FIG 2. Example of using sequential color, diverging color and independent color
Each type of data has its unique purpose. Independent data was used to represent more than two types of data to
emphasize a special class, which may be the basic hues of color schemes. Diverging data had two types of data
and was used when a critical break point was to be emphasized. Finally, sequential data is suited for representing
data that ranges from low-to-high values. Based on the basic hues, sequential colors were selected for
representing sequential data. A classic example of this is the use of color to show corresponding temperature.
In this research, we used sequential colors, which imply a specific order or sequence to represent the order of
construction activities. In project management, some of the statuses have “delay” situations, which should
brought to the viewers’ close attention. We selected warm colors, known as aware colors, to indicate the delay
statuses, such as pre-construction delay, under-construction delay, and completion delay. On the other hand, cool
colors were used to represent the safe and stable on-going status of activities.
Color scheme selection was performed on a calibrated monitor (Dell E248WFPb), which is calibrated by
Datacolor Spyder 3 Pro. We adopted the method reported by McDonald (1999), which is one of the more
practical ways of selecting harmonious color schemes. Since users often watch 4D models for a long time, we
adopted harmonious color, schemes which were less strenuous on the users’ eyes. This method indicated that we
could first select a basic color according to the number of statuses in the 2D hue circle then, following the
specific relationships to select other colors, create a set of basic hue colors. For example, if we want to select a
two-hue color scheme for management, we needed two basic colors to represent the on-going group and the
delay-group. In this case, we use red to represent the delay-group. Since we needed two basic colors, we chose a
dyad-complementary relationship between the colors, with green as our complimentary color. In addition, we
varied the colors in lightness and colorfulness to create sequential color schemes, making the color schemes
more diverse.
We avoided using warm colors in the plan because the construction statuses do not need as much awareness
management. Sequential color schemes had been used to explain the start-to-finish relationships between
construction statuses. Some 4D models have three kinds of completion statuses, which allow engineers to learn
more details of the construction status to arrange resources. These three completion statuses can be both regarded
as independent data and sequential data of each other. Therefore, combinations of sequential, independent, and
diverging data were created.
On the other hand, project management requires delay statuses to be emphasized. For this purpose, warm or
aware colors are used to represent the delayed statuses. These colors include red, yellow, and orange. The
research reported that viewers seemed to be attracted by vivid colors. The completion status is an important part
of project control especially the communication of the completion of activities to managers. As a result, the
completion status may be independent. Therefore, these three types of data were identified for management.
ITcon Vol. 18 (2013), Chen, pg. 8
4. COLOR EVALUATION
To evaluate the color schemes obtained from color selection, we simulated the effects of color schemes
displayed in color evaluation. We provided three types of simulators for the evaluation to help engineers
examine whether the color schemes are distinguishable under different situations. The three types of simulators
we developed in this research were the rendering simulator, the display simulator, and the viewer simulator. In
the following sections, we will introduce the details of each simulator.
4.1 The rendering simulator
The rendering simulator was used to examine the usability of color schemes with different rendering algorithms
in 3D viewers. Three-dimensional visualizations were used, each having different constraints from
two-dimensional visualization. Specifically, viewers use shading to identify 3D shapes of a representational
object. Shading the calculated shape by rendering algorithms may cause color distortions in visualizations. This
effect may strongly influence the color schemes of individual elements. Different 3D viewers were considered to
solve this problem. However, the rendering algorithms varied in different 3D viewers, causing the shading of
color schemes to be unpredictable.
Two well-known and common 3D viewers were considered in this research, Bentley Intergraph SmartPlant
Review and Autodesk NavisWorks. The main reason we chose these two programs is that Bentley and Autodesk
are two major solution providers in the current industry. Many ongoing projects use these tools to visualize the
construction processes. The other reason is that their rendering algorithms have a noticeable difference. We
believe choosing them can represent most users’ experiences of using 4D models.
The color schemes selected in our color selection were pasted into this simulator and applied in the 3D viewers.
As shown in Figure 3, even a color scheme with the same color values render differently in SmartPlant Review
and in NavisWorks. The results simulated by the rendering simulator in NavisWorks were more vivid than the
colors in SmartPlant Review. This is especially apparent for the color red. This effect may influence the
distinctiveness of color schemes.
(a) (b)
FIG 3. The color scheme implemented in different applications: (a) SmartPlant Review; (b) NavisWorks
4.2 The display simulator
The display simulator can simulate the influence of display media. In using 4D models as a means of
communication, we may use different display media to present to the user, such as a LCD monitor, projector and
color printouts. However, the display capacity of each device is different, causing color inconsistency. The lights
of the display environment also influence the presentation of colors and the interpretation of 4D models. By
using the display simulator, we examined the color schemes and realized the trend of color distortion with
different display media and two kinds of environment: lights-on and lights-off.
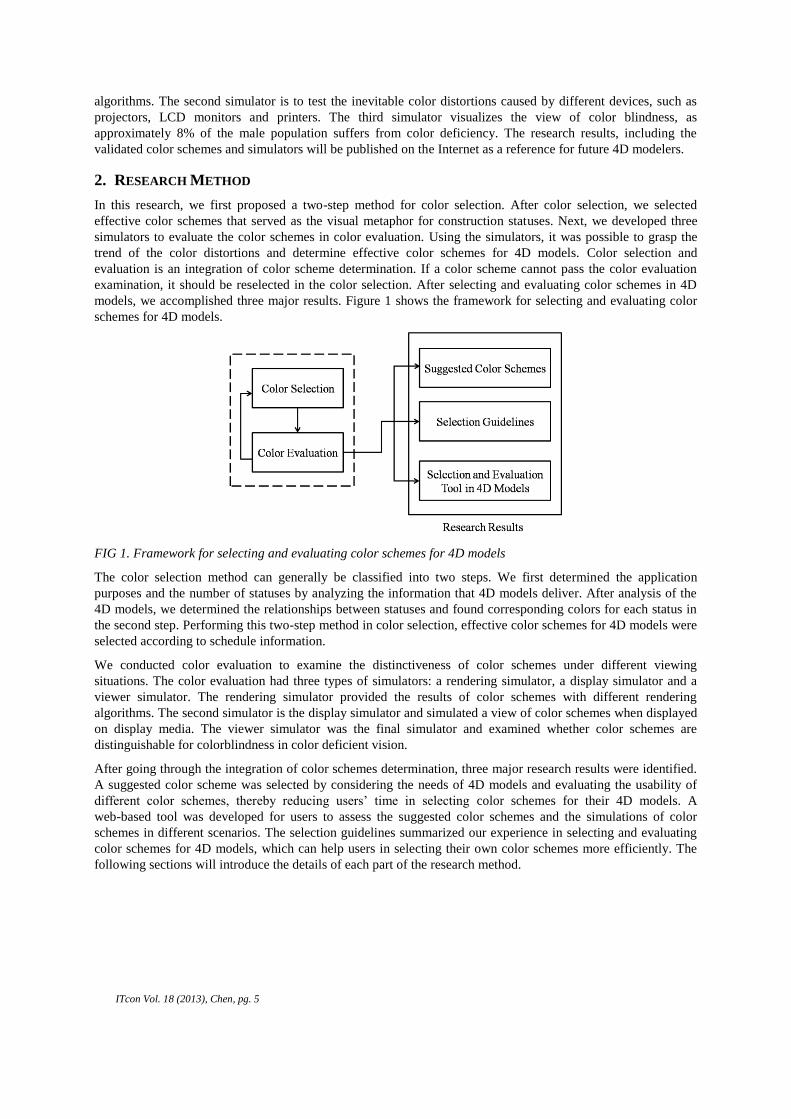
To simulate the effect of the influence of display media, we used ICC profiles to retrieve the color information of
various display media. The process of creating an ICC profile is shown in Figure 4. Computers first output a set
of original color values to display media, allowing the display media to display the colors, called output targets.
When the display media then reproduced the original color values with the limitation of their color gamut, the
original color values may distort. A colorimeter is an instrument used for measuring light. We measured the
color values of output targets with a colorimeter and compared the original color value by calculating variations
ITcon Vol. 18 (2013), Chen, pg. 9
between the two data. After calculating the variations, the color information of the device was estimated and an
ICC profile was created by recording the colorimeter’s measurements.
FIG 4. Process of creating an ICC profile
Monitors, projectors and printers are the more common forms of display media for presentations, and were thus
considered in this research. Before simulating the effects of display media, we tested the color gamut of each
display media. The devices we tested are listed in Table 1. The color gamut of each display media was
significantly different. Comparing the different devices, the slight distortions caused were less significant.
TABLE 1: Tested devices for color gamut
Type of Display Media Display Media Device
LCD monitor Dell E248WFPb ASUS VH232H
Projector Hitachi CP-A100 ViewSonic PJ656 Mitsubishi Electric XD500U-ST
Printer HP ColorLaserJet 3800dn HP ColorLaserJet 2840 PCL6 Epson aculaser C2600
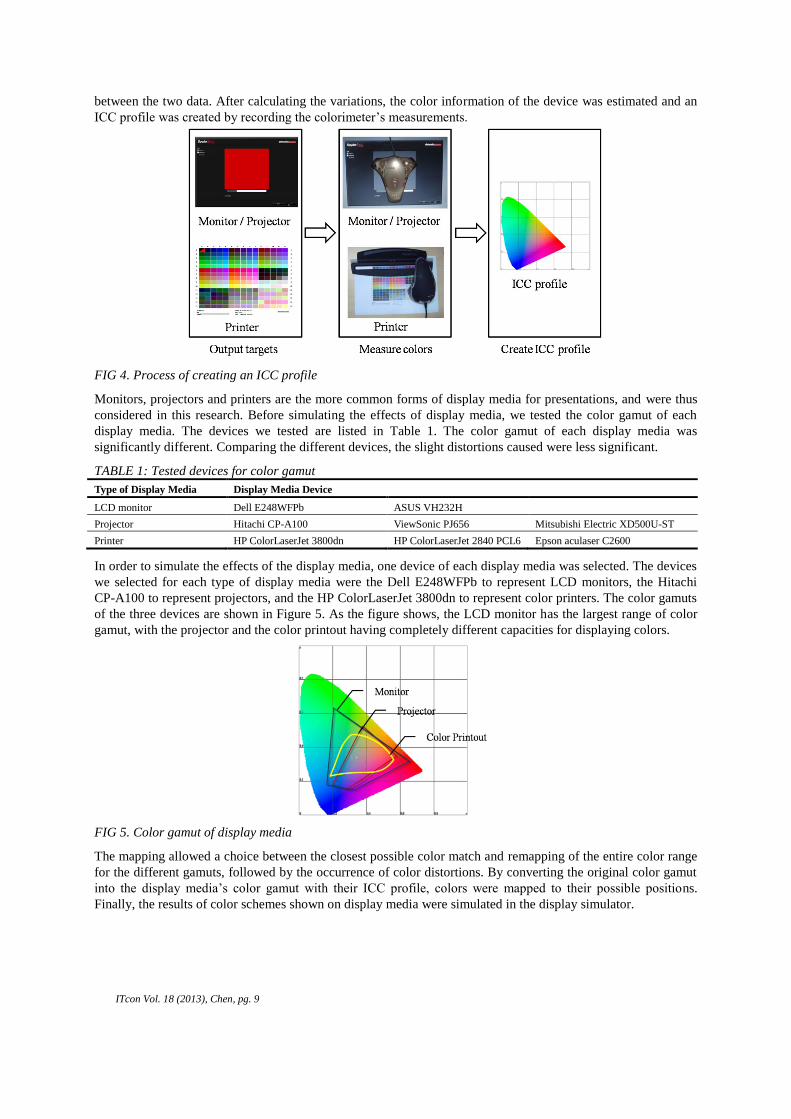
In order to simulate the effects of the display media, one device of each display media was selected. The devices
we selected for each type of display media were the Dell E248WFPb to represent LCD monitors, the Hitachi
CP-A100 to represent projectors, and the HP ColorLaserJet 3800dn to represent color printers. The color gamuts
of the three devices are shown in Figure 5. As the figure shows, the LCD monitor has the largest range of color
gamut, with the projector and the color printout having completely different capacities for displaying colors.
FIG 5. Color gamut of display media
The mapping allowed a choice between the closest possible color match and remapping of the entire color range
for the different gamuts, followed by the occurrence of color distortions. By converting the original color gamut
into the display media’s color gamut with their ICC profile, colors were mapped to their possible positions.
Finally, the results of color schemes shown on display media were simulated in the display simulator.
ITcon Vol. 18 (2013), Chen, pg. 10
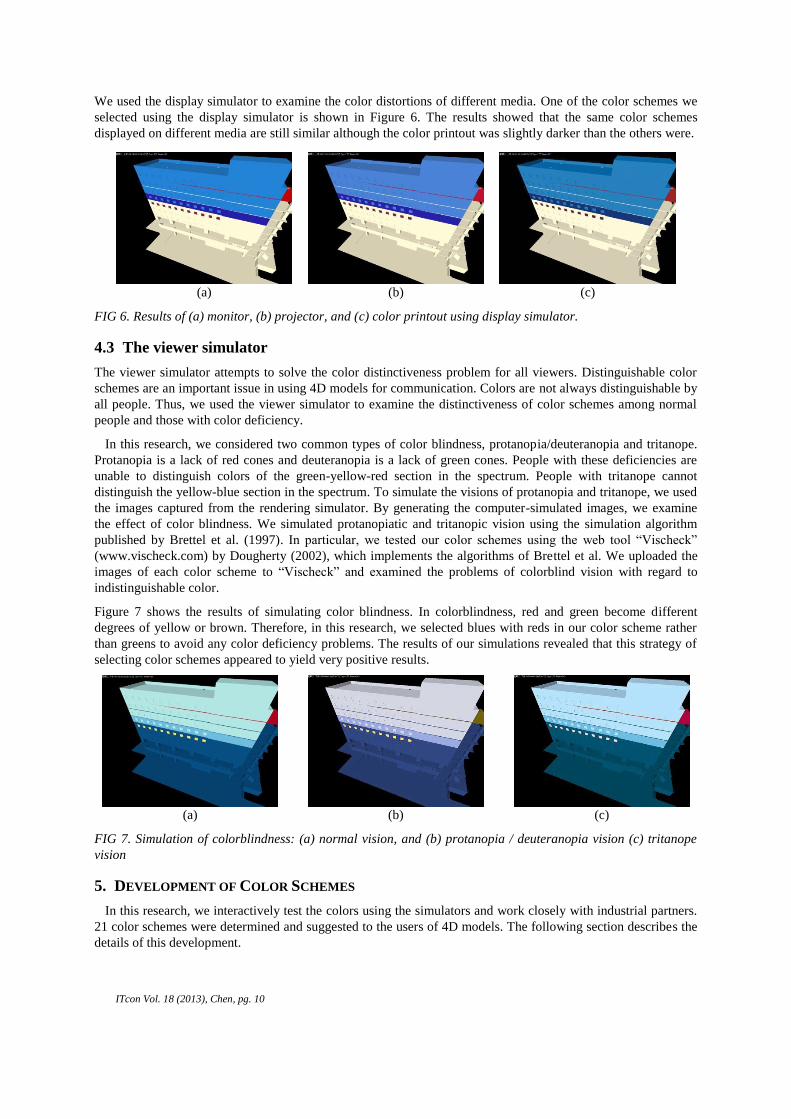
We used the display simulator to examine the color distortions of different media. One of the color schemes we
selected using the display simulator is shown in Figure 6. The results showed that the same color schemes
displayed on different media are still similar although the color printout was slightly darker than the others were.
FIG 6. Results of (a) monitor, (b) projector, and (c) color printout using display simulator.
4.3 The viewer simulator
The viewer simulator attempts to solve the color distinctiveness problem for all viewers. Distinguishable color
schemes are an important issue in using 4D models for communication. Colors are not always distinguishable by
all people. Thus, we used the viewer simulator to examine the distinctiveness of color schemes among normal
people and those with color deficiency.
In this research, we considered two common types of color blindness, protanopia/deuteranopia and tritanope.
Protanopia is a lack of red cones and deuteranopia is a lack of green cones. People with these deficiencies are
unable to distinguish colors of the green-yellow-red section in the spectrum. People with tritanope cannot
distinguish the yellow-blue section in the spectrum. To simulate the visions of protanopia and tritanope, we used
the images captured from the rendering simulator. By generating the computer-simulated images, we examine
the effect of color blindness. We simulated protanopiatic and tritanopic vision using the simulation algorithm
published by Brettel et al. (1997). In particular, we tested our color schemes using the web tool “Vischeck”
(www.vischeck.com) by Dougherty (2002), which implements the algorithms of Brettel et al. We uploaded the
images of each color scheme to “Vischeck” and examined the problems of colorblind vision with regard to
indistinguishable color.
Figure 7 shows the results of simulating color blindness. In colorblindness, red and green become different
degrees of yellow or brown. Therefore, in this research, we selected blues with reds in our color scheme rather
than greens to avoid any color deficiency problems. The results of our simulations revealed that this strategy of
selecting color schemes appeared to yield very positive results.
(a) (b) (c)
FIG 7. Simulation of colorblindness: (a) normal vision, and (b) protanopia / deuteranopia vision (c) tritanope
vision
5. DEVELOPMENT OF COLOR SCHEMES
In this research, we interactively test the colors using the simulators and work closely with industrial partners.
21 color schemes were determined and suggested to the users of 4D models. The following section describes the
details of this development.
(a) (b) (c)
ITcon Vol. 18 (2013), Chen, pg. 11
5.1 Search for the ideal color schemes
After we determined the schemes of colors in section 3 and developed the simulators for examining colors in
section 4, we then started to investigate the ideal color schemes for 4D models. This is the most time-consuming
work in this research. We started randomly selecting the combinations of the colors and tested them in the
simulators. We then gradually found some implicit rules behind the selection processes. In this section, we
organized the basic procedure of selecting colors, and the following sections will describe involving industrial
participants in the decision-making circle to ensure the color is appropriate in practice. We will then describe the
guidelines organized from our experiences.
First, we selected a color scheme with a different hue. For example, we selected green, blue, and yellow
sequential colors to represent color schemes A, B and C. In order to select colors to represent diverging data, we
adopted the dyad-complementary relationship and selected two basic hues. Next, we selected sequential colors
based on their basic hues. If the data was sequential-independent data used to emphasize completion status, we
then adopted a triad-primary relationship and selected three basic hues.
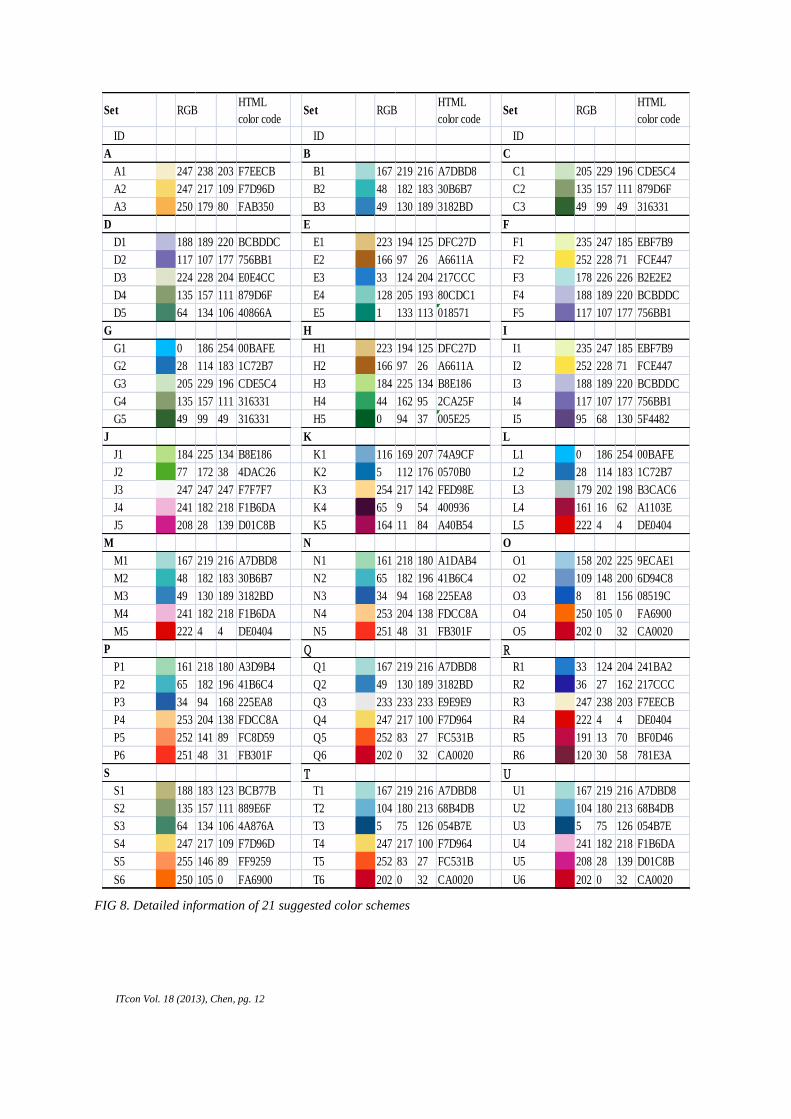
Finally, 21 suggested color schemes were selected, as shown in Table 2. We also listed the details of the 21
suggested color schemes in Figure 8. Users can use this information to apply the color schemes easily in their 3D
viewers.
Table 2. 21 suggested color schemes for 4D models
Application purpose No. of statuses Construction statuses Color set
Planning 3 Pre-construction A, B, C
Under-construction
Completion
5 Pre-construction D, E, F
Under-construction
Completion
Just-completed
Completion before schedule
5 Pre-construction G, H, I
Under-construction
Completion (Emphasize)
Just-completed
Completion before schedule
Management 5 Pre-construction J, K, L
Under-construction
Completion
Pre-construction delay
Completion delay
5 Pre-construction M, N, O
Under-construction
Completion (Emphasize)
Pre-construction delay
Under-construction delay
6 Pre-construction P, Q, R
Under-construction
Completion
Pre-construction delay
Under-construction delay
Completion delay
ITcon Vol. 18 (2013), Chen, pg. 12
Set RGBHTML
color codeSet RGB
HTML
color codeSet RGB
HTML
color code
ID ID ID
A B C
A1 247 238 203 F7EECB B1 167 219 216 A7DBD8 C1 205 229 196 CDE5C4
A2 247 217 109 F7D96D B2 48 182 183 30B6B7 C2 135 157 111 879D6F
A3 250 179 80 FAB350 B3 49 130 189 3182BD C3 49 99 49 316331
D E F
D1 188 189 220 BCBDDC E1 223 194 125 DFC27D F1 235 247 185 EBF7B9
D2 117 107 177 756BB1 E2 166 97 26 A6611A F2 252 228 71 FCE447
D3 224 228 204 E0E4CC E3 33 124 204 217CCC F3 178 226 226 B2E2E2
D4 135 157 111 879D6F E4 128 205 193 80CDC1 F4 188 189 220 BCBDDC
D5 64 134 106 40866A E5 1 133 113 018571 F5 117 107 177 756BB1
G H I
G1 0 186 254 00BAFE H1 223 194 125 DFC27D I1 235 247 185 EBF7B9
G2 28 114 183 1C72B7 H2 166 97 26 A6611A I2 252 228 71 FCE447
G3 205 229 196 CDE5C4 H3 184 225 134 B8E186 I3 188 189 220 BCBDDC
G4 135 157 111 316331 H4 44 162 95 2CA25F I4 117 107 177 756BB1
G5 49 99 49 316331 H5 0 94 37 005E25 I5 95 68 130 5F4482
J K L
J1 184 225 134 B8E186 K1 116 169 207 74A9CF L1 0 186 254 00BAFE
J2 77 172 38 4DAC26 K2 5 112 176 0570B0 L2 28 114 183 1C72B7
J3 247 247 247 F7F7F7 K3 254 217 142 FED98E L3 179 202 198 B3CAC6
J4 241 182 218 F1B6DA K4 65 9 54 400936 L4 161 16 62 A1103E
J5 208 28 139 D01C8B K5 164 11 84 A40B54 L5 222 4 4 DE0404
M N O
M1 167 219 216 A7DBD8 N1 161 218 180 A1DAB4 O1 158 202 225 9ECAE1
M2 48 182 183 30B6B7 N2 65 182 196 41B6C4 O2 109 148 200 6D94C8
M3 49 130 189 3182BD N3 34 94 168 225EA8 O3 8 81 156 08519C
M4 241 182 218 F1B6DA N4 253 204 138 FDCC8A O4 250 105 0 FA6900
M5 222 4 4 DE0404 N5 251 48 31 FB301F O5 202 0 32 CA0020
P Q R
P1 161 218 180 A3D9B4 Q1 167 219 216 A7DBD8 R1 33 124 204 241BA2
P2 65 182 196 41B6C4 Q2 49 130 189 3182BD R2 36 27 162 217CCC
P3 34 94 168 225EA8 Q3 233 233 233 E9E9E9 R3 247 238 203 F7EECB
P4 253 204 138 FDCC8A Q4 247 217 100 F7D964 R4 222 4 4 DE0404
P5 252 141 89 FC8D59 Q5 252 83 27 FC531B R5 191 13 70 BF0D46
P6 251 48 31 FB301F Q6 202 0 32 CA0020 R6 120 30 58 781E3A
S T U
S1 188 183 123 BCB77B T1 167 219 216 A7DBD8 U1 167 219 216 A7DBD8
S2 135 157 111 889E6F T2 104 180 213 68B4DB U2 104 180 213 68B4DB
S3 64 134 106 4A876A T3 5 75 126 054B7E U3 5 75 126 054B7E
S4 247 217 109 F7D96D T4 247 217 100 F7D964 U4 241 182 218 F1B6DA
S5 255 146 89 FF9259 T5 252 83 27 FC531B U5 208 28 139 D01C8B
S6 250 105 0 FA6900 T6 202 0 32 CA0020 U6 202 0 32 CA0020
FIG 8. Detailed information of 21 suggested color schemes
ITcon Vol. 18 (2013), Chen, pg. 13
5.2 Participation of industrial partners
During the research, we iteratively consulted with the industrial partners to ensure the usability of the proposed
color scheme. To be more specific, we held two official meetings to gather participants with multiple
backgrounds from the industry. All the practitioners work in design-build companies. Their main projects
contain planning processes, designing models and construction management in each stage of the life cycle of the
project. All practitioners have 5 years modeling experience.
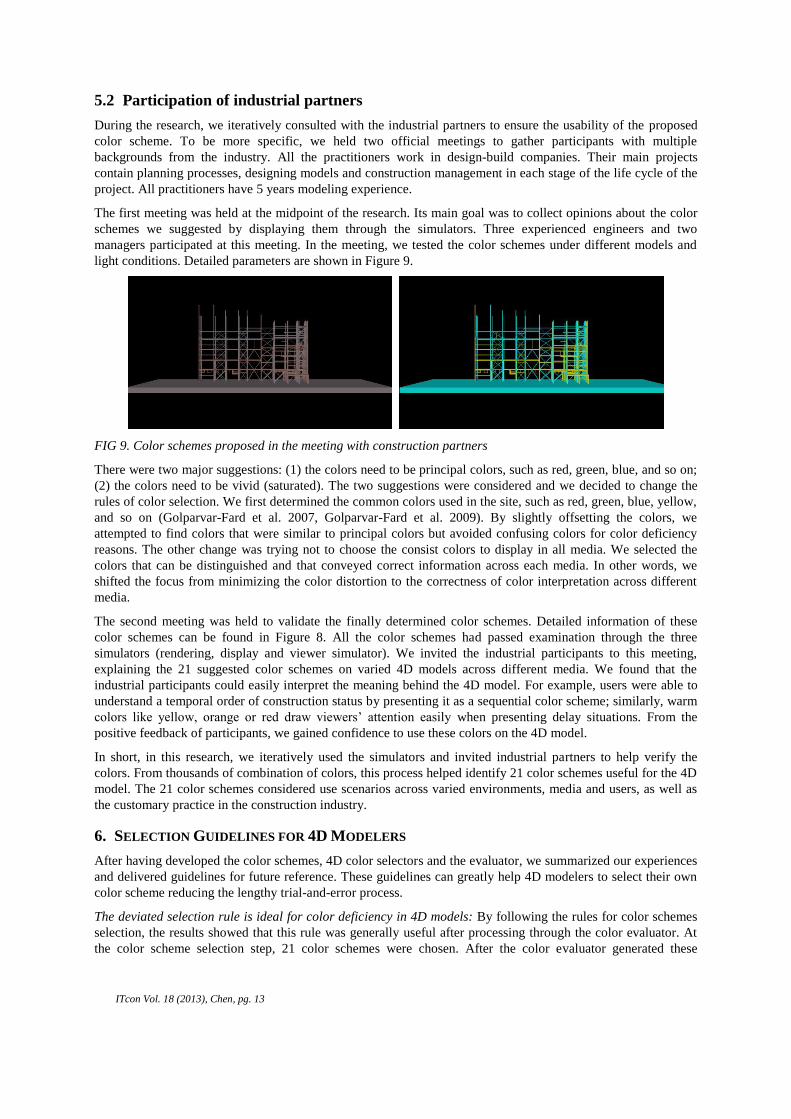
The first meeting was held at the midpoint of the research. Its main goal was to collect opinions about the color
schemes we suggested by displaying them through the simulators. Three experienced engineers and two
managers participated at this meeting. In the meeting, we tested the color schemes under different models and
light conditions. Detailed parameters are shown in Figure 9.
FIG 9. Color schemes proposed in the meeting with construction partners
There were two major suggestions: (1) the colors need to be principal colors, such as red, green, blue, and so on;
(2) the colors need to be vivid (saturated). The two suggestions were considered and we decided to change the
rules of color selection. We first determined the common colors used in the site, such as red, green, blue, yellow,
and so on (Golparvar-Fard et al. 2007, Golparvar-Fard et al. 2009). By slightly offsetting the colors, we
attempted to find colors that were similar to principal colors but avoided confusing colors for color deficiency
reasons. The other change was trying not to choose the consist colors to display in all media. We selected the
colors that can be distinguished and that conveyed correct information across each media. In other words, we
shifted the focus from minimizing the color distortion to the correctness of color interpretation across different
media.
The second meeting was held to validate the finally determined color schemes. Detailed information of these
color schemes can be found in Figure 8. All the color schemes had passed examination through the three
simulators (rendering, display and viewer simulator). We invited the industrial participants to this meeting,
explaining the 21 suggested color schemes on varied 4D models across different media. We found that the
industrial participants could easily interpret the meaning behind the 4D model. For example, users were able to
understand a temporal order of construction status by presenting it as a sequential color scheme; similarly, warm
colors like yellow, orange or red draw viewers’ attention easily when presenting delay situations. From the
positive feedback of participants, we gained confidence to use these colors on the 4D model.
In short, in this research, we iteratively used the simulators and invited industrial partners to help verify the
colors. From thousands of combination of colors, this process helped identify 21 color schemes useful for the 4D
model. The 21 color schemes considered use scenarios across varied environments, media and users, as well as
the customary practice in the construction industry.
6. SELECTION GUIDELINES FOR 4D MODELERS
After having developed the color schemes, 4D color selectors and the evaluator, we summarized our experiences
and delivered guidelines for future reference. These guidelines can greatly help 4D modelers to select their own
color scheme reducing the lengthy trial-and-error process.
The deviated selection rule is ideal for color deficiency in 4D models: By following the rules for color schemes
selection, the results showed that this rule was generally useful after processing through the color evaluator. At
the color scheme selection step, 21 color schemes were chosen. After the color evaluator generated these
ITcon Vol. 18 (2013), Chen, pg. 14
schemes, we found 21 of these color schemes were still distinguishable; the other four colors schemes were
either unsuitable for distinguishing or unsuitable for the colorblind.
Blue-red and yellow-purple combinations work well on display media and for colorblindness: The results of the
simulations (display media and colorblindness) showed that the combinations of blue-red and yellow-purple
color schemes have little color distortion and remain significantly distinguishable in the 4D model.
A yellow-orange-red color scheme is effective for representing delay statuses: From our experience of selecting
color schemes, we found difficulty in selecting sequential colors for red, which are used to represent delay
statuses. Therefore, we used a yellow-orange-red color scheme to represent delay statuses. In addition, we found
that this color scheme works well for color deficient vision.
Avoid using green colors in project management: Because we used warm colors to represent the delay status,
green colors should be avoided when representing on-going status to fulfill the needs for colorblind users.
Avoid using green, red, and yellow together: In color deficient vision, these colors may be too similar and
indistinguishable. For example, green and red may look like dark shades of brown, which may be viewed as very
similar to yellow.
Yellows should be avoided as the middle status of construction management: During the process of simulating
colorblindness vision, we found it inappropriate to use yellows in the middle class of independent data to
emphasize the critical or break point, for example, the completion status in the 5 statuses of management. The
reason is that colorblindness easily blends a yellow middle class into the reds creating confusion for the users.
7. SELECTION AND EVALUATION TOOL FOR 4D MODELS
We also developed a tool to facilitate the process of selecting and evaluating the 21 colors schemes we suggested.
This tool is available on a website titled 4D Color Selector and Evaluator (http://4Dcolor.caece.net), showing the
results of 21 suggested color schemes from this research.
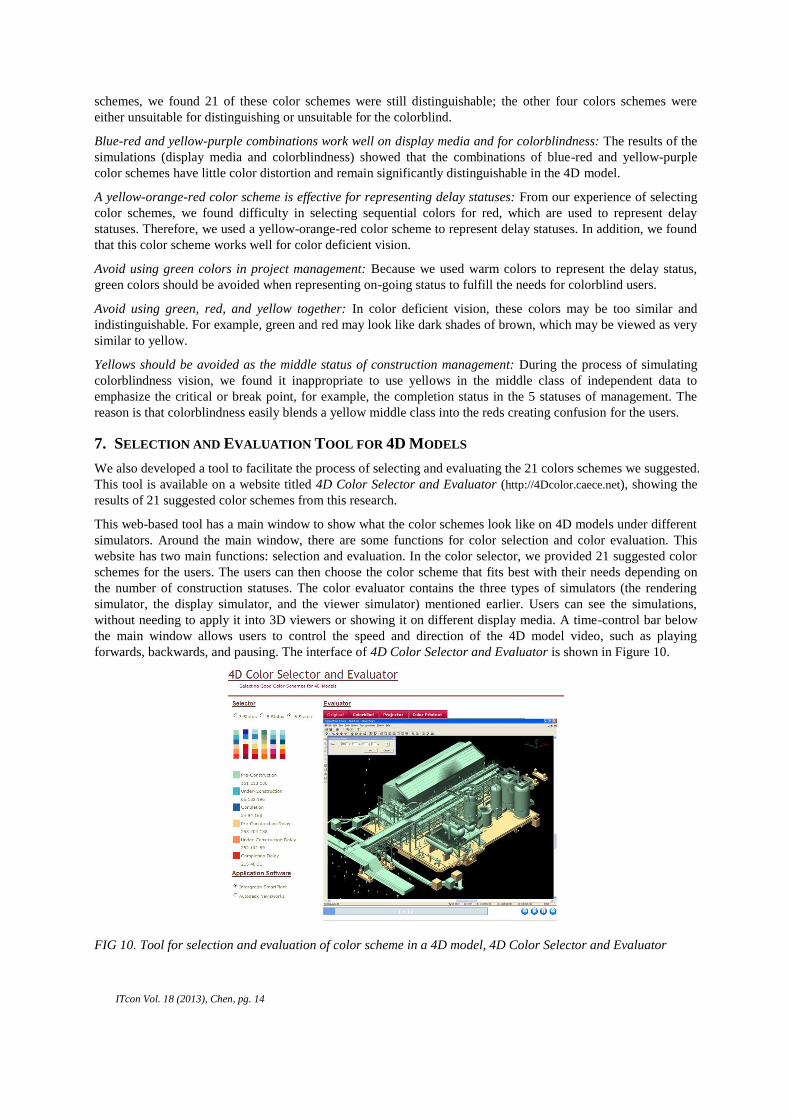
This web-based tool has a main window to show what the color schemes look like on 4D models under different
simulators. Around the main window, there are some functions for color selection and color evaluation. This
website has two main functions: selection and evaluation. In the color selector, we provided 21 suggested color
schemes for the users. The users can then choose the color scheme that fits best with their needs depending on
the number of construction statuses. The color evaluator contains the three types of simulators (the rendering
simulator, the display simulator, and the viewer simulator) mentioned earlier. Users can see the simulations,
without needing to apply it into 3D viewers or showing it on different display media. A time-control bar below
the main window allows users to control the speed and direction of the 4D model video, such as playing
forwards, backwards, and pausing. The interface of 4D Color Selector and Evaluator is shown in Figure 10.
FIG 10. Tool for selection and evaluation of color scheme in a 4D model, 4D Color Selector and Evaluator
ITcon Vol. 18 (2013), Chen, pg. 15
The function of the color selector allows users to select a color scheme depending on the number of construction
statuses. The tool provides three different amounts of statuses: 3 statuses, 5 statuses and 6 statuses. Users can
choose the one that will fulfill their needs best by clicking on the corresponding radio buttons. After clicking the
radio button, the color selector will show some suggested color schemes below it. The suggested color schemes
are selected by considering the application purposes and the relationships between construction statuses. When
users click on a color scheme, the color selector then shows the details of the color scheme. The details include
the explanations and the RGB value of each color. The user interface of the color selector is shown in Figure 11.
By providing RGB values, users can conveniently apply the color scheme in their application software. When
users change their options, the user interface also changes.
(a) (b) (c)
FIG 11. User interface of color selector
The main window shows how the color scheme looks in the application. The 4D models show the sequential
change of colors. To achieve this, 12 images were captured from different time points in the 4D models in the
application software. The website provides two common applications: Intergraph SmartPlant Review and
Autodesk NavisWorks. Image-based 4D models were combined by using those sequential images, thereby
reducing the loading of 4D models.
The evaluator in the web-based tool allows users to visualize their color schemes under different conditions. This
tool provides the results simulated by the three types of simulators. The three basic types of display media are
simulated by the display simulator. Above the main window are the simulations under different situations. The
simulations include: original, projector, color printout, protanopic blindness, and deuteranopic blindness.
Creating a 4D simulation often works well with monitors. As a result, images being displayed on a monitor were
regarded as original simulated images. The simulation provided by the color evaluator allows users to understand
the color distortions of different display media thereby helping them in their color scheme decision.
8. DISCUSSION AND CONTRIBUTIONS
8.1 Discussion for color selection
We provided 21 well-tested colors schemes, as well as a selection and evaluation tool, as references for
construction practice. Future 4D modelers and users can choose a color scheme that fits their purposes well and
can test them on the Internet. This reduces tremendous time and effort.
ITcon Vol. 18 (2013), Chen, pg. 16
In this research, we found very different requirements from planners and managers. The planners required fewer
colors. They only needed to show the on-going tasks, completed tasks and future tasks. However, managers need
to handle greater complexity. The colors used range up to six, in order to adequately present the site condition.
They were especially interested in the “problematic” group, such as delay tasks or the tasks to be delayed. In our
research, we used warm colors to represent the problematic group. This helps the manager identify the problem
more easily.
From the process of selecting color, we found that it is tricky to find the sequential red colors. Red cannot be
presented well especially on the projector, as it looks more like brown. Therefore, we consequently combined
orange and yellow to present the different severity of the delay.
We also found that the color blindness simulator is the main constraint when selecting colors. Therefore, we tried
to avoid the non-green hues because it looks similar to red for users with color blindness. We also tried to
implement the deviated selection rule, which deviated from the dyad-complementary relationship in color
selection. As a result, we selected blue-red color schemes instead of green-red color schemes. Using this method,
we can increase the possibility of passing the viewer simulator. Using this color scheme, those with protanopia
color blindness can read the colors and interpret the 4D models as normal people do.
8.2 Research Contributions
In this research, the main contributions can be summarized as follows:
We developed 21 suggested color schemes. They are fully tested, avoiding the confusion caused by different
types of displays and rendering algorithms. Difficulties in the interpretation of the colors by those who suffer
from color blindness are also avoided. 4D modelers and users can directly use the colors by referring to Figure 8.
The color schemes convey the “meaning” behind the 4D models. Since 4D models are often used to present the
construction sequence, we include sequential colors in the suggested color scheme. We also selected diverse
colors to distinguish normal tasks from delayed tasks. The implications of colors serve a hint to enhance the
comprehensibility of the model.
A web-tool was developed for use on the Internet. It demonstrates the 21 color schemes on different 4D models.
It also simulates the color distortion due to the displayer, software and even the color deficiency of the viewers.
The colors can be shown on different 4D models. This allows the users to fully test these colors and decide the
most suitable schemes for their purpose.
This research provides a scientific approach for selecting the colors for 4D models. We do not treat the selection
of colors as personal preferences or an act of art. Instead, we carefully selected the colors to ensure that their
interpretation can be correct and require less mental effort. Because of the rapid development of BIM, the 4D
simulations can become more popular. The color schemes can be widely applied and eventually provide benefits
to the industry.
Compared with Chang et al. (2009), which presents the latest research for colors of 4D/BIM models, this
research is much closer to the practical requirements. Although SEUT can also identify color schemes, it is far
from being applied in actual sites. By using simulators and suggested color schemes, this research has solved the
problem by reducing as much as 90% of time required by the SEUT method.
9. CONCLUSION
The major contribution of this research is the reduction in time and effort in determining appropriate color
schemes of 4D models. To achieve this, we developed three simulators: (1) a rendering simulator to simulate the
rendering results from different software, (2) a display simulator to simulate the 4D models displayed on
projectors, LCD monitors and printouts, and (3) a viewer simulator to simulate the vision of color blindness. We
used these simulators to evaluate a large number of color schemes and finally define 21 color sets suitable for 4D
models. Three of them can be applied in 4D models with 3 construction statuses. They could be used to present
future tasks, ongoing tasks and completed tasks, respectively. Twelve of them can be applied in 4D models with
5 construction statuses. Six of them can be applied in 4D models with 6 construction statuses. We summarized
our experience of defining the color schemes and developed them as a guideline for the users who would like to
customize their own colors. We finally created a web-based tool to allow engineers to view 4D models by
ITcon Vol. 18 (2013), Chen, pg. 17
assigning different color schemes and simulation scenarios. This can help users efficiently evaluate and select
appropriate colors for 4D models.
10. REFERENCES
Adobe. (2008). Adobe Kuler. Available: http://kuler.adobe.com/ (May 15, 2010)
Ahlstrom, U. & Arend, L. (2005). “Color usability on air traffic control displays,” in The HFES 49th Annual
Meeting, Orlando, FL, September 26-30.
Akinci, B. (2002). “Automated Generation of Work Spaces Required by Construction Activities,” Journal of
Construction Engineering and Management, 128(4), 306-315.
Akinci, B., Fischen, M., Levitt, R. & Carlson, R. (2002). “Formalization and Automation of Time-Space Conflict
Analysis,” Journal of Computing in Civil Engineering, 16(2), 124-134.
Benjaoran, V. & Bhokha, S. (2009). “Enhancing visualization of 4D CAD model compared to conventional
methods,” Engineering, Construction and Architectural Management, 16(4), 392-408.
Bosche, F. & Haas, C. T. (2008). “Automated retrieval of 3D CAD model objects in construction range images,”
Automation in Construction, 17(4), 499-512.
Brettel, H., Vienot, F. & Mollon, J. D. (1997). “Computerized simulation of color appearance for dichromats,”
Journal of the Optical Society of America a-Optics Image Science and Vision, 14(10), 2647-2655.
Chang, H. S., Kang, S. C. & Chen, P. H. (2009). “Systematic Procedure of Determining an Ideal Color Scheme on
4D Models,” Advanced Engineering Informatics, 23(4), 463-473.
Chang, Y. C., Hung, W. H. & Kang, S. C. (2012). “A fast path planning method for single and dual crane
erections,” Automation in Construction, 22, 468-480.
Chau, K. W., Anson, M. & Zhang, J. P. (2004). “Four-Dimensional Visualization of Construction Scheduling and
Site Utilization,” Journal of Construction Engineering and Management, 130(4), 598-606.
Chen, C. M. (2005). “Top 10 unsolved information visualization problems,” IEEE Computer Graphics and
Applications, 25(4), 12-16.
Cohen-Or, D., Sorkine, O., Gal, R., Leyvand, T. & Xu, Y.-Q. (2006). “Color harmonization,” in SIGGRAPH 2006,
Boston, USA, July 30- August 3.
Cui, H., Jiang, N., Bai, X. & Hu, Y. (2008). “Color design scheme of map for color vision impaired,” in The 2008
International Conference on Computer Science and Software Engineering, Wuhan, China,
December 12-14.
Dawood, N. & Mallasi, Z. (2006). “Construction Workspace Planning: Assignment and Analysis Utilizing 4D
Visualization Technologies,” Computer-Aided Civil and Infrastructure Engineering, 21(7),
498-513.
Dawood, N. & Sikka, S. (2008). “Measuring the Effectiveness of 4D Planning as a Valuable Communication
Tool,” Journal of Information Technology in Construction, 13, 630-636.
Dawood, N., Scott, D., Sriprasert, E. & Mallasi, Z. (2005). “The Virtual Vonstruction site (VIRCON) Tools: An
Industrial Evaluation,” Journal of Information Technology in Construction, 10, 43-54.
Dawood, N., Sriprasert, E., Mallasi, Z. & Hobbs, B. (2002). “4D visualization development: real life case studies,”
in CIB W78 Conference on Distributin Knowledge in Building, Arhus, Denmark, June 12-14.
Dougherty, R. & Wade, A. (2002). Vischeck. Available: http://www.vischeck.com/ (June 1, 2009)
Fairchild, M. D., (2005). Color Appearance Models. (2nd ed.). Hoboken, NJ, USA: John Wiley & Sons, Ltd.
Fitzhugh, E., Dixon, S., Aleva, D., Smith, E., Ghrayeb, J. & Douglas, L. (2009). “Toward the establishment of
design guidelines for effective 3D perspective interfaces,” in SPIE, Orlando, FL, USA, April 17.
ITcon Vol. 18 (2013), Chen, pg. 18
Forsyth, D. A. & Ponce, J., (2002). Computer vision: a modern approach. Canada: Prentice Hall Professional
Technical Reference.
Gao, Z., Walters, R. C., Jaselskis, E. J. & Wipf, T. J. (2006). “Approaches to improving the quality of construction
drawings from owner's perspective,” Journal of Construction Engineering and Management,
132(11), 1187-1192.
Golparvar-Fard, M., Pena-Mora, F., Arboleda, C. A. & Lee, S. (2009). “Visualization of Construction Progress
Monitoring with 4D Simulation Model Overlaid on Time-Lapsed Photographs,” Journal of
Computing in Civil Engineering, 23(6), 391-404.
Golparvar-Fard, M., Peña-Mora, F. & Savarese, S. (2011). "Integrated sequential as-built and as-planned
representation with tools in support of decision-making tasks in the AEC/FM industry," Journal of
Construction Engineering and Management. 137(12), 1099-1116.
Golparvar-Fard, M., Sridharan, A., Lee, S. & Pena-Mora, F. (2007). “Visual representation of construction
progress monitoring metrics on time-lapse photographs,” in Construction Management and
Economics Conference, Reading, UK, July 15-18.
GSA. (2007). GSA BIM Guide Series 04: BIM Guild For 4D Phasing. Available: http://www.gsa.gov/bim (May
25, 2009)
Hallberg, D. & Tarandi, V. (2011). "On the use of open bim and 4d visualisation in a predictive life cycle
management system for construction works," Journal of Information Technology in Construction.
16, 445-466.
Harrower, M. & Brewer, C. A. (2003). “ColorBrewer.org: An online tool for delecting colour dchemes for maps,”
Cartographic Journal, 40(1), 27-37.
Jenny, B. (2007). “Color design for the color vision impaired,” Cartographic Perspectives, 58, 61-67.
Kam, C., Fischer, M., Hänninen, R., Karjalainen, A. & J., L. (2003). “The Product Model and Fourth Dimension
Project,” Journal of Information Technology in Construction, 8, 137-166.Kim, C., Kim, H., Park, T.
& Kim, M. K. (2011). "Applicability of 4D CAD in civil engineering construction: Case study of a
cable-stayed bridge project," Journal of Computing in Civil Engineering. 25(1), 98-107.
Koo, B. & Fischer, M. (2000). “Feasibility Study of 4D CAD in Commercial Construction,” Journal of
Construction Engineering and Management, 126(4), 251-260.
Kubota, S. & Mikami, I. (2011). "Data model-centered four-dimensional information management system for road
maintenance," Journal of Computing in Civil Engineering, Posted online on 29 Oct 2011.
Kuo, C. H., Tsai, M. H., & Kang, S. C. (2011). “A Framework of Information Visualization for Multi-System
Construction,” Automation in Construction, 20(3), 247-262.
Lee, W. Y. (2008). “Assessing the affective feelings of two-and three-dimensional objects,” Color Research &
Application, 34(1), 75.
Liao, Y. F., Hsieh, S. H., Kang, S. C., Chen, C. S., Yang, C. T., Chi, H. L., Chi, W. C. & Yu, C. H. (2007).
“Development and Application of 4D Construction Simulation Tools,” in The 4th International
Civil Engineering Conference (CECAR4), Taipei, Taiwan, June 25-28.
Light, A. & Bartlein, P. J. (2004). “The end of the rainbow? color schemes for improved data graphics,” EOS
Transactions of the American Geophysical Union, 85(40), 385-391.
Macdonald, L. W. (1990). “Using colour effectively in displays for computer-human interface,” Displays, 11(3),
129-142.
MacDonald, L. W. (1999). “Using color effectively in computer graphics,” IEEE Computer Graphics and
Applications, 19(4), 20-35.
Madden, T. J., Hewett, K. & Roth, M. S. (2000). “Managing images in different cultures: A cross-national study of
color meanings and preferences,” Journal of International Marketing, 8(4), 90-107.
ITcon Vol. 18 (2013), Chen, pg. 19
McKinney, K. & Fischer, M. (1998). “Generating, Evaluating and Visualizing Construction Schedules with CAD
Tools,” Automation in Construction, 7(6), 433-447
Morgan, M. R. P. (1995). “Color me blue...or red or green? Lessons from the literature on color and usability,” in
IPCC 95, Savannah, GA, September 27-29.
Ou, L. C., Luo, M. R., Woodcock, A. & Wright, A. (2004). “A study of colour emotion and colour preference. Part
III: Colour preference Modeling,” Color Research and Application, 29(5), 381-389.
Ou, L. C., Luo, M. R., Woodcock, A. & Wright, A. (2004). “A study of colour emotion and colour preference. part
II: Colour emotions for two-colour combinations,” Color Research and Application, 29(4),
292-298.
Ou, L. C., Luo, M. R., Woodcock, A. & Wright, A. (2004). “A study of colour emotion and colour preference. Part
I: Colour emotions for single colours,” Color Research and Application, 29(3), 232-240.
Plaisant, C., (2005). Information visualization and the challenges of universal usability. Amsterdam: Exploring
Geovisualization, Elsevier.
Puhalla, D. M. (2008). “Perceiving hierarchy through intrinsic color structure,” Visual Communication, 7(2),
199-228.
Rheingans, P. (2000). “Task-based color scale design,” in Applied Image and Pattern Recognition, Washington,
DC, USA, October 16-18.
Roh, S., Aziz, Z. & Pena-Mora, F. (2011). “An object-based 3D walk-through model for interior construction
progress monitoring,” Automation in Construction, 20(1), 66-75.
Songer, A. & Heys, B. (2003). “A framework for multi-dimensional visualization of project control data,” in
Construction Research Congress, Reston, Virginia, March 19-21.
Tabesh, A. R. & Staub-French, S. (2006). “Modeling and coordinating building systems in three dimensions: a
case study,” Canadian Journal of Civil Engineering, 33(12), 1490-1504.
Tanaka, G., Suetake, N. & Uchino, E. (2010). “Lightness modification of color image for protanopia and
deuteranopia,” Optical Review, 17(1), 14-23.
Tokumaru, M., Muranaka, N. & Imanishi, S. (2002). “Color design support system considering color harmony,” in
The 2002 IEEE International Conference, Honolulu, HI , USA, May 2.
Tsai, M.-H., Kang, S.-C. & Hsieh, S.-H. (2010). “A three-stage framework for introducing a 4D tool in large
consulting firms,” Advanced Engineering Informatics, 24(4), 476-489.
Tsai, M. H., Matin, M. A., Kang, S. C. & Hsieh, S. H. “Workflow Re-engineering of Design-Build Projects using
a 4D Construction Management Tool,” Journal of the Chinese Institute of Engineers, accepted on
June 17, 2012.
Tufte, E. R., (1997). Visual explanations: images and quantities, evidence and narrative. Cheshire, CT, USA:
Graphics Press.
Wang, H. J., Zhang, J. P., Chau, K. W. & Anson, M. (2004). “4D Dynamic Management for Construction Planning
and Resource Utilization,” Automation in Construction, 13(5), 575-589.
Ware, C., (2004). Information visualization: perception for design. (2nd ed.). San Francisco, CA, USA: Morgan
Kaufmann.
Yeh, K. C., Tsai, M. H. & Kang, S. C. (2012). “On-site Building Information Retrieval By Using
Projection-Based Augmented Reality," Journal of Computing in Civil Engineering, 26(3), 342-355.
Zeng, R. & Zeng, H. (2010). “Color schemes for encoding information in digital maps,” in The SPIE, San Jose,
California, USA, January 17.