17
SELECTION FOR TYPE AND MILK PRODUCTION IN DAIRY CATTLE Howard C. Dickey LIFE SCIENCES AND AGRICULTURE EXPERIMENT STATION UNIVERSITY OF MAINE AT ORONO TECHNICAL BULLETIN 72 JUNE 1974
SELECTION FOR TYPE AND MILK PRODUCTION IN DAIRY CATTLE
Howard C. Dickey
LIFE SCIENCES AND AGRICULTURE EXPERIMENT STATION
UNIVERSITY OF MAINE AT ORONO
TECHNICAL BULLETIN 72 JUNE 1974

Acknowledgment Research reported herein was supported, in part, by funds made
available through the Hatch Act

Selection for Type and Milk Production
in Dairy Cattle Howard C. Dickey*
Selection is said to be the keystone in the arch of animal breeding and as such gives direction, purpose and strength to the improvement of animal species. To provide meaningful improvement, selection must be accurate and as intense as possible. Production and type traits in dairy cattle are quantitative, grading from poor through excellent, and are controlled by polygenes. Polygenes have the properties (a) of being additive or cumulative in their effects on each trait, (b) of lacking dominance and recessiveness, and (c) they are affected by the environment in their expression on the traits to which they contribute control.
Accuracy of selection for a trait can be defined as the correlation between the real breeding value of an animal and what it is thought to be by the breeder. This means that accurate records are needed for the traits for which selections are made. Accuracy can vary from —1.0 to + 1.0, depending on how well the breeding value of the animals is estimated. For most production traits, based on one lactation, accuracy of selection is about +0.3, while the average of three lactations will improve accuracy to —0.6 in most cases. Since waiting for a third record before selections are made will increase the years between generations, the improved accuracy is nearly offset by increased generation length. Also, high correlations of >0.9 have been found between partial lactations (5 months) and completed lactations. In view of this observation, many alert dairy cattle breeders are culling breeding cows for low production before the end of the first lactation. This practice decreases generation length. The heritability of partial (5 months) lactations is 0.3 which is the same as that of completed lactations.
MILK PRODUCTION IN DAIRY CATTLE
The judicious use of the Predicted Difference (P.D.) as a basis for the selection of dairy sires has increased accuracy of selection. By reducing environmental bias, when daughters were compared with their herdmates for milk production, accuracy has been increased from an average of 0.25 for an ordinary daughter average to 0.75 for the P.D. of a sire. Use of the P.D. for dairy sire selection and use by dairy cattle
* Professor, Department of Animal and Veterinary Sciences, University of Maine

2 LSA EXPERIMENT STATION TECHNICAL BULLETIN 72
breeders should improve milk production when above average P.D. sires are used.
Since Dairy Herd Improvement Association records of production were first reported in 1906, we have much better information about progress attained for this trait.
Table 1.
Production of purebred dairy cattle and other dairy cattle in U.S.A.
Class of
Cattle
Ayrshire
Brown Swiss
Guernsey
Holstein
Jersey
All USA cows
All DHIA cows
Milk
pounds
8682
10108
8050
11338
6830
4500
7977
1935
Test
% 4.04
4.12
5.03
3.45
5.31
4.10
4.04
Fat
pounds
349
416
405
391
363
185
322
Milk
pounds
11646
12606
10129
14508
9265
9385
12659
1970
Test
% 3.86
3.99
4.60
3.60
4.97
3.65
3.77
Fat
pounds
450
503
466
522
460
343
477
A comparison of the average production of dairy cattle in this country in 1935 and 1970 is presented in Table 1 (1, 2). Increases are shown in average milk and butterfat production during these 35 years, but butterfat test in the milk produced has decreased. Maximum butter-fat tests were recorded for DHIA cows from 1940 through 1943 with an average of 4.07% (2). During the 35-year period, average annual milk production per cow has increased by 140 pounds. This increase can be attributed primarily to improved feeding and management, with selection accounting for not more than 56 pounds of milk annually. During these 35 years our dairy cow numbers have decreased from more than 26 million to less than 12 million head. This has given dairymen a much greater opportunity to select and save the better cows for breeding purposes. Intensity of selection has played a role since intensity is based on the percentage of animals used to produce the next generation as shown in Table 2.
Ordinarily, intensity of selection among cows should average about 0.1 standard deviations, but during the last 25 years the intensity was closer to 0.2 standard deviations. Intensity for cow selection was doubled during this period of shrinkage in total cow numbers. Even though only 20 percent of our cows are production-tested, accuracy has improved, especially on sire provings in A.I. studs.

TYPE AND MILK PRODUCTION IN DAIRY CATTLE 3
Table 2.
Selection differentials attainable with truncation selection when specific fractions of a group of animals are retained for producing the next generation
Fraction Selection Fraction Selection Saved Intensity* Saved Intensity*
(cow culling)
Dams of Bulls
Used in Natural Service
0.90 0.80 0.70 0.60 0.50 0.40 0.30 0.25 0.20 0.15 0.10
0.20 0.35 0.50 0.64 0.80 0.97 1.16 1.27 1.40 1.55 1.76
0.09 0.08 0.07 0.06 0.05 0.04 0.03 0.02 0.01 0.005 0.001
1.80 1.86 1.92 1.99 2.06 2.15 2.27 2.42 2.67 2.89 3.37
Dams of Bulls
Used in A.I.
* Selection intensity in standard deviation units (17).
In order to improve quantitative traits, the breeder should know the following about the traits for which selections are made:
a. Whether his breeding animals are above or below average. b. The amount of variation for the traits. c. The heritability of the traits. d. The genetic correlations between the traits.
Table 3 gives the averages of the yields per lactation for milk and its components among Maine dairy herds (18). Average percentage of fat, SNF, T.S. and protein in the milk of each breed as well as the ratios of SNF /fat and protein/fat are listed in Table 3. From a breeder's point of view the most important values found in Table 3 are the standard deviations for each trait. Breeders can substitute into the following equation to obtain the underlined values in Table 4.
R = i h2 n- P
where R = predicted response in trait X after a generation of selection for X
trait X i =z the intensity of selection for trait X
x h2 — heritability of trait X
P = the phenotypic standard deviation in trait X
For example, using Holstein data, the i for selection among the top 90 X
percent of the cows is 0.20 and for selecting among the top 10 percent of the sires is 1.76. Averaging the values 0.20 and 1.76, we obtain 0.98 or rounding to 1.00 which is the value used for i in Table 4. The heritability : ' " ""-- 0 "° c— *u J"~* * ~:""> fat> SNF> T S - a n d protein.

Table 3.
Averages and standard deviations of the yields of milk and its components, in pounds, and the percentages of milk components for dairy breeds
Trait Ayrsh
Mean
10920
463
967
1430
366
601
4.24
8.86
13.10
3.35
2.09
ire S.D.*
2340
100
210
300
80
165
.30
.50
.60
.30
.20
Brown
Mean
12200
485
1111
1596
410
701
3.98
9.11
13.08
3.36
2.29
Swiss
S.D.*
3130
140
290
420
110
180
.30
.30
.60
.30
.20
Guernsey
Mean S.D.*
9560
478
874
1352
330
535
5.00
9.14
14.14
3.55
1.83
2410
120
220
340
90
170
.40
.30
.60
.30
.15
Hoi:
Mean
16430
626
1417
2043
531
886
3.81
8.62
12.43
3.23
2.26
item
S.D.*
3140
130
270
390
100
280
.40
.30
.60
.25
.20
Jen Mean
10470
537
975
1512
385
590
5.13
9.31
14.44
3.68
1.81
iey S.D.*
2490
140
230
370
100
180
.50
.40
.80
.30
.20
on A
EX
PER
T
2
H
TAT
O z T
EC
HN
I CA
L BU
LI ,E
TI
Z -J
Yields
Milk
Fat
SNF
Total solids
Protein
Lactose-Min.
Percentages
% Fat
% SNF
% T.S.
% Protein
Ratios
SNF/FAT
* Standard deviation is used by the animal breeder in estimating genetic response to selection.

TYPE AND MILK PRODUCTION IN DAIRY CATTLE 5
Table 4.
Expected response per generation in yield of milk and its components in pounds as selections are made in the top 909c of the cows and top 10%
of the sires for the yield of one component
Trait selected
for Milk
Response found in the yield of milk its component traits
Fat SNF TS Protein
Ayshires Milk
Milk fat
SNF
TS
Protein
Milk
Milk fat
SNF
TS
Protein
Milk
Milk fat
SNF
TS
Protein
Milk
Milk fat
SNF
TS
Protein
Milk
Milk fat
SNF
TS
Protein
655
511
629
616
583
876
684
841
824
780
675
526
648
634
601
879
685
844
826
782
697
544
669
655
620
22
28
23
25
23
31
39
32
36
33
26
34
27
31
28
28
36
29
33
30
31
39
32
36
33
56
48
59
58
56
Brown Swiss
78
66
81
80
77
Guernsey
59
50
62
60
59
Holstein
73
61
76
74
72
Jersey
62
52
64
63
61
79
76
82
84
80
111
107
115
118
112
89
87
93
95
90
103
99
107
109
104
97
94
102
104
98
20
19
21
21
22
28
27
29
29
21
22
20
24
24
25
25
23
27
27
28_
25
23
27
27
28

6 LSA EXPERIMENT STATION TECHNICAL BULLETIN 72
The o- P for milk in Holsteins is 3140 pounds as found in Table 3. There-X
fore, R = 1 X 0.28 X 3140 = 879 pounds of milk. The remaining
values appearing in Table 4 are determined by using the formula— OR = i h h r A n py
y x x y xy where CR = the correlated response in trait Y when selection pressure has
y been placed on trait X
i = intensity of selection for trait X x
h = square root of the heritability for trait X X
h = square root of the heritability for trait Y y
r A = genetic correlation between X and Y xy
a py — the standard deviation for trait Y
As an example, assume that in selecting for milk production in Hol-stein cattle (trait X) and selecting among the top 90 percent of the cows and top 10 percent of the bulls for milk production, the increase in protein production (trait Y) can be determined per lactation each generation. Using the formula substitutions of values can be made.
CR = 1 X 0.529 X 0.529 X 0.89 X 100# y = 1 X 0.28 X 0.89 X 100#
= 0.2492 X 100# =z 24.9# or 25# of protein produced
The genetic correlations between milk yield and the yield of each of the milk components are presented in Table 5. These values were obtained in the NE-46 and the S-49 projects (5). The genetic correlations are used to develop the values for CR presented in Tables 4 and 6.
y Tne expected responses to selection in Table 6 show that the production traits improve about 1/6 as fast when selections are made for type alone as opposed to selecting for the production traits alone. The same table shows that type scores improve about Vz as fast when selections are made for production alone as compared with the selection for type alone. This agrees with Harvey and Lush (6).
Table 5.
Genetic correlations of milk composition and yield in dairy cattle
Traits Milk Fat SNF TS Protein
Fat
SNF
TS
Protein
Final type score
0.78
0.96
0.94
0.89
0.18
0.81
0.91 0.98
0.83 0.95
0.16 0.18
0.95
0.18 0.18
TYPE AND MILK PRODUCTION IN DAIRY CATTLE 7
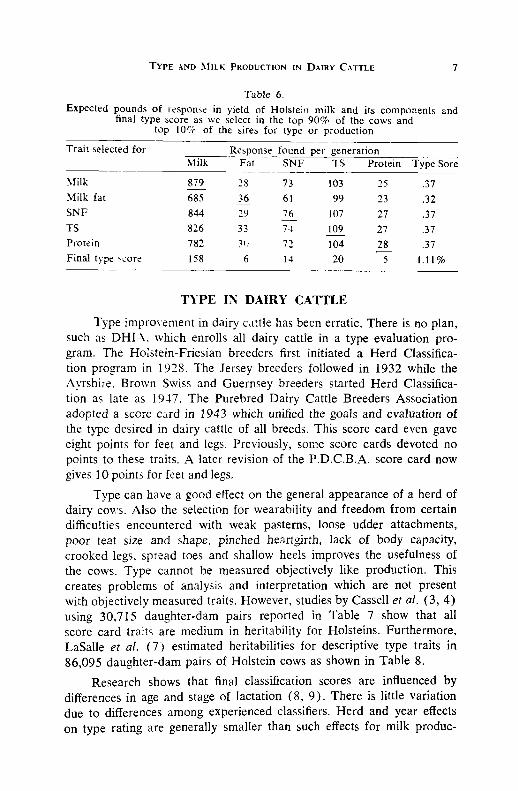
Table 6.
Expected pounds of response in yield of Holstein milk and its components and final type score as we select in the top 90% of the cows and
top 10% of the sires for type or production
Trait selected for Response found per generation
Milk
Milk fat
SNF
TS
Protein
Final type score
Milk
879
685
844
826
782
158
Fat
28 36
29
33
3D
6
SNF
73 61
76
74
72
14
TS
103
99
107
109
104 20
Protein
25
23
27
27
28
5
Type S<
.37
.32
.37
.37
.37
1.11%
TYPE IN DAIRY CATTLE
Type improvement in dairy cattle has been erratic. There is no plan, such as DHIA, which enrolls all dairy cattle in a type evaluation program. The Holstein-Friesian breeders first initiated a Herd Classification program in 1928. The Jersey breeders followed in 1932 while the Ayrshire. Brown Swiss and Guernsey breeders started Herd Classification as late as 1947. The Purebred Dairy Cattle Breeders Association adopted a score card in 1943 which unified the goals and evaluation of the type desired in dairy cattle of all breeds. This score card even gave eight points for feet and legs. Previously, some score cards devoted no points to these traits. A later revision of the P.D.C.B.A. score card now gives 10 points for feet and legs.
Type can have a good effect on the general appearance of a herd of dairy cows. Also the selection for wearability and freedom from certain difficulties encountered with weak pasterns, loose udder attachments, poor teat size and shape, pinched heartgirth, lack of body capacity, crooked legs, spread toes and shallow heels improves the usefulness of the cows. Type cannot be measured objectively like production. This creates problems of analysis and interpretation which are not present with objectively measured traits. However, studies by Cassell et al. (3, 4) using 30,715 daughter-dam pairs reported in Table 7 show that all score card traits are medium in heritability for Holsteins. Furthermore, LaSalle et al. (7) estimated heritabilities for descriptive type traits in 86,095 daughter-dam pairs of Holstein cows as shown in Table 8.
Research shows that final classification scores are influenced by differences in age and stage of lactation (8, 9). There is little variation due to differences among experienced classifiers. Herd and year effects on type rating are generally smaller than such effects for milk produc-
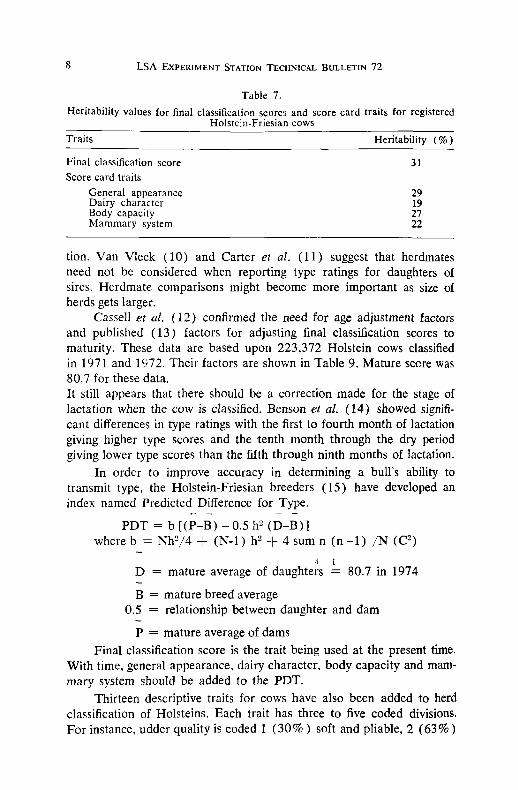
8 LSA EXPERIMENT STATION TECHNICAL BULLETIN 72
Table 7.
Heritability values for final classification scores and score card traits for registered Holstein-Friesian cows
Traits Heritability (%)
Final classification score 31
Score card traits
General appearance 29 Dairy character 19 Body capacity 27 Mammary system 22
tion. Van Vleck (10) and Carter et al. (11) suggest that herdmates need not be considered when reporting type ratings for daughters of sires. Herdmate comparisons might become more important as size of herds gets larger.
Cassell et al. (12) confirmed the need for age adjustment factors and published (13) factors for adjusting final classification scores to maturity. These data are based upon 223,372 Holstein cows classified in 1971 and 1972. Their factors are shown in Table 9. Mature score was 80.7 for these data. It still appears that there should be a correction made for the stage of lactation when the cow is classified. Benson et al. (14) showed significant differences in type ratings with the first to fourth month of lactation giving higher type scores and the tenth month through the dry period giving lower type scores than the fifth through ninth months of lactation.
In order to improve accuracy in determining a bull's ability to transmit type, the Holstein-Friesian breeders (15) have developed an index named Predicted Difference for Type.
PDT = b [(P-B) - 0.5 h2 (D-B)] where b = Nh2/4 + (N-l) h2 + 4 sum n (n -1) /N (C2)
i i
D = mature average of daughters = 80.7 in 1974
B = mature breed average 0.5 = relationship between daughter and dam
P = mature average of dams Final classification score is the trait being used at the present time.
With time, general appearance, dairy character, body capacity and mammary system should be added to the PDT.
Thirteen descriptive traits for cows have also been added to herd classification of Holsteins. Each trait has three to five coded divisions, For instance, udder quality is coded 1 (30%) soft and pliable, 2 (63%)
TYPE AND MILK PRODUCTION IN DAIRY CATTLE 9
Table 8.
Heritability values for descriptively coded traits in registered Holstein-Friesian cows
Traits Codes (%) Description Heritability (%)
Stature
Head
Front end
Back
Rump
Hind legs
Feet
Fore udder
Rear udder
Udder support
Teat size and placement
Miscellaneous
1 2 3 1 2 3 4 1 ( 2 3 1 1 2 3 1 2 3 4 1 2 3 4 5 1 1 2 3 1 1 2 3 4 1 2 3 1 ( 2 3 4
1 ( 2 1 3 4 1 1 2 3 4 5
41) ,47) ,12)
3) TO) 35) 4)
20) . 4) : 9) 37) , 6) [13)
8) : i5) [18) HO)
2) [38) [43) 10)
: 7) 5)
: 7) '27)
8) [52) [13) I 2) 10)
111) [ 2) 68) , 6)
9) ' 1)
22) 1)
20) 9) 2) 8) 9)
' 1) 4)
Upstanding Intermediate Low set Ideal Short Plain and/or coarse Weak Chest strong width Coarse shoulder Narrow and weak Strong, wide loin Low front end Weak loin Long, wide and level High pins Narrow pins Sloping Strong, squarely placed Acceptable Sickled Too light bone Too straight (posty) Strong, good shape Spread toes Shallow heel Firmly attached Slightly bulgy Short Broken High and wide Narrow and pinched Loose, broken Strong ligaments Floor too low Tilted Broken ligaments
Desirable size & placement Rear teats far back Wide front teats Poor shape Winged shoulders Toeing out Weak pasterns Crampy Small size
47 12 51 17 44 18 23 17 18 18 18 34 28 14 28 26 46 28 13 18 27 39 16 11 10 37 12 18 33 28 26 36 21 24 33 35
22 83 30 33 20 13 11 43 25
intermediate, 3 (3%) could not determine, 4 (4%) meaty. With this information paternal sisters can be compared with their breedmates and their dams to determine if differences in these traits are real. The statistical procedure for comparing the descriptive trait of paternal sisters with their breedmates is as follows:

10 LSA EXPERIMENT STATION TECHNICAL BULLETIN 72
Let P = % of the paternal sisters (daughters of a sire) within a specific code (1-5) and category (1-13).
Let Q = % of the daughters of a sire in all other codes within a specific category.
Let s = standard deviation of the above so that s = V PQ/N where N = the number of scored daughters of a sire
Let T = ( P - B A ) ~ s where BA is the weighted breed average for the code (1-5) and
category (1-13). The 10% level of probability in the table of T (students) (16)
is considered significant. Example: If 25% of 20 daughters (N) of a sire are coded (1) firmly
attached, high and wide in rear udder, then P = 25% and Q = 75%.
Then s = V (25 x 75) -H 20 = 9.68. If the appropriate BA is 10%, then the T-value is:
(25 - 10) -f- 9.68 = 1.5496
Table 9.
Factors for age adjusting final classification scores to maturity
Age in months Adjustment factor
Less than 24 1.06 24-25 1.05 26-28 1.04 29-33 1.03 34-37 1.02 38-47 1.01 48-73 1.00 74-101 .99
102-106 .98 107-136 .97 137-142 .96 143-168 .95
More than 168 .95 This calculated T does not exceed the tabled T (1.725). There
fore, the conclusion is that there is no significant difference between the percentages of daughters of this sire that are coded 1 for rear udder and their breedmates that are coded 1 for rear udder. This sire would not be expected to sire a significantly higher percentage of daughters coded 1 for this trait than the percentage already found among cows in the breed as a whole.
Daughters can also be compared with their dams for all the descriptive codes. The procedure follows:
P = % of a sire's daughters which are found within a specific code (1-5) and category (1-13).

TYPE AND MILK PRODUCTION IN DAIRY CATTLE 11
Q = % of the sire's daughters which are in all other codes in that category.
P, & Q, = % of the dams in the same category as their daughters. BA & BA, = % of all Holsteins in the same categories as daughters
and dams. s & Sj = same standard deviation for daughters and dams, respec
tively.
s = V PQ N Sl = \/~P&/N, where N = No. of daughters and N, = No. of dams.
T = (P - P,) - (BA - BAJ -i- V F Q - N + P 1 Q 1 S - N The Wc level of probability in the table of T (students) is con
sidered significant. Example: There are 40 daughters of a sire with their dams that are
descriptively classified. Seventy percent of the daughters are coded 2 (moderate length-slightly bulgy) in fore udder at an average age of 3 years and 7 months. Forty percent of the dams are coded 2 in fore udder at an average age of 7 years and 9 months. The calculations follow: T = (70 - 40) - (30 - 36) ~ V^70 x 3(T +- 40 +
40 x 60 ~ 40 = 3.3962** This value exceeds the value of 1.684 in the T table. The conclu
sion is that there is a significantly higher percentage of daughters coded 2 in fore udder than their dams. These two tests can be useful in determining the '•transmitting patterns" of Holstein sires. This helps in making selective matings to improve specific type traits. No bull improves every trait, so choices have to be made to select for the most important traits.
TYPE AND PRODUCTION IN DAIRY CATTLE
In selecting for both type and production it is informative to use a chart as shown in Figure 1. The herd average can be calculated for type and for production as shown in Table 10 and plotted on the chart. Then a breeder should set his goals such as Goal A or Goal B on the chart. If a line is then drawn from the Goal to the herd average and a perpendicular line struck from the Goal-herd average line, a cow index can be developed which will best serve the breeder in reaching his goal.
The Cow Index for Goal A is: Cow Index = Cwt. of milk + 7.5 (Final Type Score)
This index will cull the cows in such a manner that the herd will be pushed toward Goal A. The use of sires which transmit good type and
**Highly significant statistically. P = < .01 which means that the value of T 3.3962 would occur less than 1 time in 100.

1 2 LSA EXPERIMENT STATION TECHNICAL BULLETIN 72
Figure 1. Cow Indexes for Use with Goal "A" or Goal "B" for Production and Final
Type Score.
production will help materially. Each cow index should be "homemade'' and fit the desires of each breeder. The relative values in the Cow Index can be changed to give greater or lesser emphasis to type and production as improvements are made. The selection index should yield about 1.4 times more progress per generation than using type and milk production truncation selection individually for each cow.
If a breeder adopts Goal "A" or 25,000 pounds of milk with an 87% final type score, he proceeds as follows: (a) He locates this goal on a chart as is shown in Figure 1; (b) Then he would draw a line between Goal A and the Herd Average located at 18,593 pounds of milk and 82.25% final type score; (c) A line perpendicular to the Goal A -Herd Average line is drawn; (d) Two values for production and two values for the corresponding final type score are taken from this perpen-

TYPE AND MILK PRODUCTION IN DAIRY CATTLE 13
Table 10.
Milk production and type scores for University of Maine Holstein cows
Barn Name
Dasie Cathy Geraldine Flora Deanna Dream Hanna Mona Floraine Debbie Dona Darlene Sonja Rhoda Snoball Annette Minny Minnette Tennie Janette
Average
Mature, 305-day lactation average
pounds 18,666 20,287 16,840 17,588 14,175 21,386 17,466 17,518 20,242 19,416 19,828 17,552 24,636 20,471 17,740 15,917 19,414 20,538 15,678 16,512
18,593
No. of lactations
6 5 3 4 3 2 2 2 2 2 2 2 1 1 1 1 1 1 1 1
Mature type score
average
% 85 84 79 81 83 85 79 82 85 79 83 82 85 77 86 84 82 82 80 82
82.25
No. of classifications
5 4 3 3 2 2 2 2
dicular line, i.e., 19,450 pounds of milk and 75% final type score and 11,900 pounds of milk and 85% final type score; (e) The differences in production and final type scores for these two points are found, i.e., 19,450-11,900 = 7,550 pounds of milk, i.e., 85%-75% = 10%. Then 75.50 cwt. of milk is divided by 10 to give 7.55 to use for the multiplier of final type score in the Cow Index to move the Herd Average toward Goal A. Each cow in the herd would receive a Cow Index value using the formula Cow Index = Cwt. Milk -=-7.55 (Final Type Score). These values are found in Table 11.
Perhaps a breeder decides that Goal "B" or 22,000 pounds of milk with a 90% final type score is his aim. He wants more type and less production in his cattle than for Goal "A" He proceeds as follows: (a) He locates this goal on a chart as is shown in Figure 1; (b) Then he draws a line between Goal "B" and the Herd Average located at 18,593 pounds of milk and 82.25% final type score; (c) A line perpendicular to the Goal B—Herd Average line is drawn; (d) Two values for production and two values for the corresponding final type score are taken from this perpendicular line as 21,000 pounds of milk with 77% final type score and 12,200 pounds of milk with an 81% final type score- faS ' r u ° A'a : final t v P e score for these

LSA EXPERIMENT STATION TECHNICAL BULLETIN 72
Table 11.
Cow index values for the cows in the herd using Goal A and Goal B
Barn Name
Dasie Cathy Geraldine Flora Deanna Dream Hanna Mona Floraine Debbie Dona Darlene Sonja Rhoda Snoball Annette Minny Minnette Tennie Janette
Average
Goal A
828.51 837.07 764.85 787.43 768.40 855.61 771.11 794.28 844.17 790.61 824.93 794.62 888.11 786.06 826.70 794.37 813.24 824.48 760.78 784.22
806.92
Cow index Rank
5 4
19 14 18 2
17 11 3
13 7
10 1
15 6
12 9 8
20 16
value with Goal B
2,056.66 2,050.87 1,906.40 1,957.88 1,967.75 2,083.86 1,912.66 1,979.18 2,072.42 1,932.16 2,024.28 1,979.52 2,116.36 1,898.71 2,069.40 2,007.17 1,998.14 2,009.38 1,916.78 1,969.12
1,995.44
Rank
5 6
19 15 14 2
18 12 3
16 7
11 1
20 4 9
10 8
17 13
two points on the Cow Index line are found, i.e., 21,000-12,200 = 8,800 pounds of milk, i.e., 81%-77% = 4%. Then 88.00 Cwt. of milk is divided by 4 to give 22 to use for the multiplier of final type score in the Cow Index to move the Herd Average toward Goal B. Each cow in the herd would receive a Cow Index value using the formula Cow Index = Cwt. Milk -f 22 (Final Type Score). These values are found in Table 11.
A close examination of Table 11 reveals that the cows with the lowest Cow Index using Goal A are Tennie, Geraldine and Deanna. If a breeder is using Goal B, the cows with the lowest Cow Index are Rhoda, Geraldine and Hanna. If a breeder decides that he would not desire to cull Rhoda because she produced 20,471 pounds of milk, then he could decide to keep her as a milk producer and not keep any calves from her. If he decides that Rhoda is not a cull cow in his breeding program, then he should reexamine his goals and change them so they would more nearly approach Goal A, since Rhoda is not a cull cow for a breeder who is aiming toward Goal A.
After four years, a breeder should again calculate his Herd Average for mature milk production and mature final type score to determine his herd's progress. If satisfactory progress has been made toward his

TYPE AND MILK PRODUCTION IN DAIRY CATTLE 15
goal, then he should continue to use the same Cow Index in selecting his cows for breeding purposes. If unsatisfactory progress has been made, then he should examine his sire selection program, mating program and revalue his Cow Index.
LITERATURE CITED
(1) Olson, T. M. 1938. Elements of Dairying. The Macmillan Company, New York, New York.
(2) Agricultural Research Service, United States Department of Agriculture. Dairy Herd Improvement Newsletters.
(3) Cassell, B. G., J. M. White, W. E. Vinson and R. H. Kliewer. 1973. Genetic and phenotypic relationships among type traits in Holstein-Friesian cattle. J. Dairy Sci., 56:1171-1177.
(4) Cassell, B. G., J. M. White, W. E. Vinson and R. H. Kliewer. 1973. Sire-son relationships for type in Holstein-Friesian cattle. J. Dairy Sci., 56:1164-1170.
(5) Wilcox, C. J.. S. N. Gaunt and B. R. Farthing. 1971. Genetic interrelationships of milk composition and yield. Southern Coop. Ser. Bull. 155.
(6) Harvey, W. R. and J. L. Lush. 1952. Genetic correlation between type and production in Jersey cattle. J. Dairy Sci., 35:199-213.
(7) LaSalle, T. J., J. W. Jamison and J. M. White. 1973. Heritability of descriptive type traits in Holstein cattle. J. Dairy Sci., 56:676.
(8) McGilliard, L. D. and J. L. Lush. 1956. Changes in type classification of dairy cattle. J. Dairy Sci., 39:1015.
(9) Hansen, L. R., G. R. Barr and D. A. Wieckert. 1969. Effects of age and stage of lactation on type classification. J. Dairy Sci., 52:646.
(10) Van Vleck, L. D. 1964. Variation in type appraisal scores due to sire and herd effects. J. Dairy Sci., 47:1249.
(11) Carter, H. W., J. C. Rennie and E. B. Burnside. 1965. Cause of variation in type classification scores. J. Dairy Sci., 48:710.
(12) Cassell, B. G., J. M. White and W. E. Vinson. 1972. Heritability of type traits in Holsteins. J. Anim. Sci., 35:173.
(13) Cassell, B. G., W. E. Vinson, J. M. White and R. H. Kliewer. 1973. Age correction factors for type traits in Holsteins. J. Dairy Sci., 56:1178.
(14) Benson, R. H., W. J. Tyler and G. Hyatt. 1951. Some causes of variation in type ratings of Ayrshire cows. J. Dairy Sci., 34:502.
(15) Kliewer, R. H. 1971. Advances in the use of type data for evaluation of registered Holstein sires. Proc. 25th Con. N.A.A.B., pp. 54-66.
(16) Snedecor, G. W. 1956. Statistical Methods. 5th Ed. Iowa State University Press. Ames, Iowa.
(17) Rice, V. A., F. N. Andrews, E. J. Warwick and J. E. Legates. 1967. Breeding and improvement of farm animals. 6th Ed. McGraw-Hill Book Company, New York, New York.
(18) Dickey, H. C. 1970. Breeding dairy cows for milk composition traits. Re-- •-' . . * • - - -• • - Maine, pp. 24-30.


![Biogas Application Options within Milk Dairy Cooperatives ... · PDF filetotal milk production is estimated to 968,000 ton per year [8]. Many beef and dairy cattle farmers are organized](https://static.documents.pub/doc/80x56/5ab8ed277f8b9ad5338d6616/biogas-application-options-within-milk-dairy-cooperatives-milk-production-is.jpg)

