Selection or Influence? Institutional Investors and Corporate Acquisitions * Lily Qiu This draft: October 2006 ABSTRACT This paper shows that the presence of large public pension fund sharehold- ers particularly reduces ex ante bad acquisitions. When firms with large public pension fund presence do acquire other firms, they perform relatively better in the long-run. Other institutional investors have either the opposite effect or no effect. Identifying the sources of exogenous variation in institutional ownership is crucial to establish the direction of causality between institutional ownership and observed corporate merger and acquisition decisions. This paper introduces two new approaches. First, I decompose the institutional ownership into one compo- nent which is correlated with future M&A shocks, and the noise component which is not. I instrument for the various ownerships using this noise term. Second, I instrument for institutional ownership using exogenous shocks to their portfolio sizes interacted with their propensities to invest in each corporation. * Department of Economics, Brown University. Email: lily [email protected]. I especially thank Judy Cheva- lier(dissertation chair) and Andrew Foster, who had provided invaluable guidance. I also have benefited from the comments of Ivo Welch, Ross Levine, Michael Boozer, Arturo Bris, Gerard Hoberg, Owen Lamont, Florencio Lopez- de Silanes, Avri Ravid, Roberta Romano, Matthew Spiegel and seminar participants at the Boston Fed, NBER Corporate Governance meeting, Yale School of Management, University of Illinois at Urbana-Champaign, Brown University, Purdue University, and University of Michigan. I thank Carolyn Brancato at The Conference Board for access to their research report. This paper is based on the first chapter of my Ph.D. dissertation, and a substantial revision from an earlier paper “Which Institutional Investors Monitor? Evidence from Acquisition Activity”. All errors are my own.
Transcript
Selection or Influence? Institutional Investors and Corporate
Acquisitions∗
Lily Qiu
This draft: October 2006
ABSTRACT
This paper shows that the presence of large public pension fund sharehold-ers particularly reduces ex ante bad acquisitions. When firms with large publicpension fund presence do acquire other firms, they perform relatively better inthe long-run. Other institutional investors have either the opposite effect or noeffect. Identifying the sources of exogenous variation in institutional ownership iscrucial to establish the direction of causality between institutional ownership andobserved corporate merger and acquisition decisions. This paper introduces twonew approaches. First, I decompose the institutional ownership into one compo-nent which is correlated with future M&A shocks, and the noise component whichis not. I instrument for the various ownerships using this noise term. Second, Iinstrument for institutional ownership using exogenous shocks to their portfoliosizes interacted with their propensities to invest in each corporation.
∗Department of Economics, Brown University. Email: lily [email protected]. I especially thank Judy Cheva-lier(dissertation chair) and Andrew Foster, who had provided invaluable guidance. I also have benefited from thecomments of Ivo Welch, Ross Levine, Michael Boozer, Arturo Bris, Gerard Hoberg, Owen Lamont, Florencio Lopez-de Silanes, Avri Ravid, Roberta Romano, Matthew Spiegel and seminar participants at the Boston Fed, NBERCorporate Governance meeting, Yale School of Management, University of Illinois at Urbana-Champaign, BrownUniversity, Purdue University, and University of Michigan. I thank Carolyn Brancato at The Conference Board foraccess to their research report. This paper is based on the first chapter of my Ph.D. dissertation, and a substantialrevision from an earlier paper “Which Institutional Investors Monitor? Evidence from Acquisition Activity”. Allerrors are my own.
Introduction
Institutional investors hold more than half of all U.S. publicly traded equity.1 The fastest growing
institutional investors — public pension funds and mutual funds — saw their assets growing at
compound annual growth rates of 14% and 20%, respectively, in the 1990s.2 Many theories3 have
suggested that shareholders with large investment stakes — often institutional investors — are the
most likely monitors of publicly traded companies. However, there has been very little evidence
empirically documenting the effectiveness of institutional investor monitoring.
The main hurdle in establishing institutional investor influence lies in the difficulty of identifying
the exogenous variation in their shareholdings. Given the belief4 that they are often smarter and
better informed than individual investors, institutional ownership, firm performance, and firm
decisions are often jointly determined. It is quite difficult to find an appropriate instrument to
establish the direction of causation. Variables such as dividend yield, liquidity, return volatility,
transaction costs, and major index inclusion etc., either are weak instruments, or are correlated
with the shocks to firm decisions.
To surmount this difficulty, I introduce two new IV approaches to study institutional investor
influence in corporate M&A activity. These strategies rely on very different sources of variation
and identification assumptions, but they reach similar conclusions of the study. First, I identify
an institutional investor’s preference for firm acquisitiveness using its portfolio composition, and
decompose its ownership into one component that is related to this preference, and the noise
component that is orthorgonal to it. The assumption I make is that institutional preference is stable
over a horizon of one year. Given this assumption, if institutions are able to forecast future shocks155.8% in 2001, Institutional Investment Report, The Conference Board, Volume 5, Number 1, March 2003.2Davis and Steil (2001)3Jensen and Meckling (1976), Shleifer and Vishny (1986), Admati, Pfleiderer, and Zechner (1994), and many
others have argued that well-informed institutional investors with a substantial equity stake can exert influence andreduce the agency problem between managers and shareholders with positive ramifications on firm value.
4Coval and Moskowitz (2001), Parrino, Sias, and Starks (2003), and many others have offered emipirical evidence.
1
in firm acquisition activity, the preference-related component represents the part of the institutional
ownership which corresponds to the future shocks. By construction, the noise component is not
correlated with the shocks, and is utilized as an instrumental variable for the institutional ownership.
Second, I borrow the concept of “Bartik instrument” from labor research (Bartik (1991), Blanchard
and Katz (1992)), by interacting exogenous shocks to an institutional investor’s portfolio with its
propensity to invest in a given firm. The assumption is that institutions’ portfolio sizes vary
exogenously half a year (on average) prior to M&A announcements. Institutional ownership is
instrumented with this Bartik instrument to address the ownership endogeneity. The validity of
both identification assumptions are further discussed in the later part of this paper.
Most of the prior studies on institutional investor focus on the impact of shareholder proxy
proposals targeting governance issues. While this is the most visible governance activity by institu-
tional investors, there are several reasons to suspect that event responses to proxy proposals do not
fully represent the impact of shareholder activism. First, proxy proposals are advisory rather than
binding (Pound (1988), Gordon and Pound (1993)). Managers are not obliged to adopt these pro-
posals even if they receive a majority vote from shareholders. The data used in event studies which
examine announcement stock returns will inevitably include many shareholder proposals that are
never implemented.5 Consequently, it is not surprising that stock price reactions to these events
are modest and difficult to detect. Second, proposals will be withdrawn and thus not disclosed if
management voluntarily adopts them. The inclusion of the proposal in the proxy materials may
reflect the management’s negative response to shareholder concerns, and may thus be associated
with negative stock market reactions (Prevost and Rao (2000)).
In this paper, I conduct a new test of the impact of institutional investors on the governance of5For example, in 1988, USAIR did not adopt CalPERS’ anti-poison pill proxy resolution although the proposal
received a majority of votes (Del Guercio and Hawkins (1999)). Wahal (1996) documents that 40 percent of proxyproposals on governance structures changes initiated by public pension funds were adopted by target firms.
2
firms by examining a major corporate event — M&A activity. In particular, I provide the first test
of whether the presence of an institutional investor reduces M&A activities that lower firm values.
M&A activity provides a natural test of the efficacy of institutional investor activism. It occurs
frequently and can have a substantial effect on firm values. Theories suggest that mergers can occur
for good reasons, such as capturing synergy gains, or for bad reasons, such as agency costs. Many
papers, both theoretical and empirical, have argued that M&A can be motivated by managerial
incentives and reduce shareholder wealth, such as Amihud and Lev (1981), Roll (1986), Agrawal and
Mandelker (1987), Shleifer and Vishny (1989), Morck, Shleifer, and Vishny (1990), Avery, Chevalier,
and Schaefer (1998), etc. Evidence on bidder performance, both at the announcement and in the
long-run, suggests that not all acquisitions are beneficial for bidder shareholders (Jensen and Ruback
(1983), Andrade, Mitchell, and Stafford (2001), Agrawal, Jaffe, and Mandelker (1992), Loughran
and Vijh (1997), Mitchell and Stafford (2000), etc.). A recent study by Moeller, Schlingemann,
and Stulz (2003) show that bidders on average lose $25.2 million upon announcement, from 1980
to 2001.
Some bidders are more likely to perform worse than others. Lang, Stulz, and Walkling (1991)
find that bidder returns are significantly lower for low q bidders with high cash flows, which suffer
higher agency costs by Jensen’s free cash flow theory, than low q bidders with low cash flows. Morck,
Shleifer, and Vishny (1990) suggest that managerial objectives drive value-reducing acquisitions,
for example, “buying-growth” acquisition. If institutional investors effectively monitor, then their
presence should reduce the likelihood of “bad” M&A driven by managerial incentives, but not
“good” M&A.
I find that major public pension funds (PPFs) are playing exactly this role. PPFs have a sub-
stantial effect on M&A activity. Their influence is concentrated in the value-reducing acquisitions,
namely, when the acquirer is cash-rich and low-q, or is just “buying-growth”. Ceteris paribus, a
3
1% increase in the largest PPF ownership associates with a 2%-10% reduction in subsequent M&A
likelihood for cash rich and low q firms. Because less than one in three of firm-years in the sample
are M&A observations, this absolute reduction translates into a 7%-30% relative reduction in M&A
frequency. PPFs also do not reduce M&A activity when it is more likely to be good. Acquisitions
by cash-poor and low-q firms on average have positive announcement abnormal returns and positive
long-term abnormal returns in my sample. PPFs have no effect among these firms. Overall, when
firms with large PPF shareholders do undertake acquisitions, their long-run performance (including
the announcement month) is better.
The presence of other types of institutions either has no effect or has the opposite effect. The
results on investment companies (mostly mutual funds) are particularly interesting. Mutual fund
ownership is positively associated with future M&A activity in the whole sample. This association
is the strongest among firms with few growth opportunities and a lot of free cash, and among
the bidders which “buy growth”, i.e., those more likely to suffer agency costs. In the long-term,
acquirers with more mutual fund ownership also perform worse in the stock market. The evidence
suggests that for firms suffering the most agency conflicts, more mutual fund ownership may insulate
the management from more scrutiny and actually encourage more bad M&A.
The evidence of this paper suggests that major public pension funds are the only effective
monitors among all institutions. PPFs held 8% of the total U.S. equity market by 2001 (The
Conference Board), compared with over 50% owned by all institutions. They are know to be
activists of corporate governance. Gillan and Starks (2000) document that PPFs are the most active
in governance activities ranging from highly public proxy targeting to closed-door negotiations. In
the hotly contested acquisition of Compaq by Hewlett-Packard in 2002, six major public pension
funds6 publicly announced that they would vote against the deal.6They are: the California Public Employee Retirement System (CalPERS), the California State Teachers’ Re-
tirement System, New York’s common Retirement Fund, New York State Teachers Retirement Fund, the Public
4
There are two possible mechanisms for PPFs to have an effect. First, if the presence of the
monitor signals credible promise of punishing value-reducing actions, the management will not
carry out those M&A deals motivated by managerial incentives. Secondly, if the monitor has the
capacity to judge the quality of individual transactions and effectively intervene, it can directly
reduce the frequency of negative bidder NPV M&A. Although the first mechanism cannot be
observed directly, there are anecdotal evidences such as the HP-Compaq incident supporting the
existence of the second mechanism. CalPERS states its position on M&A as:7 “we examine M&A
activity closely ... we look at each situation to determine what course of actions is best for the
long-term returns of our Fund.” This statement also suggests that the second mechanism does
exist.
The remainder of this paper is organized as follows. Section I provides a literature review
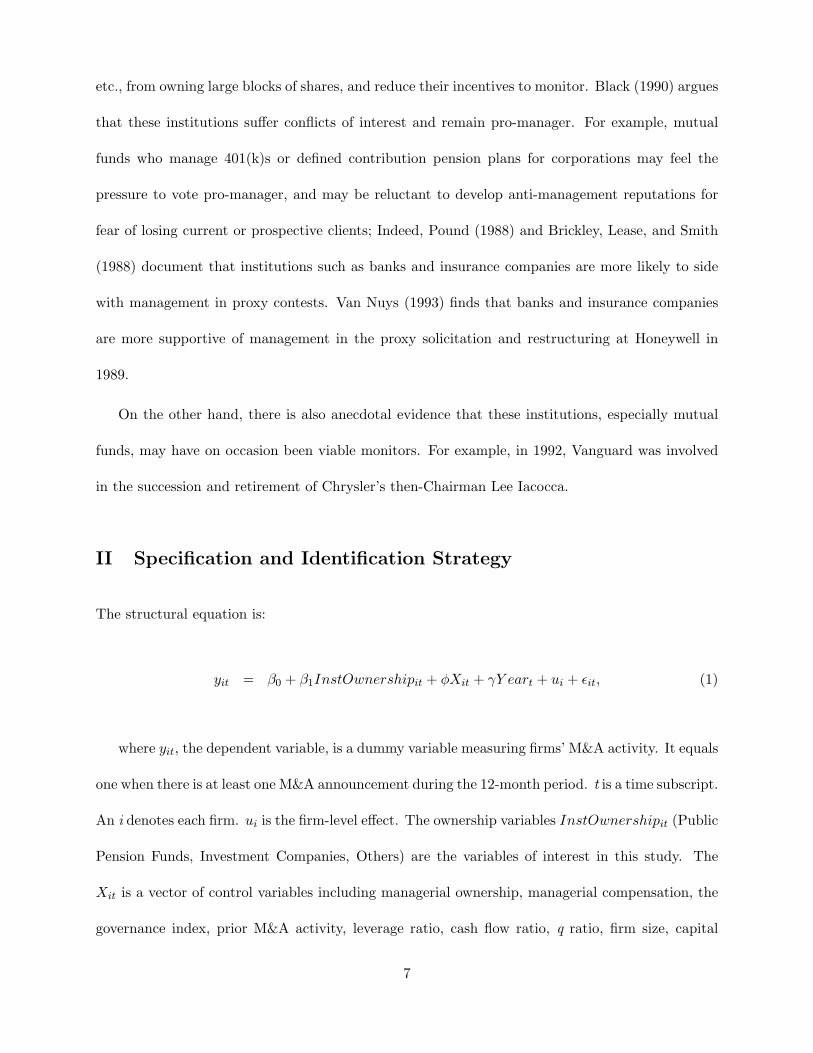
on institutional shareholder activism. Section II describes the specification and the identification
strategy. Section III describes data. Section IV and V discuss institutional ownership impact on
M&A likelihood and M&A performance. Section VI concludes the paper.
I Literature Review
Empirical work has not produced much evidence on the role of institutional investors. Most studies
on institutional investor activism (Gillan and Starks (2000), Del Guercio and Hawkins (1999),
Karpoff, Malatesta, and Walkling (1996), Wahal (1996), etc.) focused on institutions’ activity in
submitting proxy proposals. They found inconclusive results. Other studies (Hartzell and Starks
(2002), Hotchkiss and Strickland (2003), Parrino, Sias, and Starks (2003), Song and Szewczyk
(2003), etc.) examine institutions’ non-proxy activity, such as their impact on compensation policy,
Employee’s Retirement Association of Colorado, and the Public Employees Retirement System of Ohio.7Quote from email exchanges with Ted White, Director of Corporate Governance at CalPERS, in 2004.
5
CEO turnover, and market response to corporate event. However, few have discussed in detail how
to control for ownership endogeneity.
There is also a large literature regarding the heterogeneity among different types of institutions.
Black (1990) argues that PPFs are in the forefront of institutional shareholder activism due to their
size and independence. Several other characteristics of PPFs also encourage and facilitate their roles
as monitors of corporate governance. First, although most institutional investors at least partially
outsource the management of their assets to external money managers, public pension funds appear
to retain effective voting control of their assets. In 1993, PPFs retained voting control over 98.9%
of the stocks they owned, compared to only 66.4% for the average institutional investor (Brancato
(1993)). Retention of voting power provides the means of activism. Second, indexing strategies are
common among PPFs. Davis and Steil (2001) document that indexation accounts for 54% of public
pension funds’ domestic equity and only 24% of that of corporate funds. Gillan and Starks (2000)
argue that selling constraints imposed by indexing strategies can provide an important motivation
for shareholder activism aimed at improving overall market performance.8
On the other hand, PPFs may suffer their own agency costs and thus may not be effective mon-
itors. Romano (1993) argues that the political pressure faced by the managers of public pension
funds may conflict with the goal of profit maximization. Murphy and Van Nuys (1994) find that
state pension system officials manage the funds “more conservatively than their corporate counter-
parts to avoid drawing negative attention to the pension system.” Woidtke (2002) finds that firm
relative values are negatively related with public pension ownership.9
In contrast to PPFs, other institutional investors may not want to be active monitors. Roe
(1994) argues that legal restrictions often prevent banks, insurance companies, and mutual funds8In a speech at Stanford University, March 21, 1996, Richard Koppes, former chief counsel of CalPERS, remarked,
“It makes sense for us to try to raise the ocean in order to lift our boat.”9However, the instrument used in her paper is found to be a weak instrument in my study.
6
etc., from owning large blocks of shares, and reduce their incentives to monitor. Black (1990) argues
that these institutions suffer conflicts of interest and remain pro-manager. For example, mutual
funds who manage 401(k)s or defined contribution pension plans for corporations may feel the
pressure to vote pro-manager, and may be reluctant to develop anti-management reputations for
fear of losing current or prospective clients; Indeed, Pound (1988) and Brickley, Lease, and Smith
(1988) document that institutions such as banks and insurance companies are more likely to side
with management in proxy contests. Van Nuys (1993) finds that banks and insurance companies
are more supportive of management in the proxy solicitation and restructuring at Honeywell in
1989.
On the other hand, there is also anecdotal evidence that these institutions, especially mutual
funds, may have on occasion been viable monitors. For example, in 1992, Vanguard was involved
in the succession and retirement of Chrysler’s then-Chairman Lee Iacocca.
The identifying assumption is that fund preference is stable over a period of one year (own-10If I use the weighted “FundPreference” of all institutions within each category as the measure for aggregate
ownership, the estimations are similar.11The earlier draft utilized a tobit regression with firm-level effect, since ownership is censored at zero. Results
were similar.
8
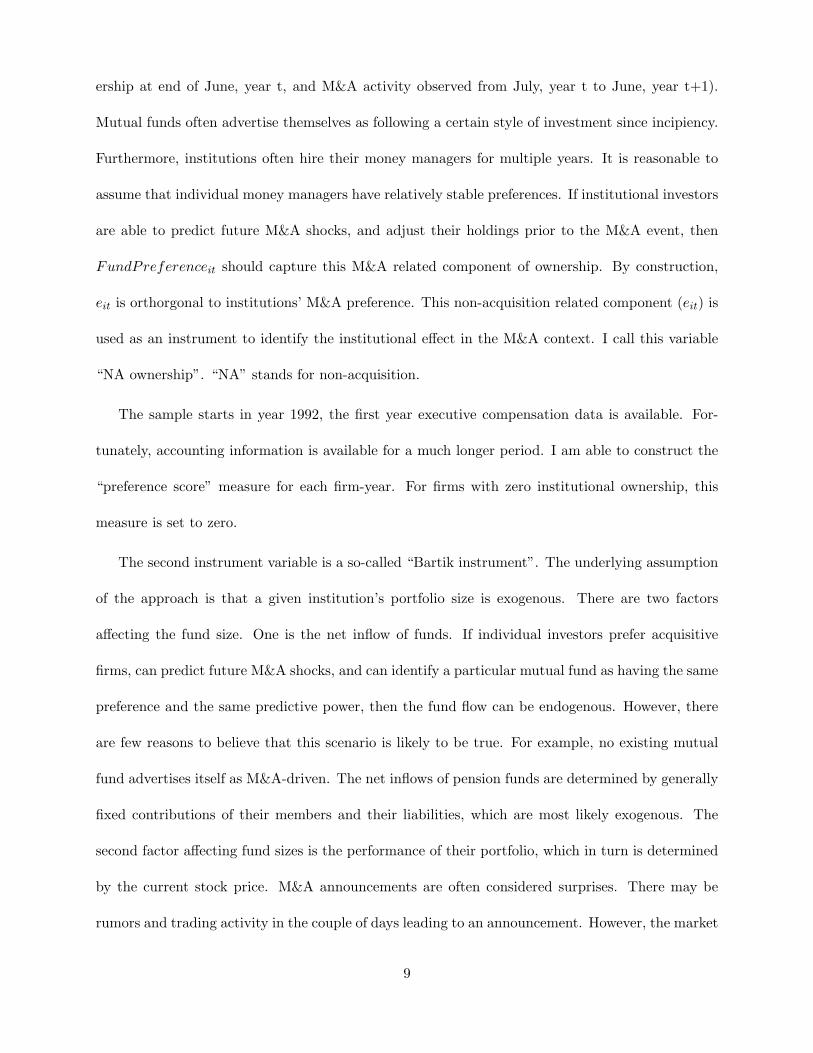
ership at end of June, year t, and M&A activity observed from July, year t to June, year t+1).
Mutual funds often advertise themselves as following a certain style of investment since incipiency.
Furthermore, institutions often hire their money managers for multiple years. It is reasonable to
assume that individual money managers have relatively stable preferences. If institutional investors
are able to predict future M&A shocks, and adjust their holdings prior to the M&A event, then
FundPreferenceit should capture this M&A related component of ownership. By construction,
eit is orthorgonal to institutions’ M&A preference. This non-acquisition related component (eit) is
used as an instrument to identify the institutional effect in the M&A context. I call this variable
“NA ownership”. “NA” stands for non-acquisition.
The sample starts in year 1992, the first year executive compensation data is available. For-
tunately, accounting information is available for a much longer period. I am able to construct the
“preference score” measure for each firm-year. For firms with zero institutional ownership, this
measure is set to zero.
The second instrument variable is a so-called “Bartik instrument”. The underlying assumption
of the approach is that a given institution’s portfolio size is exogenous. There are two factors
affecting the fund size. One is the net inflow of funds. If individual investors prefer acquisitive
firms, can predict future M&A shocks, and can identify a particular mutual fund as having the same
preference and the same predictive power, then the fund flow can be endogenous. However, there
are few reasons to believe that this scenario is likely to be true. For example, no existing mutual
fund advertises itself as M&A-driven. The net inflows of pension funds are determined by generally
fixed contributions of their members and their liabilities, which are most likely exogenous. The
second factor affecting fund sizes is the performance of their portfolio, which in turn is determined
by the current stock price. M&A announcements are often considered surprises. There may be
rumors and trading activity in the couple of days leading to an announcement. However, the market
9
is not able to predict M&A activity in an average time horizon of six months. Consequently, the
current stock price most likely has not incorporated the future shocks to the M&A likelihood.
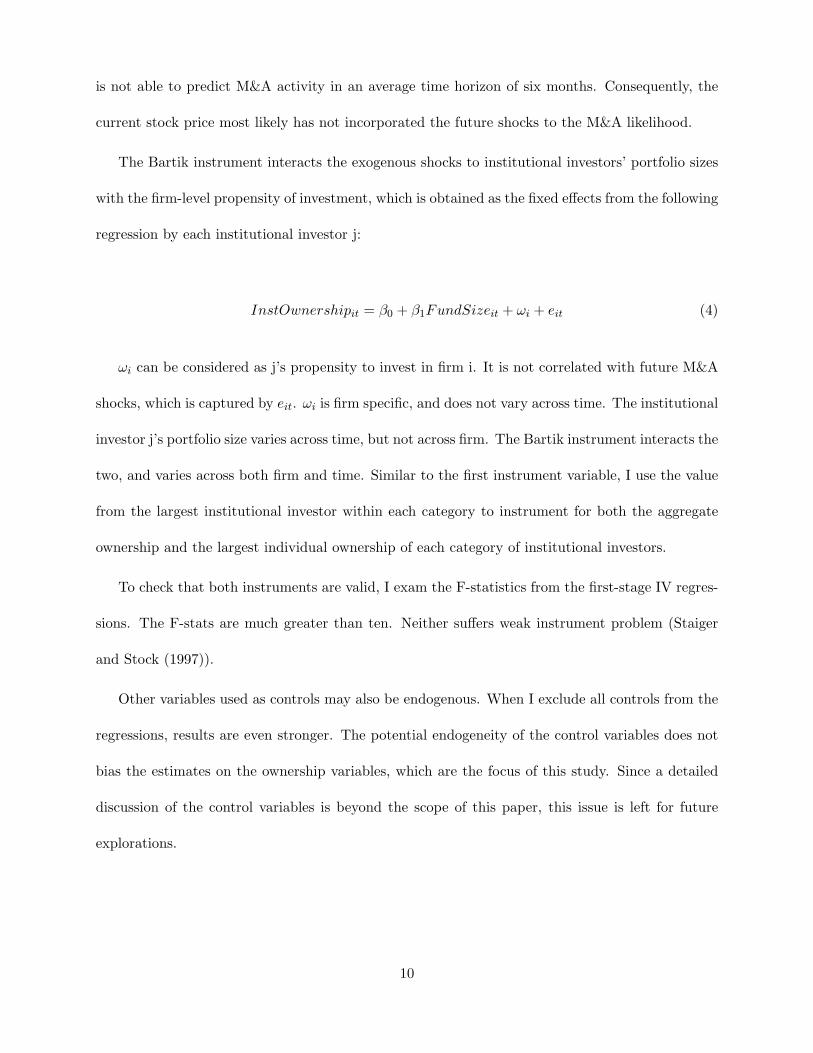
The Bartik instrument interacts the exogenous shocks to institutional investors’ portfolio sizes
with the firm-level propensity of investment, which is obtained as the fixed effects from the following
regression by each institutional investor j:
InstOwnershipit = β0 + β1FundSizeit + ωi + eit (4)
ωi can be considered as j’s propensity to invest in firm i. It is not correlated with future M&A
shocks, which is captured by eit. ωi is firm specific, and does not vary across time. The institutional
investor j’s portfolio size varies across time, but not across firm. The Bartik instrument interacts the
two, and varies across both firm and time. Similar to the first instrument variable, I use the value
from the largest institutional investor within each category to instrument for both the aggregate
ownership and the largest individual ownership of each category of institutional investors.
To check that both instruments are valid, I exam the F-statistics from the first-stage IV regres-
sions. The F-stats are much greater than ten. Neither suffers weak instrument problem (Staiger
and Stock (1997)).
Other variables used as controls may also be endogenous. When I exclude all controls from the
regressions, results are even stronger. The potential endogeneity of the control variables does not
bias the estimates on the ownership variables, which are the focus of this study. Since a detailed
discussion of the control variables is beyond the scope of this paper, this issue is left for future
explorations.
10
III Data
The initial sample is the overlap between CRSP and COMPUSTAT databases, with executive
compensation data available from the Execucomp database, and governance index data available
from IRRC. Corporate financial information is obtained from COMPUSTAT and stock performance
data is from CRSP. Execucomp lists each firm in the S&P 1500 (S&P 500, S&P Midcap 400, and
S&P SmallCap 600). The sample is limited to securities identified by CRSP as ordinary common
shares (with share codes 10, 11 or 12). This excludes American Depository Receipts, closed-end-
funds, primes and scores, and Real Estate Investment Trusts. Utilities, finance and insurance
companies, and government agencies (2-digit SIC code 49, from 60 to 69, and above 89) are also
excluded. Finally, firms with December market capitalization less than one-hundredth the level
of the S&P 500 index are dropped out of the sample. For example, in 1995, the S&P500 closed
at 615.93. The minimum market cap of firms in 1995 in this sample was $6.1593 million. This
is to ensure that results are not driven by small firms. Only a small number of observations are
eliminated by this requirement. Results do not change if these firms are included in the study.
Mergers and acquisitions information is obtained from the SDC domestic M&A database by
Thomson Financial. To be included, a deal has to be completed with an acquisition of 100% of the
target. The total number of M&A deals increases by 132 when deals in which acquirers acquired
majorities of the targets are included. The results of the study do not change materially if the
criterion of M&A deal inclusion is majority ownership of targets instead of 100% ownership. Both
disclosed value and non-disclosed value deals are included, but disclosed value deals must have a
value of at least 1 million. The final M&A data contains both public and private targets (from
July 1993 to June 2001). The following table provides a summary. Average deal values (in million
dollars) are reported in parentheses.
11
Target public company Target non-public
disclosed non-disclosed disclosed non-disclosed
Acquirer acquired 100% of the target 487 1 1,286 1,859
($2,050.30) ($252.99)
Acquirer acquired between 26 1 55 50
50% and 100% of the target ($1,247.43) ($282.98)
Due to multiple announcements during the 12-month period, the final M&A sample consists of
2,022 firm-year observations. Out of this total, 873 observations are for disclosed value M&A only,
760 observations are for undisclosed value M&A only, and 389 observations are for both types.
The institutional ownership data is obtained from Thomson Financial.12 I identify public pen-
sion funds by their names in the Thomson database. In total I find 15 public pension funds:13
California public employees retirement system (CalPERS), California state teachers retirement
system, Colorado public employees retirement association, Florida state board of administration,
Kentucky teachers retirement system, Michigan state treasury, Montana board of investment, New
Mexico educational retirement board, New York state common retirement fund, New York state
teachers retirement system, Ohio public employees retirement system, Ohio school employees re-
tirement system, Ohio state teachers retirement system, Virginia retirement system, and State of
Wisconsin investment board. At the end of June 2000, the average size of equity assets under man-
agement is $25.17 billion, and the median is $24.65 billion (the largest fund is CalPERS [$63.53
billion], the smallest is New Mexico educational retirement board [$1.51 billion]). My results remain12Under the Securities Exchange Act of 1934 (Rule 13f), institutional investment managers who exercise investment
discretion over accounts with publicly traded securities (section 13(f) securities) and who hold equity portfoliosexceeding $100 million are required to file Form 13f within 45 days after the last day of each quarter. Investmentmanagers must report all holdings in excess of 10,000 shares and/or with a market value over $200,000.
13Not all state and local pension funds holdings are available, because either they are too small and do not file 13f,or their assets are reported by outside money managers.
12
the same if CalPERS, the most visible activist fund, is excluded. About 2% of the observations
have zero PPF ownership. The mutual fund ownership is what Thomson classified as investment
company ownership. The rest are classified as other institutional ownership.14 Two different vari-
ables are used to measure institutional ownership: 1) The aggregate holdings by each category; 2)
The largest individual holdings within each category.
A firm-level shareholder rights variable (the governance index) is obtained from Gompers, Ishii,
and Metrick (2003), which quantifies firm-level provisions of 24 governance rules (mostly takeover
related). A higher index value reflects weaker shareholder rights. This index is available for the full
sample of Investor Responsibility Research Center (IRRC) firms for each publication of Corporate
Takeover Defenses [Rosenbaum 1990, 1993, 1995, 1998, 2000]. For years (1992, 1994, 1996, 1997,
1999) during which there is no publication to provide up-to-date governance provision information,
I use the most adjacent data as a proxy.
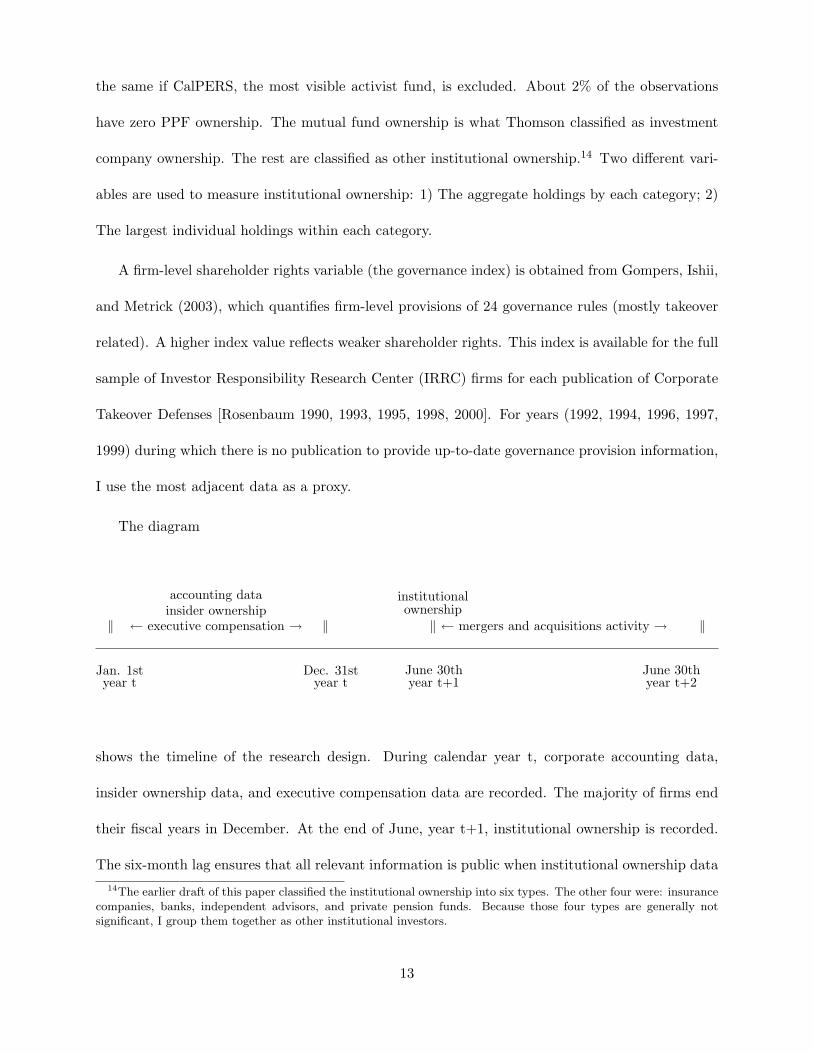
The diagram
‖
accounting datainsider ownership
← executive compensation → ‖
institutionalownership‖ ← mergers and acquisitions activity → ‖
Jan. 1styear t
Dec. 31styear t
June 30thyear t+1
June 30thyear t+2
shows the timeline of the research design. During calendar year t, corporate accounting data,
insider ownership data, and executive compensation data are recorded. The majority of firms end
their fiscal years in December. At the end of June, year t+1, institutional ownership is recorded.
The six-month lag ensures that all relevant information is public when institutional ownership data14The earlier draft of this paper classified the institutional ownership into six types. The other four were: insurance
companies, banks, independent advisors, and private pension funds. Because those four types are generally notsignificant, I group them together as other institutional investors.
13
is considered. If the firm announces at least one merger and/or acquisition deal during the period
July, year t+1 to June, year t+2, this firm is considered to be an M&A firm for data year t.
Thomson Financial institutional ownership data is available until 2000 at the time of this study.
Execucomp data is available from 1992. Thus my final sample covers firms from 1992 to 1999. Each
year, their corresponding institutional ownership (with a 6-month lag) is from end of June holdings
in the following year (1993 to 2000); their merger and acquisition data (with a minimum 6-month
lag) is collected from July the following year to June two years after. There are 1,362 firms and a
total of 6,681 firm-year observations.
Table I provides a detailed description of all variables. All relevant data are CPI-adjusted. Table
II shows that this sample is primarily larger firms. In 1992 dollars, the median market capitalization
is $1,008.99 million and the median total assets are $905.57 million. Ranked by year-end market
capitalization each year, 5,745 observations (88%) are above the median market capitalization of
NYSE and AMEX firms. Results remain if only those firms are included. Thus, my conclusions
are not driven by the smaller firms in the sample.
Among the 6,681 firm-year observations, there are in total 2,022 (30%) M&A observations.
Firms in M&A firm-year observations are larger, have lower insider ownership, higher governance
index, higher cash flow ratios, higher q ratios, lower capital expenditures ratios, and better prior
performance than those in non-M&A firm-year observations. A total of 147 observations (2.2%)
have zero PPF ownership. 11 (7.5%) of those are M&A observations.
IV Institutional Ownership and Likelihood of M&A
It is easier for managers to undertake “bad” M&A when there is no effective monitoring. Controlling
for the firm-level governance structure and firm characteristics which may affect M&A likelihood,
14
we would expect to observe, ceteris paribus, that firms without effective institutional monitoring
are more likely to engage in M&A activity than firms with effective institutional monitoring. In
this section I examine whether institutional ownership reduces M&A frequency in the full sample,
and particularly for the value-reducing ones in the subsamples.
A Full Sample Results
I report the results from the pooled logit model and the fixed effect IV model. The pooled logit
model includes year and industry dummies as controls. The IV model allows for firm-level unob-
served heterogeneity in mergers and acquisitions decisions, and utilizes both the time-series and
the cross-sectional dimensions of the data. Unobserved industry-level heterogeneity is incorporated
in this firm-level effects. During the sample period 1992-1999, the telecommunication and broad-
casting industry went through major deregulation (1996). Dummy variables capturing this shock
are not significant after controling for firm level fixed effects.
Institutional Ownership Variables I find that the overall institutional ownership (sum of
all types) is positively and significantly associated with future M&A activity. I then decompose the
overall institutional ownership into three types as detailed earlier, and report results on different
types of institutional ownership.
Table III reports the first-stage from the IV regressions, which provide information on factors
influencing various institutional ownership. The “NA” instruments are constructed by decompos-
ing the respective institutional ownership, and acquisition preference is only one factor among
many influencing institutions’ investment decisions, as a result, the loading on the same-category
instrument is very close to one. The potential bias in the IV estimation, which is scaled by this
correlation, is likely to be very small (Staiger and Stock (1997)).
There is no evidence that public pension funds prefer firms with better governance structure
15
measured by the governance index. There is also no consistent evidence that institutions avoid firms
with prior M&A activity. I use two independent dummy variables to measure firms’ prior M&A
activities.15 The first dummy equals one if a firm announced a deal in the prior year which received
positive announcement abnormal return, and it equals zero for all others. The second dummy
equals one if a firm announced a deal in the prior year which received negative announcement
abnormal return, and zero for the rest.
The results from the second stage IV regressions are reported in Table IV. PPF ownership has a
negative and significant impact on M&A. This impact remains significant and is economically larger
when I exclude all other controls. Although the control variables can potentially be endogenous,
they do not bias the estimations on the variables of interest. Other institutional investors mostly
have either a positive effect or no effect on M&A likelihood.
Controls Table IV also includes other variables. From the perspective of my study, they are
primarily controls, and not a focus or subject of interest. Thus I discuss the findings only briefly.
Gompers, Ishii, and Metrick (2003) constructed an index on shareholder rights by examining
firm-level governance rules, most of which are anti-takeover provisions. This index is especially
relevant in the context of this study. Mitchell and Lehn (1990) find that firms that make value-
reducing acquisitions become takeover targets. Thus a higher level of anti-takeover protection may
insulate the management from possible takeovers following a bad acquisition, and consequently
encourages bad acquisitions. On the other hand, the management may want more protection
because the firms are likely target, hence are less likely to do acquistion themselves. Gompers,
Ishii, and Metrick (2003) find that firms with stronger shareholder rights (lower index value) made
fewer corporate acquisitions. However, their study didn’t control for the endogeneity issue. After
controling for firm level fixed effects, I show that firms with weaker shareholder rights (higher index15The strict exogeneity assumption of panel data models excludes lagged dependent variables(Wooldridge (2001)).
This two-dummy approach is to avoid this issue. Results are similar without the inclusion of these two dummies.
16
value) actually made fewer acquisitions.
When CEOs receive more option grants in their compensation packages, firms are more likely to
undertake M&A. If M&A activity adds risk, this result suggests that options encourage risk-taking
behavior. However, M&A could also be motivated to reduce risk (diversification for example).
Thus the role of options in the context of M&A activity is unclear. In Jensen and Meckling (1976),
larger managerial equity ownership aligns managerial incentives with those of outside shareholders.
There is some evidence in the data that insider ownership is significantly and negatively correlated
with M&A likelihood.
Several firm characteristics variables also matter for M&A activity.
1. Firm prior M&A activity and firm size are significantly and positively related to M&A activity
in the cross section. However, for one particular firm, prior activity reduces future activity.
2. Tobin’s q ratio is positively and significantly related to future M&A likelihood.
3. There is a substitution effect between capital expenditures and M&A activity.
4. M&A activity is motivated by a firm’s prior performance.16 It is possible that firms either
extrapolate their prior performance when making investment decisions or take advantage of
their relatively high valuations.
B Subsample Results
Some mergers and acquisitions can create value for the acquirers. It is important to know if PPFs
have the ability to differentiate between good and bad M&A ex ante, and thus discourage bad deals;16I use four measures for prior performance: one-year sales growth rate, cumulative abnormal returns using the
benchmark method, cumulative abnormal returns using the Fama-French 3-factor model, and buy-and-hold abnormalreturns. I report my results using benchmarked CAR throughout this paper. Results using other measures are similarboth in economic and statistical significance, and are available upon request.
17
or, if the presence of PPF investors deters managers from undertaking M&A, whether it deters the
bad M&A only.
Lang, Stulz, and Walkling (1991) and Morck, Shleifer, and Vishny (1990) suggest worse perfor-
mance for cash rich, low q acquirers and “buying-growth” acquirers. Table V confirms it.
Low q firms and cash rich firms are classified independently. Each year, firms with q ratios less
than the sample median are classified as low q firms. Annual median q ratios vary from 1.31 to
1.60. Half of the original observations are classified as low q observations. Cash richness is defined
as the ratio of non-current-debt cash and cash equivalents to non-cash total assets (see table I).
Each year, firms with above industry (by 4-digit SIC code) median cash holdings are classified as
cash-rich firms. To define which deal is “buying growth”, I need accounting data for the targets.
Target growth rate is defined to be the 3-year sales growth rate prior to the takeover. Deals with
target sales growth above the sample median are considered to be “buying growth.”
Table V reports that among the low q firms, the market responds more favorably towards M&A
news when the acquirer is cash poor: cash rich ones have insignificant announcement abnormal
returns, while cash poor ones have significant and positive announcement abnormal returns at
68 basis points on average (equal weight). The value-weighted announcement abnormal return is
negative for cash-rich and low q firms, and positive for cash poor and low q firms. “Buying-growth”
M&A receives significantly negative announcement abnormal returns, while “non-buying-growth”
M&A announcement abnormal returns are insignificant. When I look at long-term performance
over a 12-month period including the announcement month, cash poor low q firms and “non-buying-
growth” firms appear to perform better.
If PPF monitoring is effective, I would expect PPF ownership to: 1) have a more pronounced
effect in the cash rich group than the cash poor group among the low q firms; 2) reduce the likelihood
of “buying-growth” M&A. I find strong support for effective PPF monitoring.
18
Cash Rich Low-q vs Cash Poor Low-q Table VI shows that the PPF impact among low
q firms is concentrated in the cash rich firms, which suggests PPFs’ ability to reduce ex ante
bad M&A. A 1% increase in the largest PPF ownership leads to a 1.8%-9.7% reduction in M&A
likelihood, larger than its impact in the whole sample. PPF ownership has no impact in the cash
poor low q subsample. On the contrary, there is some evidence that mutual fund ownership is
positively associated with more M&A activity in the cash rich low q group.
Buying-growth M&A Table VII looks at PPFs’ impact on the likelihood of “buying-growth”
M&A. PPFs reduce the likelihood of “buying growth” M&A: a 1% increase in the largest PPF
ownership reduces the probability of buying a fast-growing target by 8%. Again, on the contrary,
investment company (mostly mutual funds) ownership is positively correlated with “buying-growth”
M&A.
V Institutional Ownership and Performance of M&A
This section looks at bidder long-term stock abnormal returns (including the announcement month),
and bidder post-M&A operating performance to judge whether an M&A deal is good or bad.
Appendix A provides the details on the methodologies measuring the performance.
The primary goal of examing long-term stock abnormal returns is not to test for market effi-
ciency. It differs from the studies by Barber and Lyon (1997), Mitchell and Stafford (2000) and
others, because it includes the announcement month in the calculation of long-term abnormal
returns. Results are similar if I look at post-M&A performance only.
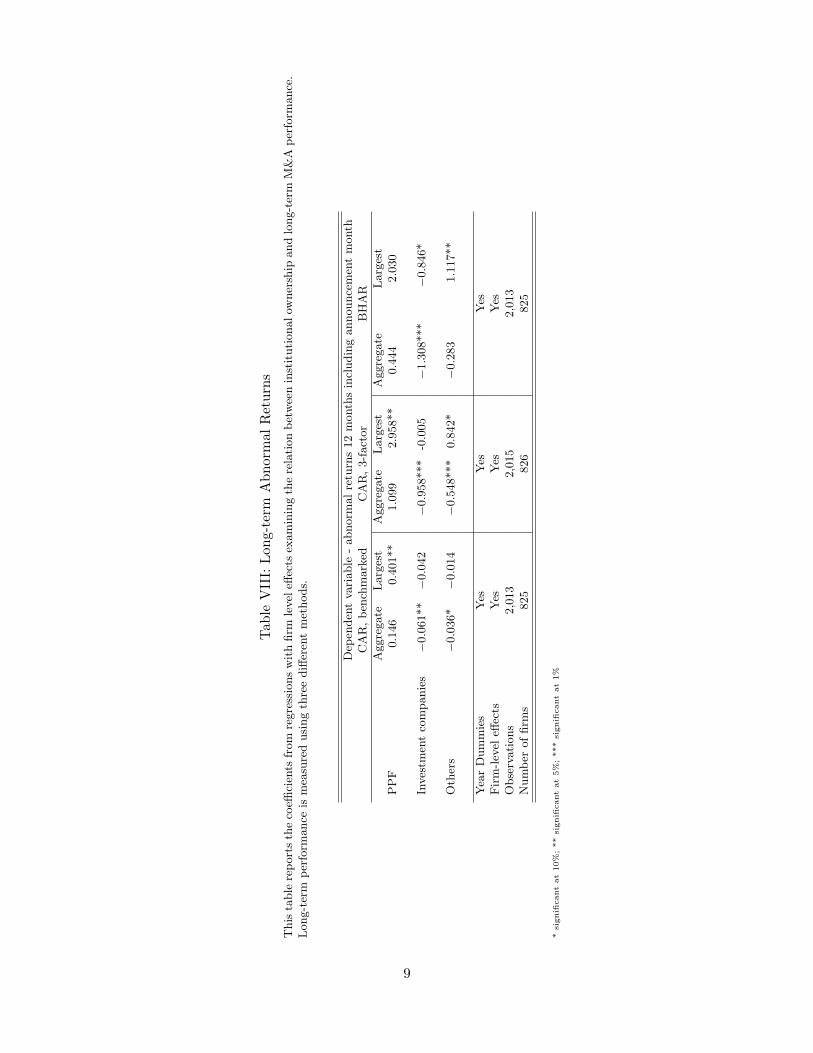
Table VIII reports the results on long-term abnormal returns over twelve months, including the
announcement month. The long-term abnormal returns may provide a better measure of M&A
performance since the measure of announcement abnormal returns can be noisy.17 For example,17If I look at the announcement abnormal returns only, PPF ownership is insignificant, and mutual fund ownership
19
Mitchell, Pulvino, and Stafford (2004) find that nearly half of the negative acquirer announcement
stock return reflects price pressure caused by merger arbitrage.
It appears that M&A firms with higher PPF ownership perform relatively better in the long-
run. A one percent increase in the largest PPF investor is correlated with an increase in abnormal
return by 0.40%-2.95% per year. In contrast, investment company ownership correlates negatively
with long-run abnormal returns.
I also checked whether PPF ownership is correlated with M&A stock performance within the
cash rich low q group, but was unable to find a significant association. It is possibly due to limited
sample size (less than 400 firm-years and 261 firms).
The operating performance of the M&A firms within my sample, as measured by both operating
cash flow returns and cash flow margin on sales, is on average better than their industry median
both pre- and post-M&A. Consistent with findings in Healy, Palepu, and Ruback (1992), their
performance as measured by these two benchmarks improve after their acquisitions. Post-M&A
industry-adjusted cash flow returns on average increase by 1.53% as compared to their pre-M&A
levels; post-M&A industry-adjusted cash flow margins on average increase by 5.38% as compared
to pre-M&A levels. Both improvements are statistically different from zero at the 1% significance
level.
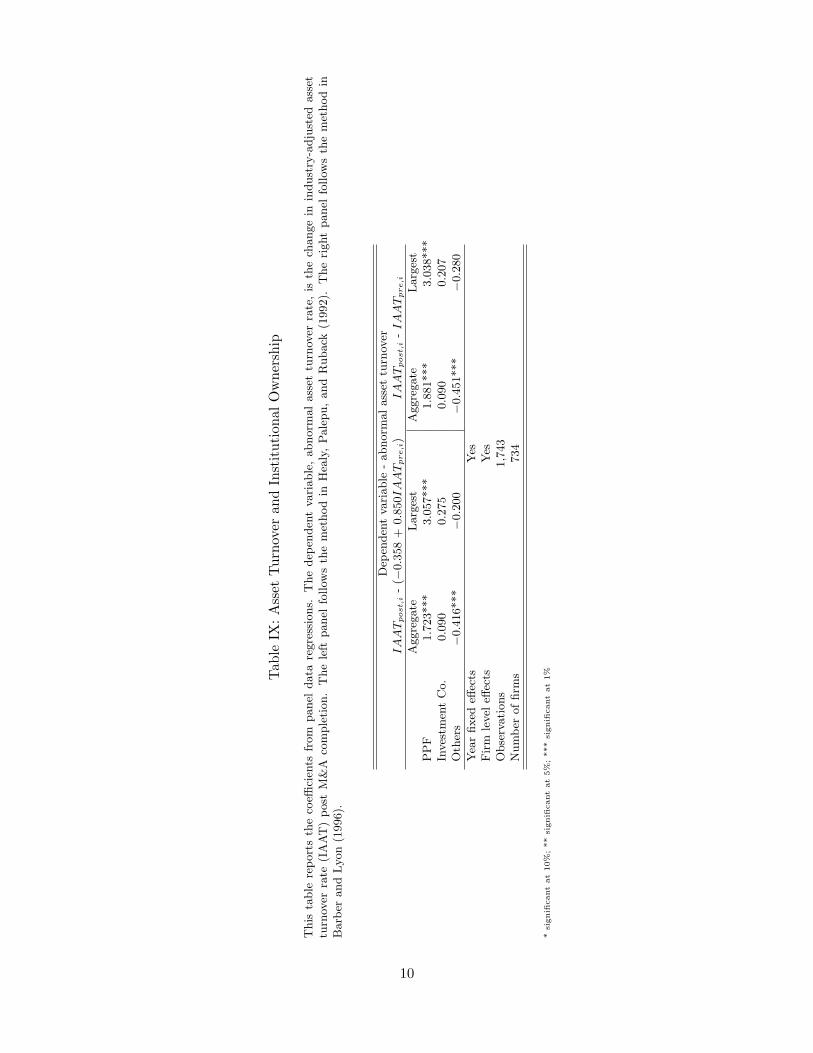
However when I look at their asset turnover rates, they performed worse on average than the
industry median both before and after M&A. Also, their asset turnover rates appear to deteriorate
after the acquisitions’ completion. The decline is not statistically significant except for the subgroup
of M&As with publicly traded targets.
Table IX reports that PPF ownership is positively associated with improvements in asset
turnover rates. An increase of 1% in the largest PPF investor is significantly correlated with
is significantly negative.
20
an improvement of over 3 cents per dollar in the abnormal asset turnover rate. Earlier results show
a positive relation between PPF ownership and twelve-month stock abnormal returns, thus this
positive association between PPF ownership and abnormal asset turnover rate is less likely to be
driven by a relatively low market valuation of firm assets.
VI Robustness check
In a contemporaneous and independent paper, Gaspar, Massa, and Matos (2004) find that institu-
tional investors’ investment horizon impacts firms’ M&A activity. However, their study does not
address the potential endogeneity in institutional ownership. They also define activist investors
by membership in the Council of Institutional Investors (CII), the majority of which are private
pension funds and small public pension funds which outsource the management of their assets.
Song and Szewczyk (2003) find little evidence that the CII has been effective in its activist activ-
ity. This membership variable is unlikely to capture the activism impact by major public pension
funds. When I include investment horizon variables for various types of institutional investors in
the regressions, my results remain. A further discussion is beyond the scope of this paper. Chen,
Harford, and Li (2005) provide a more detailed study.
If I measure M&A activity by the deal size, the results are similar. The full sample includes
undisclosed deal value M&A. When I restrict the sample to M&A with disclosed deal value, I find
that 1% increase in the largest PPF ownership reduces about $109 million dollars in deal size. The
aggregate PPF ownership has a similar but smaller economic effect. Investment company ownership
encourages bigger deals on the other hand. 1% increase in the largest mutual fund ownership leads
to $79 million more in deal size. Moeller, Schlingemann, and Stulz (2003) find that value-reducing
M&A occurs mostly in big deals. Thus PPF’s negative effect on deal value may be correlated with
21
better M&A overall.
I also studied the sample of firms from 1980 to 1999 without the inclusion of executive compen-
sation data and insider ownership data (since those data are available only from 1992). The results
remain similar.
If I measure the institutional ownership using two different measures: 1) A dummy variable
which equals one if there is at least one 5% block holder within a category; 2) The Herfindahl
concentration, The results remain similar.
Bebchuk, Cohen, and Ferrell (2004) construct an entrenchment index based on six governance
provisions followed by the Investor Responsibility Research Center (IRRC). They show that these
six provisions fully drive the correlation identified by Gompers, Ishii, and Metrick (2003), and that
the other eighteen IRRC provisions in the governance index are not negatively correlated with
either firm value or stock returns during the 1990-2003 period. I replace the governance index with
their entrenchment index in the regressions. There is no material changes.
When I look at a much longer horizon, the negative relation between PPF ownership and future
M&A remains. I examine whether institutional ownership at the end of June, 1993 can predict
M&A frequency in the eight years from July, 1993 to June, 2000. A 1% increase in the largest PPF
ownership is associated with a 4% reduction in the number of M&As in eight years.
I also model the interaction between institutional ownership and future M&A using a simulta-
neous equations system. This model assumes that public pension fund ownership and firm M&A
activity can have reciprocal influence on each other. The results confirm that the negative impact
of PPF ownership on M&A activity is strong and significant.
22
VII Conclusions
As Holmstrom and Kaplan (2001) point out, the hostile takeover market, which served as a disci-
plinary force in the 1980s, has largely disappeared in the 1990s. Furthermore, various antitakeover
measures adopted by management in the 90s have rendered takeover market ineffective (Bebchuk,
Coates IV, and Subramanian (2002)). Black (1992) and Pound (1992) thus argue that the market-
and-transaction-based system of corporate governance has evolved into a political model of monitor-
ing. However, empirical research by Bebchuk and Cohen (2005), Yermack (1996), and Shivdasani
and Yermack (1999), among many others, have cast doubts on the effectiveness of monitoring by
the board of directors. There are also many studies examining institutional investor activism, yet
few existing ones have documented strong evidence.
My paper documents a strong effect on corporate M&A activity by one class of institutions,
major public pension funds. After controlling for ownership endogeneity, firm-level governance
structure, and firm characteristics, my study has shown that PPF ownership reduces the likelihood
of buying other firms. The reduction in M&A activity is greater in cases with higher potential
agency conflict, i.e., for firms with low q ratios but high free cash flows, and for firms seeking to
buy fast-growing targets. PPF ownership is also positively correlated with long-run M&A abnormal
returns. Overall, I believe that there is enough evidence to support the argument that public pension
funds are effective monitors of corporate M&A activity.
Ownership by investment companies is positively correlated with M&A likelihood among firms
with higher agency costs. The aggregate investment company ownership is negatively associated
with both announcement abnormal returns and long-run M&A abnormal returns. Given these
findings, investment companies appear to be the least likely monitors among all types of institutions.
The fact that investment company ownership is negatively correlated with M&A stock performance
23
in the long-run is not explained by the “preference” story, and may instead be more consistent with
the story that their presence encourages value-reducing activity by firm management. However,
Shleifer and Vishny (2003) demonstrate in their model that a rational manager may undertake an
acquisition when the stock is overvalued by an irrational market. In this scenario, M&A is not
value-reducing for bidder shareholders at all, despite the post-event drop in stock price as the true
valuation is revealed.
The variables on managerial incentives are primarily control variables in this study. It would
be interesting to further pursue the effect of managerial incentives on managers’ M&A decisions.
It is very possible that factors such as agency costs, which affect firms’ M&A activity, also affect
firm-level managerial incentives. This endogeneity problem should be addressed in further studies.
Appendix A: Measuring Performance
M&A bidder stock performance is measured by both the announcement abnormal return and the long-run abnormal return. For announcement abnormal returns, I follow standard event study methodologyto calculate CARs for the three-day window (-1,1) around the announcement date supplied by SDC. Theabnormal returns are estimated using a modified market model:
ARi = ri − rm,where ri is the return on firm i and rm is the value-weighted market index return. If there are mul-
tiple announcements during the 12-month period, I take the average abnormal announcement return of allannouncements during the period.
Measuring long-term abnormal performance is difficult. Barber and Lyon (1997) advocate the use ofbuy-and-hold abnormal returns over cumulative abnormal returns. They document that cumulative abnor-mal returns are most affected by new listing bias, and are generally positively biased, while buy-and-holdabnormal returns are generally negatively biased. Kothari and Warner (1997) caution that long-horizonabnormal returns are severely misspecified. Fama (1998) argues that formal inferences about long-term ab-normal returns should be based on averages or sums of short-term abnormal returns. Mitchell and Stafford(2000) show that the conventional methodology of calculating multi-year buy-and-hold abnormal returns andconducting inferences via a bootstrapping procedure is flawed because the abnormal returns for event firmsare not independent. After accounting for the positive cross-correlations of event firm abnormal returns, theyfind no abnormal performance in their sample of mergers, seasoned equity offerings, and share repurchases.Brav (2000) uses a Bayesian approach in estimating long-term abnormal returns and finds the three-factormodel to be inconsistent with the long-term performance of IPOs.
Since no one measure appears to be perfect, I examine all three measures of long-term abnormal returns:cumulative abnormal returns using the benchmark method, buy-and-hold abnormal returns, and cumulativeabnormal returns using Fama-French 3-factor model.
Each month, NYSE/AMEX ordinary common stocks with prior book-to-market values are sorted into10 size portfolios according to their market capitalizations at the beginning of the month. Within each sizeportfolio, these stocks are further sorted into 5 groups according to their book-to-market values. The breakingpoints for these 50 portfolios are used to place all ordinary common stocks with CRSP and COMPUSTAT
24
coverage and prior book-to-market values (to mitigate the new listing bias) into 50 benchmark portfolios.Cumulative abnormal returns (CAR, benchmarked) are calculated over 12 months for individual event
firms, including the announcement month. When there are multiple announcements during a year, CAR iscalculated starting from the announcement month of the first announcement.
CARi =∑12
t=1(Rit −Rbt),where Rit is the simple monthly return on the common stock of firm i. Rbt is the equal-weighted average
monthly return of its benchmark portfolio.Buy-and-hold abnormal returns (BHAR) are calculated over 12 months, including the announcement
month,BHARi =
∏12t=1(1 + Rit)−
∏12t=1(1 + Rbt).
Fama-French 3-factor monthly abnormal return is the αi from the time-series regression of the model:Rit −Rft = αi + βi(Rmt −Rft) + siSMBt + hiHMLt + εit,where Rft is the return on three-month Treasury bills, Rmt is the return on the value-weighted market
index, SMBt is the difference between the return on a portfolio of small stocks and the return on a portfolioof large stocks, and HMLt is the difference between the return on a portfolio of high book-to-market stocksand the return on a portfolio of low book-to-market stocks. Cumulative abnormal returns (CAR, 3-factor)are then calculated as 12 ∗ αi for individual event firms.
Abnormal post M&A operating performance is measured by changes in industry-adjusted operating cashflow returns, cash flow margins, and asset turnover rates that occur after the deal completion dates. Wefollow methodologies used both in Barber and Lyon (1996) and in Healy, Palepu, and Ruback (1992).
Barber and Lyon (1996) evaluate different methodologies used to measure accounting-based operatingperformance, and find the change models to be more desirable than the level models. Firm-level operatingperformance is adjusted by the industry median before M&A and after M&A. The changes in industry-adjusted performance are the measure of M&A abnormal operating performance.
• Operating cash flow return,
CF = Operating Income[13]+Depreciation[14]+Goodwill[204]Total Asset[6]-Book Value Of Equity[60]+Market Value Of Equity Beginning Of Year
AT = Sales[12]Total Asset[6]-Book Value Of Equity[60]+Market Value Of Equity Beginning Of Year
These operating performance measures are not affected by depreciation and goodwill. Thus, they allowcross-section comparison of firms which used purchase accounting method and firms which used pooling-of-interests accounting method. These measures are also not affected by the methods of financing used inmergers because the interest expense is not deducted.
These measures are then adjusted by subtracting industry medians. Industry-adjusted operating cashflow return(IACF), industry-adjusted cash flow margin on sales(IACFM), and industry-adjusted asset turnoverrate(IAAT) are calculated for the 3 years before the M&A completion year and the 3 years after the M&Acompletion year.
The majority of my M&A sample acquired private targets. For the small number of M&As with publiclytraded targets, pre-M&A operating performance is calculated as the weighted average between the bidderand the target. The weights are the bidder and the target’s market capitalizations at the beginning of theyear prior to the M&A completion year.
The median value of operating performance from the 3 years pre-M&A(IACFpre,i, IACFMpre,i, IAATpre,i)and the median value of operating performance from the 3 years post-M&A(IACFpost,i, IACFMpost,i,IAATpost,i) are used to calculate abnormal operating performance.
I use two methods of calculation. The first one follows Barber and Lyon (1996). It is the differencebetween post-M&A industry-adjusted performance and pre-M&A industry-adjusted performance:
25
AIACFi = IACFpost,i − IACFpre,i
AIACFMi = IACFMpost,i − IACFMpre,i
AIAATi = IAATpost,i − IAATpre,i
The second method follows Healy, Palepu, and Ruback (1992). Taking into consideration that pre-M&Aoperating performance may predict the post-M&A operating performance,
IACFpost,i = a1 + b1 ∗ IACFpre,i + εi1
IACFMpost,i = a2 + b2 ∗ IACFMpre,i + εi2
IAATpost,i = a3 + b3 ∗ IAATpre,i + εi3
These regressions are run on the whole sample of M&A observations to get estimates of the coefficients.The abnormal operating performance of the individual acquirer is thus calculated as,
Admati, Anat R., Paul Pfleiderer, and Josef Zechner, 1994, Large shareholder activism, risk sharing, andfinancial market equilibrium, Journal of Political Economy 102, 1097–1130.
Agrawal, Anup, Jeffrey F. Jaffe, and Gershon N. Mandelker, 1992, The post-merger performance of acquiringfirms: A re-examination of an anomaly, The Journal of Finance 47, 1605–1621.
Agrawal, Anup, and Gershon N. Mandelker, 1987, Managerial incentives and corporate investment andfinancing decisions, The Journal of Finance 42, 823–837.
Amihud, Yakov, and Baruch Lev, 1981, Risk reduction as a managerial motive for conglomerate mergers,Bell Journal of Economics 12, 605–617.
Andrade, Gregor, Mark Mitchell, and Erik Stafford, 2001, New evidence and perspectives on mergers, Journalof Economic Perspectives 15, 103–120.
Avery, Christopher, Judith A. Chevalier, and Scott Schaefer, 1998, Why do managers undertake acquisi-tion? an analysis of internal and external rewards to acquisitiveness, Journal of Law, Economics, andOrganization 14, 24–43.
Barber, Brad M., and John D. Lyon, 1996, Detecting abnormal operating performance: The empirical powerand specification of test statistics, Journal of Financial Economics 41, 359–399.
, 1997, Detecting long-run abnormal stock returns: The empirical power and specification of teststatistics, Journal of Financial Economics 43, 341–372.
Bartik, T. J., 1991, Who Benefits from State and Local Economic Development Policies? (Kalamazoo,MI:W.E. Upjohn Institute for Employment Research).
Bebchuk, Lucian Arye, John C. Coates IV, and Guhan Subramanian, 2002, The powerful antitakeover forceof staggered boards: Theory, evidence, and policy, Stanford Law Review 54, 887–951.
Bebchuk, Lucian Arye, and Alma Cohen, 2005, The costs of entrenched boards, Journal of Financial Eco-nomics 78, 409–433.
, and Allen Ferrell, 2004, What matters in corporate governance?, Harvard Law School Olin Discus-sion Paper No. 491.
Black, Bernard S., 1990, Shareholder passivity reexamined, Michigan Law Review 89, 520–608.
, 1992, Institutional investors and corporate governance: The case for institutional voice, Journal ofApplied Corporate Finance 5, 19–32.
Blanchard, Olivier Jean, and Lawrence F. Katz, 1992, Regional evolutions, Brookings Papers on EconomicActivity I, 1–75.
Brancato, Carolyn Kay, 1993, Patterns of institutional investment and control in the usa, InstitutionalInvestor Project, Center for Law & Economic Studies, Columbia University.
Brav, Alon, 2000, Inference in long-horizon event studies: A bayesian approach with application to initialpublic offerings, The Journal of Finance 55, 1979–2016.
Brickley, James A., Ronald C. Lease, and Clifford W. Smith, 1988, Ownership structure and voting onantitakeover amendments, Journal of Financial Economics 20, 267–291.
Chen, Xia, Jarrad Harford, and Kai Li, 2005, Monitoring: Which institutions matter?, working paper, SauderSchool of Business, University of British Columbia.
Coval, Joshua D., and Tobias J. Moskowitz, 2001, The geography of investment: Informed trading and assetprices, Journal of Political Economy 109, 811–841.
Davis, E. Philip, and Benn Steil, 2001, Institutional Investors (MIT Press: Cambridge, MA, and London,England).
27
Del Guercio, Diane, and Jennifer Hawkins, 1999, The motivation and impact of pension fund activism,Journal of Financial Economics 52, 193–340.
Fama, Eugene F., 1998, Market efficiency, long-term returns, and behavioral finance, Journal of FinancialEconomics 49, 283–306.
Gaspar, Jose-Miguel, Massimo Massa, and Pedro Matos, 2004, Shareholder investment horizons and themarket for corporate control, forthcoming Journal of Financial Economics.
Gillan, Stuart L., and Laura T. Starks, 2000, Corporate governance proposals and shareholder activism: Therole of institutional investors, Journal of Financial Economics 57, 275–305.
Gompers, Paul A., Joy L. Ishii, and Andrew Metrick, 2003, Corporate governance and equity prices, Quar-terly Journal of Economics 118, 107–155.
Gordon, Lilly A., and John Pound, 1993, Information, ownership structure, and shareholder voting: Evidencefrom shareholder-sponsored corporate governance proposals, The Journal of Finance 48, 697–718.
Hartzell, Jay C., and Laura T. Starks, 2002, Institutional investors and executive compensation, AFA 2003Washington, D.C. meetings.
Healy, Paul M., Krishna G. Palepu, and Richard S. Ruback, 1992, Does corporate performance improve aftermergers?, Journal of Financial Economics 31, 135–175.
Holmstrom, Bengt, and Steven N. Kaplan, 2001, Corporate governance and merger activity in the unitedstates: Making sense of the 1980s and 1990s, Journal of Economic Perspectives 15, 121–144.
Hotchkiss, Edith S., and Deon Strickland, 2003, Does shareholder composition matter? evidence from themarket reaction to corporate earnings announcements, The Journal of Finance 58, 1469–1498.
Jensen, Michael C., and William H. Meckling, 1976, Theory of the firm: Managerial behavior, agency costs,and ownership structure, Journal of Financial Economics 3, 305–360.
Jensen, Michael C., and Richard S. Ruback, 1983, The market for corporate control: the scientific evidence,Journal of Financial Economics 11, 5–50.
Karpoff, Jonathan M., Paul H. Malatesta, and Ralph A. Walkling, 1996, Corporate governance and share-holder initiatives: Empirical evidence, Journal of Financial Economics 42, 365–395.
Kothari, S.P., and Jerold B. Warner, 1997, Measuring long-horizon security price performance, Journal ofFinancial Economics 43, 301–339.
Lang, Larry H.P., Rene M. Stulz, and Ralph A. Walkling, 1991, A test of the free cash flow hypothesis: Thecase of bidder returns, Journal of Financial Economics 29, 315–335.
Loughran, Tim, and Anand M. Vijh, 1997, Do long-term shareholders benefit from corporate acquisitions,The Journal of Finance 52, 1765–1790.
Mitchell, Mark, Todd Pulvino, and Erik Stafford, 2004, Price pressure around mergers, The Journal ofFinance 59, 31–63.
Mitchell, Mark L., and Kenneth Lehn, 1990, Do bad bidders become good targets?, Journal of PoliticalEconomy 98, 372–398.
Mitchell, Mark L., and Erik Stafford, 2000, Managerial decisions and long-term stock price performance,Journal of Business 73, 287–329.
Moeller, Sara B., Frederik P. Schlingemann, and Rene M. Stulz, 2003, Firm size and the gains from acquisi-tions, Journal of Financial Economics 73, 201–228.
Morck, Randall, Andrei Shleifer, and Robert W. Vishny, 1990, Do managerial objectives drive bad acquisi-tions?, The Journal of Finance 45, 31–48.
Murphy, Kevin, and Karen Van Nuys, 1994, Governance, behavior, and performance of state and corporatepension funds, working paper.
28
Parrino, Robert, Richard W. Sias, and Laura T. Starks, 2003, Voting with their feet: Institutional ownershipchanges around forced ceo turnover, Journal of Financial Economics 68, 3–46.
Pound, John, 1988, Proxy contests and the efficiency of shareholder oversight, Journal of Financial Eco-nomics 20, 237–265.
, 1992, Raiders, targets, and politics: The history and future of american corporate control, Journalof Applied Corporate Finance 5, 6–18.
Prevost, Andrew K., and Ramesh P. Rao, 2000, Of what value are shareholder proposals sponsored by publicpension funds?, Journal of Business 73, 177–204.
Roe, Mark J., 1994, Strong Managers, Weak Owners: The Political Roots of American Corporate Finance(Princeton University Press: Princeton, New Jersey).
Roll, Richard, 1986, The hubris hypothesis of corporate takeovers, Journal of Business 59, 197–216.
Romano, Roberta, 1993, Public pension fund activism in corporate governance reconsidered, Columbia LawReview 93, 795–853.
Shivdasani, Anil, and David Yermack, 1999, Ceo involvement in the selection of new board members: Anempirical analysis, The Journal of Finance 54, 1829–1853.
Shleifer, Andrei, and Robert Vishny, 2003, Stock market driven acquisitions, forthcoming, Journal of Finan-cial Economics.
Shleifer, Andrei, and Robert W. Vishny, 1986, Large shareholders and corporate control, Journal of PoliticalEconomy 94, 461–488.
, 1989, Managerial entrenchment: The case of manager-specific investments, Journal of FinancialEconomics 25, 123–139.
Song, Wei-Ling, and Samuel H Szewczyk, 2003, Does coordinated institutional investor activism reverse theforturnes of underperforming firms?, Journal of Financial and Quantitative Analysis 38, 317–336.
Staiger, Douglas, and James H. Stock, 1997, Instrumental variables regression with weak instruments, Econo-metrica 65, 557–586.
Van Nuys, Karen, 1993, Corporate governance through the proxy process: Evidence from the 1989 honeywellproxy solicitation, Journal of Financial Economics 34, 101–132.
Wahal, Sunil, 1996, Pension fund activism and firm performance, Journal of Financial and QuantitativeAnalysis 31, 1–23.
Woidtke, Tracie, 2002, Agents watching agents? evidence from pension fund ownership and firm value,Journal of Financial Economics 63, 99–131.
Wooldridge, Jeffrey M., 2001, Econometric Analysis of Cross Section and Panel Data (MIT Press: Cam-bridge, MA).
Yermack, David, 1996, Higher market valuation of companies with a small board of directors, Journal ofFinancial Economics 40, 185–211.
29
Tab
leI:
Dat
aSo
urce
san
dD
efini
tion
s
Aggre
gate
inst
ituti
onalhold
ings
Thom
son
Fin
anci
al
aggre
gate
inst
ituti
onalow
ner
ship
by
each
cate
gory
,in
per
cent,
at
the
end
ofJune,
yea
rt+
1Top
indiv
idualin
stit
uti
onalhold
ings
Thom
son
Fin
anci
al
hig
hes
tin
div
idual
inst
ituti
onal
owner
ship
wit
hin
each
cate
gory
,in
per
cent,
at
the
end
of
June,
yea
rt+
15%
inst
ituti
onalblo
ckhold
erdum
my
Thom
son
Fin
anci
al
1=
atle
ast
one
indiv
idualin
stit
uti
on
wit
hatle
ast
5%
owner
ship
;0=
no
indiv
idualin
stit
uti
on
wit
hat
least
5%
owner
ship
,w
ithin
each
cate
gory
,at
the
end
ofJune,
yea
rt+
1In
stit
uti
onalow
ner
ship
conce
ntr
ati
on
Thom
son
Fin
anci
al
Her
findahl-in
dex
mea
sure
of
conce
ntr
ati
on
(sum
of
the
square
sof
indiv
idual
owner
ship
)/
aggre
gate
owner
ship
,in
each
cate
gory
Mer
ger
sand
acq
uis
itio
ns
dum
my
SD
C1=
ther
eis
at
least
one
M&
Aannounce
men
tduri
ng
the
12-m
onth
per
iod:
July
t+1
–June
t+2;0=
no
M&
Aannounce
men
tduri
ng
the
sam
e12-m
onth
per
iod
Gov
ernance
index
Gom
per
s,Is
hii,&
Met
rick
mea
sure
ssh
are
hold
erri
ghts
,sm
aller
num
ber
indic
ate
sbet
ter
gov
ernance
pro
vis
ions,
“C
or-
pora
teG
over
nance
and
Equity
Pri
ces,
”T
he
Quart
erly
Journ
alofEco
nom
ics,
Feb
.2003
Insi
der
owner
ship
EX
EC
UC
OM
Paggre
gate
insi
der
owner
ship
ofto
p5
exec
uti
ves
,in
per
cent,
duri
ng
yea
rt
CE
Osa
lary
and
bonus
EX
EC
UC
OM
PC
EO
annualsa
lary
and
bonus,
inm
illions
ofdollars
CE
Oopti
ons
(%ofco
mpen
sati
on)
EX
EC
UC
OM
Popti
on
gra
nte
das
the
per
centa
ge
of
CE
Oto
talco
mpen
sati
on.
Tota
lco
mpen
sati
on
isco
m-
pri
sed
of
the
follow
ing:
sala
ry,bonus,
oth
erannualco
mpen
sati
on,to
talva
lue
of
rest
rict
edst
ock
gra
nte
d,
tota
lva
lue
of
stock
opti
ons
gra
nte
d,
long-t
erm
ince
nti
ve
pay
outs
,and
all
oth
ers.
CP
I,base
yea
r1992
U.S
.D
epart
men
tofLabor
Consu
mer
Pri
ceIn
dex
-all
urb
an
consu
mer
s,U
.S.all
item
sse
ries
,in
dex
=1
for
yea
r1992
Tota
lass
ets
CO
MP
USTA
Tto
talbook
ass
ets[
6]/
CP
I,base
yea
r1992
Siz
eC
OM
PU
STA
Tln
(tota
lass
ets[
6]/
CP
I,base
yea
r1992)
Mark
etca
pit
aliza
tion
CR
SP
mark
etca
pit
aliza
tion
at
the
end
ofca
lendar
yea
r/
CP
I,base
yea
r1992
Cash
flow
rati
oC
OM
PU
STA
T(e
bit
da[1
3]-
inte
rest
[15]-
tax[1
6-∆
35]-
com
mon
div
iden
ds[
21]-
pre
ferr
eddiv
iden
ds[
19])
/(t
ota
lass
ets[
6]-
cash
and
cash
equiv
ale
nts
[1])
Capit
alex
pen
dit
ure
sra
tio
CO
MP
USTA
Tca
pit
al
expen
dit
ure
s[128]
/(t
ota
lass
ets[
6]
-ca
shand
cash
equiv
ale
nts
[1])
,av
eraged
over
thre
eyea
rs(t
,t+
1and
t+2)
Lev
erage
rati
oC
OM
PU
STA
T(c
urr
ent
deb
t[34]+
long-t
erm
deb
t[9])
/(t
ota
lass
ets[
6]-
cash
and
cash
equiv
ale
nts
[1])
Qra
tio
CO
MP
USTA
T(m
ark
etca
pit
aliza
tion
+lo
ng-t
erm
deb
t[9]+
curr
ent
deb
t[34]+
pre
ferr
edst
ock
valu
e[130])
/to
talass
ets[
6]
Cash
rich
nes
sC
OM
PU
STA
T(c
ash
and
cash
equiv
ale
nts
[1]
-cu
rren
tdeb
t[34])
/(t
ota
lass
ets[
6]
-ca
shand
cash
equiv
a-
lents
[1])
Indust
rialco
nce
ntr
ati
on
CO
MP
USTA
TH
erfindahl-in
dex
calc
ula
ted
usi
ng
sale
sdata
[12],
base
don
4-d
igit
SIC
code
Sale
sgro
wth
CO
MP
USTA
T1-y
ear
sale
sgro
wth
rate
Targ
etsa
les
gro
wth
CO
MP
USTA
T3-y
ear
sale
sgro
wth
rate
ofth
eta
rget
pri
or
toM
&A
1
Table II: Descriptive StatisticsThe sample (6,681 observations) are all Execucomp firms (1992 – 1999) issuing ordinary common shares, withGovernance index available, and excluding utilities, finance and insurance companies and government agencies.The institutional ownership data is from the end of June the following year. Therefore, there is a lag of minimumsix months between the firm characteristics data (including the insider ownership and executive compensationdata) and the institutional ownership data to ensure that characteristics-related information is all public. Theinstitutional “acquisition preference”, FundScorejt, was derived from the composition of the largest investor’sportfolio within each category. This “preference” was then used to construct the first instrumental variable forinstitutional ownership, which is the error term (eit) in a fixed effect regression of institutional ownership regressedon this “preference”, InstOwnershipit = α + βFundScorejt + ui + eit. By construction, this error term, called“NA” ownership, is orthogonal to the acquisition-related institutional ownership. The second instrument variableborrows the concept from so-called “Bartik” instrument. It is the interaction between an institutional investor’spropensity to invest in each firm and its portfolio size. Each institutional investor j’s propensity to invest in afirm i is measured as ui, the firm-level fixed effect, from the following estimation by each institutional investor:InstOwnershipit = α + βFundSizet + ui + eit.
Mean Median Std Dev Min Max
Ownership DataAggregate public pension fund holdings (%) 3.14 2.44 2.47 0.00 20.25Aggregate investment company holdings (%) 12.92 10.79 9.19 0.00 59.59Aggregate other institutional holdings (%) 41.562 42.357 14.080 0.000 99.914Largest individual public pension fund holdings (%) 1.42 0.80 1.81 0.00 18.39Largest individual investment company holdings (%) 5.57 4.59 4.01 0.00 50.13Largest individual other institutional holdings (%) 7.071 5.850 4.963 0.000 57.104
CEO CompensationCEO cash compensation (millions, CPI-adjusted) 0.96 0.74 0.86 0.00 15.71CEO options (% of total compensation) 29.99 25.99 27.78 0.00 100
Industry CharacteristicsLn(industrial concentration) 8.00 8.12 0.87 5.29 9.21
Stock Return Data (%)Pre-M&A
CAR benchmarked, July t – June t+1 0.99 −0.78 41.48 −224.20 774.26CAR 3-factor, July t – June t+1 2.64 1.21 41.53 −76.71 105.31Buy-and-hold return, July t – June t+1 1.60 −5.85 53.40 −125.66 958.21
Table V: Performance of Low Q and “Buying-growth” Acquirers
This table reports the means and medians of short-term and long-term M&A performancemeasures among subgroups of observations. Each year, firms with q ratios less than the samplemedian are defined to be low q firms. Cash richness is defined as the ratio of non-current-debtcash and cash equivalents to non-cash total assets. Each year, firms with above industry (by4-digit SIC code) median cash richness are defined to be cash rich firms, otherwise they are cashpoor firms. In the subsample of M&A observation for which target pre-M&A three-year salesgrowth rates are available, deals with target sales growth rates above the median are defined to be“buying-growth,” otherwise “non-buying-growth.”
cash rich, low q cash poor, low q# of obs 483 479
mean median mean medianAnnouncement abnormal return 0.29 0.18 0.68*** 0.46Announcement value-weighted AR −0.04 0.05Long-term CAR, benchmarked 0.54 0.01 0.64 0.25Long-term CAR, 3-factor −0.28 −1.82 4.45** 2.90Long-term BHAR −0.34 −5.54 0.67 −2.76
* significantly different from zero at 10%; ** significantly different from zero at 5%; *** significantly different from zero at 1%
6
Tab
leV
I:Low
QFir
ms
This
table
report
sth
em
arg
inal
effec
tsfo
rth
epoole
dlo
git
regre
ssio
ns,
and
the
coeffi
cien
tsfo
rth
eIV
regre
ssio
ns
wit
hfirm
-lev
eleff
ects
.T
he
subsa
mple
isre
stri
cted
tolo
wq
firm
sw
ith
diff
eren
tca
shhold
ing
level
s.For
equati
ons
1,3,4,7,and
8,in
stit
uti
onalow
ner
ship
sare
mea
sure
dby
the
aggre
gate
hold
ing
level
s.For
equati
ons
2,5,6,9,and
10,th
eyare
mea
sure
dby
the
larg
est
indiv
idualhold
ing
level
s.O
ther
contr
ols
are
the
sam
eas
those
use
din
Table
IV.
Each
yea
r,firm
sw
ith
qra
tio
less
than
the
sam
ple
med
ian
are
defi
ned
tobe
low
qfirm
s.C
ash
rich
nes
sis
defi
ned
as
the
rati
oofnon-c
urr
ent-
deb
tca
shand
cash
equiv
ale
nts
over
non-c
ash
tota
lass
et.
Each
yea
r,firm
sw
ith
abov
ein
dust
rym
edia
nca
shri
chnes
sare
defi
ned
tobe
cash
rich
firm
s,oth
erw
ise
cash
poor
firm
s.T
her
eare
ato
talof1,5
54
cash
-ric
hfirm
-yea
rsand
643
cash
rich
firm
s,and
ato
talof2,1
69
cash
poor
firm
-yea
rsand
747
cash
poor
firm
s.W
het
her
the
med
ian
isdefi
ned
as
cash
rich
or
cash
poor
does
not
matt
er.
Cash
rich
,lo
wq,
Dep
enden
tva
riable
—1=
M&
A(2
5.2
%);
0=
no
M&
APoole
dlo
git
Inst
rum
ent
Ver
sion
IB
art
ikIn
stru
men
t(1
)(2
)(3
)(4
)(5
)(6
)(7
)(8
)(9
)(1
0)
(11)
(12)
(13)
(14)
aggre
gate
larg
est
aggre
gate
larg
est
aggre
gate
larg
est
PP
F[-0.0
15]*
**
[-0.0
21]*
**
-0.0
16**
-0.0
16**
-0.0
13**
-0.0
21**
-0.0
21**
-0.0
18*
-0.0
66**
-0.0
70*
-0.0
76
-0.0
97**
-0.0
73
-0.0
54
Inves
tmen
tC
o.
[0.0
03]*
[0.0
06]*
*0.0
05**
0.0
05**
0.0
05*
0.0
11***0.0
11***0.0
08**
0.0
09
0.0
08
0.0
04
0.0
17
0.0
23
0.0
15
Oth
ers
[0.0
02]*
[0.0
01]
0.0
00
0.0
01
-0.0
01
-0.0
00
0.0
11
0.0
27
0.0
36
0.0
44
Oth
erco
ntr
ols
Yes
Yes
No
No
Yes
No
No
Yes
No
No
Yes
No
No
Yes
Yea
rfixed
effec
tsY
esY
esY
esY
esY
esY
esY
esY
esY
esY
esY
esY
esFir
mfixed
effec
tsY
esY
esY
esY
esY
esY
esY
esY
esY
esY
esY
esY
esIn
dust
ryfixed
effec
tsY
esY
esN
oN
oN
oN
oN
oN
oN
oN
oN
oN
o
Cash
poor,
low
q,D
epen
den
tva
riable
—1=
M&
A(2
6.7
%);
0=
no
M&
AP
PF
[-0.0
03]
[-0.0
01]
0.0
05
0.0
04
0.0
08
0.0
06
0.0
07
0.0
09
-0.0
36
0.0
38
0.0
51
-0.0
55
-0.0
57
-0.0
62
Inves
tmen
tC
o.
[0.0
03]*
*[0
.005]*
0.0
02
0.0
02
0.0
01
0.0
03
0.0
03
0.0
02
0.0
16
0.0
16
0.0
15
0.0
28
0.0
28
0.0
30
Oth
ers
[0.0
02]*
*[0
.000]
0.0
03**
0.0
02*
0.0
03
0.0
03
-0.0
36
-0.0
38
-0.0
36
-0.0
62
Oth
erco
ntr
ols
Yes
Yes
No
No
Yes
No
No
Yes
No
No
Yes
No
No
Yes
Yea
rfixed
effec
tsY
esY
esY
esY
esY
esY
esY
esY
esY
esY
esY
esY
esFir
mfixed
effec
tsY
esY
esY
esY
esY
esY
esY
esY
esY
esY
esY
esY
esIn
dust
ryfixed
effec
tsY
esY
esN
oN
oN
oN
oN
oN
oN
oN
oN
oN
o
*si
gnifi
cant
at
10%
;**
signifi
cant
at
5%
;***
signifi
cant
at
1%
7
Table VII: “Buying-Growth” M&A
This table reports the marginal effects from logistic regressions on the subsample with target sales growth ratesavailable. The robust standard errors were estimated using a Huber-White “sandwich estimator” and adjusted forfirm level clustering. Target sales growth rate is the three-year growth rate prior to takeover. The median growthrate of the sample is used as the benchmark. Other controls included are the same as in Table IV.
* significant at 10%; ** significant at 5%; *** significant at 1%
8
Tab
leV
III:
Lon
g-te
rmA
bnor
mal
Ret
urns
This
table
report
sth
eco
effici
ents
from
regre
ssio
ns
wit
hfirm
level
effec
tsex
am
inin
gth
ere
lati
on
bet
wee
nin
stit
uti
onalow
ner
ship
and
long-t
erm
M&
Aper
form
ance
.Long-t
erm
per
form
ance
ism
easu
red
usi
ng
thre
ediff
eren
tm
ethods.
Dep
enden
tva
riable
-abnorm
alre
turn
s12
month
sin
cludin
gannounce
men
tm
onth
CA
R,ben
chm
ark
edC
AR
,3-fact
or
BH
AR
Aggre
gate
Larg
est
Aggre
gate
Larg
est
Aggre
gate
Larg
est
PP
F0.1
46
0.4
01**
1.0
99
2.9
58**
0.4
44
2.0
30
Inves
tmen
tco
mpanie
s−
0.0
61**
−0.0
42
−0.9
58***
-0.0
05
−1.3
08***
−0.8
46*
Oth
ers
−0.0
36*
−0.0
14
−0.5
48***
0.8
42*
−0.2
83
1.1
17**
Yea
rD
um
mie
sY
esY
esY
esFir
m-lev
eleff
ects
Yes
Yes
Yes
Obse
rvati
ons
2,0
13
2,0
15
2,0
13
Num
ber
offirm
s825
826
825
*si
gnifi
cant
at
10%
;**
signifi
cant
at
5%
;***
signifi
cant
at
1%
9
Tab
leIX
:A
sset
Tur
nove
ran
dIn
stit
utio
nalO
wne
rshi
p
This
table
report
sth
eco
effici
ents
from
panel
data
regre
ssio
ns.
The
dep
enden
tva
riable
,abnorm
alass
ettu
rnov
erra
te,
isth
ech
ange
inin
dust
ry-a
dju
sted
ass
ettu
rnov
erra
te(I
AA
T)
post
M&
Aco
mple
tion.
The
left
panel
follow
sth
em
ethod
inH
ealy
,Pale
pu,
and
Ruback
(1992).
The
right
panel
follow
sth
em
ethod
inB
arb
erand
Lyon
(1996).
Dep
enden
tva
riable
-abnorm
alass
ettu
rnov
erIA
AT
post,
i-
(−0.3
58
+0.8
50IA
AT
pre,i)
IA
AT
post,
i-
IA
AT
pre,i
Aggre
gate
Larg
est
Aggre
gate
Larg
est
PP
F1.7
23***
3.0
57***
1.8
81***
3.0
38***
Inves
tmen
tC
o.
0.0
90
0.2
75
0.0
90
0.2
07
Oth
ers
−0.4
16***
−0.2
00
−0.4
51***
−0.2
80
Yea
rfixed
effec
tsY
esFir
mle
vel
effec
tsY
esO
bse
rvati
ons
1,7
43
Num
ber
offirm
s734
*si
gnifi
cant
at
10%
;**
signifi
cant
at
5%
;***
signifi
cant
at
1%
10
Table X: For The Referee — Comparison between M&A Firm-years and Non-M&A Firm-years
This table reports the mean values of variables for M&A firm-year observations and non-M&A firm-year observations.P-values from ranksum tests on the means are reported in parentheses. There are 2,022 M&A firm-years, and 4,659non-M&A firm-years.
mean values P-valueM&A non-M&A
Aggregate public pension ownership (%) 2.98 3.10 (0.030)Aggregate investment co. ownership (%) 14.01 11.93 (0.000)Aggregate insurance co. ownership (%) 5.57 4.82 (0.000)Aggregate private pension ownership (%) 1.16 0.97 (0.000)Aggregate bank ownership (%) 11.04 9.82 (0.000)Aggregate indep. advisor ownership (%) 25.29 24.65 (0.023)Largest public pension ownership 1.23 1.50 (0.000)Largest investment co. ownership 5.91 5.42 (0.000)Largest insurance co. ownership 2.66 2.47 (0.000)Largest private pension ownership 1.01 1.03 (0.003)largest bank ownership 3.28 3.34 (0.000)Largest indep. advisor ownership 5.48 5.70 (0.003)Governance index 9.49 9.16 (0.000)Insider ownership (%) 3.44 4.79 (0.000)Total assets (millions, CPI-adjusted) 3,698.11 2,695.93 (0.000)Market capitalization (millions, CPI-adjusted) 6,903.50 3,587.34 (0.000)Cash flow ratio (%) 11.31 9.42 (0.000)Q ratio 2.16 1.76 (0.000)Leverage ratio (%) 24.72 26.26 (0.063)Capital expenditures ratio (%) 7.27 8.17 (0.000)Sales growth(%) 16.02 12.40 (0.000)CAR, benchmarked (June, year t - July, year t+1) 5.77 −1.09 (0.000)CAR, 3-factor (June, year t - July, year t+1) 7.17 0.67 (0.000)BHAR (June, year t - July, year t+1) 8.08 −1.21 (0.000)# of obs 2,022 4,659
11
Tab
leX
I:Fo
rT
heR
efer
ee—
Cor
rela
tion
sA
mon
gK
eyV
aria
bles
Agg
rega
tein
stit
utio
nalow
ners
hip
wit
hin
each
cate
gory
Pub
licIn
vt.
Insu
.P
riva
teIn
dep.
Gov
er.
Futu
reP
rior
Pri
orLn(
Mkt
pens
ion
Co.
Co.
pens
ion
Ban
ksad
viso
rsin
dex
M&
Ago
odba
dC
ap)
M&
AM
&A
Pub
licpe
nsio
n1.
00In
vest
men
tC
o.−
0.11
1.00
Insu
ranc
eC
o.0.
040.
151.
00P
riva
tepe
nsio
n0.
06−
0.04
0.03
1.00
Ban
ks0.
14−
0.05
0.11
0.13
1.00
Inde
p.ad
viso
rs0.
080.
140.
14−
0.02
0.02
1.00
Gov
erna
nce
inde
x0.
08−
0.02
0.07
0.07
0.19
0.06
1.00
Futu
reM
&A
0.09
0.09
−0.
020.
040.
100.
030.
061.
00P
rior
good
M&
A0.
040.
03−
0.03
−0.
010.
060.
030.
020.
221.
00P
rior
bad
M&
A0.
040.
05−
0.02
0.04
0.06
0.01
0.04
0.17
−0.
181.
00Ln(
Mar
ket
Cap
)−
0.02
0.24
0.16
0.16
0.35
−0.
140.
110.
190.
100.
111.
00
12
Table XII: For The Referee — Predicting M&A Frequency in the Long-run
This table reports the percent changes in Incident Rate Ratios (IRR) and P-values from negative binomialregressions. The dependent variable is the number of M&A years during the eight years of the sample (July 1993- June 2001). The independent variables are for observations in year 1992. Negative binomial regression is usedbecause the goodness-of-fit test indicates overdispersion of the Poisson model. IRR (ecoefficient) represents the factorchange in the expected count for unit increase in the independent variable. Percent change in IRR = (IRR-1)*100.Other controls include the governance index, leverage ratio, insider ownership, CEO cash compensation, Q ratio,prior CAR, and industrial concentration. Their coefficients are not significant.
Dependent var — # of M&A years during the period of study
Other controls Yes# of Observations 566Pseudo R-squared 0.05 0.05 0.05 0.05Overdispersion P-value 0.00 0.00 0.00 0.00
* significant at 10 %; ** significant at 5%; *** significant at 1%
13
Table XIII: For The Referee — Simultaneous Equations Analysis on PPF Impact
This table reports the coefficients and standard errors from the simultaneous equations estimations. The linearsystem assumes that both the PPF ownership variable and the M&A activity dummy variable are endogenous. Thecontrol variables are the same as in Table III and Table IV. Their coefficients and significance are also similar tothose reported in Table III and Table IV.
* significant at 10 %; ** significant at 5%; *** significant at 1%
14
Table XIV: For The Referee — Post-M&A Operating Performance
Panel A reports the median operating cash flow return on market value of assets, median cashflow margin, andmedian asset turnover rate for the M&A firms in years surrounding the M&A completion year. Panel B reports thesummary statistics on abnormal operating performance. The first method looks at the changes of industry-adjustedmeasures (operating cash flow return, cash flow margin on sales, and asset turnover rate). The second method isregression-based, with standard errors reported in parentheses. The median value of firm-level industry-adjustedoperating performance from the three years after M&A are regressed on the median value from the three years priorto M&A. The difference between post-M&A performance and the predicted performance measures the abnormalperformance.
Panel AOperating cash flow returns Cash flow margin on sales Asset turnover ratio
Year relative Firm Industry-adj # of Firm Industry-adj # of Firm Industry-adj # ofto M&A median median obs median median obs median median obs