F U E L P R O C E S S I N G T E C H N O L O G Y 8 9 ( 2 0 0 8 ) 8 1 9 – 8 2 7
www.e l sev i e r. com/ loca te / fup roc
Selective cracking of natural gasoline over HZSM-5 zeolite
Marcelo J.B. Souzaa, Fabiano A.N. Fernandesb,⁎, Anne M.G. Pedrosac, Antonio S. Araujoc
aUniversidade Federal de Sergipe, Departamento de Engenharia Química, Cidade Universitária Prof. José Aloísio de Campos,CEP 49100-000, Aracaju/SE, BrazilbUniversidade Federal do Ceará, Departamento de Engenharia Química, Campus do Pici, Bloco 709, 60455-760, Fortaleza/CE, BrazilcUniversidade Federal do Rio Grande do Norte, Departamento de Química, Campus Universitário, 59078-970, Natal/RN, Brazil
Article history:Received 29 October 2007Received in revised form13 December 2007Accepted 31 December 2007
This work presents a study on the catalytic cracking of natural gasoline (extracted fromnatural gas) over HZSM-5 zeolite. A factorial planning was carried out to evaluate the effectof temperature and W/F ratio on the cracking of natural gasoline, analyzing their effects onconversion and product distribution using an analysis based on surface responsemethodology. The process was optimized focusing on the maximization of the massfractions and the production of specific products such as ethene, propene and butanes. Theresults have shown that the maximum selectivity and hourly mass production of ethene isobtained at high temperature (450 °C) and low catalyst weight to flow rate ratio (W/F) (7.2 to8.2 gcat h/mol). Maximum selectivity of propene is obtained at 350 °C and 7.0 gcat h/mol, whilethe best condition for maximum mass production is found at 421 °C and 5.7 gcat h/mol. Thehighest mass production of butanes is favored by high temperature (450 °C) and mid rangeW/F ratios (12.1 gcat h/mol), while the highest selectivity is found at low temperature (350 °C).
Natural gas is a mixture of hydrocarbons such as methane(main component), ethane, propane, butane and nature gaso-line (pentane, hexane and heptane). During the processing ofnatural gas, natural gasoline cut is condensed and separatedfrom the gaseous products. It can be sold as such or can becracked selectively to produce other hydrocarbons such asethene and propene to the plastic industry or as propane andbutane to LPG (liquefied petroleum gas) production.
Hydrocracking is an important process in the petroleumrefining industry to produce feedstocks. Current hydrocrack-ing processes are based on commercial catalysts that areeffective above 450 °C. The development of new catalysts thatcan present high activity under lower temperatures mayincrease the operational and economical benefits of hydro-cracking processes [1].
Hydrocracking is also the industrial process with thelargest consumption of catalyst and even small achievements
in yield and selectivity will have a very significant economicaland ecological impact. These improvements can be obtainedatmany levels, from the design of new and improved catalyststo the optimization of reaction conditions [2]. In this work anew zeolite-based catalyst was developed and the bestoperating condition for the reaction was investigated.
Zeolites are used in catalytic and separation technologies,especially, in processing of hydrocarbons; therefore, theiradsorptive properties are considered important. Adsorption ofn-pentane, n-hexane and n-heptane on MFI-type molecularsieves (HZSM-5 zeolites) has attracted attention of manyresearchers because of the complex adsorption profilesobserved in this system [3–8]. The adsorption isotherms ofn-pentane and n-hexane on MFI show a step at the loadingcorresponding to four molecules per unit cell [3–5]. Theadsorption of n-hexane observed on MFI molecular sievesfollows a two-step adsorption pathway due to two differentadsorption sites in the micropore system, fact supported bysatisfactory fitting of adsorption profiles with functions
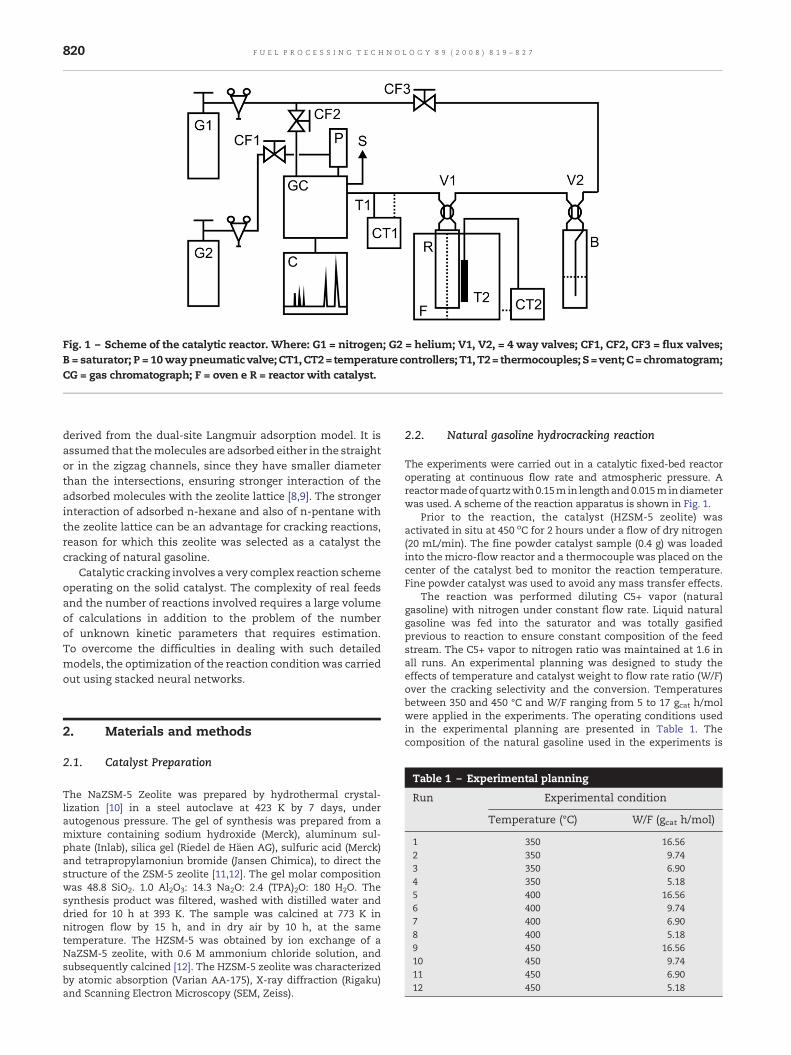
Fig. 1 – Scheme of the catalytic reactor. Where: G1 = nitrogen; G2 = helium; V1, V2, = 4 way valves; CF1, CF2, CF3 = flux valves;B = saturator; P = 10way pneumatic valve; CT1,CT2= temperature controllers; T1,T2= thermocouples; S=vent; C= chromatogram;CG = gas chromatograph; F = oven e R = reactor with catalyst.
820 F U E L P R O C E S S I N G T E C H N O L O G Y 8 9 ( 2 0 0 8 ) 8 1 9 – 8 2 7
derived from the dual-site Langmuir adsorption model. It isassumed that themolecules are adsorbed either in the straightor in the zigzag channels, since they have smaller diameterthan the intersections, ensuring stronger interaction of theadsorbed molecules with the zeolite lattice [8,9]. The strongerinteraction of adsorbed n-hexane and also of n-pentane withthe zeolite lattice can be an advantage for cracking reactions,reason for which this zeolite was selected as a catalyst thecracking of natural gasoline.
Catalytic cracking involves a very complex reaction schemeoperating on the solid catalyst. The complexity of real feedsand the number of reactions involved requires a large volumeof calculations in addition to the problem of the numberof unknown kinetic parameters that requires estimation.To overcome the difficulties in dealing with such detailedmodels, the optimization of the reaction condition was carriedout using stacked neural networks.
The NaZSM-5 Zeolite was prepared by hydrothermal crystal-lization [10] in a steel autoclave at 423 K by 7 days, underautogenous pressure. The gel of synthesis was prepared from amixture containing sodium hydroxide (Merck), aluminum sul-phate (Inlab), silica gel (Riedel de Häen AG), sulfuric acid (Merck)and tetrapropylamoniun bromide (Jansen Chimica), to direct thestructure of the ZSM-5 zeolite [11,12]. The gel molar compositionwas 48.8 SiO2. 1.0 Al2O3: 14.3 Na2O: 2.4 (TPA)2O: 180 H2O. Thesynthesis product was filtered, washed with distilled water anddried for 10 h at 393 K. The sample was calcined at 773 K innitrogen flow by 15 h, and in dry air by 10 h, at the sametemperature. The HZSM-5 was obtained by ion exchange of aNaZSM-5 zeolite, with 0.6 M ammonium chloride solution, andsubsequently calcined [12]. The HZSM-5 zeolite was characterizedby atomic absorption (Varian AA-175), X-ray diffraction (Rigaku)and Scanning Electron Microscopy (SEM, Zeiss).
2.2. Natural gasoline hydrocracking reaction
The experiments were carried out in a catalytic fixed-bed reactoroperating at continuous flow rate and atmospheric pressure. Areactormadeofquartzwith0.15m in lengthand0.015mindiameterwas used. A scheme of the reaction apparatus is shown in Fig. 1.
Prior to the reaction, the catalyst (HZSM-5 zeolite) wasactivated in situ at 450 oC for 2 hours under a flow of dry nitrogen(20 mL/min). The fine powder catalyst sample (0.4 g) was loadedinto themicro-flow reactor and a thermocouple was placed on thecenter of the catalyst bed to monitor the reaction temperature.Fine powder catalyst was used to avoid any mass transfer effects.
The reaction was performed diluting C5+ vapor (naturalgasoline) with nitrogen under constant flow rate. Liquid naturalgasoline was fed into the saturator and was totally gasifiedprevious to reaction to ensure constant composition of the feedstream. The C5+ vapor to nitrogen ratio was maintained at 1.6 inall runs. An experimental planning was designed to study theeffects of temperature and catalyst weight to flow rate ratio (W/F)over the cracking selectivity and the conversion. Temperaturesbetween 350 and 450 °C and W/F ranging from 5 to 17 gcat h/molwere applied in the experiments. The operating conditions usedin the experimental planning are presented in Table 1. Thecomposition of the natural gasoline used in the experiments is
Table 2 – Chemical composition of natural gasoline,provided by Petrobras-UPGN Guamaré (componentsmass fractions)
821F U E L P R O C E S S I N G T E C H N O L O G Y 8 9 ( 2 0 0 8 ) 8 1 9 – 8 2 7
shown in Table 2 and were provided by Petrobras (UPGN Guamaré,RN, Brazil).
Under the given conditions, C5+ underwent cracking to C2, C3and C4 paraffins and C2 and C3 olefins. The reaction productswere analyzed by an online gas chromatograph with massspectrum (Shimadzu model QP 5000) using a Chromopack CP-Al2O3/KCl capillary column (50 m long, 0.32 m in diameter). Thechromatograph was operated under the following conditions:column temperature of 100 °C, interface temperature of 200 °C andinjector temperature of 200 °C, using helium as mobile phase. Theconversion rate of the feedstock (natural gasoline) was calculatedby the summation of the formation rate of the products.
2.3. Optimization procedure
The optimization procedure used to obtain the best operatingcondition to enhance the productivity and selectivity of someproduct derived from natural gasoline was based on the use ofneural networks. Neural networks have attracted great interest aspredictive models, as well as for pattern recognition. Neuralnetworks have the ability of learning the behavior of the processand the relationships between variables, without needing amodelof the phenomenological laws that rule the system. The success inobtaining a reliable and robust network depends strongly on thechoice of process variables involved, as well as the available sets of
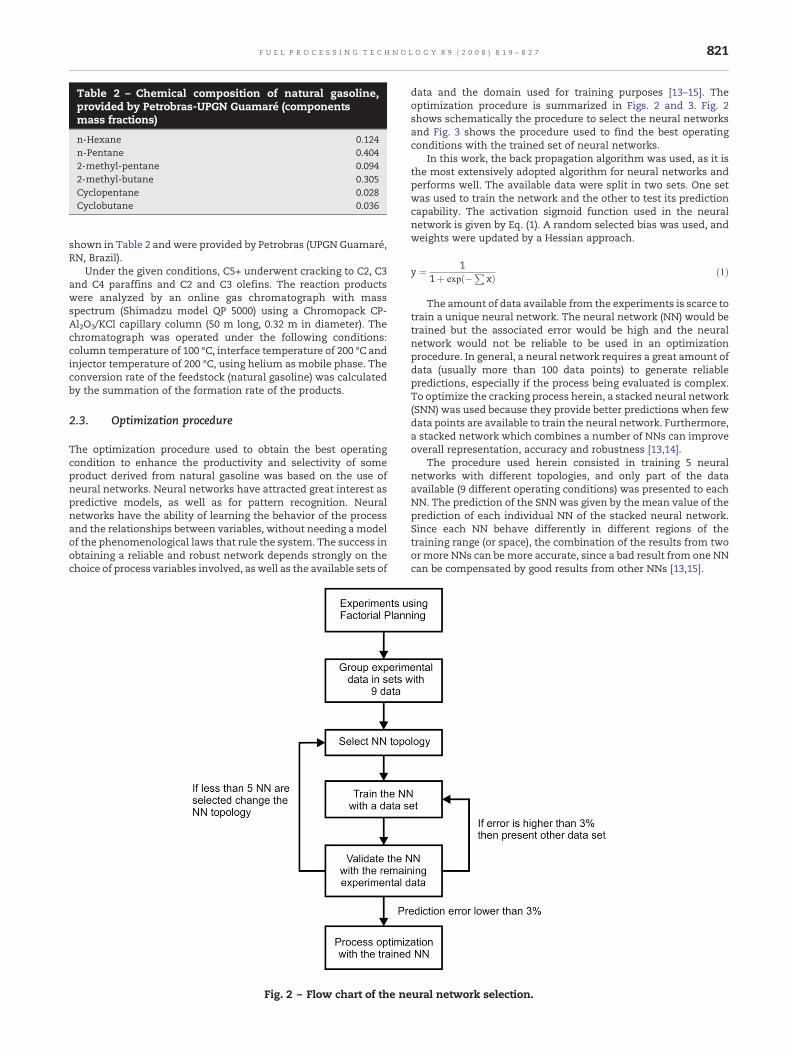
Fig. 2 – Flow chart of the ne
data and the domain used for training purposes [13–15]. Theoptimization procedure is summarized in Figs. 2 and 3. Fig. 2shows schematically the procedure to select the neural networksand Fig. 3 shows the procedure used to find the best operatingconditions with the trained set of neural networks.
In this work, the back propagation algorithm was used, as it isthe most extensively adopted algorithm for neural networks andperforms well. The available data were split in two sets. One setwas used to train the network and the other to test its predictioncapability. The activation sigmoid function used in the neuralnetwork is given by Eq. (1). A random selected bias was used, andweights were updated by a Hessian approach.
y ¼ 11þ exp �P
xð Þ ð1Þ
The amount of data available from the experiments is scarce totrain a unique neural network. The neural network (NN) would betrained but the associated error would be high and the neuralnetwork would not be reliable to be used in an optimizationprocedure. In general, a neural network requires a great amount ofdata (usually more than 100 data points) to generate reliablepredictions, especially if the process being evaluated is complex.To optimize the cracking process herein, a stacked neural network(SNN) was used because they provide better predictions when fewdata points are available to train the neural network. Furthermore,a stacked network which combines a number of NNs can improveoverall representation, accuracy and robustness [13,14].
The procedure used herein consisted in training 5 neuralnetworks with different topologies, and only part of the dataavailable (9 different operating conditions) was presented to eachNN. The prediction of the SNN was given by the mean value of theprediction of each individual NN of the stacked neural network.Since each NN behave differently in different regions of thetraining range (or space), the combination of the results from twoormore NNs can bemore accurate, since a bad result from one NNcan be compensated by good results from other NNs [13,15].
ural network selection.
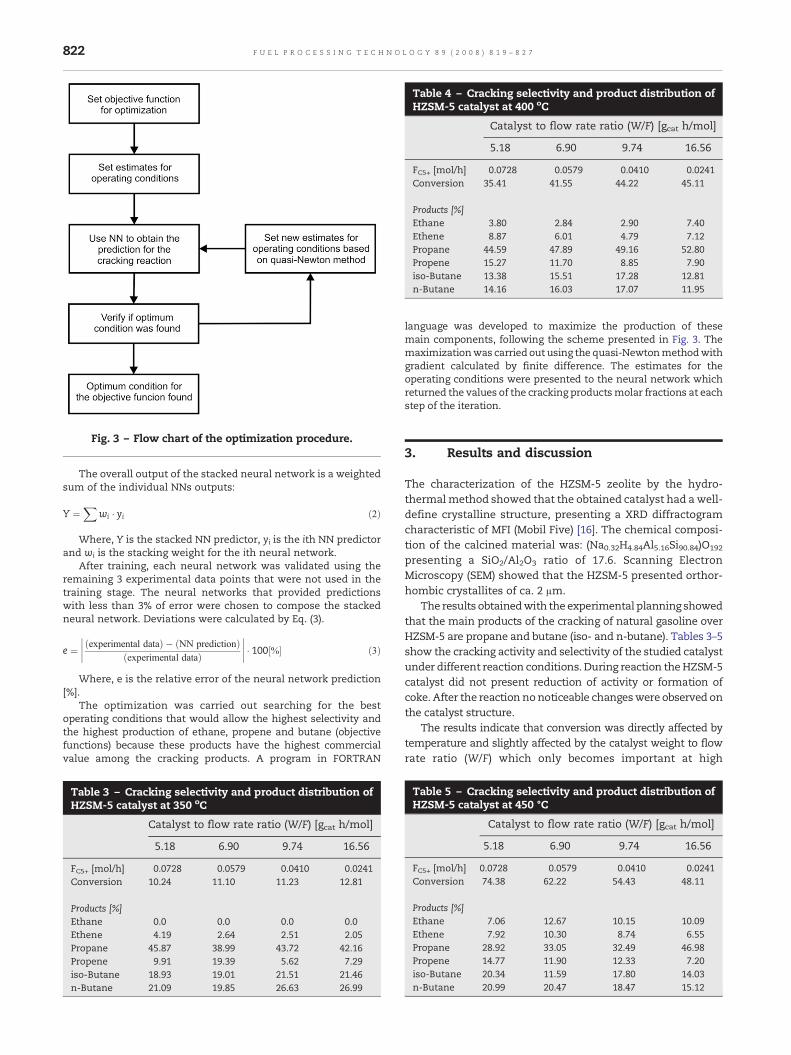
Fig. 3 – Flow chart of the optimization procedure.
Table 4 – Cracking selectivity and product distribution ofHZSM-5 catalyst at 400 oC
822 F U E L P R O C E S S I N G T E C H N O L O G Y 8 9 ( 2 0 0 8 ) 8 1 9 – 8 2 7
The overall output of the stacked neural network is a weightedsum of the individual NNs outputs:
Y ¼X
wi � yi ð2Þ
Where, Y is the stacked NN predictor, yi is the ith NN predictorand wi is the stacking weight for the ith neural network.
After training, each neural network was validated using theremaining 3 experimental data points that were not used in thetraining stage. The neural networks that provided predictionswith less than 3% of error were chosen to compose the stackedneural network. Deviations were calculated by Eq. (3).
e ¼ j experimental datað Þ � NN predictionð Þexperimental datað Þ j � 100 k½ � ð3Þ
Where, e is the relative error of the neural network prediction[%].
The optimization was carried out searching for the bestoperating conditions that would allow the highest selectivity andthe highest production of ethane, propene and butane (objectivefunctions) because these products have the highest commercialvalue among the cracking products. A program in FORTRAN
Table 3 – Cracking selectivity and product distribution ofHZSM-5 catalyst at 350 oC
language was developed to maximize the production of thesemain components, following the scheme presented in Fig. 3. Themaximizationwas carried out using the quasi-Newtonmethodwithgradient calculated by finite difference. The estimates for theoperating conditions were presented to the neural network whichreturned the values of the cracking productsmolar fractions at eachstep of the iteration.
3. Results and discussion
The characterization of the HZSM-5 zeolite by the hydro-thermalmethod showed that the obtained catalyst had a well-define crystalline structure, presenting a XRD diffractogramcharacteristic of MFI (Mobil Five) [16]. The chemical composi-tion of the calcined material was: (Na0.32H4.84Al5.16Si90.84)O192
presenting a SiO2/Al2O3 ratio of 17.6. Scanning ElectronMicroscopy (SEM) showed that the HZSM-5 presented orthor-hombic crystallites of ca. 2 μm.
The results obtainedwith the experimental planning showedthat the main products of the cracking of natural gasoline overHZSM-5 are propane and butane (iso- and n-butane). Tables 3–5show the cracking activity and selectivity of the studied catalystunder different reaction conditions. During reaction theHZSM-5catalyst did not present reduction of activity or formation ofcoke. After the reaction nonoticeable changeswere observed onthe catalyst structure.
The results indicate that conversion was directly affected bytemperature and slightly affected by the catalyst weight to flowrate ratio (W/F) which only becomes important at high
Table 5 – Cracking selectivity and product distribution ofHZSM-5 catalyst at 450 °C
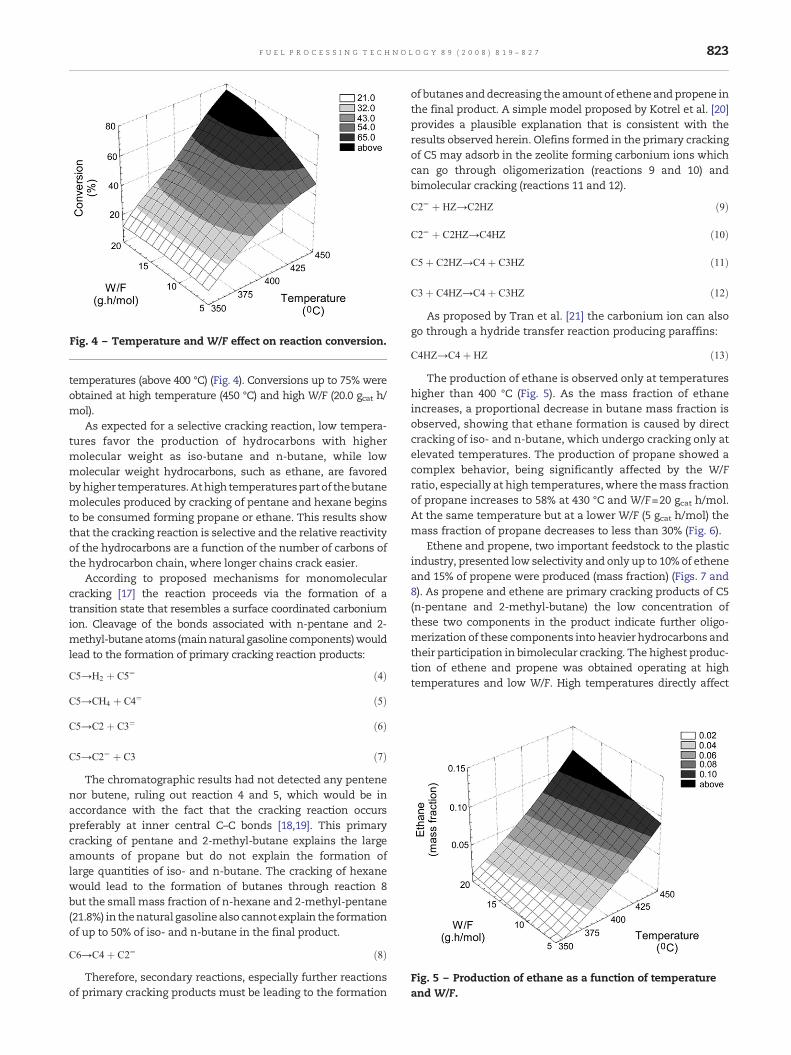
Fig. 4 – Temperature and W/F effect on reaction conversion.
Fig. 5 – Production of ethane as a function of temperatureand W/F.
823F U E L P R O C E S S I N G T E C H N O L O G Y 8 9 ( 2 0 0 8 ) 8 1 9 – 8 2 7
temperatures (above 400 °C) (Fig. 4). Conversions up to 75% wereobtained at high temperature (450 °C) and high W/F (20.0 gcat h/mol).
As expected for a selective cracking reaction, low tempera-tures favor the production of hydrocarbons with highermolecular weight as iso-butane and n-butane, while lowmolecular weight hydrocarbons, such as ethane, are favoredbyhigher temperatures.Athigh temperaturespartof thebutanemolecules produced by cracking of pentane and hexane beginsto be consumed forming propane or ethane. This results showthat the cracking reaction is selective and the relative reactivityof the hydrocarbons are a function of the number of carbons ofthe hydrocarbon chain, where longer chains crack easier.
According to proposed mechanisms for monomolecularcracking [17] the reaction proceeds via the formation of atransition state that resembles a surface coordinated carboniumion. Cleavage of the bonds associated with n-pentane and 2-methyl-butaneatoms (mainnatural gasoline components)wouldlead to the formation of primary cracking reaction products:
C5→H2 þ C5¼ ð4Þ
C5→CH4 þ C4¼ ð5Þ
C5→C2 þ C3¼ ð6Þ
C5→C2¼ þ C3 ð7Þ
The chromatographic results had not detected any pentenenor butene, ruling out reaction 4 and 5, which would be inaccordance with the fact that the cracking reaction occurspreferably at inner central C–C bonds [18,19]. This primarycracking of pentane and 2-methyl-butane explains the largeamounts of propane but do not explain the formation oflarge quantities of iso- and n-butane. The cracking of hexanewould lead to the formation of butanes through reaction 8but the small mass fraction of n-hexane and 2-methyl-pentane(21.8%) in thenatural gasolinealso cannotexplain the formationof up to 50% of iso- and n-butane in the final product.
C6→C4þ C2¼ ð8ÞTherefore, secondary reactions, especially further reactions
of primary cracking products must be leading to the formation
of butanes anddecreasing the amount of etheneandpropene inthe final product. A simple model proposed by Kotrel et al. [20]provides a plausible explanation that is consistent with theresults observed herein. Olefins formed in the primary crackingof C5 may adsorb in the zeolite forming carbonium ions whichcan go through oligomerization (reactions 9 and 10) andbimolecular cracking (reactions 11 and 12).
C2¼ þ HZ→C2HZ ð9Þ
C2¼ þ C2HZ→C4HZ ð10Þ
C5þ C2HZ→C4þ C3HZ ð11Þ
C3þ C4HZ→C4þ C3HZ ð12Þ
As proposed by Tran et al. [21] the carbonium ion can alsogo through a hydride transfer reaction producing paraffins:
C4HZ→C4 þ HZ ð13Þ
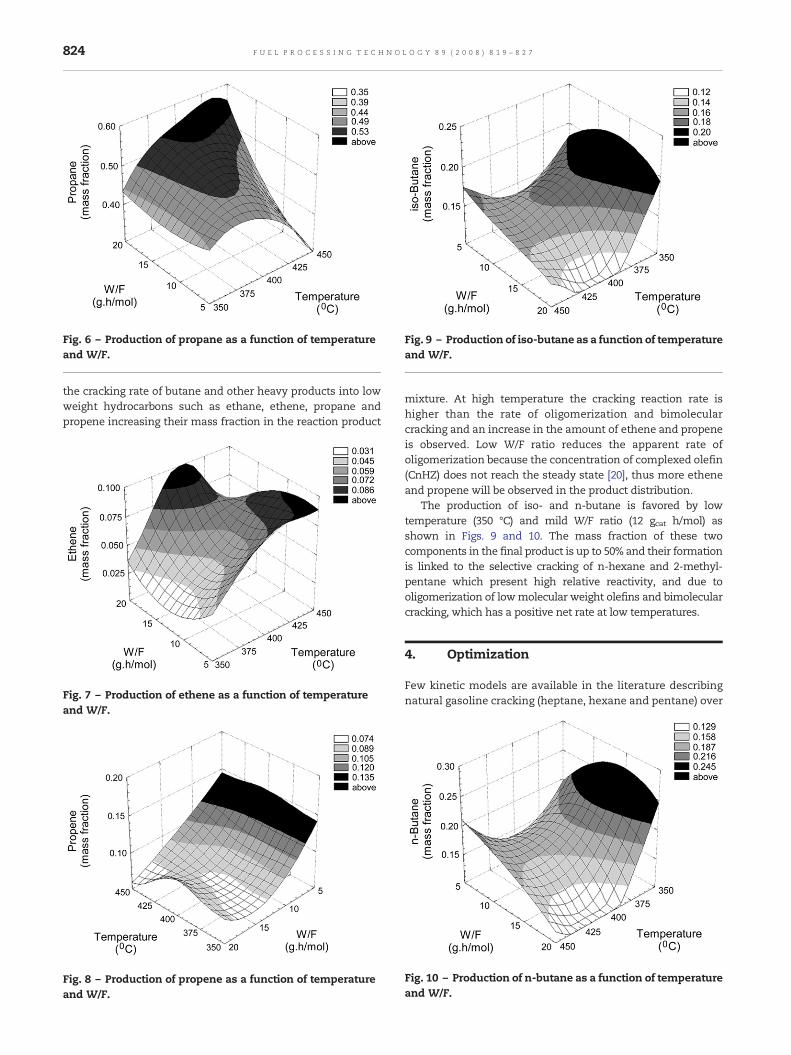
The production of ethane is observed only at temperatureshigher than 400 °C (Fig. 5). As the mass fraction of ethaneincreases, a proportional decrease in butane mass fraction isobserved, showing that ethane formation is caused by directcracking of iso- and n-butane, which undergo cracking only atelevated temperatures. The production of propane showed acomplex behavior, being significantly affected by the W/Fratio, especially at high temperatures, where themass fractionof propane increases to 58% at 430 °C and W/F=20 gcat h/mol.At the same temperature but at a lower W/F (5 gcat h/mol) themass fraction of propane decreases to less than 30% (Fig. 6).
Ethene and propene, two important feedstock to the plasticindustry, presented low selectivity and only up to 10% of etheneand 15% of propene were produced (mass fraction) (Figs. 7 and8). As propene and ethene are primary cracking products of C5(n-pentane and 2-methyl-butane) the low concentration ofthese two components in the product indicate further oligo-merization of these components into heavier hydrocarbons andtheir participation in bimolecular cracking. The highest produc-tion of ethene and propene was obtained operating at hightemperatures and low W/F. High temperatures directly affect
Fig. 6 – Production of propane as a function of temperatureand W/F.
Fig. 9 – Production of iso-butane as a function of temperatureand W/F.
824 F U E L P R O C E S S I N G T E C H N O L O G Y 8 9 ( 2 0 0 8 ) 8 1 9 – 8 2 7
the cracking rate of butane and other heavy products into lowweight hydrocarbons such as ethane, ethene, propane andpropene increasing their mass fraction in the reaction product
Fig. 7 – Production of ethene as a function of temperatureand W/F.
Fig. 8 – Production of propene as a function of temperatureand W/F.
mixture. At high temperature the cracking reaction rate ishigher than the rate of oligomerization and bimolecularcracking and an increase in the amount of ethene and propeneis observed. Low W/F ratio reduces the apparent rate ofoligomerization because the concentration of complexed olefin(CnHZ) does not reach the steady state [20], thus more etheneand propene will be observed in the product distribution.
The production of iso- and n-butane is favored by lowtemperature (350 °C) and mild W/F ratio (12 gcat h/mol) asshown in Figs. 9 and 10. The mass fraction of these twocomponents in the final product is up to 50% and their formationis linked to the selective cracking of n-hexane and 2-methyl-pentane which present high relative reactivity, and due tooligomerization of lowmolecular weight olefins and bimolecularcracking, which has a positive net rate at low temperatures.
4. Optimization
Few kinetic models are available in the literature describingnatural gasoline cracking (heptane, hexane and pentane) over
Fig. 10 – Production of n-butane as a function of temperatureand W/F.
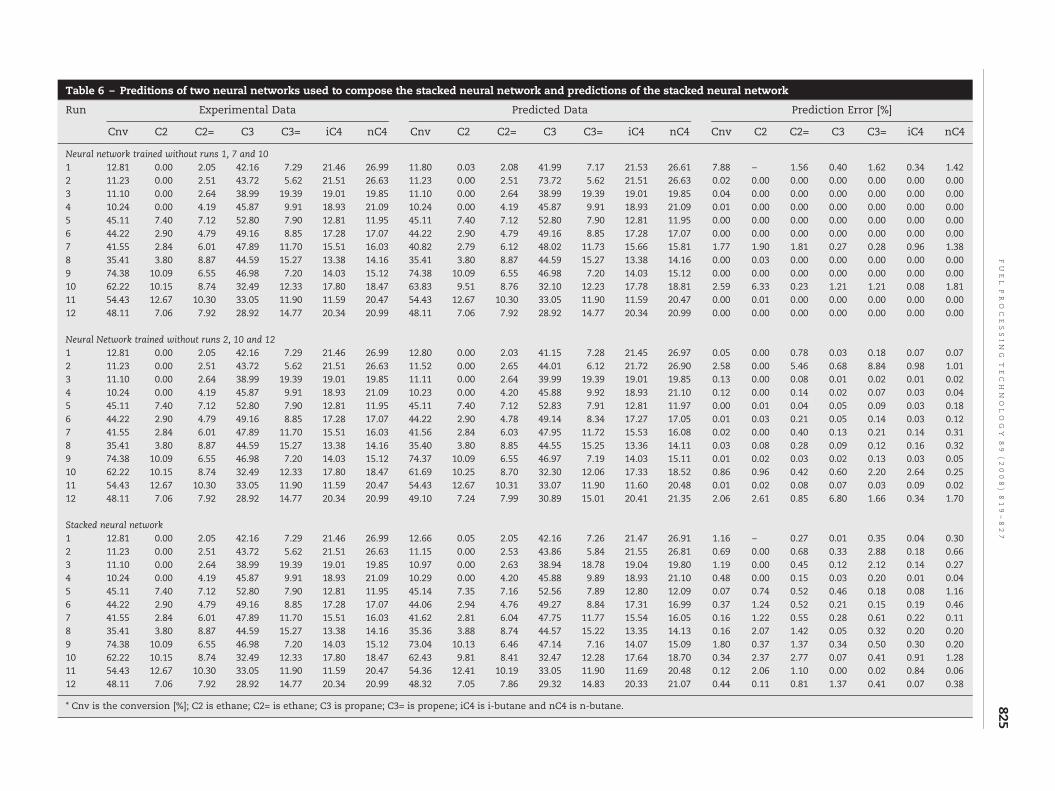
Table 6 – Preditions of two neural networks used to compose the stacked neural network and predictions of the stacked neural network
Run Experimental Data Predicted Data Prediction Error [%]
826 F U E L P R O C E S S I N G T E C H N O L O G Y 8 9 ( 2 0 0 8 ) 8 1 9 – 8 2 7
zeolites [1,2]. Estimation of the kinetic parameter for theavailable models presents a high degree of difficulty andmight not fully represent cracking over other zeolites becausethe kinetic mechanism or the limiting step may be different.Thus, as we currently do not have a reliable kinetic model, theoptimization of the reaction studied herein was carried outusing stacked neural networks (SNN).
The experimental planning resulted in a set of 12 datapoints. From this set, three random data points were removedfrom the data set presented to the neural networks (NNs) andwere used as quality control for the stacked neural networkpredictions, being presented to the NNs only at the testingstage, never on the training stage. The remaining data pointswere split into 45 groups, each containing 9 data points. Eachgroup was used to train a NN with 2 hidden layer and 20neurons in the first hidden layer and 25 neurons in the secondhidden layer. After training, 11 NNs outputted prediction with
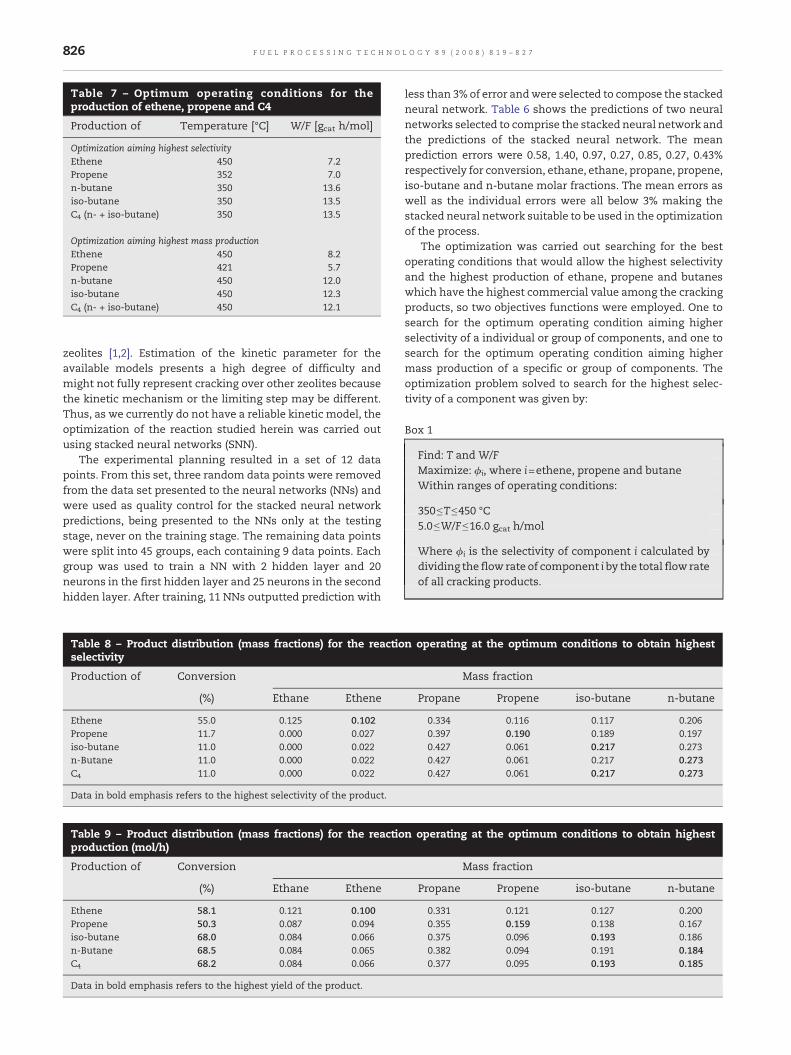
Table 8 – Product distribution (mass fractions) for the reactioselectivity
Data in bold emphasis refers to the highest yield of the product.
less than 3% of error andwere selected to compose the stackedneural network. Table 6 shows the predictions of two neuralnetworks selected to comprise the stacked neural network andthe predictions of the stacked neural network. The meanprediction errors were 0.58, 1.40, 0.97, 0.27, 0.85, 0.27, 0.43%respectively for conversion, ethane, ethane, propane, propene,iso-butane and n-butane molar fractions. The mean errors aswell as the individual errors were all below 3% making thestacked neural network suitable to be used in the optimizationof the process.
The optimization was carried out searching for the bestoperating conditions that would allow the highest selectivityand the highest production of ethane, propene and butaneswhich have the highest commercial value among the crackingproducts, so two objectives functions were employed. One tosearch for the optimum operating condition aiming higherselectivity of a individual or group of components, and one tosearch for the optimum operating condition aiming highermass production of a specific or group of components. Theoptimization problem solved to search for the highest selec-tivity of a component was given by:
Box 1
Find: T and W/FMaximize: ϕi, where i=ethene, propene and butaneWithin ranges of operating conditions:
350≤T≤450 °C5.0≤W/F≤16.0 gcat h/mol
Where ϕi is the selectivity of component i calculated bydividing the flow rate of component i by the total flow rateof all cracking products.
n operating at the optimum conditions to obtain highest
827F U E L P R O C E S S I N G T E C H N O L O G Y 8 9 ( 2 0 0 8 ) 8 1 9 – 8 2 7
The results for the optimization of component selectivityare presented in Tables 7 and 8.
When the highest mass production of a component is to beoptimized, the conversion of the feedstock and its flow rateneeds to be taken into account and the problem to be solved isgiven by:
Box 2
Find: T and W/FMaximize: Fi, where i=ethene, propene and butaneWithin ranges of operating conditions:
350≤T≤450 °C5.0≤W/F≤16.0 gcat h/mol
Where Fi is the flow rate of component i
The results for the optimization of component selectivityare presented in Tables 7 and 9.
As shown and discussed in Fig. 1, the temperature is thefactor that mostly affects the cracking reaction rate and thusconversion of the feedstock. As such its effect on conversionalso influences mass production and as a result mostcomponents will have its highest hourly mass production athigher temperatures but with a lower selectivity (Table 9).
5. Conclusion
The results showed that the main products of the cracking ofnatural gasoline over HZMS-5 zeolite are propane, iso-butaneand n-butane. The production of ethane occurs only at hightemperatures, as the production of ethene. The surfaceanalysis method allows concluding that the cracking reactorover HZMS-5 zeolite is selective and that the relative reactivityof cracking is a function of the carbon number of thehydrocarbon molecule.
Among the main commercial products, the results haveshown that the maximum selectivity and hourly massproduction of ethene is obtained at high temperature(450 °C) and low W/F ratio (7.2 to 8.2 gcat h/mol). Maximumselectivity of propene is obtained at 350 °C and 7.0 gcat h/mol,while when its mass production is to be optimized the bestcondition is found at 421 °C and 5.7 gcat h/mol. The highestmass production of butanes is favored by high temperature(450 °C) and mid range W/F ratios (12.1 gcat h/mol), while thehighest selectivity is found at low temperature (350 °C).
Since current hydrocracking processes are based oncommercial catalysts that are effective above 500 °C, thedeveloped catalyst have presented good potential to be usedcommercially because it presents good activity and selectivityunder lower temperatures (350 to 450 °C) for the production ofethene, propene and butane.
Acknowledgement
The authors would like to thank CNPq-CTPetro e ANP for thefinancial support of this study and the award of scholarship.
R E F E R E N C E S
[1] K.I. Alhumaizi, V.M. Akhmedov, S.M. Al-Zahrani, S.H.Al-Khowaiter, Low temperature hydrocracking of n-heptaneover Ni-supported catalysts: study of global kinetics, Appl.Catal. 219 (2001) 131–140.
[2] R.R. Pinto, P. Borges, M.A.N.D.A. Lemos, L. Lemos, F.R. Ribeiro,Kinetic modelling of the catalytic cracking of n-hexane andn-heptane over zeolite catalyst, Appl. Catal. 272 (2004) 23–28.
[3] R.E. Richards, L.V.C. Rees, Sorption and packing of n-alkanemolecules in ZSM-5, Langmuir 3 (1987) 335–340.
[4] F. Eder, J.A. Lercher, Alkane sorption in molecular sieves: thecontribution of ordering, intermolecular interactions, andsorption on Bronsted acid sites, Zeolites 18 (1997) 75–81.
[5] W. Zhu, F. Kapteijn, B. van der Linden, J.A. Moulijn,Equilibrium adsorption of linear and branched C6 alkanes onsilicalite-1 studied by the tapered element oscillatingmicrobalance, Phys. Chem. Chem. Phys. 3 (2001) 1755–1761.
[6] W. Makowski, D. Majda, Temperature-programmedequilibrated desorption of n-hexane as tool forcharacterization of the microporous structure of zeolites,Thermochim. Acta 412 (2004) 131–137.
[7] B. Millot, A. Methivier, H. Jobic, Adsorption of n-alkanes onsilicalite crystals. A temperature-programmed desorptionstudy, J. Phys. Chem. 102 (1998) 3210–3215.
[8] B. Millot, A. Methivier, H. Jobic, I. Clemencon, B. Rebours,Adsorption of branched alkanes in silicalite-1: atemperature-programmed-equilibration study, Langmuir15 (1999) 2534–2539.
[9] W. Makowski, D. Majda, Equilibrated thermodesorptionstudies of adsorption of n-hexane and n-heptane on zeolitesY, ZSM-5 and ZSM-11, Appl. Surf. Sci. 252 (2005) 707–715.
[10] R.J. Argauer, G.R. Landolt, Conversion with ZSM-5 family ofcrystalline aluminosilicate zeolites. US Patent RE 29857 (1978).
[11] M.J.B. Souza, A.S. Araujo, V.J. Fernandes, A.O.S. Silva,Beneficiamento da fração C5+ do pólo de Guamaré a partir dereações de craqueamento catalítico sobre zeólitas ácidas, Rev.Tec. En. Petr. Gás 1 (2002) 74–78.
[12] A.S. Araujo, M.J.B. Souza, Conversão catalítica de metanol emhidrocarbonetos usando a zeólita HZSM-5 modificada pornióbio, An. Assoc. Bras. Quim. 45 (1996) 40–46.
[13] J. Zhang, Inferential estimation of polymer quality usingbootstrap aggregated neural networks, Neural Netw. 12 (1999)927–938.
[14] J. Zhang, E.B. Martin, A.J. Morris, C. Kiparissides, Inferentialestimation of polymer quality using stacked neural networks,Comp. Chem. Eng. 21 (1997) S1025–S1030.
[16] R.J. Argauer, G.R. Landolt, Crystalline zeolite ZSM-5 andmethod of preparing the same. US Patent 3,702,886 (1972).
[17] S.M. Babitz, B.A. Williams, J.T. Miller, R.Q. Snurr, W.O. Haag,H.H. Kung, Monomolecular cracking of n-hexane on Y, MOR,and ZSM-5 zeolites, Appl. Catal. 179 (1999) 71–86.
[18] L. Pellegrini, S. Locatelli, S. Raselle, S. Bonomi, V. Calemma,Modeling of Fischer–Tropsch products hydrocracking, Chem.Eng. Sci. 59 (2004) 4781–4787.
[19] S.T. Sie, M.M.G. Senden, H.M.H. van Wechem, Conversion ofnatural gas to transportation fuels via the shellmiddledistillatesynthesis process (SMDS), Catal. Today 8 (1991) 371–394.
[20] S. Kotrel, M.P. Rosynek, J.H. Lunsford, Origin of first-orderkinetics during the bimolecular craking of n-hexane overH-ZSM-5 and H-β zeolites, J. Catal. 191 (2000) 55–61.
[21] M.T. Tran, N.S. Gnep, G. Szabo, M. Guisnet, Comparative studyof the transformation of n-butane, n-hexane and n-heptaneover H-MOR zeolites with various Si/Al ratios, Appl. Catal. 170(1998) 49–58.