Page 1
S1
Selective Glucose Sensing in Complex Media using a
Biomimetic Receptor
Robert A. Tromans,1 Soumen K. Samanta,1 Andy M. Chapman2 and Anthony P. Davis1*
1School of Chemistry, University of Bristol, Cantock’s Close, Bristol, BS8 1TS, UK.
2Carbometrics Ltd., Unit DX, St Philips Central, Albert Road, Bristol BS2 0XJ, UK
Table of Contents
Methods ........................................................................................ 2
CD Binding studies .............................................................................................................................. 2
Preparation of biological media. ......................................................................................................... 3
Theoretical background ...................................................................................................................... 4
Binding Studies .............................................................................. 7
Titration of Receptor 1 with Glucose in Water ................................................................................... 7
Competitive Titration of 1 + L-Glucose with D-Glucose in Water ....................................................... 9
CD Analysis of Human Serum ............................................................................................................ 11
Titration of 1 with D-Glucose in Glucose-Free Human Serum .......................................................... 13
Quantification of D-Glucose in complex media using Receptor 1 ... 14
Overview ........................................................................................................................................... 14
Titration of Receptor 1 with L-Glucose in Filtered Human Serum .................................................... 15
Titrations of D-Glucose into Receptor 1 + L-Glucose in Glucose-Free Human Serum (Calibrations for
Single-Point Determinations). ........................................................................................................... 16
Single-Point Determination of D-Glucose in Filtered Human Serum ................................................ 18
Electronic Supplementary Material (ESI) for Chemical Science.This journal is © The Royal Society of Chemistry 2020
Page 2
S2
Titration of D-Glucose into Receptor 1 + L-Glucose in Glucose-Free Cell Culture Medium (Calibration
for Single-Point Determinations). ..................................................................................................... 20
Single-Point Determination of D-Glucose in Glucose-Free Cell Culture Medium ............................. 21
Titration of D-Glucose into Receptor 1 + L-Glucose in Glucose-Free Peroni Beer (Calibration for
Single-Point Determinations). ........................................................................................................... 22
Single-Point Determination of D-Glucose in Peroni Beer ................................................................. 23
Methods
CD Binding studies
CD titrations were performed on a JASCO J-810 spectropolarimeter or a JASCO J-815 CD spectrometer.
In all cases titrant and titrand solutions were identical except for the glucose substrate added to the
titrand. Thus, for example, all titrant solutions contained receptor 1 at the concentration used for the
experiment. In consequence, only substrate concentrations (D2 or L2, depending on the experiment)
changed during the titrations. Solutions prepared from solid glucose were allowed to equilibrate
overnight before use. For studies in simple aqueous media, solutions were prepared from HPLC grade
water with addition of phosphate buffer (10 mM, pH 7.4). The preparation of biological media is
described separately below. Receptor concentrations were typically 100 µM – 250 µM. The receptor
solution (250 µL) was placed in a cuvette and aliquots of titrant solution were added. The cuvette was
shaken after each addition, allowed to settle for 30 seconds and the CD spectrum acquired at 298 K.
Acquisition parameters for the CD spectropolarimeter were typically as follows:
Data pitch 0.5 nm
Data points 151
Bandwidth 1 nm
Response 1 second
Scanning speed 100-200 nm/min
Accumulation 16-24
Cell length 0.1 cm
Temp 298 K
Scan range 225-300 nm
Page 3
S3
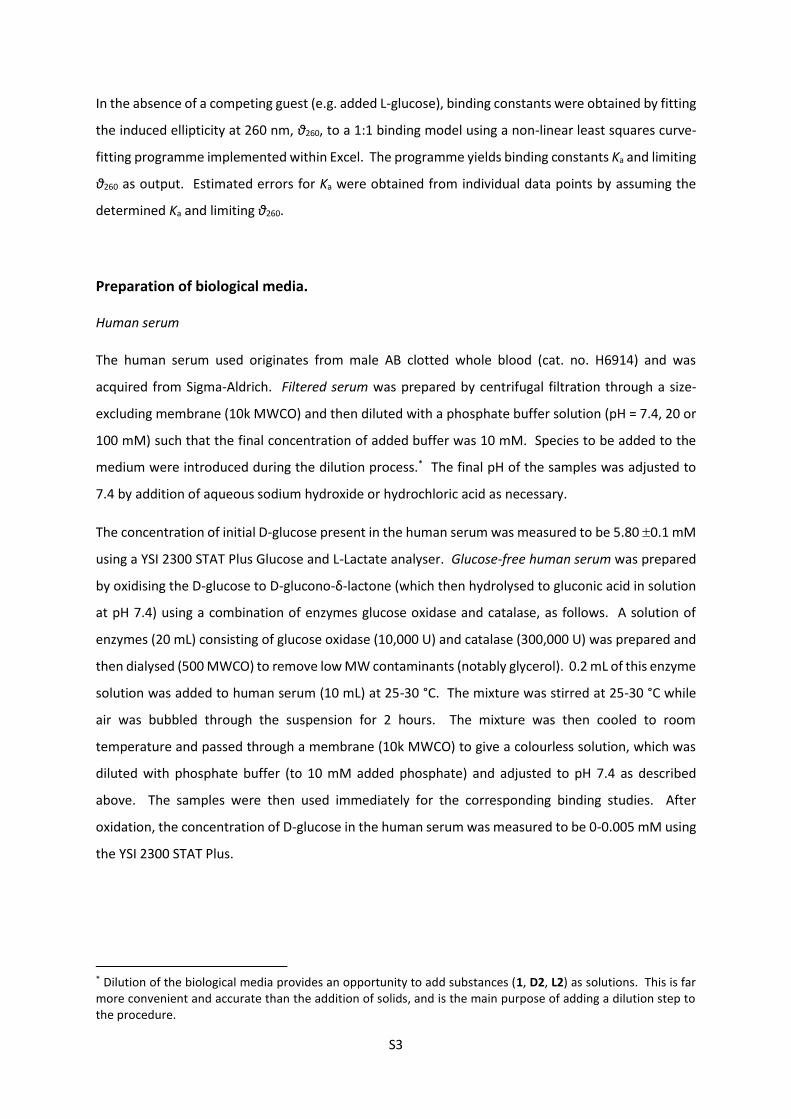
In the absence of a competing guest (e.g. added L-glucose), binding constants were obtained by fitting
the induced ellipticity at 260 nm, θ260, to a 1:1 binding model using a non-linear least squares curve-
fitting programme implemented within Excel. The programme yields binding constants Ka and limiting
θ260 as output. Estimated errors for Ka were obtained from individual data points by assuming the
determined Ka and limiting θ260.
Preparation of biological media.
Human serum
The human serum used originates from male AB clotted whole blood (cat. no. H6914) and was
acquired from Sigma-Aldrich. Filtered serum was prepared by centrifugal filtration through a size-
excluding membrane (10k MWCO) and then diluted with a phosphate buffer solution (pH = 7.4, 20 or
100 mM) such that the final concentration of added buffer was 10 mM. Species to be added to the
medium were introduced during the dilution process.* The final pH of the samples was adjusted to
7.4 by addition of aqueous sodium hydroxide or hydrochloric acid as necessary.
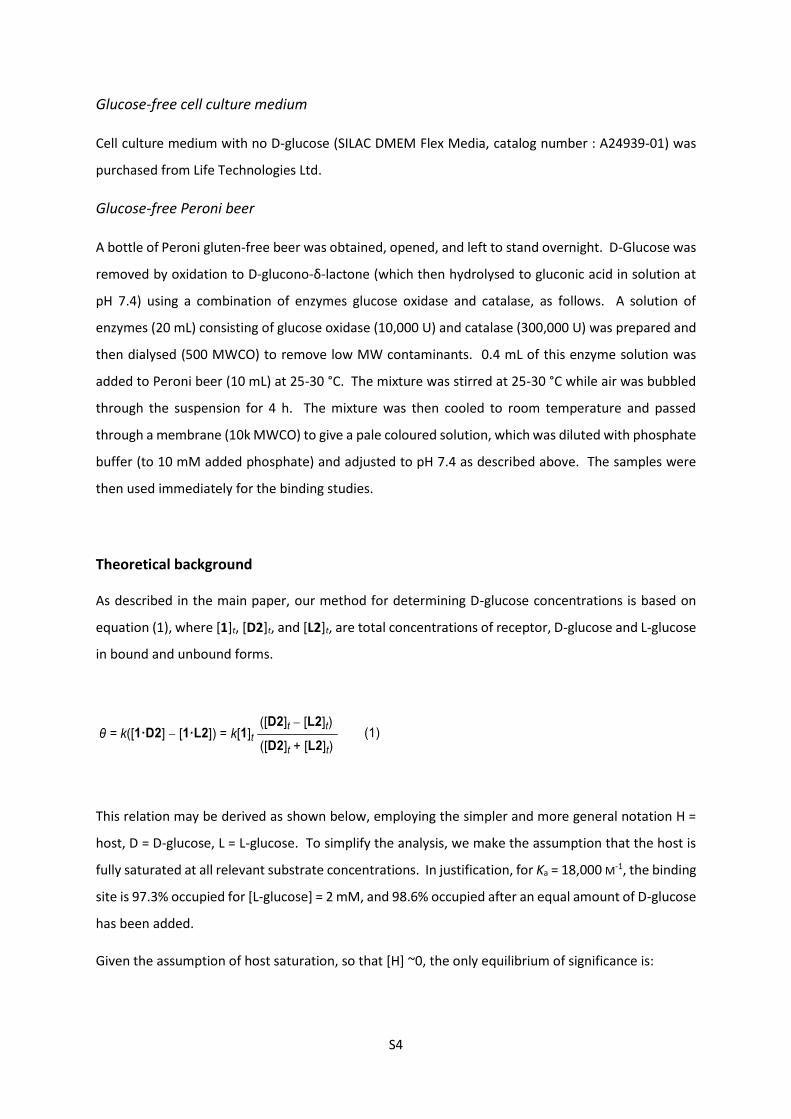
The concentration of initial D-glucose present in the human serum was measured to be 5.80 0.1 mM
using a YSI 2300 STAT Plus Glucose and L-Lactate analyser. Glucose-free human serum was prepared
by oxidising the D-glucose to D-glucono-δ-lactone (which then hydrolysed to gluconic acid in solution
at pH 7.4) using a combination of enzymes glucose oxidase and catalase, as follows. A solution of
enzymes (20 mL) consisting of glucose oxidase (10,000 U) and catalase (300,000 U) was prepared and
then dialysed (500 MWCO) to remove low MW contaminants (notably glycerol). 0.2 mL of this enzyme
solution was added to human serum (10 mL) at 25-30 °C. The mixture was stirred at 25-30 °C while
air was bubbled through the suspension for 2 hours. The mixture was then cooled to room
temperature and passed through a membrane (10k MWCO) to give a colourless solution, which was
diluted with phosphate buffer (to 10 mM added phosphate) and adjusted to pH 7.4 as described
above. The samples were then used immediately for the corresponding binding studies. After
oxidation, the concentration of D-glucose in the human serum was measured to be 0-0.005 mM using
the YSI 2300 STAT Plus.
* Dilution of the biological media provides an opportunity to add substances (1, D2, L2) as solutions. This is far more convenient and accurate than the addition of solids, and is the main purpose of adding a dilution step to the procedure.
Page 4
S4
Glucose-free cell culture medium
Cell culture medium with no D-glucose (SILAC DMEM Flex Media, catalog number : A24939-01) was
purchased from Life Technologies Ltd.
Glucose-free Peroni beer
A bottle of Peroni gluten-free beer was obtained, opened, and left to stand overnight. D-Glucose was
removed by oxidation to D-glucono-δ-lactone (which then hydrolysed to gluconic acid in solution at
pH 7.4) using a combination of enzymes glucose oxidase and catalase, as follows. A solution of
enzymes (20 mL) consisting of glucose oxidase (10,000 U) and catalase (300,000 U) was prepared and
then dialysed (500 MWCO) to remove low MW contaminants. 0.4 mL of this enzyme solution was
added to Peroni beer (10 mL) at 25-30 °C. The mixture was stirred at 25-30 °C while air was bubbled
through the suspension for 4 h. The mixture was then cooled to room temperature and passed
through a membrane (10k MWCO) to give a pale coloured solution, which was diluted with phosphate
buffer (to 10 mM added phosphate) and adjusted to pH 7.4 as described above. The samples were
then used immediately for the binding studies.
Theoretical background
As described in the main paper, our method for determining D-glucose concentrations is based on
equation (1), where [1]t, [D2]t, and [L2]t, are total concentrations of receptor, D-glucose and L-glucose
in bound and unbound forms.
This relation may be derived as shown below, employing the simpler and more general notation H =
host, D = D-glucose, L = L-glucose. To simplify the analysis, we make the assumption that the host is
fully saturated at all relevant substrate concentrations. In justification, for Ka = 18,000 M-1, the binding
site is 97.3% occupied for [L-glucose] = 2 mM, and 98.6% occupied after an equal amount of D-glucose
has been added.
Given the assumption of host saturation, so that [H] ~0, the only equilibrium of significance is:
Page 5
S5
for which
The binding constants for the host binding D and L glucose are given by:
and
and are equal, so that
(S1)
Assuming that [H] = 0, the following mass balance equations apply:
[H]𝑡 = [HD] + [HL]
[D]𝑡 = [D] + [HD]
[L]𝑡 = [L] + [HL]
Equation (S1) may now be expressed in terms of [HD], [H]t, [L]t, and [D]t as follows:
𝐾𝑒𝑥𝑐ℎ =[HD]{[L]𝑡 + [HD] − [H]𝑡}
([H]𝑡 − [HD])([D]𝑡 − [HD])= 1
Rearranging:
[HD]{[L]𝑡 + [HD] − [H]𝑡} = ([H]𝑡 − [HD])([D]𝑡 − [HD])
Multiplying out:
[HD][L]𝑡 + [HD]2 − [HD][H]𝑡 = [H]𝑡[D]𝑡 − [H]𝑡[HD] − [HD][D]𝑡 + [HD]2
Cancelling
[HD][L]𝑡 = [H]𝑡[D]𝑡 − [HD][D]𝑡
From which
Kexch=[HD][L]
[HL][D]
𝐾HD =[HD]
[H][D] 𝐾HL =
[HL]
[H][L]
𝐾𝑒𝑥𝑐ℎ =[HD][L]
[HL][D]=
𝐾HD
𝐾HL
= 1
Page 6
S6
[HD] =[H]𝑡[D]𝑡
([L]𝑡 + [D]𝑡)
Similarly
[HL] =[H]𝑡[L]𝑡
([L]𝑡 + [D]𝑡)
The CD signal will be proportional to [HD] – [HL], so:
(S2)
Equation (S2) is equivalent to Equation (1) from the main paper.
Equation (S2) may be differentiated† with respect to [D]t to give:
𝑑𝜃
𝑑[D]𝑡=
2𝑘[H]𝑡[L]𝑡
([L]𝑡 + [D]𝑡)2
This function effectively represents the sensitivity of θ to changes in [D]t, for a given amount of added
L-glucose. A second differentiation with respect to [L]t gives:
∂2𝜃
∂[D]𝑡 ∂[L]𝑡=
2𝑘[H]𝑡([L]𝑡 − [D]𝑡)
([L]𝑡 + [D]𝑡)3
This function passes through zero when [L]t = [D]t, implying that the first derivative passes through a
maximum at that point. For a given value of [D]t, the slope ∂θ/∂[D]t is therefore greatest when the
same amount of L-glucose is added.
† https://www.derivative-calculator.net/
𝜃 = 𝑘([HD] − [HL]) = 𝑘[H]𝑡
([D]𝑡 − [L]𝑡)
([L]𝑡 + [D]𝑡)
Page 7
S7
-20
-18
-16
-14
-12
-10
-8
-6
-4
-2
0
0.0 0.5 1.0 1.5 2.0 2.5 3.0
θ260
/ m
de
g
[D2]t / mM
Observed
Calculated
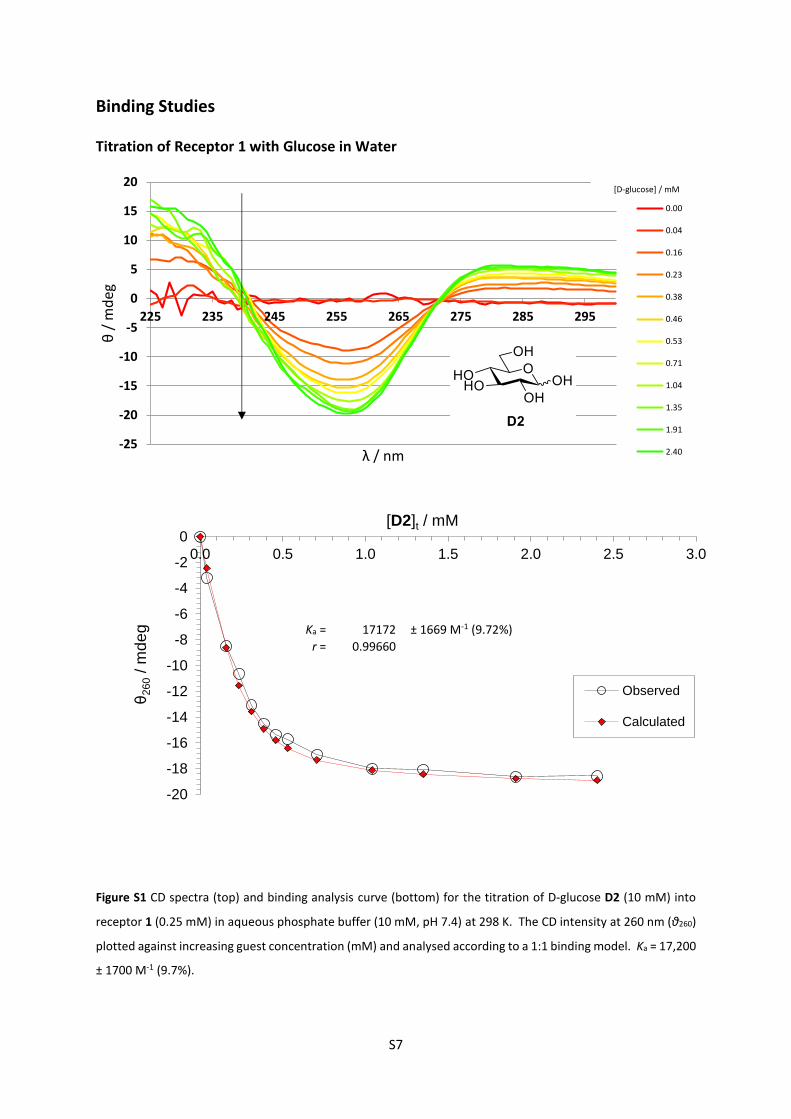
Binding Studies
Titration of Receptor 1 with Glucose in Water
Figure S1 CD spectra (top) and binding analysis curve (bottom) for the titration of D-glucose D2 (10 mM) into
receptor 1 (0.25 mM) in aqueous phosphate buffer (10 mM, pH 7.4) at 298 K. The CD intensity at 260 nm (θ260)
plotted against increasing guest concentration (mM) and analysed according to a 1:1 binding model. Ka = 17,200
± 1700 M-1 (9.7%).
-25
-20
-15
-10
-5
0
5
10
15
20
225 235 245 255 265 275 285 295
θ/
md
eg
λ / nm
0.00
0.04
0.16
0.23
0.38
0.46
0.53
0.71
1.04
1.35
1.91
2.40
[D-glucose] / mM
Ka = 17172 ± 1669 M-1 (9.72%)
r = 0.99660
Page 8
S8
0
2
4
6
8
10
12
14
16
18
20
0.0 0.5 1.0 1.5 2.0 2.5 3.0
θ260
/ m
de
g
[L2]t / mM
Observed
Calculated
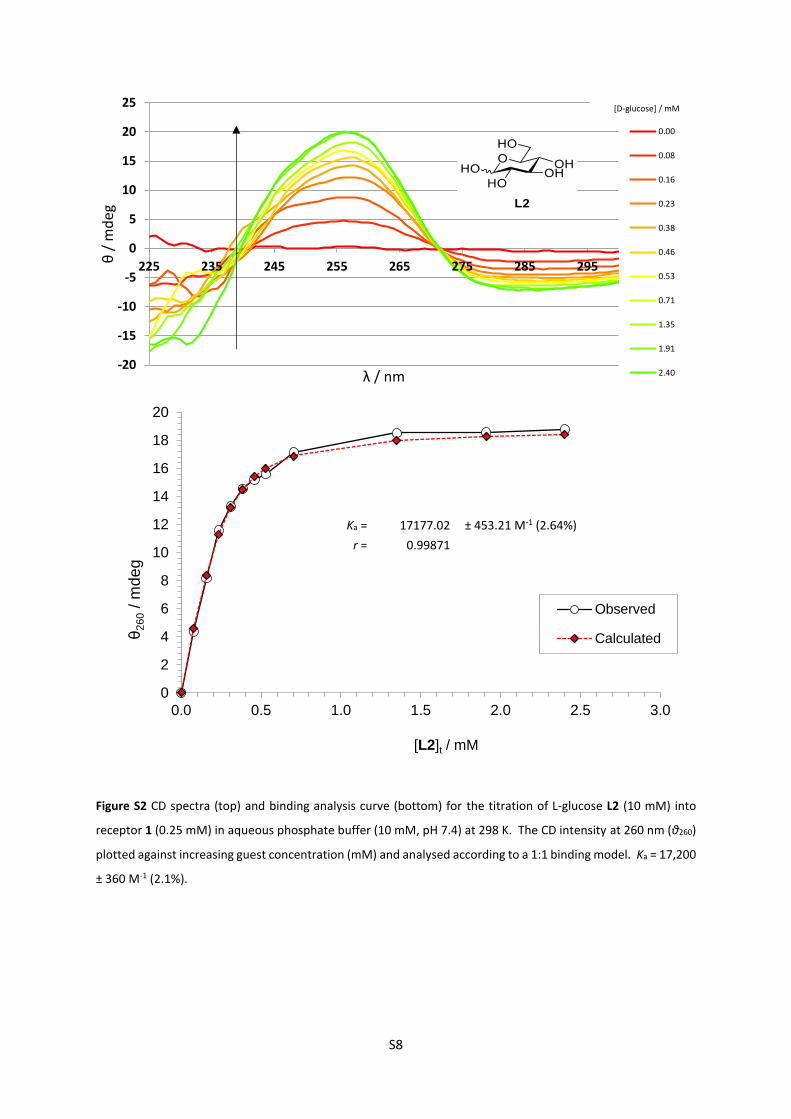
Figure S2 CD spectra (top) and binding analysis curve (bottom) for the titration of L-glucose L2 (10 mM) into
receptor 1 (0.25 mM) in aqueous phosphate buffer (10 mM, pH 7.4) at 298 K. The CD intensity at 260 nm (θ260)
plotted against increasing guest concentration (mM) and analysed according to a 1:1 binding model. Ka = 17,200
± 360 M-1 (2.1%).
-20
-15
-10
-5
0
5
10
15
20
25
225 235 245 255 265 275 285 295
θ/
md
eg
λ / nm
0.00
0.08
0.16
0.23
0.38
0.46
0.53
0.71
1.35
1.91
2.40
[D-glucose] / mM
Ka = 17177.02 ± 453.21 M-1 (2.64%)
r = 0.99871
Page 9
S9
-15
-10
-5
0
5
10
15
20
25
0.0 1.0 2.0 3.0 4.0 5.0 6.0 7.0 8.0 9.0
θ2
60
/ m
deg
[D2]t / mM
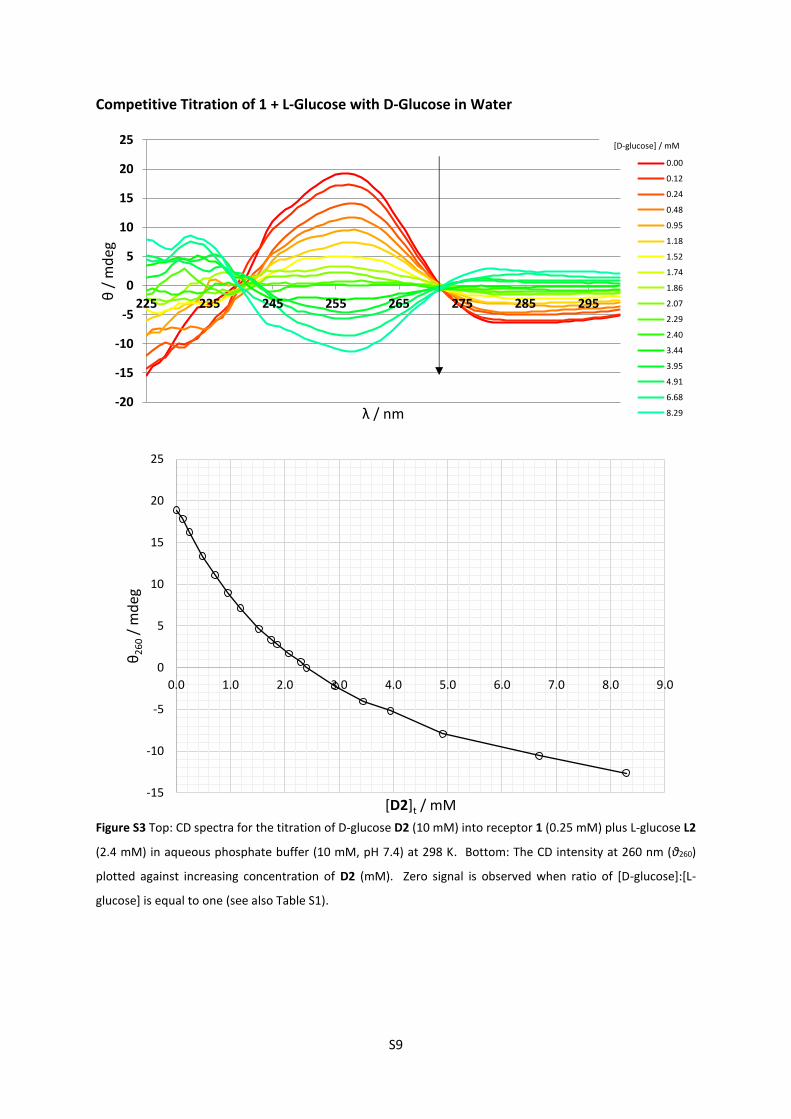
Competitive Titration of 1 + L-Glucose with D-Glucose in Water
Figure S3 Top: CD spectra for the titration of D-glucose D2 (10 mM) into receptor 1 (0.25 mM) plus L-glucose L2
(2.4 mM) in aqueous phosphate buffer (10 mM, pH 7.4) at 298 K. Bottom: The CD intensity at 260 nm (θ260)
plotted against increasing concentration of D2 (mM). Zero signal is observed when ratio of [D-glucose]:[L-
glucose] is equal to one (see also Table S1).
-20
-15
-10
-5
0
5
10
15
20
25
225 235 245 255 265 275 285 295
θ/
md
eg
λ / nm
0.00
0.12
0.24
0.48
0.95
1.18
1.52
1.74
1.86
2.07
2.29
2.40
3.44
3.95
4.91
6.68
8.29
[D-glucose] / mM
Page 10
S10
Table S1 Tabulated data from the experiment outlined in Figure S3. The CD signal passes through zero when
ratio of D-glucose D2 and L-glucose L2 concentrations are equal (highlighted in blue).
[D2] / mM θ260 / mdeg
0.00 18.88
0.12 17.85
0.24 16.25
0.48 13.37
0.72 11.08
0.95 8.97
1.18 7.13
1.52 4.65
1.74 3.31
1.86 2.78
2.07 1.68
2.29 0.71
2.40 -0.02
2.93 -2.24
3.44 -4.07
3.95 -5.18
4.91 -7.94
6.68 -10.55
8.29 -12.64
Page 11
S11
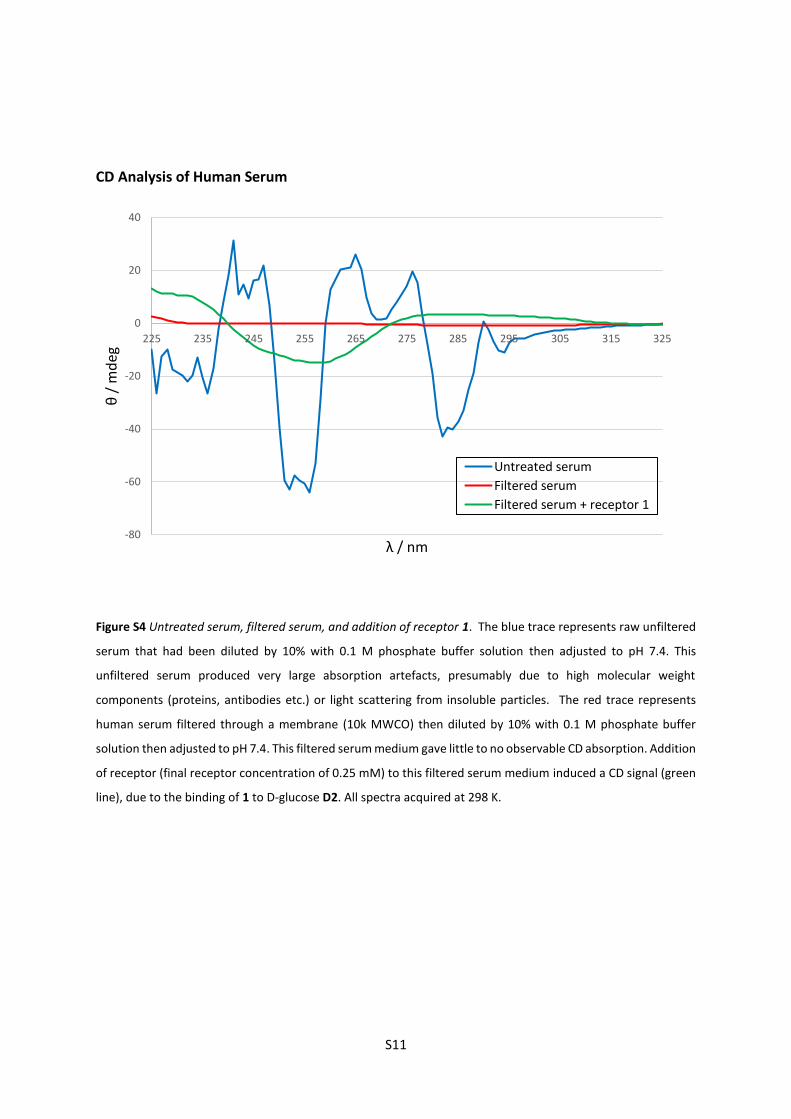
CD Analysis of Human Serum
Figure S4 Untreated serum, filtered serum, and addition of receptor 1. The blue trace represents raw unfiltered
serum that had been diluted by 10% with 0.1 M phosphate buffer solution then adjusted to pH 7.4. This
unfiltered serum produced very large absorption artefacts, presumably due to high molecular weight
components (proteins, antibodies etc.) or light scattering from insoluble particles. The red trace represents
human serum filtered through a membrane (10k MWCO) then diluted by 10% with 0.1 M phosphate buffer
solution then adjusted to pH 7.4. This filtered serum medium gave little to no observable CD absorption. Addition
of receptor (final receptor concentration of 0.25 mM) to this filtered serum medium induced a CD signal (green
line), due to the binding of 1 to D-glucose D2. All spectra acquired at 298 K.
-80
-60
-40
-20
0
20
40
225 235 245 255 265 275 285 295 305 315 325
θ/
md
eg
λ / nm
Untreated serum
Filtered serum
Filtered serum + receptor 1
Page 12
S12
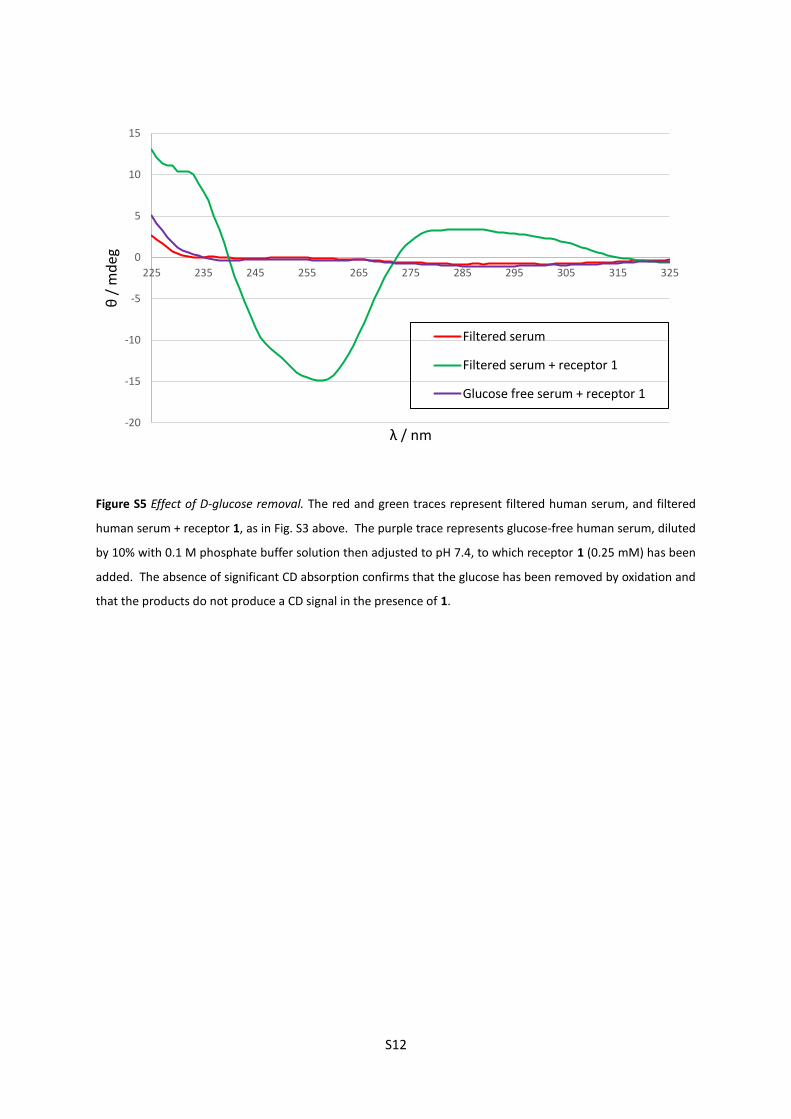
Figure S5 Effect of D-glucose removal. The red and green traces represent filtered human serum, and filtered
human serum + receptor 1, as in Fig. S3 above. The purple trace represents glucose-free human serum, diluted
by 10% with 0.1 M phosphate buffer solution then adjusted to pH 7.4, to which receptor 1 (0.25 mM) has been
added. The absence of significant CD absorption confirms that the glucose has been removed by oxidation and
that the products do not produce a CD signal in the presence of 1.
-20
-15
-10
-5
0
5
10
15
225 235 245 255 265 275 285 295 305 315 325
θ/
md
eg
λ / nm
Filtered serum
Filtered serum + receptor 1
Glucose free serum + receptor 1
Page 13
S13
-5
-4
-4
-3
-3
-2
-2
-1
-1
0
0.0 0.2 0.4 0.6 0.8 1.0 1.2 1.4
θ260
/ m
de
g
[D2]t / mM
Observed
Calculated
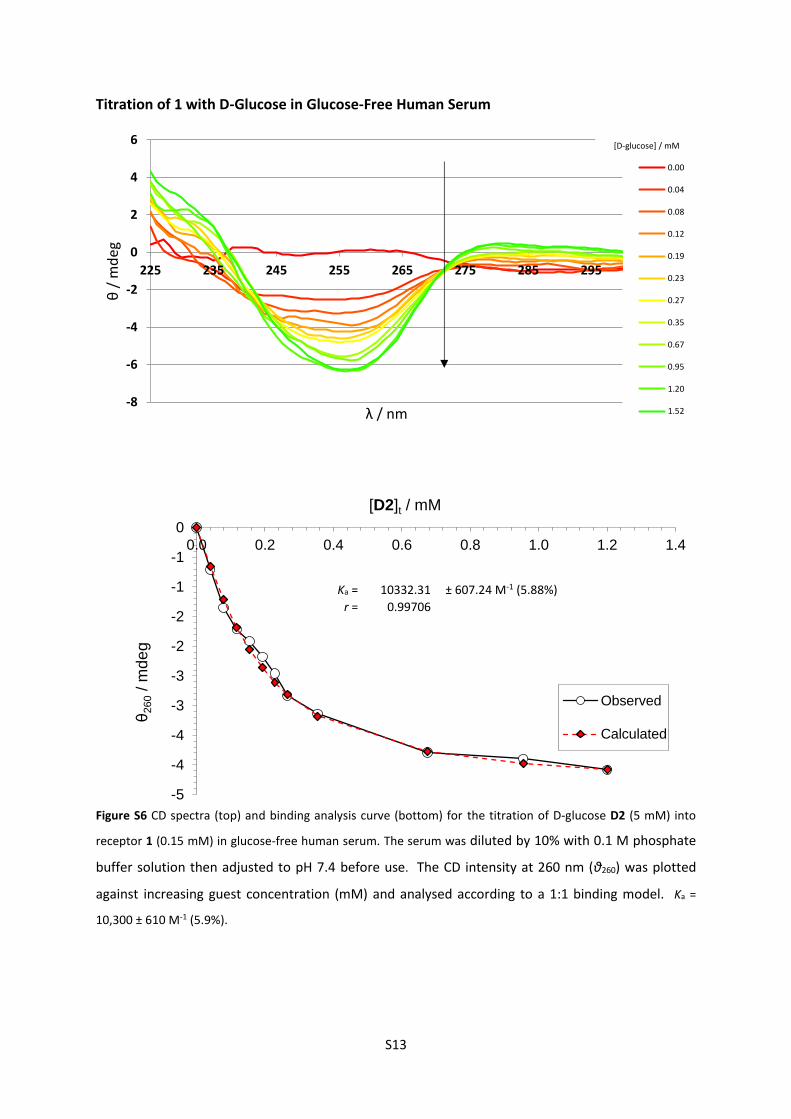
Titration of 1 with D-Glucose in Glucose-Free Human Serum
Figure S6 CD spectra (top) and binding analysis curve (bottom) for the titration of D-glucose D2 (5 mM) into
receptor 1 (0.15 mM) in glucose-free human serum. The serum was diluted by 10% with 0.1 M phosphate
buffer solution then adjusted to pH 7.4 before use. The CD intensity at 260 nm (θ260) was plotted
against increasing guest concentration (mM) and analysed according to a 1:1 binding model. Ka =
10,300 ± 610 M-1 (5.9%).
-8
-6
-4
-2
0
2
4
6
225 235 245 255 265 275 285 295
θ/
md
eg
λ / nm
0.00
0.04
0.08
0.12
0.19
0.23
0.27
0.35
0.67
0.95
1.20
1.52
[D-glucose] / mM
Ka = 10332.31 ± 607.24 M-1 (5.88%)
r = 0.99706
Page 14
S14
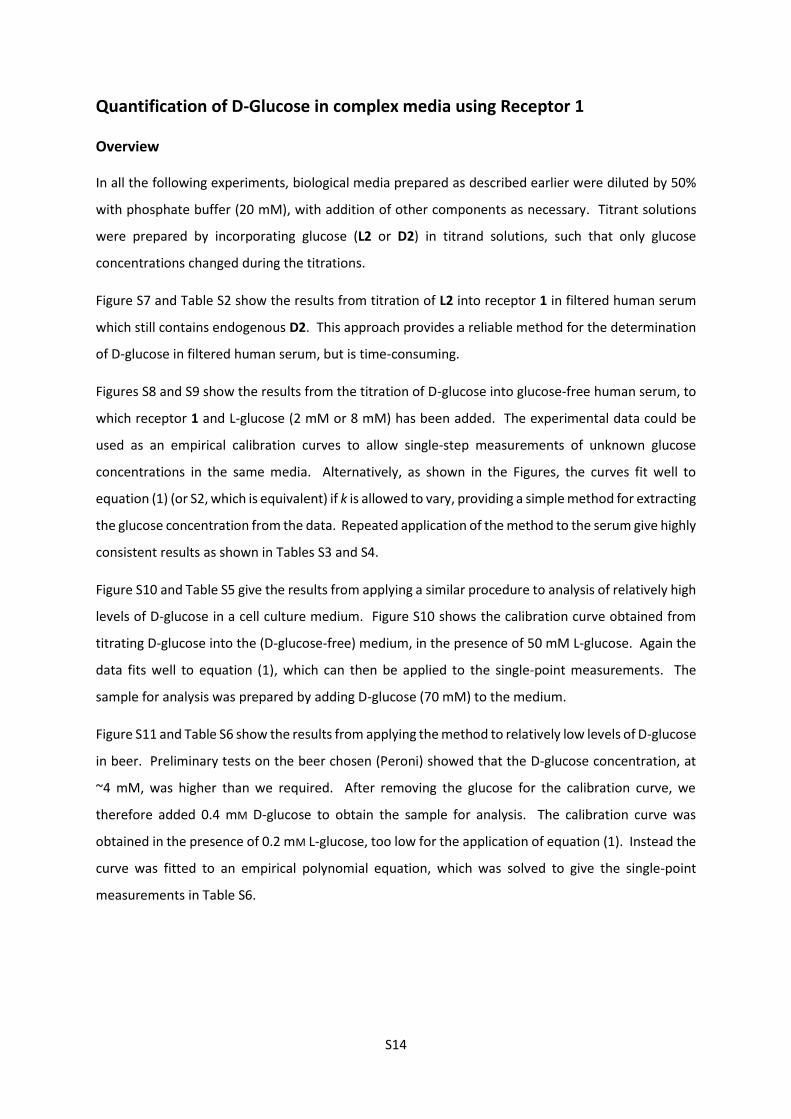
Quantification of D-Glucose in complex media using Receptor 1
Overview
In all the following experiments, biological media prepared as described earlier were diluted by 50%
with phosphate buffer (20 mM), with addition of other components as necessary. Titrant solutions
were prepared by incorporating glucose (L2 or D2) in titrand solutions, such that only glucose
concentrations changed during the titrations.
Figure S7 and Table S2 show the results from titration of L2 into receptor 1 in filtered human serum
which still contains endogenous D2. This approach provides a reliable method for the determination
of D-glucose in filtered human serum, but is time-consuming.
Figures S8 and S9 show the results from the titration of D-glucose into glucose-free human serum, to
which receptor 1 and L-glucose (2 mM or 8 mM) has been added. The experimental data could be
used as an empirical calibration curves to allow single-step measurements of unknown glucose
concentrations in the same media. Alternatively, as shown in the Figures, the curves fit well to
equation (1) (or S2, which is equivalent) if k is allowed to vary, providing a simple method for extracting
the glucose concentration from the data. Repeated application of the method to the serum give highly
consistent results as shown in Tables S3 and S4.
Figure S10 and Table S5 give the results from applying a similar procedure to analysis of relatively high
levels of D-glucose in a cell culture medium. Figure S10 shows the calibration curve obtained from
titrating D-glucose into the (D-glucose-free) medium, in the presence of 50 mM L-glucose. Again the
data fits well to equation (1), which can then be applied to the single-point measurements. The
sample for analysis was prepared by adding D-glucose (70 mM) to the medium.
Figure S11 and Table S6 show the results from applying the method to relatively low levels of D-glucose
in beer. Preliminary tests on the beer chosen (Peroni) showed that the D-glucose concentration, at
~4 mM, was higher than we required. After removing the glucose for the calibration curve, we
therefore added 0.4 mM D-glucose to obtain the sample for analysis. The calibration curve was
obtained in the presence of 0.2 mM L-glucose, too low for the application of equation (1). Instead the
curve was fitted to an empirical polynomial equation, which was solved to give the single-point
measurements in Table S6.
Page 15
S15
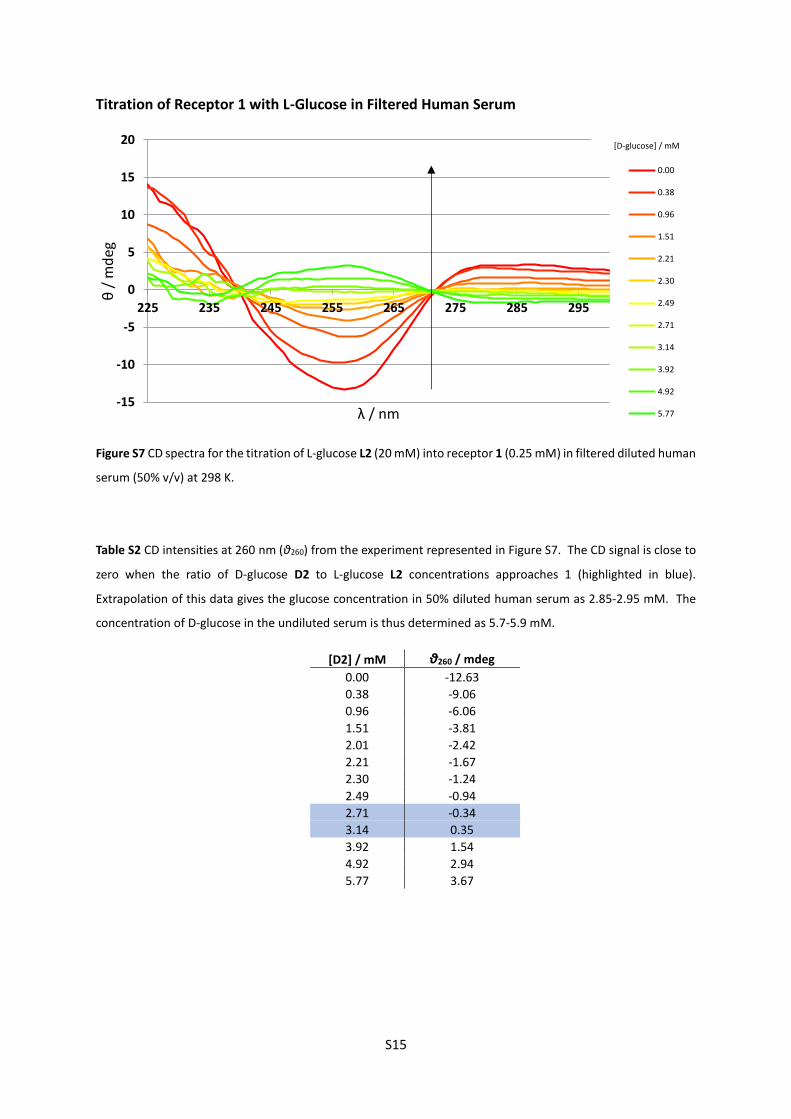
Titration of Receptor 1 with L-Glucose in Filtered Human Serum
Figure S7 CD spectra for the titration of L-glucose L2 (20 mM) into receptor 1 (0.25 mM) in filtered diluted human
serum (50% v/v) at 298 K.
Table S2 CD intensities at 260 nm (θ260) from the experiment represented in Figure S7. The CD signal is close to
zero when the ratio of D-glucose D2 to L-glucose L2 concentrations approaches 1 (highlighted in blue).
Extrapolation of this data gives the glucose concentration in 50% diluted human serum as 2.85-2.95 mM. The
concentration of D-glucose in the undiluted serum is thus determined as 5.7-5.9 mM.
[D2] / mM θ260 / mdeg
0.00 -12.63
0.38 -9.06
0.96 -6.06
1.51 -3.81
2.01 -2.42
2.21 -1.67
2.30 -1.24
2.49 -0.94
2.71 -0.34
3.14 0.35
3.92 1.54
4.92 2.94
5.77 3.67
-15
-10
-5
0
5
10
15
20
225 235 245 255 265 275 285 295
θ/
md
eg
λ / nm
0.00
0.38
0.96
1.51
2.21
2.30
2.49
2.71
3.14
3.92
4.92
5.77
[D-glucose] / mM
Page 16
S16
Titrations of D-Glucose into Receptor 1 + L-Glucose in Glucose-Free Human Serum
(Calibrations for Single-Point Determinations).
Figure S8 [L-Glucose] = 2 mM. Top: CD spectra for the titration of D-glucose D2 (40 mM) into receptor 1 (0.25
mM) plus L-glucose L2 (2 mM) in diluted glucose-free human serum (50% v/v) at 298 K. Bottom: The CD intensity
at 260 nm (θ260) plotted against increasing concentration of D-glucose (mM) (open circles) and fitted to equation
(1) by variation of k. The best fit (red diamonds) was obtained for k = -76802 ± 2366.67 (3.08%) mdeg M-1.
-20
-15
-10
-5
0
5
10
15
20
25
225 235 245 255 265 275 285 295
θ/
md
eg
λ / nm
0.00
0.47
0.94
1.24
1.54
1.83
1.98
2.12
2.41
2.83
3.37
3.90
4.54
5.16
6.33
7.43
8.45
10.33
[D-glucose] / mM
-15
-10
-5
0
5
10
15
20
25
0.0 2.0 4.0 6.0 8.0 10.0
θ2
60
/ m
deg
[D2]t / mM
Observed
Calculated
Page 17
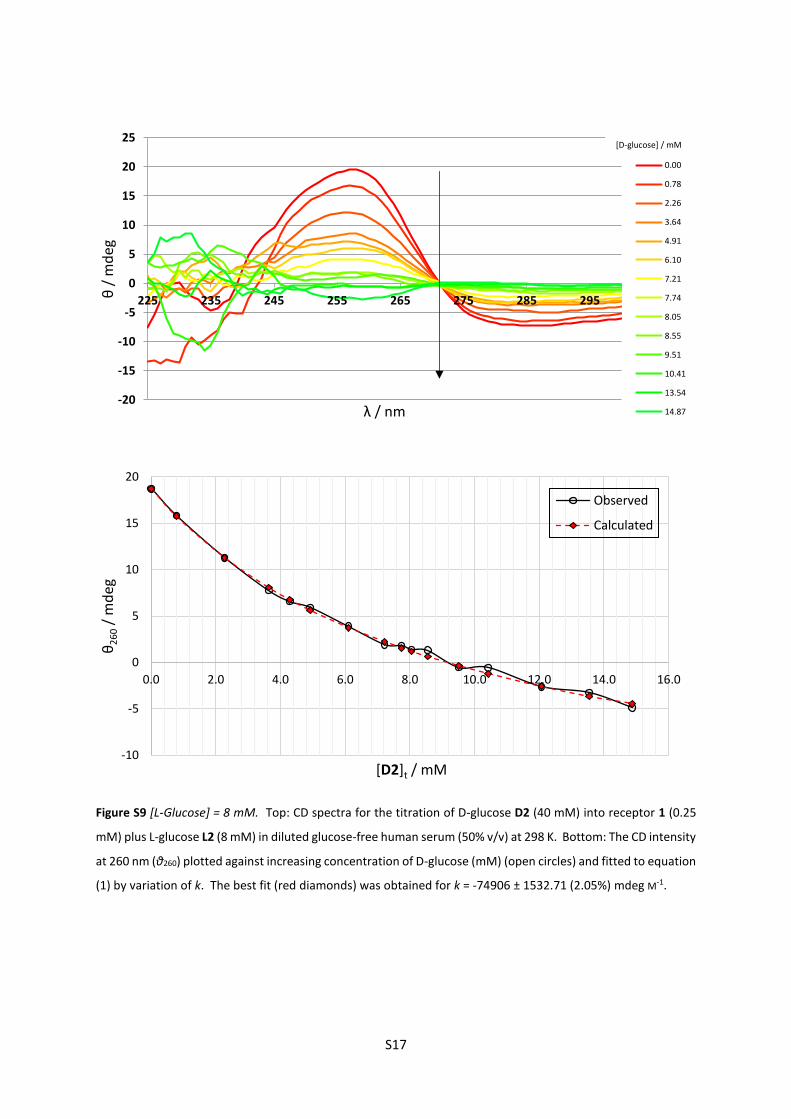
S17
Figure S9 [L-Glucose] = 8 mM. Top: CD spectra for the titration of D-glucose D2 (40 mM) into receptor 1 (0.25
mM) plus L-glucose L2 (8 mM) in diluted glucose-free human serum (50% v/v) at 298 K. Bottom: The CD intensity
at 260 nm (θ260) plotted against increasing concentration of D-glucose (mM) (open circles) and fitted to equation
(1) by variation of k. The best fit (red diamonds) was obtained for k = -74906 ± 1532.71 (2.05%) mdeg M-1.
-20
-15
-10
-5
0
5
10
15
20
25
225 235 245 255 265 275 285 295θ/
md
eg
λ / nm
0.00
0.78
2.26
3.64
4.91
6.10
7.21
7.74
8.05
8.55
9.51
10.41
13.54
14.87
[D-glucose] / mM
-10
-5
0
5
10
15
20
0.0 2.0 4.0 6.0 8.0 10.0 12.0 14.0 16.0
θ2
60
/ m
deg
[D2]t / mM
Observed
Calculated
Page 18
S18
Single-Point Determination of D-Glucose in Filtered Human Serum
Filtered human serum was prepared as described earlier under “preparation of biological media”. A
sample (125 µL) was placed in a cuvette. To this was added a solution (125 µL) of receptor 1 (0.5 mM)
L-glucose (4 or 16 mM) in phosphate buffer (pH 7.4, 20 mM), such that the final concentrations of
added phosphate and 1 were 10 mM and 0.25 mM respectively, and the concentration of L-glucose
was 2 or 8 mM. The cuvette was shaken and the CD spectrum recorded using the parameters
employed for the calibration curves (Figures S8, S9). The CD intensity at 260 nm (θ260) was used to
calculate the concentration of D-glucose in the sample, through equation (S3), derived by
rearrangement of equation (S2) as shown below. Equation (S3) is equivalent to equation (2) from the
main paper.
(S2)
(S3)
The concentration of D-glucose, [D]t, is thus available from the concentration of added L-glucose [L]t,
the CD intensity, θ, the concentration of receptor, [H], and constant k from the calibration experiment.
Because the procedure involves dilution of the sample by 50%, the value obtained must be doubled
to give the concentration of D-glucose in the original sample.
𝜃 = 𝑘([HD] − [HL]) = 𝑘[H]𝑡
([D]𝑡 − [L]𝑡)
([L]𝑡 + [D]𝑡)
𝜃([L]𝑡 + [D]𝑡) = 𝑘[H]𝑡([D]𝑡 − [L]𝑡)
𝜃[D]𝑡 − 𝑘[H]𝑡[D]𝑡 = −𝑘[H]𝑡[L]𝑡 − 𝜃[L]𝑡
[D]𝑡(𝜃 − 𝑘[H]𝑡) = −[L]𝑡(𝑘[H]𝑡 + 𝜃)
[D]𝑡 = −[L]𝑡(𝑘[H]𝑡 + 𝜃)
𝑘[H]𝑡 − 𝜃
Page 19
S19
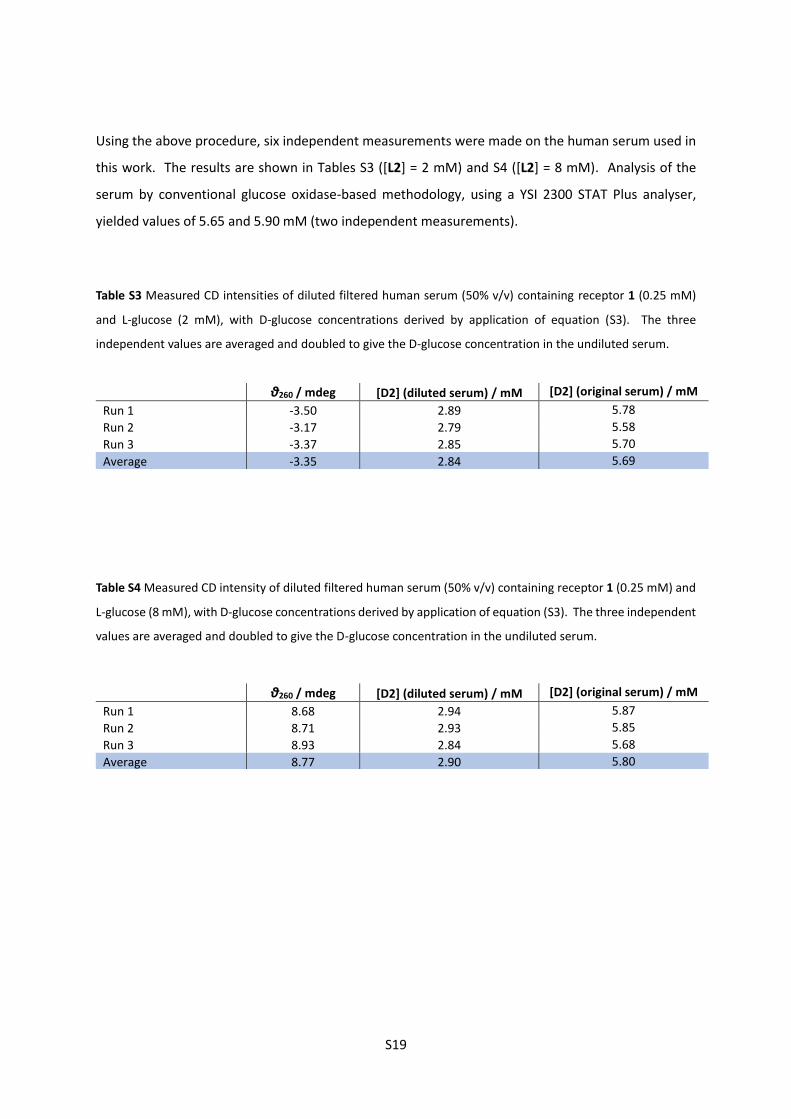
Using the above procedure, six independent measurements were made on the human serum used in
this work. The results are shown in Tables S3 ([L2] = 2 mM) and S4 ([L2] = 8 mM). Analysis of the
serum by conventional glucose oxidase-based methodology, using a YSI 2300 STAT Plus analyser,
yielded values of 5.65 and 5.90 mM (two independent measurements).
Table S3 Measured CD intensities of diluted filtered human serum (50% v/v) containing receptor 1 (0.25 mM)
and L-glucose (2 mM), with D-glucose concentrations derived by application of equation (S3). The three
independent values are averaged and doubled to give the D-glucose concentration in the undiluted serum.
Table S4 Measured CD intensity of diluted filtered human serum (50% v/v) containing receptor 1 (0.25 mM) and
L-glucose (8 mM), with D-glucose concentrations derived by application of equation (S3). The three independent
values are averaged and doubled to give the D-glucose concentration in the undiluted serum.
θ260 / mdeg [D2] (diluted serum) / mM [D2] (original serum) / mM
Run 1 -3.50 2.89 5.78
Run 2 -3.17 2.79 5.58
Run 3 -3.37 2.85 5.70
Average -3.35 2.84 5.69
θ260 / mdeg [D2] (diluted serum) / mM [D2] (original serum) / mM
Run 1 8.68 2.94 5.87
Run 2 8.71 2.93 5.85
Run 3 8.93 2.84 5.68
Average 8.77 2.90 5.80
Page 20
S20
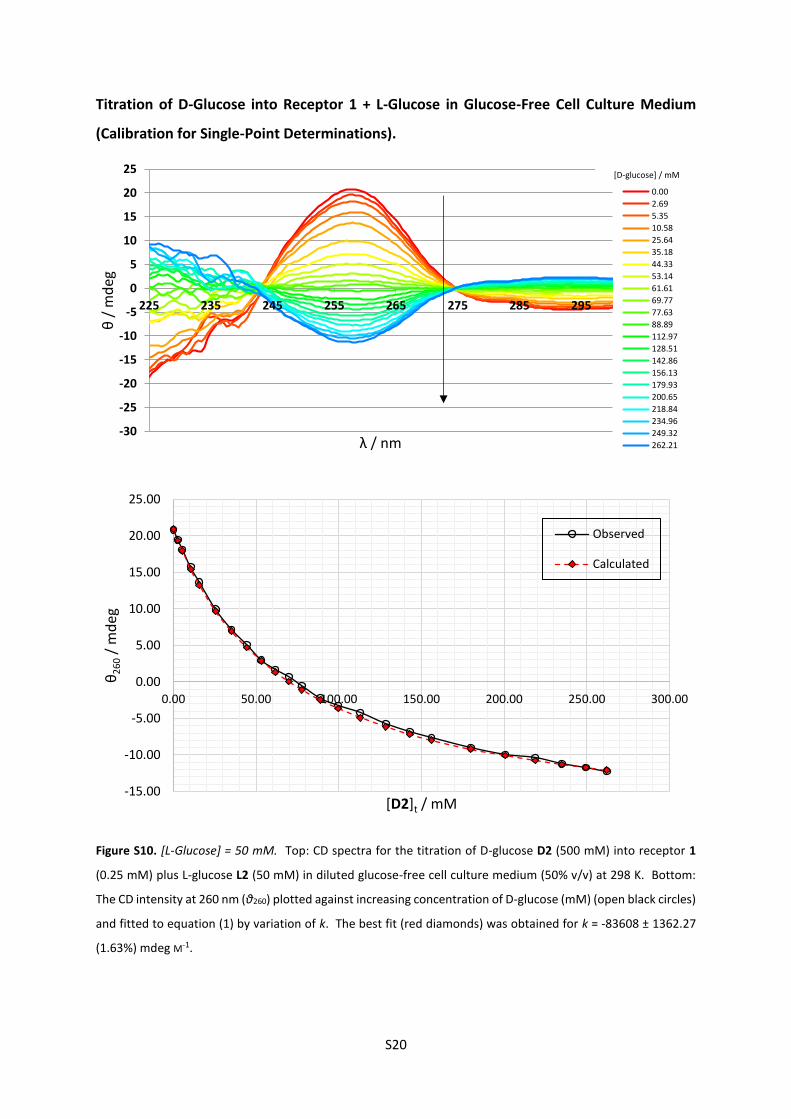
Titration of D-Glucose into Receptor 1 + L-Glucose in Glucose-Free Cell Culture Medium
(Calibration for Single-Point Determinations).
Figure S10. [L-Glucose] = 50 mM. Top: CD spectra for the titration of D-glucose D2 (500 mM) into receptor 1
(0.25 mM) plus L-glucose L2 (50 mM) in diluted glucose-free cell culture medium (50% v/v) at 298 K. Bottom:
The CD intensity at 260 nm (θ260) plotted against increasing concentration of D-glucose (mM) (open black circles)
and fitted to equation (1) by variation of k. The best fit (red diamonds) was obtained for k = -83608 ± 1362.27
(1.63%) mdeg M-1.
-30
-25
-20
-15
-10
-5
0
5
10
15
20
25
225 235 245 255 265 275 285 295
θ/
md
eg
λ / nm
0.00
2.69
5.35
10.58
25.64
35.18
44.33
53.14
61.61
69.77
77.63
88.89
112.97
128.51
142.86
156.13
179.93
200.65
218.84
234.96
249.32
262.21
[D-glucose] / mM
-15.00
-10.00
-5.00
0.00
5.00
10.00
15.00
20.00
25.00
0.00 50.00 100.00 150.00 200.00 250.00 300.00
θ2
60
/ m
deg
[D2]t / mM
Observed
Calculated
Page 21
S21
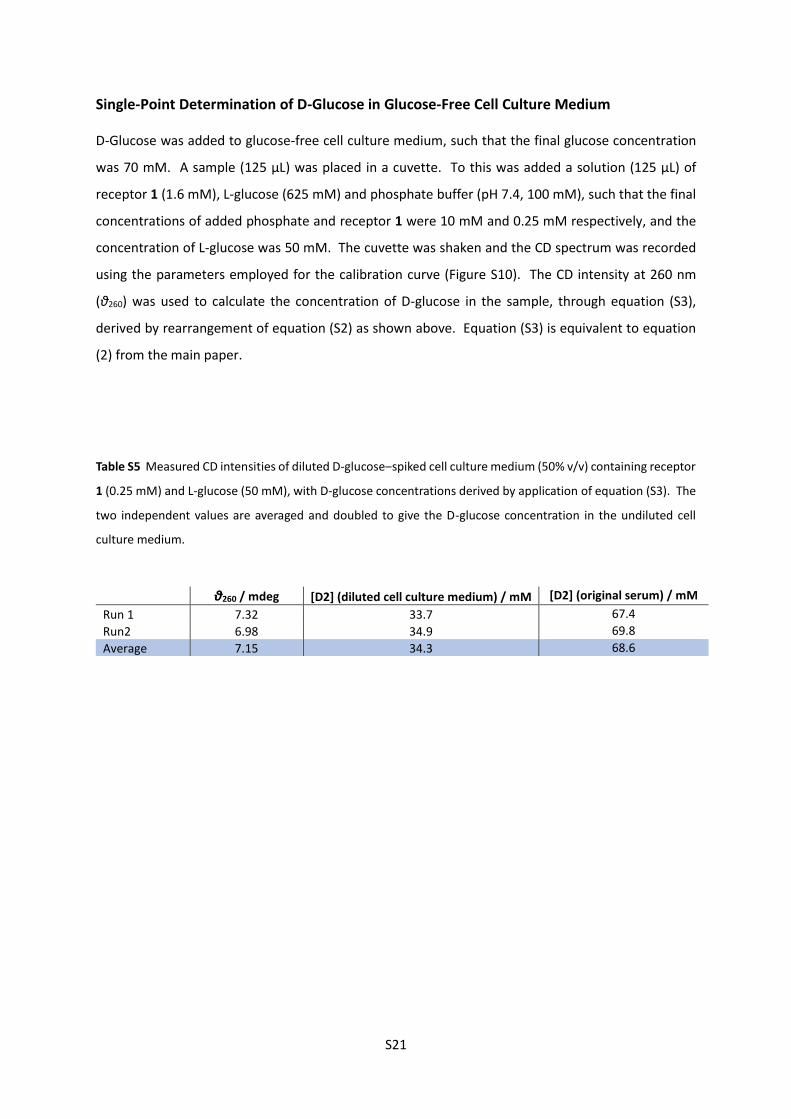
Single-Point Determination of D-Glucose in Glucose-Free Cell Culture Medium
D-Glucose was added to glucose-free cell culture medium, such that the final glucose concentration
was 70 mM. A sample (125 µL) was placed in a cuvette. To this was added a solution (125 µL) of
receptor 1 (1.6 mM), L-glucose (625 mM) and phosphate buffer (pH 7.4, 100 mM), such that the final
concentrations of added phosphate and receptor 1 were 10 mM and 0.25 mM respectively, and the
concentration of L-glucose was 50 mM. The cuvette was shaken and the CD spectrum was recorded
using the parameters employed for the calibration curve (Figure S10). The CD intensity at 260 nm
(θ260) was used to calculate the concentration of D-glucose in the sample, through equation (S3),
derived by rearrangement of equation (S2) as shown above. Equation (S3) is equivalent to equation
(2) from the main paper.
Table S5 Measured CD intensities of diluted D-glucose‒spiked cell culture medium (50% v/v) containing receptor
1 (0.25 mM) and L-glucose (50 mM), with D-glucose concentrations derived by application of equation (S3). The
two independent values are averaged and doubled to give the D-glucose concentration in the undiluted cell
culture medium.
θ260 / mdeg [D2] (diluted cell culture medium) / mM [D2] (original serum) / mM
Run 1 7.32 33.7 67.4
Run2 6.98 34.9 69.8
Average 7.15 34.3 68.6
Page 22
S22
Titration of D-Glucose into Receptor 1 + L-Glucose in Glucose-Free Peroni Beer (Calibration
for Single-Point Determinations).
Figure S11. [L-Glucose] = 0.2 mM. Top: CD spectra for the titration of D-glucose D2 (12 mM) into receptor 1
(0.25 mM) plus L-glucose L2 (0.2 mM) in diluted glucose-free Peroni beer (50% v/v) at 298 K. Bottom: The CD
intensity at 260 nm (θ260) plotted against increasing concentration of D-glucose (mM) (open circles) and fitted
to a polynomial equation (S4, generated in Excel): θ260 = -0.0724[D2]t5 + 1.1163[D2]t
4 - 6.5896[D2]t3 +
18.951[D2]t2 - 29.383[D2]t + 7.7475, R2 = 0.9991.
-20
-15
-10
-5
0
5
10
15
20
25
225 235 245 255 265 275 285 295θ/
md
eg
λ / nm
0.00
0.06
0.13
0.19
0.32
0.38
0.44
0.56
0.67
0.84
1.01
1.22
1.91
2.35
2.75
3.12
3.46
3.78
4.07
4.60
[D-glucose] / mM
-20.00
-15.00
-10.00
-5.00
0.00
5.00
10.00
0.00 1.00 2.00 3.00 4.00 5.00
θ2
60
/ m
deg
[D2]t / mM
Observed
Calculated (Polynomial)
Page 23
S23
Single-Point Determination of D-Glucose in Peroni Beer
Glucose-free Peroni beer was prepared as described earlier. D-glucose was added, such that the final
glucose concentration was 400 µM. A sample (125 µL) was placed in a cuvette. To this was added a
solution (125 µL) of receptor 1 (1.6 mM), L-glucose (2.5 mM) and phosphate buffer (pH 7.4, 100 mM),
such that the final concentrations of added phosphate and 1 were 10 mM and 0.25 mM respectively,
and the concentration of L-glucose was 0.2 mM. The cuvette was shaken and the CD spectrum was
recorded using the parameters employed for the calibration curve (Figure S11). The CD intensity at
260 nm (θ260) was used to calculate the concentration of D-glucose in the sample by inserting the value
into equation (S4) and solving for [D2].‡
Table S6 Measured CD intensities of diluted D-glucose‒spiked Peroni beer (50% v/v) containing receptor 1 (0.25
mM) and L-glucose (200 µM), with D-glucose concentrations derived by application of equation (S4). The two
independent values are averaged and doubled to give the D-glucose concentration in the undiluted beer.
‡ Solutions were obtained using the mathematical website https://www.wolframalpha.com.
θ260 / mdeg [D2] (diluted beer) / µM [D2] (original beer) / µM
Run 1 2.52 203 406
Run 2 2.46 205 410
Average 2.49 204 408