EURASIP Journal on Applied Signal Processing 2005:14, 2207–2214 c 2005 Hindawi Publishing Corporation Selective Synthetic Aperture Radar and Panchromatic Image Fusion by Using the ` a Trous Wavelet Decomposition Youcef Chibani Laboratoire de Traitement du Signal, Facult´ e d’Electronique et d’Informatique, Universit´ e des Sciences et de la Technologie Houari Boumediene, BP 32, El-Alia, Bab-Ezzouar, 16111 Algiers, Algeria Email: [email protected]Received 24 December 2003; Revised 9 January 2005 Synthetic aperture radar (SAR) imaging sensor presents an important advantage for the earth change observation independently of weather conditions. However, the SAR image provides an incomplete information (as roads) of the observed scene leading thus to an ambiguous interpretation. In order to compensate the lack of features, the high spatial resolution panchromatic (P) image is often used as a complementary data for improving the quality of the SAR image. The concept is based on the extraction of features (details) from the P image in order to incorporate into the SAR image. Therefore, we propose an approach based on the use of the ` a trous wavelet decomposition (ATWD) for extracting features from the P image. Experimental results show that the SAR-P composite image allows a better detection of lines, edges, and field boundaries. Keywords and phrases: remote sensing, SAR and panchromatic images, image fusion, highpass filtering, ` a trous wavelet decom- position. 1. INTRODUCTION In remote sensing, the synthetic aperture radar (SAR) imag- ing sensor presents an important advantage for the earth change observation independently of weather conditions. Its sensitivity to the geometry of targets allows providing an image that essentially contains information on the surface roughness, object shape, orientation, as well as the moisture content [1, 2]. A second advantage is the increase of the val- ues for urban features because of the corner reflector effect. However, the recognition of some features as roads or fields boundaries is more difficult in some areas of the scene; the degree of difficulty depends on their structure, extent, and orientation [3]. For example, line features that run parallel to the flight path, that is, perpendicular to the SAR beam, are clearly visible. Others that are running across track are not imaged at all. Also, the only use of the SAR image leads to a difficult interpretation of the scene [1]. In order to improve the quality of the SAR image, the panchromatic (P) image is often used as a complementary data [4] since it is captured in the visible band and character- ized by high spatial information content well suited to inter- mediate scale mapping applications and urban analysis. The concept is based on the extraction of features (details) from the P image, by means of an appropriate algorithm, in order to incorporate into the SAR image. Usually, the highpass fil- tering (HPF) is the method used for extracting features [4]. However, the arbitrary choice of the filter coefficients (size and shape) complicates its use. An alternative approach is the use of the wavelet transform as a method for characterizing features of the image. Usually, the wavelet transform is described as a multires- olution decomposition [5]. It is based on the orthogonal de- composition of the image onto a wavelet basis in order to avoid a redundancy of information in the pyramid at each level of resolution. An alternative approach, based on the nonorthogonal decomposition of the image, has been de- veloped for fusing multisensor images [6, 7]. Its advantage lies in the analysis pixel by pixel, without decimation, for the characterization of features, and corresponds to an overcom- plete representation. Unlike the orthogonal wavelet decom- position, the nonorthogonal wavelet decomposition may be redundant. It is accomplished by using the “` a trous” algo- rithm [8, 9]. Therefore, we propose a feature extraction method from the P image based on the use of the “` a trous” wavelet de- composition. The features are injected into the SAR image by selecting the only important wavelet coefficients in order to avoid the disturbance of the information content. The next sections of this paper are organized as fol- lows. In Section 2, we describe the methodology adopted for improving the SAR image. Section 3 presents the experimen- tal results realized on SPOT and RADARSAT satellite images. Finally, the conclusion is given in Section 4.
Selective Synthetic Aperture Radar andPanchromatic Image Fusion by Using thea TrousWavelet Decomposition
Youcef ChibaniLaboratoire de Traitement du Signal, Faculte d’Electronique et d’Informatique, Universite des Sciences et de laTechnologie Houari Boumediene, BP 32, El-Alia, Bab-Ezzouar, 16111 Algiers, AlgeriaEmail: [email protected]
Received 24 December 2003; Revised 9 January 2005
Synthetic aperture radar (SAR) imaging sensor presents an important advantage for the earth change observation independentlyof weather conditions. However, the SAR image provides an incomplete information (as roads) of the observed scene leading thusto an ambiguous interpretation. In order to compensate the lack of features, the high spatial resolution panchromatic (P) image isoften used as a complementary data for improving the quality of the SAR image. The concept is based on the extraction of features(details) from the P image in order to incorporate into the SAR image. Therefore, we propose an approach based on the use ofthe a trous wavelet decomposition (ATWD) for extracting features from the P image. Experimental results show that the SAR-Pcomposite image allows a better detection of lines, edges, and field boundaries.
Keywords and phrases: remote sensing, SAR and panchromatic images, image fusion, highpass filtering, a trous wavelet decom-position.
1. INTRODUCTION
In remote sensing, the synthetic aperture radar (SAR) imag-ing sensor presents an important advantage for the earthchange observation independently of weather conditions. Itssensitivity to the geometry of targets allows providing animage that essentially contains information on the surfaceroughness, object shape, orientation, as well as the moisturecontent [1, 2]. A second advantage is the increase of the val-ues for urban features because of the corner reflector effect.However, the recognition of some features as roads or fieldsboundaries is more difficult in some areas of the scene; thedegree of difficulty depends on their structure, extent, andorientation [3]. For example, line features that run parallelto the flight path, that is, perpendicular to the SAR beam, areclearly visible. Others that are running across track are notimaged at all. Also, the only use of the SAR image leads to adifficult interpretation of the scene [1].
In order to improve the quality of the SAR image, thepanchromatic (P) image is often used as a complementarydata [4] since it is captured in the visible band and character-ized by high spatial information content well suited to inter-mediate scale mapping applications and urban analysis. Theconcept is based on the extraction of features (details) fromthe P image, by means of an appropriate algorithm, in orderto incorporate into the SAR image. Usually, the highpass fil-tering (HPF) is the method used for extracting features [4].
However, the arbitrary choice of the filter coefficients (sizeand shape) complicates its use. An alternative approach is theuse of the wavelet transform as a method for characterizingfeatures of the image.
Usually, the wavelet transform is described as a multires-olution decomposition [5]. It is based on the orthogonal de-composition of the image onto a wavelet basis in order toavoid a redundancy of information in the pyramid at eachlevel of resolution. An alternative approach, based on thenonorthogonal decomposition of the image, has been de-veloped for fusing multisensor images [6, 7]. Its advantagelies in the analysis pixel by pixel, without decimation, for thecharacterization of features, and corresponds to an overcom-plete representation. Unlike the orthogonal wavelet decom-position, the nonorthogonal wavelet decomposition may beredundant. It is accomplished by using the “a trous” algo-rithm [8, 9].
Therefore, we propose a feature extraction method fromthe P image based on the use of the “a trous” wavelet de-composition. The features are injected into the SAR imageby selecting the only important wavelet coefficients in orderto avoid the disturbance of the information content.
The next sections of this paper are organized as fol-lows. In Section 2, we describe the methodology adopted forimproving the SAR image. Section 3 presents the experimen-tal results realized on SPOT and RADARSAT satellite images.Finally, the conclusion is given in Section 4.
Highpass filtering (HPF) method is usually used for extract-ing features (or details) contained in an image [10]. It hasbeen initially developed for improving the spatial resolutionof multispectral images. Its concept is based on the applica-tion of a highpass filter on the image in order to isolate in-formation of high spatial frequencies. The resulting image isthen added, pixel by pixel, to themultispectral image of lowerspatial resolution. Formally, each detail can be extracted fromthe panchromatic image by means of the following equation:
∆P(k, l) = P(k, l)− P(k, l), (1)
∆P(k, l) denotes the local detail, whereas P(k, l) is the pixelintensity and P(k, l) is its filtered value, which correspondsto the lowpass filtering operation such that
P(k, l) = 1#W
∑m
∑n
c(m,n)P(k +m, l + n), (2)
c(m,n) are coefficients of the lowpass filter and #W is thenumber of filter coefficients.
The simplicity of this method allows envisaging its use forimproving the quality of the SAR image. For this, each detailextracted from the P image will be added to the SAR image,termed R(k, l), to produce an improved SAR-P fused image,termed R(k, l). This translates to the following equation:
R(k, l) = R(k, l) + ∆P(k, l). (3)
The use of the HPF method is complicated by the arbitrarychoice of the filter coefficients (shape and size) for extractingfeatures. Generally, the coefficients of the lowpass filter aresimply chosen identical to one. Thus, the filtered value cor-responds to the computation of the local mean where pixelscontribute of equivalent manner. However, the filtered valuedoes not really reflect the local characteristics of the imagesince it contains complex features as edges.
It becomes useful to modelize features by means of an ef-ficient mathematical tool that allows taking into account thelocal characteristics of the image. Hence, the wavelet decom-position may be an appropriate solution since the waveletcoefficient amplitude allows informing on the importance ofthe feature contained into the image. In our approach, we usethe “a trous” wavelet decomposition (ATWD) for extractingthe image features. For a more comprehensive presentationof the integration method, we briefly review the main prop-erties of the ATWD and its implementation by means of fil-ters.
2.2. A trous wavelet decomposition
Usually, the wavelet decomposition is described as an or-thogonal multiresolution representation [5, 11] and has beenextensively used for fusing multisensor images [12, 13, 14].More recently, an evaluation study has proved that the or-thogonalwavelet decomposition is not appropriate for image
fusion since it has some limited performances [7]. An al-ternative approach has been proposed using the “a trous”wavelet decomposition (ATWD), which presents the inter-esting properties as [15] follows:
(i) the algorithm produces a single wavelet coefficientplane at each level of decomposition,
(ii) the wavelet coefficients are computed for each locationallowing a better detection of a dominant feature,
(iii) the dominant feature can be followed from scale toscale,
(iv) the algorithm is easily implemented.
The ATWD of a discrete signal s(k) allows the separationof low-frequency information (approximation) from high-frequency information (wavelet coefficients). Such a separa-tion requires the use of a lowpass filter h(n), associated withthe scale function ϕ(x), to obtain several undecimated suc-cessive approximations of a signal through scales:
s j(k) =∑n
h(n)s j−1(k + n2 j−1), j = 1, . . . ,N , (4)
s0(k) corresponds to the original discrete signal s(k); j andNare the scale index and the number of scales, respectively. Thewavelet coefficients are extracted by using the highpass filterg(n), associated with the wavelet function ψ(x), through thefollowing filtering operation:
wj(k) =∑n
g(n)s j−1(k + n2 j−1). (5)
The exact reconstruction of the signal s(k) is performed byintroducing two dual filters h(n) and g(n) that should satisfythe quadrature mirror filter (QMF) condition [9]:
h(n)∗h(n) + g(n)∗g(n) = δ(n), (6)
where δ(n) is the impulse function and∗ denotes the convo-lution operator.
Since (6) offers more degrees of freedom, a simple choiceconsists in considering h(n) and g(n) filters as equal to theimpulse function (h(n) = g(n) = δ(n)). Therefore, g(n) isdeduced from (6) as
g(n) = δ(n)− h(n). (7)
By replacing (7) in (5), the wavelet coefficients are obtainedby a straightforward difference between two successive ap-proximations as follows:
wj(k) = s j−1(k)− s j(k). (8)
The reconstruction of the original signal s(k) is simply ob-tained by adding the last smoothed signal sN (k) with the setof the wavelet coefficients, let
s(k) = sN (k) +N∑j=1
wj(k). (9)
Radar and Panchromatic Image Fusion 2209
25
20
15
10
5
0
Distribution
(%)
0 0.1 0.2 0.3 0.9 1
Importance
j = 1
j = 2
j = 3
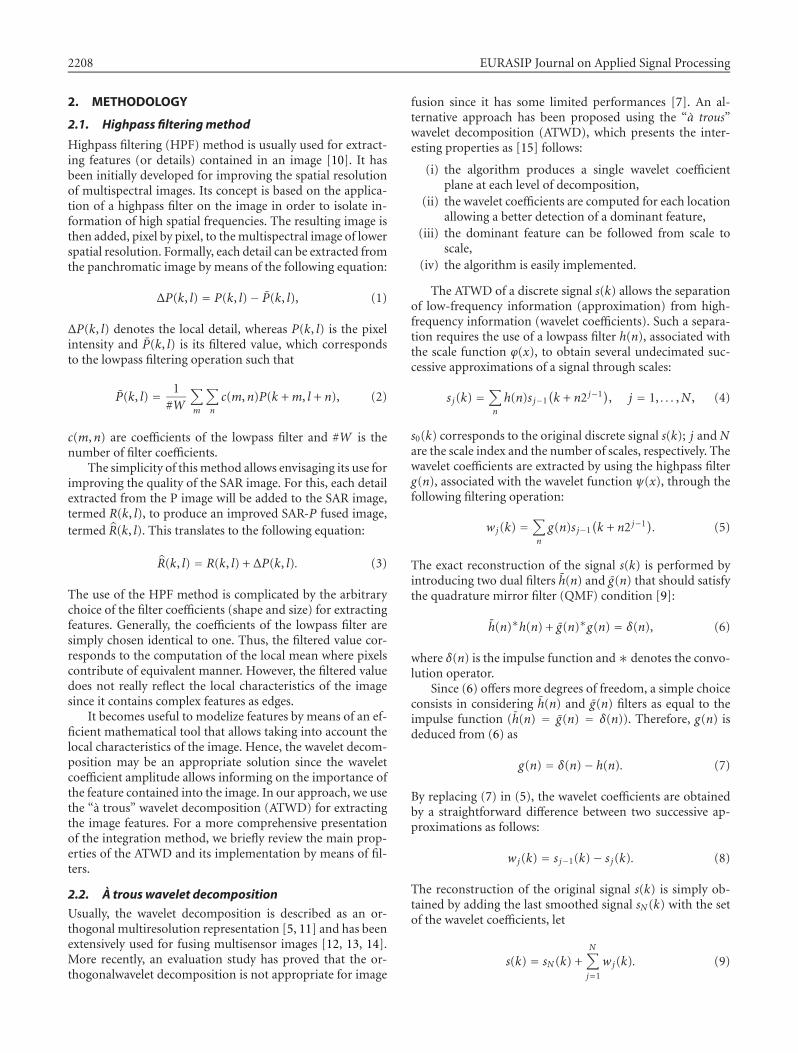
Figure 1: Distribution of the importance values computed for eachscale ( j = 1, 2, 3).
It is interesting to note that the HPF method is a particularcase of the ATWD when all filter coefficients h(n) take thesame values at the scale N = 1. Therefore, the main advan-tage of the ATWD lies in the appropriate choice of the filtercoefficients where values are directly tied to the propertiesof the scale function. Generally, the filter coefficients are de-duced from the function having a B3 cubic spline scale profile[15].
The ATWD for an image is accomplished by a separa-ble filtering following rows and columns, respectively. Specif-ically, a single wavelet plane is produced at each scale bysubtraction of two successive approximations without dec-imation. Thus, wavelet and approximation planes have thesame dimensions as the original image. As a consequence,the ATWD produces a redundancy of features from scale toanother when those are dominant.
2.3. Integration scheme
The methodology adopted for improving the SAR image isaccomplished in two steps:
(i) feature extraction from the panchromatic (P) image byusing the ATWD;
(ii) incorporation of features into the SAR image by a se-lective addition procedure.
More precisely, the P image is decomposed by the ATWDin several scales:
P(k, l) = PN (k, l) +N∑j=1
wPj (k, l), (10)
where PN (k, l) corresponds to the last approximation planeand wP
j (k, l) is the wavelet coefficient computed for each lo-cation (k, l) and at each scale j. Thus, the wavelet coefficientsare added, pixel by pixel and scale by scale, to the SAR imagein order to produce the SAR-P composite image:
R(k, l) = R(k, l) +N∑j=1
wPj (k, l). (11)
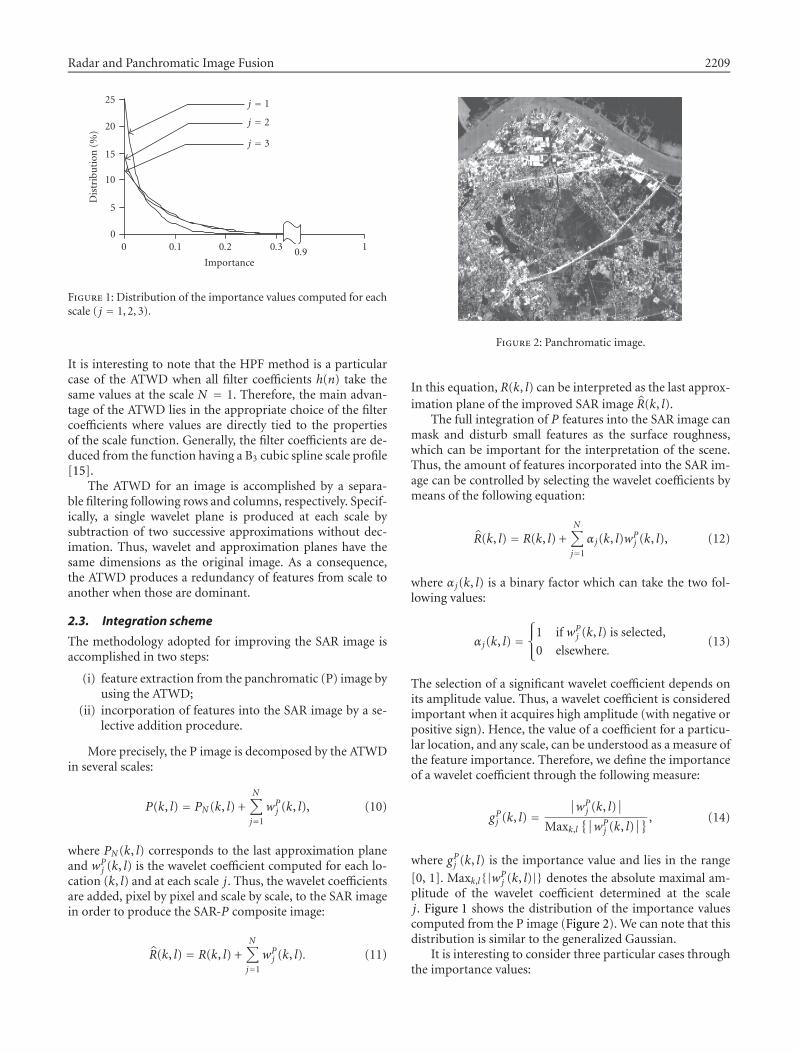
Figure 2: Panchromatic image.
In this equation, R(k, l) can be interpreted as the last approx-imation plane of the improved SAR image R(k, l).
The full integration of P features into the SAR image canmask and disturb small features as the surface roughness,which can be important for the interpretation of the scene.Thus, the amount of features incorporated into the SAR im-age can be controlled by selecting the wavelet coefficients bymeans of the following equation:
R(k, l) = R(k, l) +N∑j=1
αj(k, l)wPj (k, l), (12)
where αj(k, l) is a binary factor which can take the two fol-lowing values:
αj(k, l) =1 if wP
j (k, l) is selected,
0 elsewhere.(13)
The selection of a significant wavelet coefficient depends onits amplitude value. Thus, a wavelet coefficient is consideredimportant when it acquires high amplitude (with negative orpositive sign). Hence, the value of a coefficient for a particu-lar location, and any scale, can be understood as a measure ofthe feature importance. Therefore, we define the importanceof a wavelet coefficient through the following measure:
gPj (k, l) =∣∣wP
j (k, l)∣∣
Maxk,l{∣∣wP
j (k, l)∣∣} , (14)
where gPj (k, l) is the importance value and lies in the range
[0, 1]. Maxk,l{|wPj (k, l)|} denotes the absolute maximal am-
plitude of the wavelet coefficient determined at the scalej. Figure 1 shows the distribution of the importance valuescomputed from the P image (Figure 2). We can note that thisdistribution is similar to the generalized Gaussian.
It is interesting to consider three particular cases throughthe importance values:
2210 EURASIP Journal on Applied Signal Processing
(a) (b)
Figure 3: SAR images: (a) unfiltered SAR image; (b) filtered SAR image.
(i) when the importance value is near zero, gPj (k, l) ≈ 0,the distribution informs that the P image containsmany flat areas;
(ii) when the importance value is near one, gPj (k, l) ≈ 1,the distribution informs on the presence of a point ob-ject;
(iii) the intermediate values, gPj (k, l) ∈]0, 1[, correspondto features having medium amplitudes as textures andtransition lines.
From these considerations, a wavelet coefficient is se-lected through its importance value by choosing a thresholdnoted τj depending on the scale index j:
αj(k, l) =1 if gPj (k, l) ≥ τj ,
0 elsewhere.(15)
Note that the sign of the wavelet coefficient should be pre-served in order to generate the local variations between pix-els into the SAR image. Hence, each feature wP
j (k, l) having
an importance value gPj (k, l) between τj and 1 is incorpo-rated into the SAR image. The adjustment of the thresholdfrom one (point object) to zero (flat area) allows incorporat-ing gradually the features into the SAR image.
3. EXPERIMENTAL RESULTS
3.1. Image preparation
Images used for our experimentation are captured fromRADARSAT and SPOT satellites, covering a region of Viet-nam and more precisely the Haıphong Bay located at 107◦ Eand 21◦ N. The region is a land plane and comprises a villagewith small houses, a peach port, and agricultural fields. Ourinvestigation is carried out on the basis of the following data:
(i) SPOT-P data, acquired vertically on 21 October 1992with a 10m spatial resolution;
(ii) RADARSAT-SAR data, acquired on 15 December 1996with a 12.5m pixel size and an incidence angle of 23◦.
Two particular preprocessing should be applied to SAR andP images before the application of an integration method[4]. In the case of the SAR image, two elementary operationsare used: speckle reduction and conversion from 16 bits to 8bits. The speckle reduction allows avoiding eventual ambigu-ities for the interpretation of the scene. Various sophisticatedmethods have been developed for reducing the speckle. Inthis experimentation, the SAR image coded in 16 bits is fil-tered by using the standard Lopes filter with a window of 5×5[16] since it allows retaining texture information, linear fea-tures, and point target responses. The conversion of the SARimage allows ensuring a correct combination with the P im-age (delivered in 8 bits). Therefore, the filtered SAR image isconverted from 16 bits to 8 bits by matching the histogram ofboth P and SAR images. More precisely, after computing thehistogram of both P and SAR images, the histogram of theSAR image is modified according to the histogram of the Pimage. Obviously,other conversion and recent filtered meth-ods can be used according to applications [4].
The second preprocessing is the coregistration proce-dure. As the considered region is a flat terrain, a polynomialmethod is used to register geometrically the SAR and P im-ages. Therefore, a number of well-distributed and accuratelyground control points are selected in both images in orderto compute the polynomial coefficients. P image is consid-ered as the reference since it has superior spatial resolutionand provides more details compared to the SAR image. Thecoregistration error is less than 0.7 pixel. The SAR image isresampled to 10m according to the spatial resolution of theP image. Figures 2, 3a, and 3b show, respectively, the P, unfil-tered and filtered SAR images corresponding to a 512-by-512pixel area.
3.2. SAR-P composite image presentationTo show the utility of the ATWD for improving the SARimage, we compare it with the HPF method. The ATWD is
Radar and Panchromatic Image Fusion 2211
100
80
60
40
20
0
NEI(%
)0 1 2 3 4 5
Number of decomposition scales
ATWDHPF
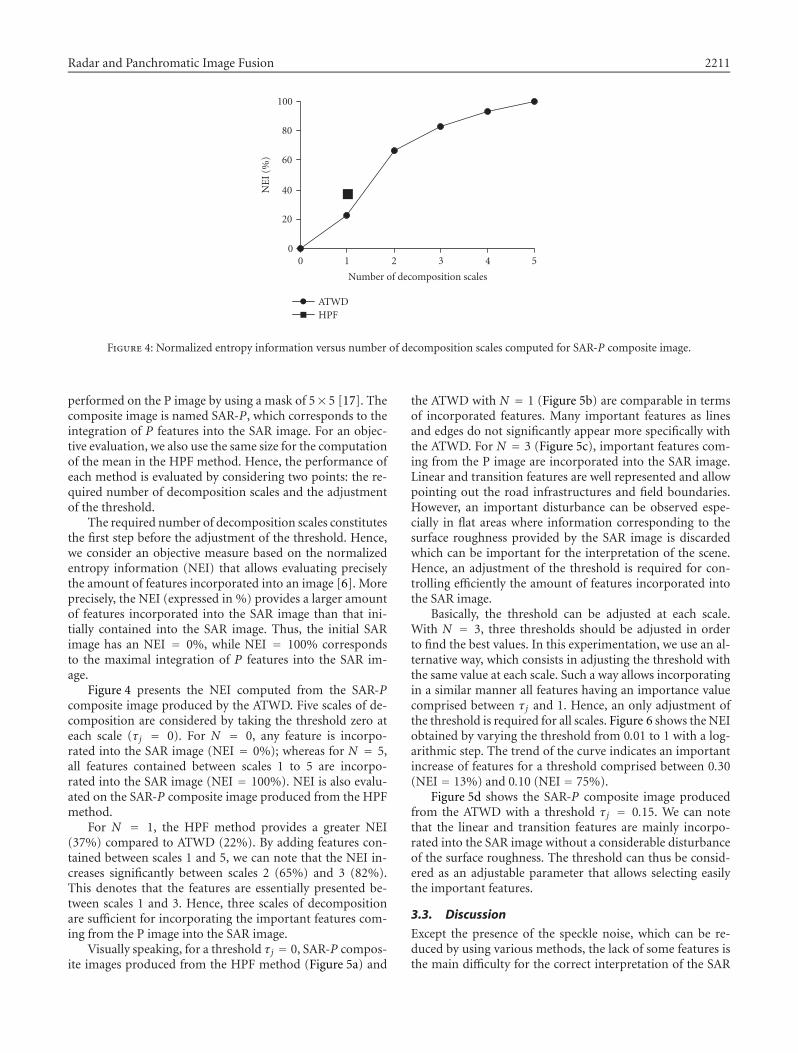
Figure 4: Normalized entropy information versus number of decomposition scales computed for SAR-P composite image.
performed on the P image by using a mask of 5× 5 [17]. Thecomposite image is named SAR-P, which corresponds to theintegration of P features into the SAR image. For an objec-tive evaluation, we also use the same size for the computationof the mean in the HPF method. Hence, the performance ofeach method is evaluated by considering two points: the re-quired number of decomposition scales and the adjustmentof the threshold.
The required number of decomposition scales constitutesthe first step before the adjustment of the threshold. Hence,we consider an objective measure based on the normalizedentropy information (NEI) that allows evaluating preciselythe amount of features incorporated into an image [6]. Moreprecisely, the NEI (expressed in %) provides a larger amountof features incorporated into the SAR image than that ini-tially contained into the SAR image. Thus, the initial SARimage has an NEI = 0%, while NEI = 100% correspondsto the maximal integration of P features into the SAR im-age.
Figure 4 presents the NEI computed from the SAR-Pcomposite image produced by the ATWD. Five scales of de-composition are considered by taking the threshold zero ateach scale (τj = 0). For N = 0, any feature is incorpo-rated into the SAR image (NEI = 0%); whereas for N = 5,all features contained between scales 1 to 5 are incorpo-rated into the SAR image (NEI = 100%). NEI is also evalu-ated on the SAR-P composite image produced from the HPFmethod.
For N = 1, the HPF method provides a greater NEI(37%) compared to ATWD (22%). By adding features con-tained between scales 1 and 5, we can note that the NEI in-creases significantly between scales 2 (65%) and 3 (82%).This denotes that the features are essentially presented be-tween scales 1 and 3. Hence, three scales of decompositionare sufficient for incorporating the important features com-ing from the P image into the SAR image.
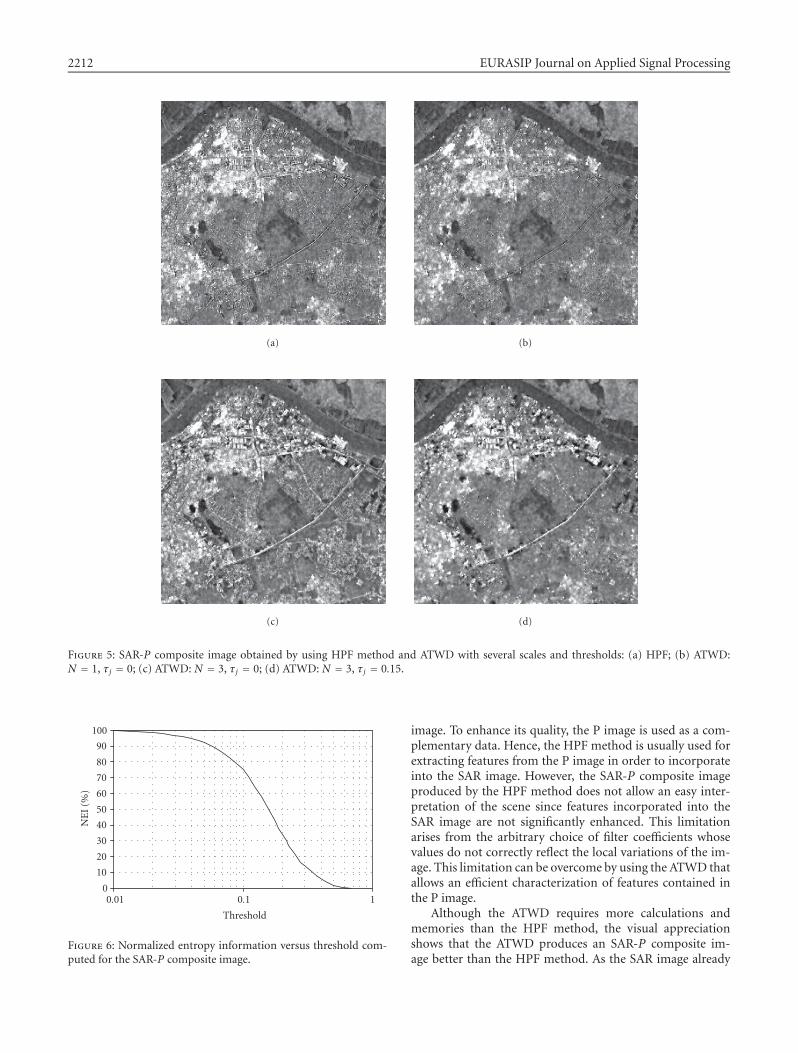
Visually speaking, for a threshold τj = 0, SAR-P compos-ite images produced from the HPF method (Figure 5a) and
the ATWD with N = 1 (Figure 5b) are comparable in termsof incorporated features. Many important features as linesand edges do not significantly appear more specifically withthe ATWD. For N = 3 (Figure 5c), important features com-ing from the P image are incorporated into the SAR image.Linear and transition features are well represented and allowpointing out the road infrastructures and field boundaries.However, an important disturbance can be observed espe-cially in flat areas where information corresponding to thesurface roughness provided by the SAR image is discardedwhich can be important for the interpretation of the scene.Hence, an adjustment of the threshold is required for con-trolling efficiently the amount of features incorporated intothe SAR image.
Basically, the threshold can be adjusted at each scale.With N = 3, three thresholds should be adjusted in orderto find the best values. In this experimentation, we use an al-ternative way, which consists in adjusting the threshold withthe same value at each scale. Such a way allows incorporatingin a similar manner all features having an importance valuecomprised between τj and 1. Hence, an only adjustment ofthe threshold is required for all scales. Figure 6 shows the NEIobtained by varying the threshold from 0.01 to 1 with a log-arithmic step. The trend of the curve indicates an importantincrease of features for a threshold comprised between 0.30(NEI = 13%) and 0.10 (NEI = 75%).
Figure 5d shows the SAR-P composite image producedfrom the ATWD with a threshold τj = 0.15. We can notethat the linear and transition features are mainly incorpo-rated into the SAR image without a considerable disturbanceof the surface roughness. The threshold can thus be consid-ered as an adjustable parameter that allows selecting easilythe important features.
3.3. Discussion
Except the presence of the speckle noise, which can be re-duced by using various methods, the lack of some features isthe main difficulty for the correct interpretation of the SAR
2212 EURASIP Journal on Applied Signal Processing
(a) (b)
(c) (d)
Figure 5: SAR-P composite image obtained by using HPF method and ATWD with several scales and thresholds: (a) HPF; (b) ATWD:N = 1, τj = 0; (c) ATWD: N = 3, τj = 0; (d) ATWD: N = 3, τj = 0.15.
100
90
80
70
60
50
40
30
20
10
0
NEI(%
)
0.01 0.1 1
Threshold
Figure 6: Normalized entropy information versus threshold com-puted for the SAR-P composite image.
image. To enhance its quality, the P image is used as a com-plementary data. Hence, the HPF method is usually used forextracting features from the P image in order to incorporateinto the SAR image. However, the SAR-P composite imageproduced by the HPF method does not allow an easy inter-pretation of the scene since features incorporated into theSAR image are not significantly enhanced. This limitationarises from the arbitrary choice of filter coefficients whosevalues do not correctly reflect the local variations of the im-age. This limitation can be overcome by using the ATWD thatallows an efficient characterization of features contained inthe P image.
Although the ATWD requires more calculations andmemories than the HPF method, the visual appreciationshows that the ATWD produces an SAR-P composite im-age better than the HPF method. As the SAR image already
Radar and Panchromatic Image Fusion 2213
100
80
60
40
20
0
NEI(%
)
0 1 2 3 4 5
Number of decomposition scales
ATWDHPF
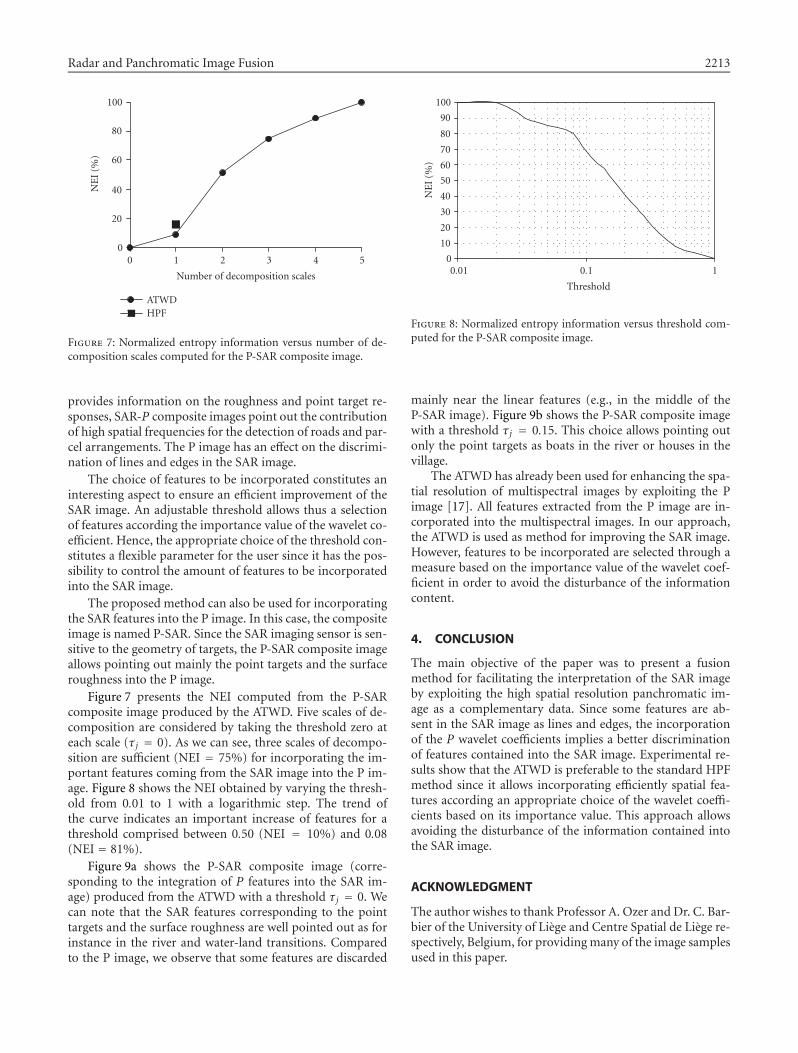
Figure 7: Normalized entropy information versus number of de-composition scales computed for the P-SAR composite image.
provides information on the roughness and point target re-sponses, SAR-P composite images point out the contributionof high spatial frequencies for the detection of roads and par-cel arrangements. The P image has an effect on the discrimi-nation of lines and edges in the SAR image.
The choice of features to be incorporated constitutes aninteresting aspect to ensure an efficient improvement of theSAR image. An adjustable threshold allows thus a selectionof features according the importance value of the wavelet co-efficient. Hence, the appropriate choice of the threshold con-stitutes a flexible parameter for the user since it has the pos-sibility to control the amount of features to be incorporatedinto the SAR image.
The proposed method can also be used for incorporatingthe SAR features into the P image. In this case, the compositeimage is named P-SAR. Since the SAR imaging sensor is sen-sitive to the geometry of targets, the P-SAR composite imageallows pointing out mainly the point targets and the surfaceroughness into the P image.
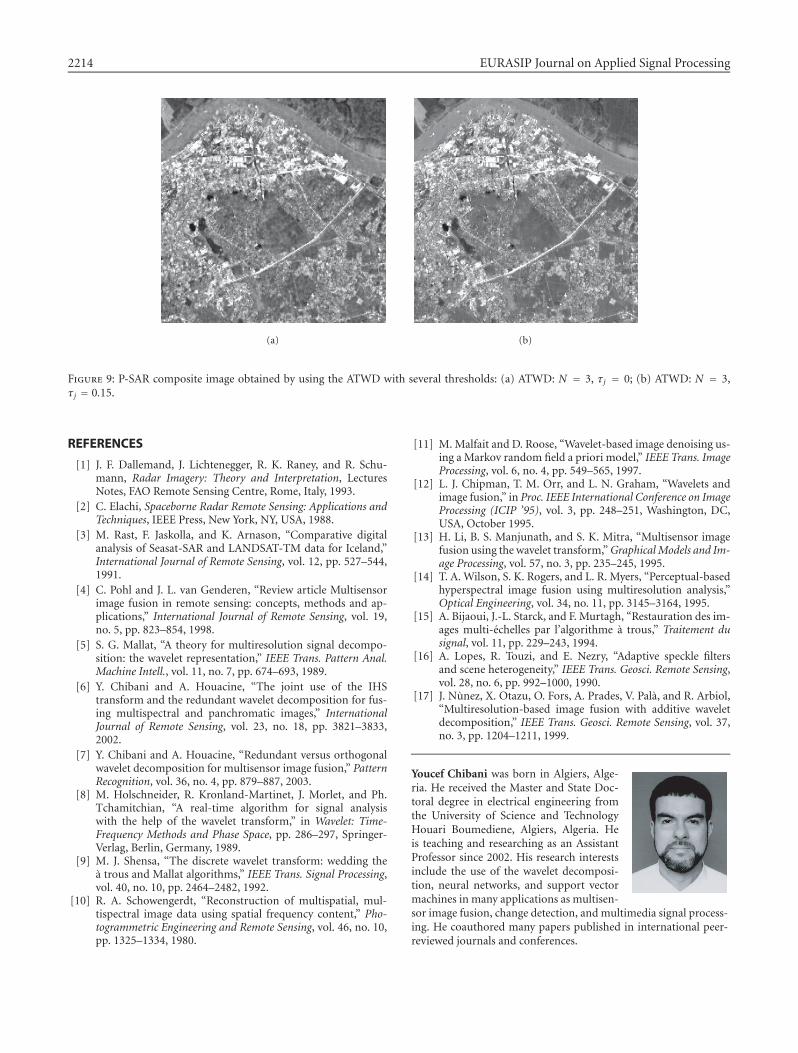
Figure 7 presents the NEI computed from the P-SARcomposite image produced by the ATWD. Five scales of de-composition are considered by taking the threshold zero ateach scale (τj = 0). As we can see, three scales of decompo-sition are sufficient (NEI = 75%) for incorporating the im-portant features coming from the SAR image into the P im-age. Figure 8 shows the NEI obtained by varying the thresh-old from 0.01 to 1 with a logarithmic step. The trend ofthe curve indicates an important increase of features for athreshold comprised between 0.50 (NEI = 10%) and 0.08(NEI = 81%).
Figure 9a shows the P-SAR composite image (corre-sponding to the integration of P features into the SAR im-age) produced from the ATWD with a threshold τj = 0. Wecan note that the SAR features corresponding to the pointtargets and the surface roughness are well pointed out as forinstance in the river and water-land transitions. Comparedto the P image, we observe that some features are discarded
100
90
80
70
60
50
40
30
20
10
0
NEI(%
)
0.01 0.1 1
Threshold
Figure 8: Normalized entropy information versus threshold com-puted for the P-SAR composite image.
mainly near the linear features (e.g., in the middle of theP-SAR image). Figure 9b shows the P-SAR composite imagewith a threshold τj = 0.15. This choice allows pointing outonly the point targets as boats in the river or houses in thevillage.
The ATWD has already been used for enhancing the spa-tial resolution of multispectral images by exploiting the Pimage [17]. All features extracted from the P image are in-corporated into the multispectral images. In our approach,the ATWD is used as method for improving the SAR image.However, features to be incorporated are selected through ameasure based on the importance value of the wavelet coef-ficient in order to avoid the disturbance of the informationcontent.
4. CONCLUSION
The main objective of the paper was to present a fusionmethod for facilitating the interpretation of the SAR imageby exploiting the high spatial resolution panchromatic im-age as a complementary data. Since some features are ab-sent in the SAR image as lines and edges, the incorporationof the P wavelet coefficients implies a better discriminationof features contained into the SAR image. Experimental re-sults show that the ATWD is preferable to the standard HPFmethod since it allows incorporating efficiently spatial fea-tures according an appropriate choice of the wavelet coeffi-cients based on its importance value. This approach allowsavoiding the disturbance of the information contained intothe SAR image.
ACKNOWLEDGMENT
The author wishes to thank Professor A. Ozer and Dr. C. Bar-bier of the University of Liege and Centre Spatial de Liege re-spectively, Belgium, for providingmany of the image samplesused in this paper.
2214 EURASIP Journal on Applied Signal Processing
(a) (b)
Figure 9: P-SAR composite image obtained by using the ATWD with several thresholds: (a) ATWD: N = 3, τj = 0; (b) ATWD: N = 3,τj = 0.15.
REFERENCES
[1] J. F. Dallemand, J. Lichtenegger, R. K. Raney, and R. Schu-mann, Radar Imagery: Theory and Interpretation, LecturesNotes, FAO Remote Sensing Centre, Rome, Italy, 1993.
[2] C. Elachi, Spaceborne Radar Remote Sensing: Applications andTechniques, IEEE Press, New York, NY, USA, 1988.
[3] M. Rast, F. Jaskolla, and K. Arnason, “Comparative digitalanalysis of Seasat-SAR and LANDSAT-TM data for Iceland,”International Journal of Remote Sensing, vol. 12, pp. 527–544,1991.
[4] C. Pohl and J. L. van Genderen, “Review article Multisensorimage fusion in remote sensing: concepts, methods and ap-plications,” International Journal of Remote Sensing, vol. 19,no. 5, pp. 823–854, 1998.
[5] S. G. Mallat, “A theory for multiresolution signal decompo-sition: the wavelet representation,” IEEE Trans. Pattern Anal.Machine Intell., vol. 11, no. 7, pp. 674–693, 1989.
[6] Y. Chibani and A. Houacine, “The joint use of the IHStransform and the redundant wavelet decomposition for fus-ing multispectral and panchromatic images,” InternationalJournal of Remote Sensing, vol. 23, no. 18, pp. 3821–3833,2002.
[7] Y. Chibani and A. Houacine, “Redundant versus orthogonalwavelet decomposition for multisensor image fusion,” PatternRecognition, vol. 36, no. 4, pp. 879–887, 2003.
[8] M. Holschneider, R. Kronland-Martinet, J. Morlet, and Ph.Tchamitchian, “A real-time algorithm for signal analysiswith the help of the wavelet transform,” in Wavelet: Time-Frequency Methods and Phase Space, pp. 286–297, Springer-Verlag, Berlin, Germany, 1989.
[9] M. J. Shensa, “The discrete wavelet transform: wedding thea trous and Mallat algorithms,” IEEE Trans. Signal Processing,vol. 40, no. 10, pp. 2464–2482, 1992.
[10] R. A. Schowengerdt, “Reconstruction of multispatial, mul-tispectral image data using spatial frequency content,” Pho-togrammetric Engineering and Remote Sensing, vol. 46, no. 10,pp. 1325–1334, 1980.
[11] M. Malfait and D. Roose, “Wavelet-based image denoising us-ing a Markov random field a priori model,” IEEE Trans. ImageProcessing, vol. 6, no. 4, pp. 549–565, 1997.
[12] L. J. Chipman, T. M. Orr, and L. N. Graham, “Wavelets andimage fusion,” in Proc. IEEE International Conference on ImageProcessing (ICIP ’95), vol. 3, pp. 248–251, Washington, DC,USA, October 1995.
[13] H. Li, B. S. Manjunath, and S. K. Mitra, “Multisensor imagefusion using the wavelet transform,”GraphicalModels and Im-age Processing, vol. 57, no. 3, pp. 235–245, 1995.
[14] T. A. Wilson, S. K. Rogers, and L. R. Myers, “Perceptual-basedhyperspectral image fusion using multiresolution analysis,”Optical Engineering, vol. 34, no. 11, pp. 3145–3164, 1995.
[15] A. Bijaoui, J.-L. Starck, and F. Murtagh, “Restauration des im-ages multi-echelles par l’algorithme a trous,” Traitement dusignal, vol. 11, pp. 229–243, 1994.
[16] A. Lopes, R. Touzi, and E. Nezry, “Adaptive speckle filtersand scene heterogeneity,” IEEE Trans. Geosci. Remote Sensing,vol. 28, no. 6, pp. 992–1000, 1990.
[17] J. Nunez, X. Otazu, O. Fors, A. Prades, V. Pala, and R. Arbiol,“Multiresolution-based image fusion with additive waveletdecomposition,” IEEE Trans. Geosci. Remote Sensing, vol. 37,no. 3, pp. 1204–1211, 1999.
Youcef Chibani was born in Algiers, Alge-ria. He received the Master and State Doc-toral degree in electrical engineering fromthe University of Science and TechnologyHouari Boumediene, Algiers, Algeria. Heis teaching and researching as an AssistantProfessor since 2002. His research interestsinclude the use of the wavelet decomposi-tion, neural networks, and support vectormachines in many applications as multisen-sor image fusion, change detection, and multimedia signal process-ing. He coauthored many papers published in international peer-reviewed journals and conferences.