Note on Self Containment and Employment Density (EB76) 1. In the Hearing Session to Matter 7 on 20 June 2012, the Council drew the Inspectors attention to the fact that Mr Baker (ID 4020257) had excluded the main employment area in Yate from the evidence which underpinned his Matter 7 Statement. This note explains the Council’s response to Mr Bakers’ assessment and also sets out its response to the Inspectors request for additional information about ‘Self Containment’ and ‘Employment Density’ in the main policy areas of South Gloucestershire, namely; the North Fringe, the East Fringe, Yate and Thornbury. Self Containment 2. The commonly accepted definition of ‘Self Containment’ is: “The proportion of persons in employment who both live and work within the same area” Data sources 3. The data in Table 1 is derived from 2001 Census Table W203, a ward level ‘travel to work’ matrix based on all people aged 16-74 who are in employment. The wards which make up the policy areas for this indicator are illustrated at Appendix A. A B C Area Total number of resident people age 16-74 who are in employment People who live and work in the same area Self Containment' (%) (B/A)*100 East Fringe 49,667 16,774 34% North Fringe 33,716 17,404 52% Thornbury 6,734 2,670 40% Yate 21,935 9,692 44% Table 1. Self Containment Source: Census 2001 Origin and Destination Statistics Table W203 - Mode of Travel 4. This analysis illustrates that 44% of employed residents in Yate work within the same area, a higher proportion than in the East Fringe (34%). These ‘self containment’ figures are clearly much higher than the figures Mr Baker states in Fig 3 (page 4) of his Matter 7 Statement; 19.2% for Yate and 18.5% for the East Fringe, and demonstrates a greater difference between the level of self-containment in the two areas. Employment Density 5. Employment density is the number of economically active people living within an area compared with the number of jobs that exist. A ratio of 1 means that there is an exact balance between the number of economically active people living in a place and the number of jobs there. Data sources 6. There are numerous official data sources that can be used to estimate the number of jobs within an area and unlike the ward based Census Travel to Work data used to calculate the ‘Self Containment’ indicator (Table 1), some data is available at postcode level which enables closer alignment with policy area boundaries. In summary the following data is used in this indicator: • Jobs: The ONS’ Business Register and Employment Survey (BRES) (2010), at ward level, supplemented by postcode level data from the ONS’ Inter-Departmental Business Register (IDBR) (2011) to account for additional jobs in the Yate and East Fringe Employment Areas (which are not accounted for in the ward level aggregations); • Economically Active Population: 2001 Census Table KS09 (Economic Activity – All People).
Transcript
Note on Self Containment and Employment Density (EB76)
1. In the Hearing Session to Matter 7 on 20 June 2012, the Council drew the Inspectors attention to the fact that Mr Baker (ID 4020257) had excluded the main employment area in Yate from the evidence which underpinned his Matter 7 Statement. This note explains the Council’s response to Mr Bakers’ assessment and also sets out its response to the Inspectors request for additional information about ‘Self Containment’ and ‘Employment Density’ in the main policy areas of South Gloucestershire, namely; the North Fringe, the East Fringe, Yate and Thornbury.
Self Containment
2. The commonly accepted definition of ‘Self Containment’ is:
“The proportion of persons in employment who both live and work within the same area”
Data sources
3. The data in Table 1 is derived from 2001 Census Table W203, a ward level ‘travel to work’ matrix based on all people aged 16-74 who are in employment. The wards which make up the policy areas for this indicator are illustrated at Appendix A.
A B C
Area
Total number of resident people age 16-74 who are in
employment
People who live and work in the same area
Self Containment' (%) (B/A)*100
East Fringe 49,667 16,774 34%
North Fringe 33,716 17,404 52%
Thornbury 6,734 2,670 40%
Yate 21,935 9,692 44% Table 1. Self Containment Source: Census 2001 Origin and Destination Statistics Table W203 - Mode of Travel
4. This analysis illustrates that 44% of employed residents in Yate work within the same area, a higher proportion than in the East Fringe (34%). These ‘self containment’ figures are clearly much higher than the figures Mr Baker states in Fig 3 (page 4) of his Matter 7 Statement; 19.2% for Yate and 18.5% for the East Fringe, and demonstrates a greater difference between the level of self-containment in the two areas.
Employment Density
5. Employment density is the number of economically active people living within an area compared with the number of jobs that exist. A ratio of 1 means that there is an exact balance between the number of economically active people living in a place and the number of jobs there.
Data sources
6. There are numerous official data sources that can be used to estimate the number of jobs within an area and unlike the ward based Census Travel to Work data used to calculate the ‘Self Containment’ indicator (Table 1), some data is available at postcode level which enables closer alignment with policy area boundaries. In summary the following data is used in this indicator:
• Jobs: The ONS’ Business Register and Employment Survey (BRES) (2010), at ward level, supplemented by postcode level data from the ONS’ Inter-Departmental Business Register (IDBR) (2011) to account for additional jobs in the Yate and East Fringe Employment Areas (which are not accounted for in the ward level aggregations);
• Economically Active Population: 2001 Census Table KS09 (Economic Activity – All People).
7. Further detail on the geographies which make up the policy areas, and the adjustments which have been made to more accurately reflect the number of jobs in the Yate and East Fringe policy areas are set out at Appendix B. A B C
Policy Area Total Estimated Jobs*
All people aged 16-74 who are Economically
Active**
Employment Density (A/B)
East Fringe 29,225 51,220 0.6
North Fringe 72,367 34,557 2.1
Thornbury 6,621 6,987 0.9
Yate 14,577 19,313 0.8 Table 2. Employment Density
Source: *Jobs: BRES 2010 (Employment Jobs) (ONS) + adjustment using IDBR 2011 (Employment Jobs) (ONS) to more accurately reflect additional jobs in the Yate Employment Area and the additional employment area at Emersons Green
**Economically Active Population: 2001 Census KS09-Economic Activity – All People
8. This analysis illustrates that at 0.8, Yate has a higher ‘employment density’ than the East Fringe (0.6). i.e. a closer balance between the number of jobs and the number of resident workers. These employment densities are clearly much higher than the figures Mr Baker states for both Yate (0.35) and the East Fringe (0.43) in Fig. 7 (pg 5) of his Matter 7 Statement.
Conclusion 9. On the basis of the key issues of ‘self containment’ and ‘employment density’ the Council’s clearly referenced evidence illustrates that Yate is more self contained and has a higher employment density than the East Fringe.
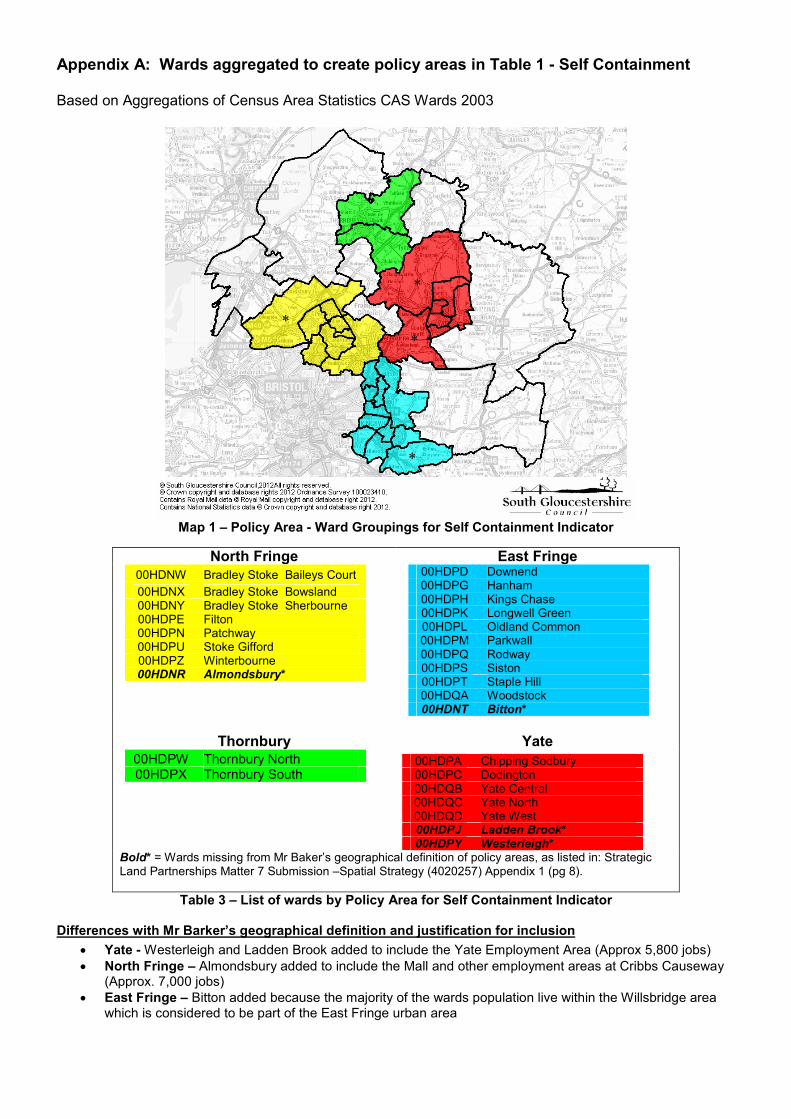
Appendix A: Wards aggregated to create policy areas in Table 1 - Self Containment Based on Aggregations of Census Area Statistics CAS Wards 2003
Map 1 – Policy Area - Ward Groupings for Self Containment Indicator
00HDPD Downend 00HDPG Hanham 00HDPH Kings Chase 00HDPK Longwell Green 00HDPL Oldland Common 00HDPM Parkwall 00HDPQ Rodway 00HDPS Siston 00HDPT Staple Hill 00HDQA Woodstock 00HDNT Bitton*
Thornbury
Yate
00HDPW Thornbury North 00HDPX Thornbury South
00HDPA Chipping Sodbury 00HDPC Dodington 00HDQB Yate Central 00HDQC Yate North 00HDQD Yate West 00HDPJ Ladden Brook* 00HDPY Westerleigh*
Bold* = Wards missing from Mr Baker’s geographical definition of policy areas, as listed in: Strategic Land Partnerships Matter 7 Submission –Spatial Strategy (4020257) Appendix 1 (pg 8).
Table 3 – List of wards by Policy Area for Self Containment Indicator Differences with Mr Barker’s geographical definition and justification for inclusion
• Yate - Westerleigh and Ladden Brook added to include the Yate Employment Area (Approx 5,800 jobs)
• North Fringe – Almondsbury added to include the Mall and other employment areas at Cribbs Causeway (Approx. 7,000 jobs)
• East Fringe – Bitton added because the majority of the wards population live within the Willsbridge area which is considered to be part of the East Fringe urban area
*
*
*
*
Appendix B Stage 1: Wards aggregated to create policy areas in Table 2 – Employment Density Based on Aggregations of Census Area Statistics CAS Wards 2003
Map 2 - Policy Area - Ward Groupings for Employment Density Indicator
Table 5 – Adjustments to Ward level data to more accurately reflect job numbers in the Yate and Emersons Green Employment Areas
*East Fringe: According to the ONS’ Inter-Departmental Business Register (IDBR) (2011) there are 449 'Employment Jobs' located within the 'Folly Brook Road' area of Emersons Green (Map 4). This employment area is located within Westerleigh Ward so is not already included within the ward definition of the East Fringe. No adjustment is made for the economically active population living in this area because no residential addresses are located within this area.
**Yate: Employment Jobs: According to the ONS’ IDBR (2011) there are 5,766 'Employment Jobs' within the Yate Employment Area (Map 3). One Employer within this area is a ‘pay-point’ for a national company (939 jobs) - so is discounted from the figures. A conservative estimate of 1,000 additional jobs is also made to account for the new Council Offices at Badminton Road (which opened April 2010 - but is not included within the IDBR data) = 5,827 jobs (col B). Economically Active Population: To account for the additional economically active population living within the Yate Employment Area, data for two additional Census Output Areas are included (00HDPJ0006 and 00HDPY0006) - totalling an additional 210 economically active residents (col E).