282
DOCTORAL THESIS Self-Diffusion and Microstructure of Some Ionic Liquids in Bulk and in Confinement Andrei Filippov Chemistry of Interfaces
DOCTORA L T H E S I S
Department of Civil, Environmental and Natural Resources EngineeringDivision of Chemical Engineering
Self-Diffusion and Microstructure of Some Ionic Liquids in Bulk and
in Confinement
Andrei Filippov
ISSN 1402-1544ISBN 978-91-7583-583-9 (print)ISBN 978-91-7583-584-6 (pdf)
Luleå University of Technology 2016
Andrei Filippov Self-D
iffusion and Microstructure of Som
e Ionic Liquids in Bulk and in C
onfinement
Chemistry of Interfaces

DOCTORAL THESIS
_________________________________________
Self-Diffusion and Microstructure of Some Ionic Liquids in Bulk and in Confinement
Andrei Filippov
Department of Civil, Environmental and Natural Resources EngineeringDivision of Chemical EngineeringLuleå University of Technology
SE-97187 Luleå, SWEDEN___________________________________________________________
Luleå, May 2016

Printed by Luleå University of Technology, Graphic Production 2016
ISSN 1402-1544 ISBN 978-91-7583-583-9 (print)ISBN 978-91-7583-584-6 (pdf)
Luleå 2016
www.ltu.se
i
Summary
An ionic liquid (IL) is a salt, which usually is in the liquid state at normal
temperature and pressure. The properties of ILs can be adjusted for various
processes and applications by choosing different combinations of ions. Similar
to other salts, ILs contain only ions with positive (cations) and negative
(anions) charges in equal proportions. However, to prevent solidification, ions
in ionic liquids usually contain bulky organic chemical groups, which, apart
from electrostatic interactions, promote other types of interactions between
ions, such as: (i) van-der-Waals interactions; (ii) hydrogen bonding; (iii) -
stacking, etc., depending on the particular chemical structure of the ions. All
these interactions, in combination, may lead to formation of specific
microstructures in ILs, which may vary with temperature caused by changing
thermal rotational and translational energies of the ions. Ions in these
microstructures may have preferential orientations relative to each other,
maintain anisotropic properties similar to those in liquid crystals or, in some
specific cases, may even separate into microscopically organised liquid phases.
Therefore, the dynamics of ILs may also be dependent on their microstructure.
In many practical applications ionic liquids are placed on surfaces or in
confinements. Solid surfaces introduce extra forces, which may be specific to
the charge of the ions or/and to functional groups in the ILs. The geometry and
interactions of ions in confinements or/and pores of materials may also disrupt
specific bulk microstructures of ILs. Both confinement effects and interactions
of ions with surfaces are manifested in the translational dynamics of the ions.
One of the most direct and informative methods to study translational
dynamics of ILs is pulse-field-gradient nuclear magnetic resonance (PFG-
NMR).
ii
In this thesis the results of PFG-NMR studies on a few classes of ILs are
reported: (i) the historically “standard” (since Walden’s discovery in 1914)
ionic liquid, the ethylammonium nitrate (EAN) and (ii) halogen-free
orthoborate-based phosphonium, imidazolium and pyrrolidinium ILs with
varied structure and lengths of alkyl chains in cations, and varied structures of
orthoborate anions. These ILs were studied in bulk at different temperatures,
and also in confinements, such as between parallel glass and Teflon plates and
in mesoporous Vycor glass. It was found that diffusion coefficients of cations
and anions in EAN, phosphonium and pyrrolidinium orthoborate ILs in bulk
are different, but according to the standard Stocks-Einstein model, they
correspond to diffusion of ions in homogeneous liquids. A change in the
chemical structure of one of the ions results in a change in both the diffusion
coefficient of the oppositely charged ion and the activation energy of diffusion
for both ions in an IL. Similar effects were observed from the chemical shifts
and diffusion coefficients measured by NMR for imidazolium orthoborate ILs
dissolved in polyethylene glycol solutions, in which imidazolium cations
strongly interact with PEG molecules, further affecting the diffusion of
orthoborate anions via electrostatic interactions. A liquid-liquid phase
separation was suggested for a few phosphonium and pyrrolidinium
bis(mandelato)borate ILs, in which a divergence of diffusion coefficients and
activation energies of diffusion for cations and anions was detected at
temperatures below ca 50°C. In addition, a free-volume theory was invoked to
explain the dependences of density of ILs on the alkyl chain length in cations.
It was also found that for a phosphonium bis(salicylato)borate IL confined in
4-nm mesoporous Vycor glass the diffusion coefficients of ions increase by a
factor of 35 and demonstrate bimodal distribution. This phenomenon was
explained by the dynamic heterogeneity of this IL in micropores and empty
iii
voids of the Vycor glass. For EAN IL in confinements between glass and
Teflon plates, the diffusion of ethylammonium cations and nitrate anions is
significantly anisotropic, i.e. slower in the direction of the normal to the plates
and faster along the plates compared to diffusion of the ions in bulk. A
plausible explanation of this PFG NMR data is that EAN forms layers near
polar and non-polar solid surfaces. Phenomena of acceleration or deceleration
of diffusion were also observed for phosphonium cations of
bis(mandelato)borate, bis(salicylato)borate and bis(oxalato)borate confined
between glass plates. The results of these studies may have implications in
modeling tribological performance, i.e., friction and wear reduction for contact
pairs of different materials lubricated by various classes of ionic liquids.
iv
Acknowledgements
First, I would like to express my acknowledgement to my supervisors,
Professor Oleg N. Antzutkin and Associate Professor Allan Holmgren.
I would like to acknowledge all the researchers of the research teams involved
in I-LEAP project (Ionic Liquids Lubricants Enabling Advanced Performance):
Prof. Sergei Glavatskih and his research team at the Division of System and
Component Design, KTH; Prof. Mark Rutland and his research group at the
Division of Surface and Corrosion Science, KTH; Prof. Istvan Furo and his
research team at the Department of Physical Chemistry, KTH; Prof. Lars Kloo
and his research team at the Division of Applied Physical Chemistry, KTH;
Prof. Aato Laaksonen and his research team at the Department of Physical
Chemistry, Stockholm University.
I wish to thank Dr. Oleg I. Gnezdilov and Dr. Nail M. Azancheev from the
Department of Molecular Systems, Kazan Federal University for our
discussions and help with some of the NMR experiments.
The Knut and Alice Wallenberg foundation (project number KAW 2012.0078)
and the Swedish Research Council (project numbers 621-2013-5171 (OA),
621-2011-4600 and 621-2014-4694 (SG), 621-2011-4361 (MR)) are gratefully
acknowledged for their financial support. The Foundation in memory of J. C.
and Seth M. Kempe and “Labbfonden” of Luleå University of Technology is
gratefully acknowledged for providing grants, from which the NMR equipment
and probes at LTU have been purchased.
I am deeply grateful for the help and cooperation of my close colleagues in the
NMR and Chemistry of Interfaces groups: Dr. Faiz Ullah Shah,

v
Dr. Shubhankar Bhattacharryya, Dr. Manishkumar Shimpi, Dr. Anna-Carin
Larsson, Dr. Mamoun Taher and Dr. Anuttam Patra.
My colleagues at the Department of Civil, Environmental and Natural
Resources Engineering and especially of the Division of Chemical Engineering
are acknowledged for their friendly relations.
“Scriptia Academic Editing” is acknowledged for the proof-reading of this
thesis.
I am deeply grateful to my family for ongoing support: my mamma, my wife
Alfia, son Dmitry, daughter Aleksandra and granddaughter Juliana.
vi
List of articles included in the thesis
I. Long-range dynamics for ethylammonium nitrate in bulk and in
confinement.
Andrei Filippov, Oleg I. Gnezdilov, Nicklas Hjalmarsson, Oleg N.
Antzutkin, Sergei Glavatskih and Mark W. Rutland
Manuscript, to be submitted.
II. NMR self-diffusion study of a phosphonium bis(mandelato)borate ionic
liquid.
Andrei Filippov, Faiz Ullah Shah, Mamoun Taher, Sergei Glavatskih and
Oleg N. Antzutkin
Physical Chemistry Chemical Physics, 15 (2013) 9281-9287.
III. Effect of length of long alkyl chains of cations on diffusion and density in
pyrrolidinium bis(mandelato)borate ionic liquids.
Andrei Filippov, Mamoun Taher, Faiz Ullah Shah, Sergei Glavatskih and
Oleg N. Antzutkin
Physical Chemistry Chemical Physics, 16 (2014) 26798-26805.
IV. Self-diffusion and interactions in mixtures of imidazolium
bis(nandelato)borate ionic liquids with poly(ethylene glycol): 1H NMR
study.
Andrei Filippov, Nail Azancheev, Mamoun Taher, Faiz Ullah Shah,
Pauline Rabet, Sergei Glavatskih and Oleg N. Antzutkin
Magnetic Resonance in Chemistry, 53 (2015) 493-497.
vii
V. Diffusion of cation in halogen-free phosphonium orthoborate ionic liquids
confined between parallel glass plates.
Andrei Filippov, Faiz Ullah Shah, Sergei Glavatskih, Mark W. Rutland
and Oleg N. Antzutkin
Manuscript, to be submitted.
VI. Self-diffusion of phosphonium bis(salicylato)borate ionic liquid in pores of
Vycor porous glass.
Andrei Filippov, Nail Azancheev, Faiz Ullah Shah, Sergei Glavatskih and
Oleg N. Antzutkin Microporous and Mesoporous Materials (2016),
submitted.
viii
List of abbreviations
AFM Atomic Force Microscopy
[BMB]- Bis(mandelato)borate anion
[BScB]- Bis(salicylato)borate anion
[BOB]- Bis(oxalato)borate anion
[BMLB]- Bis(malonato)borate anion
CORE COmponent REsolved method of analysis of
NMR diffusion data
[CnC1Pyrr]+ N-alkyl-N-methylpyrrolidinium cation
[CnC1Im]+ 1-alkyl-3-methylimidazolium cation
[P6,6,6,14]+ Phosphonium cation
DD Diffusion Decay
DDs Diffusion decays
Ds, D Self-diffusion coefficient
ED Energy of activation for diffusion
EA Ethylammonium cation
EAN Ethylamminium nitrate
FID Free Induction Decay
ILs Ionic liquids
NMR Nuclear magnetic resonance
PEG Polyethylene glycol
PFG NMR Pulsed-Field-Gradient NMR technique
PFGStE Pulsed-Field-Gradient Stimulated Echo NMR
technique
RTIL Room temperature ionic liquid
SAXS Small-Angle-Xray-Scattering
ix
SANS Small-Angle-Neutron-Scattering
T1 Spin-lattice relaxation time
T2 Spin-spin relaxation time
VFT Vogel-Fulcher-Tamman equation
List of abbreviations (Literature review)
[BETI]- bis(perfluoroethylsulfonyl)imide anion
[BF4]- tetrafluoriborate anion
[BF6]- hexafluoriborate anion
[BMIm]+ 1-butyl-3-methylimidazolium cation
[BP]+ 1-butylpyridinium cation
[BMPRO]+ N-butyl-N-methylpyrrolidinium cation
[C2mim]+ 1-ethyl-3-methylimidazolium cation
[DMIm]+ dimethylimidazolium cation
[EMIm]+ 1-ethyl-3-methylimidazolium cation
[EtSO4]- ethylsulfate anion
[H2NC(dma)2]+ N,N,N´,N´-tetramethylguanidinium cation
[HMIm]+ 1-hexyl-3-methyl-imidazolium cation
[TFSI]- bis(trifluoromethylsulfonyl)imide anion
[NTf2]- bis(trifluoromethanesulfonyl)amide anion
[OAc]- acetate anion
PAN propylammonium nitrate ionic liquid
PEI polyethyleneimine
[PF6]- hexafluorophosphate anion
STM scanning tunneling microscopy
x
CONTENTS
Comprehensive summary
CHAPTER 1. IONIC LIQUIDS…………………………………………. 1
1.1 Introduction……………………………………………………….. 1
1.2 Physical properties of ionic liquids……………………………….. 2
1.3 Dynamics of ionic liquids………………………………………… 2
1.4 Research objectives……………………………………………….. 4
CHAPTER 2. TRANSLATIONAL MOBILITY OF IONIC LIQUIDS… 5
2.1 Local and translational mobility of molecules and ions…………... 5
2.2 Measurement of self-diffusion by NMR………………………….. 8
2.2.1 NMR facilities………………………………………………... 10
2.3 Self-diffusion in bulk ionic liquids: Role of microstructure on
diffusion of ions…………………………………………………… 11
2.3.1 Diffusion of cations, anions and cation-anion pairs………….. 12
2.3.2 Effects of anions and cations…………………………………. 14
2.3.3 Diffusivity and ionicity of ILs………………………………... 15
2.3.4 The Stokes-Einstein relation applied to ILs………………….. 16
2.3.5 Temperature dependence of diffusivity in ILs……………….. 17
2.3.6 Relation of diffusivity with other parameters………………... 18
2.3.7 Nano-phase structure of ILs………………………………….. 18
2.4 Self-diffusion of ionic liquids in mixtures with some neutral
liquids……………………………………………………………... 23
2.5 Self-diffusion of ionic liquids near solid surfaces and in
confinements………………………………………………………. 23
xi
CHAPTER 3. DIFFUSION OF IONIC LIQUIDS IN
NON-RESTRICTED VOLUMES……………………….. 28
3.1 Diffusion in bulk ethylammonium nitrate………………………… 28
3.2 Diffusion of some halogen-free phosphonium orthoborate ionic
liquids……………………………………………………………... 36
3.2.1 Phosphonium orthoborate ionic liquids………………………. 36
3.2.2 Dialkylpyrrolidinium bis(mandelato)borate ionic liquids……. 43
3.3 Diffusion and interaction of imidazolium BMB ionic liquid in
mixtures with polyethylene glycol………………………………… 59
CHAPTER 4. DIFFUSION OF IONIC LIQUIDS NEAR SOLID
SURFACES AND IN CONFINEMENT………………... 72
4.1 Diffusion of ethylammonium nitrate confined between glass and
PTFE plates………………………………………………………... 72
4.2 Diffusion of phosphonium orthoborate ionic liquids confined
between glass plates……………………………………………….. 94
4.3 Diffusion of phosphonium BScB ionic liquid in mesopores of
Vycor glass………………………………………………………... 101
Overall conclusions……………………………………………………… 117
Future work……………………………………………………………… 120
References……………………………………………………………….. 121

1
CHAPTER 1. IONIC LIQUIDS
1.1 Introduction
Room temperature ionic liquids (ionic liquids, ILs) are a new class of
materials, which has become an intensive scientific research topic and found
practical applications during the last 20 years. Applications of ionic liquids are
continuously expanding, for example as electrolyte material in lithium batteries
[1] and ultracapacitors [2], media for chemical reactions and separation [3,4],
as lubricants [5-9], etc. The potential for various applications of ionic liquids
lies in the broad chemical variability of their components which results in
enormous potential for customisation. Plechkova and Seddon estimated that
there may be in excess of 106 possible ILs if all currently known cations and
anions were to be used [10].
According to definition, an ionic liquid is a liquid solely formed by ions or a
solid with a low melting point (< 100oC). This means it is a molten salt, which
is in the liquid state at normal temperature and pressure. Ionic liquids are
formed typically from organic cations and either organic or inorganic anions
[3,11]. Electrostatic attractions between ions do not lead to solidification not
only because of thermal motion, but also because of their bulkiness and the
structural anisotropy of ions, which may contain long alkyl chains, single
or/and multiple aromatic rings in their three-dimensional conformations. Other
than electrostatic interactions, such as hydrogen bonding, van-der-Waals, -
stacking and other interactions may complete with the electrostatic interaction.
2
1.2 Physical properties of ionic liquids
Physical properties of bulk ILs are affected by different factors, such as
chemical structure of the ions, the intra-molecular and inter-molecular
interactions, temperature, and the presence of gaseous, liquid or solid
impurities. Neighboring solid surfaces or confinement in pores may also
change some of these properties of ILs. The most characteristic properties of
ILs are their negligible volatility, low flammability, high polarity, and high
ionic conductivity. High thermal stability is a property typical for some, but not
all, classes of ILs. ILs can be dissolved in or mixed with various polar organic,
non-organic and ionic compounds.
Variability of physical and chemical properties of ILs is based on the diversity
of ion pairs and on the potential chemical variability of cations and anions.
This leads to a wide range of possibilities for designing ILs with specific
properties. Customisation in this case means that it is possible to specifically
synthesize a compound with a desired property.
1.3 Dynamics of ionic liquids
Dynamics in a narrow sense means any type of motion and the forces
responsible for these motions. At the molecular level for a system in
equilibrium, the main source of motion of molecules and/or ions is thermal
energy. Motion (mobility) of the latter is manifested in different forms and on
different size and time scales. Local mobilities such as random rotations,
vibrations and oscillations of different types and different degrees of anisotropy
are characteristic for different chemical groups as well as for molecules (ions)
as a whole. Rotation is also typical for molecular aggregates in complex
colloidal systems. All of these mobilities occur in short size ranges, which are
smaller or comparable in size to the molecule (ion, aggregate).
3
Translational mobility (displacement of the center of mass of ions, molecules
or molecular aggregates) occurs in the scale much larger than the characteristic
size of molecules/ions. The process of random translational displacement,
which takes place under the influence of thermal energy, is defined as “self-
diffusion”. The application of extra forces may lead to directed translational
displacements. Electrophoretic mobility is typical for ions in solutions as well
as for ions of ILs exposed to an external electric field [12,13]. The application
of mechanical strain/stress forces will lead to flow, while the internal resistance
of an liquid to the external force is described as viscosity.
There are conditions, under which translational mobility in the bulk IL is
restricted. These are crystallisation and also vitrification at a temperature below
the glass transition.
It is known that the study of self-diffusion of liquids confined in porous media
is informative concerning the specific state of the liquid in confinement and
also concerning the internal geometry of pores [14-16].
On any scale, local and translational mobilities are important for chemical
reactions to occur. Examination of local mobilities by IR, Raman, NMR
chemical shift and NMR-relaxation spectroscopies give a vision of interaction
inside and between ions, inside molecular aggregates, with solid surfaces and
with non-ionic and ionic additives.
Translational mobility (diffusivity) is a primary and necessary condition for
translational displacements of molecules in liquids under the influence of any
forces. Examining the numerous applications of ILs, such as electrolyte
materials, media for chemical reactions and separation, and lubricants, it is
evident that knowledge of the parameters of translational mobility for
particular ILs is needed to design and control these processes. One of aspects
of lubrication is a decrease of friction between solid surfaces by applying a
lubricant, usually a liquid. In the case of a liquid lubricant, the mobilities of
4
molecules or ions, their change due to the formation of lubrication films or
layers is expected to correlate with a change of viscosity at the site of
lubricated contact.
An important property of ionic liquids is their ionic composition. Therefore,
the processes of dissociation-association of ions are of key importance for IL’s
conductivity, viscosity, and formation of layers near solid surfaces that
consequently may be related to the desired properties of ILs as electrolytes in
batteries, lubricants and media solvents for chemical reactions.
1.4 Research objectives
Based on the literature, the need for basic understanding of the properties of
ionic liquids and on the practical importance of the application of the newly-
synthesised ILs, the main objectives of the work were:
Study of basic features of bulk translational mobility of ionic liquids on
examples of “classic” and newly-designed IL systems.
Elucidation of effects of solid surface and confinement on the dynamics
of ionic liquids.
Investigation of interactions and dynamics of ionic liquids in their
mixtures with non-ionic liquids.
Understanding the correlation between dynamic properties of ILs in bulk,
near solid supports or in restricted geometries, and lubrication
performance of these ILs.

5
CHAPTER 2. TRANSLATIONAL MOBILITY OF IONIC LIQUIDS
In this chapter we describe the main features of the translational mobility (self-
diffusion) of molecules/ions in fluids and their characteristics relevant to ionic
liquids in bulk, in mixtures with non-ionic liquids, near solid surfaces and in
confinement.
2.1 Local and translational mobility of molecules and ions
Self-diffusion is the process of random thermal motion as a consequence of the
Second Law of thermodynamics [10]. Equipartition theorem relates the
temperature T of a system with the mean energy of its molecular energy:
kTfEthermal 21
, (1)
where f is the number of degrees of freedom, and k is the Boltzman constant. If
a molecule at time 0 was in the position x0, the probability to find it at time t in
the position x may be described by a Gaussian function [17]:
tDsxx
tDstxP
4exp
41),(
20 , (2)
where Ds is the diffusion coefficient of the molecule. Averaged displacement
of molecules in a system can be obtained by averaging of Eq.(2) for all
possible displacements. It gives zero at equilibrium, as a consequence of the
homogeneity and isotropy of the system. Mean-squared displacement
<(x - x0)2> can also be obtained by performing a proper averaging of Eq.(2). It
is not zero at t > 0, instead it gives an expression, which can be used to
characterize displacement of molecules for a certain interval of time (diffusion
time) as [17]:
6
tDsxx 2)( 20 . (3)
Diffusion (self-diffusion) coefficient in Eqs. (2) and (3) is a parameter, which
is not dependent on time and, therefore, can be used to characterise the
translational mobility (diffusivity) of a certain type of molecule under certain
conditions (temperature, pressure, molecular interactions). As the external
conditions change, diffusion coefficient obligatorily also change. For example,
an increase in temperature (and, therefore, mean thermal energy of molecules)
leads to an increase of Ds. To describe the temperature dependence of Ds is not
a trivial task. In a simplified assumption it has been described as an activation
process of the type of an Arrhenius function [17]:
RTEDTDs Dexp*)( , (4)
where D* is a parameter, which is not dependent on temperature, ED is the
molar activation energy of diffusion, and R is the gas constant. This equation
does not take into account different temperature dependences of various
processes, which influence the interactions between molecules, so it is typically
fulfilled in a narrow temperature range. More complicated forms of the
temperature dependence of Ds have been obtained taking into consideration the
asymptotic proximity of the system’s temperature to its glass transition
temperature, T0: a Vogel-Fulcher-Tamman (VFT) equation has been derived
for diffusivity that is equivalent to the Arrhenius dependence of Ds in the high-
temperature limit [18]:
0
exp*TTBDDs .
(5)
7
Here D*, T0, and B are adjustable parameters. Usually, parameters (fitting
parameters) in this equation are compared to those obtained from temperature
dependences in other transport processes, such as conductivity and viscosity
[18]. Experimental dependencies of Ds on temperature, the same as other
transport properties, viscosity and conductivity obtained in a rather wide
temperature range, usually, do not obey the “standard” Arrhenius equation (Eq.
(4)). However, they can be described by the VFT equation by choosing the
appropriate B and T0 as fitting parameters [18-20].
Ionic liquids and other liquid systems with ILs as components contain at least
two diffusing species. These might be a cation, and an anion individually,
cation and anion in an associating form, a molecule of additive individually, an
ion associated with an additive molecule, an associate of the additive
molecules, etc. Particular attention is usually paid to a fraction of individual
(dissociated) ions, because just these ions control electrical conductivity,
solvation and some other important properties of ILs. This fraction can be
estimated from a combination of diffusion measurements with conductivity, or
from electrophoretic NMR measurements.
For a special case of diffusion of a Brownian particle in a viscous fluid, an
equation for diffusion coefficient can be expressed in the form of Stokes-
Einstein equation [17]:
HRTkDs
6(6)
where is viscosity and RH is the hydrodynamic radius of the particle. This
equation has been applied successfully to describe diffusion of globular
proteins in diluted solutions. In some cases where the particle shape is
evidently non spherical, Eq. (6) can be modified by introducing an empirical
8
factor (c) responsible for the deviation of the self-diffusion behavior of the
particle, as described by Eq.(7):
HRcTkDs / , (7)
where c is a constant in the range of 4-6.
2.2 Measurement of self-diffusion by NMR
Under influence of a magnetic field, NMR active nuclei (such as 1H or 13C)
absorb electromagnetic radiation at a frequency characteristic of a selected
magnetic isotope [21]. The resonant frequency, energy of absorption, and the
intensity of the signal are proportional to the strength of the magnetic field.
Upon excitation of the sample with radio frequency pulses, a nuclear magnetic
resonance response as a function of time - a Free Induction Decay (FID) - is
obtained. A Fourier transform (FT) is done to extract the frequency-domain
spectrum from the time-domain FID. The spectrum is influenced by local
magnetic fields from electronic clouds of atomic or/and molecular orbitals,
which are modulated by intra-molecular and inter-molecular interactions. Thus,
an NMR spectrum contains information about molecular structure, and intra-
and inter- molecular interactions.
Nuclear magnetic resonance can be used also to measure the translational
displacement of molecules in fluids (NMR diffusometry) [14,21,22]. This
technique is based on an analysis of the decay of the NMR signal due to a
change of phase of magnetic nuclei in the course of their translational
displacement in an applied calibrated inhomogeneous magnetic field. In all
modern versions of this technique usually a set of radiofrequency pulses, as
well as magnetic field gradient pulses, is applied to obtain and operate with
spin-echo (or stimulated spin-echo) at different diffusion times [14]. The most
9
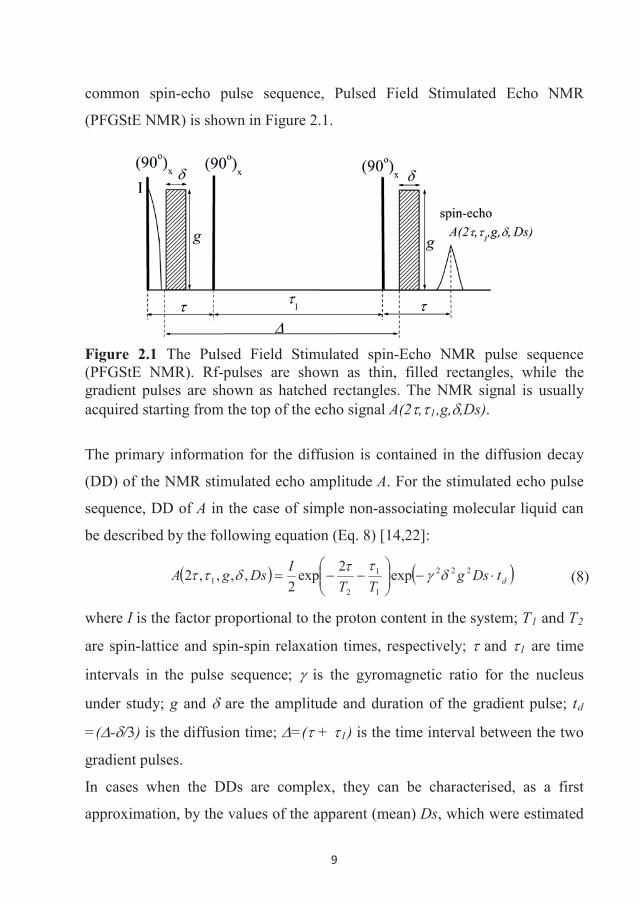
common spin-echo pulse sequence, Pulsed Field Stimulated Echo NMR
(PFGStE NMR) is shown in Figure 2.1.
Figure 2.1 The Pulsed Field Stimulated spin-Echo NMR pulse sequence (PFGStE NMR). Rf-pulses are shown as thin, filled rectangles, while the gradient pulses are shown as hatched rectangles. The NMR signal is usually acquired starting from the top of the echo signal A(2 , 1,g, ,Ds).
The primary information for the diffusion is contained in the diffusion decay
(DD) of the NMR stimulated echo amplitude A. For the stimulated echo pulse
sequence, DD of A in the case of simple non-associating molecular liquid can
be described by the following equation (Eq. 8) [14,22]:
dtDsgTT
IDsgA 222
1
1
21 exp2exp
2,,,,2 (8)
where I is the factor proportional to the proton content in the system; 1 and 2
are spin-lattice and spin-spin relaxation times, respectively; and 1 are time
intervals in the pulse sequence; is the gyromagnetic ratio for the nucleus
under study; g and are the amplitude and duration of the gradient pulse; td
=( - /3) is the diffusion time; =( + 1) is the time interval between the two
gradient pulses.
In cases when the DDs are complex, they can be characterised, as a first
approximation, by the values of the apparent (mean) Ds, which were estimated
10
as derivatives of the corresponding DDs when the parameter “ 2 2g2td”
approaches zero (see Eq. (9)):
0222
222
222dtg
d
d
tgtgAsD (9)
The multi-component form of DDs may mean that molecules contained in a
liquid diffuse with two or more Ds. For this reason, experimental diffusion
decays can be examined using the “CORE” method i. e., the global analysis of
the entire data set [23].
Then, DDs can be presented in the following form, Eq. (10):
)exp()exp()0(/)( 2222
21222
1 dd tDgPtDgPAA (10)
Here, Pi and Di are apparent fractions and Ds associated with two diffusing
species, respectively. The form of Eq. (10) means that at least two
molecular/ionic (or supra-molecular) species have different Ds at these
temperatures.
2.2.1 NMR facilities
In our experiments with ionic liquids Bruker Avance III (Bruker BioSpin AG,
Fällanden, Switzerland), an NMR spectrometer was used with a working
frequency of 400 MHz for 1H. This spectrometer allows acquisition of high-
resolution NMR spectra for 1H, as well as 15N, 11B, 13C, and 31P nuclei. Data
were processed using Bruker Topspin 3.1 software. NMR self-diffusion
measurements for bulk ILs and ILs confined between restrictions were
performed with a Pulsed-Field-Gradient (PFG) probe Diff50 (Bruker) with a
maximum amplitude of the magnetic field gradient pulse up to 30 T/m in a
wide frequency range i. e. for nuclei from 1H to 15N. A sample (approximately
11
300 μl) was placed in a standard 5-mm glass sample tube and sealed with a
plastic stopper to avoid any contact with air. Before each measurement, the
sample was equilibrated at the specified temperature for 20 minutes.
Some of the 1H and 31P NMR diffusion measurements in bulk and on samples
confined between glass or PTFE plates were performed on a Chemagnetics
InfinityPlus CMX-360 spectrometer with a working frequency of 359.9 MHz
for 1H. A specially purpose-made NMR goniometer probe was used, which
enables macroscopically-aligned layers to be oriented with the plate’s normal
at different angles, with respect to the main magnetic field [24].
2.3 Self-diffusion in bulk ionic liquids. Role of microstructure on diffusion
of ions
Numerous methods can be used to study molecular mobility in fluids, with
NMR being an exceptionally informative technique for studying translational
diffusion [14,25]. NMR is an effective technique for examining the interactions
between ions in complex systems such as ionic liquids [26,27]. Moreover,
different modifications of NMR experiments allow investigation of local and
translational mobilities of the cations and anions in ILs [6,12,19,28,29]. The
research potential of NMR to study the dynamics of ILs has been recognized
for the last 15 years [18,30]. The application of NMR to examine diffusion of
ionic liquid has been demonstrated in a number of earlier studies where proton
pulsed field gradient spin-echo and stimulated spin-echo have been used
[12,28,31-35]. Measurements of self-diffusion coefficients of either cations or
anions by NMR are based on their spectral selectivity. The most common
nuclei used to measure diffusion of ions in ILs are 1H and 19F, however, 7Li, 11B, 13C and 31P recently also have been used [29,36,37]. The best studied to
date are imidazolium-based ILs, both in terms of experiments and Molecular
Dynamics simulations.
12
Molecular Dynamics simulations have also yielded a wealth of information
about the local dynamics of ILs, as well as diffusivity and viscosity [38]. There
is a large and growing body of work where diffusivities of different ILs are
computed. However, the molecular dynamics of ILs is more complex than that
for simple liquids. Moreover, it is manifested in multiple timescales. Therefore,
many of assumptions used for simple liquids may not be applicable for ILs.
2.3.1 Diffusion of cations, anions and cation-anion pair
Many works have been published where diffusion of ions has been measured in
bulk ILs. Hayamazu et al. have reported on translational (self-diffusion) and
local (rotational correlation times of ions, c, obtained from spin-lattice NMR
relaxation, T1) molecular motions of cations and anions in two selected ILs
based on [BF4]- anions and either [EMIm]+ or [BMIm]+ cations [35]. They
have demonstrated that translational diffusion of cations is related to molecular
librational motion, while self-diffusion of [BF4]- is predominantly coupled with
a reorientational motion. A similar set of NMR techniques has been used to
study both rotational and translational motions of methylimidazolium cations
and bis(trifluoromethanesulfonyl)amide and bis(fluorosulfonyl)amide anions
and their corresponding binary systems with lithium salts [33]. It has been
found that the bulk viscosity, , versus c and the cation diffusivity, Ds(cat),
versus 1/ c are significantly correlated.
For a series of ILs it has been shown that a key quantity determining the ion
mobility, the so-called mean ion jump length, increases with the molecular
volume of the ionic liquid [39].
In a series of works performed by Watanabe et al. [18,19,40-42], diffusion of a
number of ILs was studied together with some other macroscopic
physicochemical transport properties such as viscosity and conductivity. In
these studies, a unique diffusion coefficient was obtained for most of the ionic
13
liquids studied. In all such cases the diffusivities of cations and anions were
very close, but different. This phenomenon has also been observed by Sangoro
et al. in a series of ILs based on the bis(trifluoromethylsulfonyl)imide anion
[39]: the mono-exponential behavior of diffusion decays corresponding to one-
component diffusion was observed in a broad temperature range from -20 to
+60 oC. The same trend was observed by Watanabe et al. [19,30,40,41],
Hayamazu et al. [33] in 1-ethyl-3-methyl-imidazolium ILs in the temperature
range from +17 to +80 oC and by Annat et al. [31] in N-methyl-N-
propylpyrrolidinium -based ILs at a temperature of +25 oC. Noda et al. have
reported that cations (from 1H NMR) diffuse almost equally fast compared to
the anion (from 19F NMR) in [EMIm][BF4] and [BP][BF4], whereas cations
diffuse significantly faster than anions in [EMim][TFSI] and [BP][TFSI] [18].
The molecular size of each type of ions does not directly affect their ionic
diffusion coefficients [18]. In a series of 1-alkyl-3-methylimidazolium
bis(trifluoromethane sulfonyl)imide ILs, higher Ds correspond to the cation,
even though the cation effective hydrodynamic radius is larger than that of the
anion [19]. Similarly, in the water-free IL [EMIm][EtSO4], the diffusivity of
the bulkier cation is larger than that of the less bulky anion. This anomalous
relationship between the size and diffusivity of ions in ILs has been attributed
to the existence of local microstructures in these ILs, resulting in the
cooperative character (either accelerated or retarded) of ion diffusion [43].
In ILs 1H and 19F NMR signals for cations and anions, respectively, usually
exhibit NMR resonance lines without any additional multiplicity, indicating
that, even though these ions can persist in a fully dissociated state, or they are
paired or comprise in aggregated ionic species, the rate of exchange between
the dissociated and associated ions in the ILs is faster than the time scale of
NMR measurements [19].
14
For one of the imidazolium-based ILs Menjoge et al. noticed that one water
molecule per two ionic pairs can already be sufficient for formation of
hydrogen bonds between anions and water molecules in complex IL-water
mixtures [43].
Despite all the available data on diffusion coefficients in a variety of ILs, a
unified molecular model that explains all variations in the self-diffusion
behavior of ions in ILs has not been constructed yet. An approach has been
suggested by Klähn et al. [44], in which the diffusion model is based on
diffusion of ions via cavities in a liquid. In this model cavities may occur at
random positions and with random sizes caused by thermal fluctuations. Ions
diffuse into the fraction of cavities that are sufficiently large to accommodate
them. Molecular Dynamics simulations performed for guanidinium-based ILs
have shown that ions experience a brachiation type of movement, where a
diffusive transition is initiated by cleaving close contact to a coordinated
counterion, after which the ion diffuses only about 2 Å until new contacts are
formed with another counter-ion in its vicinity [44].
2.3.2 Effects of anions and cations
The effects of anions and cations on diffusion have been studied in some series
of ILs. For a number of [BMIm] ILs with a variety of anions, the diffusion
coefficients of both ions were changed as the type of the anion was changed
[40]. Tokuda et al. have measured diffusion coefficients of ions in a series of
ILs with different cations such as [BMIm]+, [BP]+, [BMPRO]+ and [(n-
C4H9)(CH3)3N]+ combined with the [(CF3SO2)2N]- anion [41]. Ds of both
types of ions were changed as the type of the cation was changed. Diffusion of
ILs [RMIm][(CF3SO2)2N] with R varied from methyl- to octyl- groups. The
diffusion generally decreases as the chain length of the cation increases, except
that the diffusivity of cations with the ethyl- group was higher than that for
15
cations with methyl- [19], but this was in contrast with their viscosities.
Tokuda et al. have explained this discrepancy by a cumulative effect of the
electrostatic interaction between ionic species and the induction interactions
between the ions, aggregates and clusters [19]. For 1-alkyl-3-
methylimidazolium salt with long alkyl chains the ILs have been reported to
form a smectic phase through the segregation of the alkyl chains [11,45]. The
ILs with alkyl chains long enough to drive this type of segregation have been
thought to form bi-continuous networks of polar and non-polar domains [46].
A difference between ILs containing imidazolium and phosphonium type
cations has also been reported , with the former leading to a string-like
nanostructure, while the latter promotes a more globular type structure in ILs
[47]. This may be related to the localization of the positive charge on the
phosphorus in phosphonium cations and delocalization of the charge in the
aromatic ring in the case of imidazolium cations [48]. Interestingly, because of
an interplay of specific interactions, larger [BMIm]+ cations can actually have
faster self-diffusion coefficients compared to those for smaller Cl- anions in the
same types of ILs.
2.3.3. Diffusivity and ionicity of ILs
Ionic pairs in ILs are un-charged; therefore, because they are mobile, they not
contribute to the electrical conductivity of the ILs. Dissociated ions of ILs are
mobile and contribute to the electrical conductivity of both types of ions,
cationic and anionic. Thus, comparison of diffusivity and electrical
conductivity can be used as a tool to detect the degree of dissociation of ions in
ILs. Watanabe´s group [18,19,40,42] considered the ratio imp/ NMR to be a
useful parameter, which represents an IL´s “ionicity” used to characterize the
transport properties of ions in ILs. The molar conductivity ratio is defined as
imp/ NMR, where imp is obtained from electric impedance measurements and
16
NMR calculated from the ionic diffusivity measured by PFG-NMR. If
imp/ NMR is lower than unity that indicates that only a part of the diffusive
species contributes to the ionic conductivity, while the other part of IL
comprises ionic association [19,40]. A similar approach to measure ionicity has
been used in several studies of different ILs [20,33].
The fraction of the molar conductivity to Ds is 0.6 and 0.8 for [EMIm][BF4]
and [BP][BF4], respectively, whereas this fraction is 0.3 and 0.5 for
[EMIm][TFSI] and [BP][TFSI] [18], respectively. These results indicate the
presence of ionic associations or ionic components that cannot contribute to the
ionic conductivity in these types of ILs. An elongation by a –CH2– in the
cation alkyl chain causes a decrease in the electrostatic attraction between
imidazolium cations and anions in ILs [19]. On the other hand, an increase in –
CH2– units in alkyl chains enhances the van der Waals interactions by means
of (i) the alkyl chains – ion inductive forces (dielectric polarization) and (ii) the
hydrocarbon-hydrocarbon interactions, where the former inductive forces seem
to be predominant for ILs [19]. The balance between these two types of
interactions determines the ionicity of the IL system.
2.3.4 The Stokes-Einstein relation applied to ILs
Diffusion data are usually analysed using the Stokes-Einstein equation (Eqs.
(6-7)) [18,30,49]. However an underlying physical model (a hard sphere
approximation in a viscous fluid) is quite different from the real situation with
ILs. Conditions, which make the physical picture more complex in the case of
ILs, are: i) the strong electrostatic attraction in cation – anion, and repulsions in
cation – cation and anion – anion ion pairs; and ii) the large sizes of “solvent”
molecules, which is usually valid for both cations and anions. Therefore, the
definitions of “viscosity” and “solvodynamic radius” in ILs are losing their
applicability, which is standard for residual solutions [43]. Because ILs are
17
highly concentrated electrolyte solutions with ionic strengths usually exceeding
10 M, ions in these liquids may diffuse corporativelly, i.e., in a strong
dependence on each other. A study of Hussey et al. [49] reported on the
importance of the ionic charge effect, which affects the transport properties.
The “solvodynamic radii” of ions have been estimated by the Stokes-Einstein
equation [18,19,35,40-42,49]; however, they were not exactly in agreement
with to the calculated values. Calculations have shown that the estimated
values for the “solvodynamic radii” are either smaller [18,35] or larger [49]
than the actual sizes of the ions. Menjoge et al. have measured self-diffusion of
ions in a number of imidazolium-based ILs and have found a good correlation
between reciprocal viscosities and diffusivities for some of these ILs [43].
Alam et al. [50] have made an effort to analyse self-diffusion in a series of ILs
by applying Stokes- Einstein relationships. They have found that the estimated
volumes for cations, using the latter approach, are significantly smaller than the
predicted van der Waals volumes [45]. This might be a result of incorrect
assumptions utilized.
2.3.5 Temperature dependences of diffusivity in ILs
The temperature dependences of diffusion coefficients in ILs obey only in
limited cases (and for small temperature ranges) the Arrhenius plot for
diffusion, Eq. (4), [43], while in most cases they demonstrate convex curved
profiles. However, they can be fit well by the Vogel-Tamman-Fulcher (VTF)
equation, Eq. (5), with appropriate fitting parameters B, D* and T0 [18,19,40-
42]. Unfortunately, the numerical values of the constants in the latter works
were not compared with typical activation energies and glass transition
temperatures obtained from complementary independent measurements. For a
number of [BMIm]+-based ILs with a variety of anions, different T0 were
reported for cations and anions in the same IL systems [40], while the glass
18
transition temperature obviously is not a characteristic of individual ions, but
the whole IL system.
2.3.6 Relation of diffusivity with other parameters
The Stokes-Einstein equation (Eq. (6-7)) assumed a simple inverse relation
between the diffusivity and viscosity of IL. However, the order of the
temperature alteration of the magnitude of Ds greatly contrasts with that of the
viscosities for each ionic liquid ([EMIm][BF4], [BP][BF4], [EMIm][TFSI],
[BP][TFSI]) [18,19]. This fact clearly indicates that the microscopic ion
dynamics does not simply reflect the macroscopic physical properties [19]. On
the other hand, viscosities in pyrrolidinium type ILs have temperature
dependences similar to those ion diffusivities, leading to very close values of
the apparent activation energies for these processes [51].
2.3.7 Nano-phase structure of ILs
An ionic liquid is a physical mixture of cations and anions having positive and
negative charges, respectively. It is quite possible that without these charges (a
hypothetical case) liquid components would separate in two macroscopic
phases and would set down in the sample tube according to their densities.
However, electrostatic interactions between ions preclude this macroscopic
liquid phase separation. Electrostatic interactions are dominating in ILs and
cations and anions form ion pairs, at least temporarily, with the rate of
exchange between the dissociated and associated ion pairs in the ILs faster than
the time scale of NMR measurements [19]. At the same time, some viscous ILs
exhibit a time-dependent apparent diffusion constant [33]. This suggests the
presence of some types of nanostructures under highly viscous conditions: ILs
are non-homogeneous liquids on the timescale of diffusion measurements.
There are reviews suggesting the formation of different nanostructures in ILs
19
as well as the structures and mechanisms of formation of these ionic aggregates
in ILs [11,48,52-59].
One of the most striking findings about ILs is that they can display remarkable
structural heterogeneity. The Coulombic nature of interaction in ILs imposes a
degree of order on the short-range scale and their amphiphilic combination of
polar and non-polar components leads to different types of correlations on
longer scales [48]. Heterogeneities of bulk ILs have been predicted from MD
simulations and then detected by various experimental structural methods and
also observed through dynamics of molecules by NMR and neutron scattering
techniques.
Urahata and Ribeiro [60], Voth et al. [55,61], Lopes and Padua [62] and Ji et
al. [63] using MD simulation have investigated an effect of alkyl chain length
of cations on the structure of ILs and have found that, when the length of the
alkyl chain becomes sufficiently long, cations aggregate to form domains of
polar and non-polar regions. Geometric constraints for head and tail groups of
cations result in novel balanced liquid crystal-like structures [61,63]. Alkyl
chain length dependence, which was reported for sub-phase separation in ILs,
has been also theoretically described by Shimizu et al. [64]. They point out the
similarities between the structural features of ILs and those displayed by ionic
surfactants. When alkyl side-chains are short (C2-C4), the non-polar domains
consist of hydrocarbon-like “islands” in the center of a continuous polar
network, whereas for longer alkyl side-chains those islands start to connect,
forming a second continuous micro-phase, thus establishing a bi-continuous
segregated phase [64].
Self-aggregation effects between alkyl chains can lead to strongly ordered local
environments, even for alkyl chains as short as butyl. MD simulations
performed by Wang et al. [55] and by Canongia Lopes [62] have revealed this
nano-structural organisation. Triolo et al. [65,66] in their X-ray experiments on
20
1-alkyl-3-methylimidazolium cations paired with Cl-, [BF4]- and [PF6]- anions
have found peaks correlated with domain sizes ranging from 1.4 to 2.6 nm with
a similar bilayer-like aggregation behavior observed for ILs in which the
imidazolium cations are paired with other anions. It has also been found that
the nature of self-aggregation is critically dependent on the precise chemical
nature of the ions in ILs [67].
In the work of Sarangi et al. nanoscopic clusters of [BMIm][PF6] have been
studied by MD simulation [68]. The effective interaction potential between the
clusters exhibited a short-range, strong attractive well that was consistent with
previously reported models for inter-micellar interactions. MD simulations
have shown that both the cations and anions in ILs may adopt multiple
conformations [26]. The mechanism of this type of phase separation, which
leads to formation of mesoscopic domains, has been discussed by Russina et al.
[54].
Hussey et al. [49] have had to take into account anionic complexes to explain
larger values of “solvodynamic radii” in the basic aluminium chloride-1-
methyl-3-ethylimidazolium chloride ILs.
Atkin and coworkers applied AFM to study [BMP][TFSA] and
[EMIm][TFSA] ILs on a mica surface [69,70]. They found that 3-6 solvation
layers of these ILs were formed between the AFM tip and the mica surface
depending on the nature if the IL. Small-angle X-ray scattering experiments
have shown that strong cohesive forces in protic ILs EAN and PAN can induce
medium-chain-length n-alkanols to self-assemble into micelle- and
microemulsion-like structures [71]. Pott et al. [72] showed that tri-alkyl-
methyl-ammonium family ILs with bis(trifluoromethanesulfonyl)amide as an
anion exhibit marked nano-scale ordering as judged from SAXS. This
structural ordering is of a supra-molecular order in the manner of a disordered
smectic A phase, and depends strongly on the length of alkyl chains in the
21
ammonium cations. For ILs with methylimidazolium cation alkyl chains,
induced segregation may result in a bilayer-like ordering [48]. Atkin et al. have
studied structures of EAN – air interfaces [73]. X-ray reflectivity reveals that
the surface consists of alternating non-polar and charged layers that extend ca
3.1 nm into the bulk.
In another work Atkin and Warr have investigated nano-scale segregation of
short chain ILs, PAN nitrate and EAN, by SANS [74] and have found that
Bragg spacings in X-ray patterns of these ILs are 1.16 and 0.97 nm, which
provide evidence of structural heterogeneity in these ILs, where “solvophobic
interaction” is the most important factor. This result provides experimental
evidence of nano-scale heterogeneity in ILs with alkyl chains shorter than C4.
The calculated Bragg spacings are approximately twice the ion pair dimensions
of the ILs, which suggests that the ILs are structured on the length scale of the
ions, with the alkyl groups associated together and segregated from the H-
bonded ionic moieties - ND3+ and NO3
-. Based on x-ray studies of Atkin and
Warr [74], from the MD simulations, Umebayashi et al. [75] concluded that
polar and non-polar parts of EAN may form a network liquid structure.
In most of the ILs studied so far diffusion decays are single-exponential and
the apparent Ds can be calculated with good precision [33]. Watanabe’s group
has estimated the effective fraction of ions that undergo diffusive transport as
single ions relative to those ions that diffuse as aggregates. It seems now
generally accepted that the cations and anions in ILs may aggregate into
clusters that have at least a metastable structure. This might be a consequence
of the polar/non-polar domain heterogeneity in ILs [18,19,40-42].
Burrell et al. studied diffusion and NMR relaxation in a series of some protic
ILs in low (18.1 MHz for 1H) and high (500 MHz for 1H) magnetic fields [32].
No evidence was found to indicate the influence of a magnetic field on
structural and dynamic properties; however, variations between diffusion
22
coefficients at different magnetic fields indicated dynamic heterogeneities (or
temporal aggregates) within the ILs. These dynamic heterogeneities were
related to the formation of a network of dynamic hydrogen bonds.
Alam et al. [50] combined their results of self-diffusion measurements (1H
NMR) for a series of tetra-alkyl acyclic ammonium and cyclic pyrrolidinium
ILs with rotational diffusion coefficients (DR) obtained from 14N NMR
relaxation measurements for the same ILs. The ratio of translational and
rotational diffusion coefficients has been used to estimate hydrodynamic radii
and corresponding volumes without the need to measure the viscosity of the
ILs.
It has been also shown directly by NMR that ionic liquids may spontaneously
form two microscopically intercalated liquid sub-phases, in which ionic species
have different diffusion coefficients [28]. In the work of Frise et al. [28]
cations with three CH3(CH2)9O- groups underwent micro-phase separation and
formed a liquid crystalline phase with cubic symmetry (as follows from small-
angle X-ray scattering data) in a certain range of low temperatures. Evidently,
this happened because of so-called “hydrophobic interactions” between
hydrocarbon groups: oppositely charged ions attract each other and push out
bulky alkyloxy chains into a separate micro-phase.
Diffusion coefficients measured in [EMIm][BF4] RTIL in the range of 300 –
360 K indicated a phase change, which occurred in the vicinity of 333 K, that
is supported by 11B quadrupolar relaxation rates [30]. This phase change is
ascribed to the fact that the diffusing particle is transformed from a “discrete
ion pair” to an “individual ion” at temperatures above 335 K due to
decomposition of the [EMI]+-[BF4]- ion pair. An analysis of the 13C dipole-
dipole relaxation rates identifies the formation of hydrogen bonds (C2H …F)
between the counter ions, [EMIm]+ and [BF4]-. The existence of H-bonding in
this IL evidenced from NMR spectroscopic techniques indicates, to a certain
23
degree, that the extended hydrogen-bonded network is present in the
[EMIm][BF4] ionic liquid [30]. The temperature dependence of Ds of
[EMIm][BF4] indicates that there are at least two distinguished linear regions
corresponding to two phases, at temperature ranges of 300-330 K and 335-360
K [30].
2.4 Self-diffusion of ionic liquids in mixtures with some neutral liquids
Impurities in the ILs may significantly affect their properties, such as thermal
stability, viscosity, conductivity and diffusion [40]. Different groups have
reported on the transport properties of ILs in the presence of non-ionic liquids
such as dimethyl carbonate [76], polyethylene glycol [77,78], hexane [79],
DMSO [80], glucose [34] and polar aprotic solvents [81].
Self-diffusion, as well as ion-ion interactions in mixtures of ILs ([BMIm][BF4]
and [BMIm][PF6]) with polyethylene glycol with Mw = 200, 300, 400 and
polyethyleneimine (PEI) with Mw = 423 have been investigated by 1H NMR
[78]. In these systems hydrogen bonds are formed between the alkyl hydrogens
of PEG and F atoms of BF4- and BF6
-. Aggregation of ILs with PEG or PEI is
the dominant effect for the diffusion, when the polymer concentration increases
in the mixtures, interaction between ions became weaker.
Neutron scattering, NMR and Molecular Dynamics simulations of 1-ethyl-3-
methylimidazolium acetate, [C2mim][OAc], mixed with glucose, demonstrated
that acetate oxygens and sugar hydroxyl groups are hydrogen bonded [34],
while cations play only a minor role in the solvation of glucose.
2.5 Self-diffusion of ionic liquids near solid surface and in confinement
Fundamental understanding of confinement effects of complex liquid/solid
systems is necessary for many IL applications in geology, geophysics, biology
24
and industry, particularly in the chemical, oil and gas, and pharmaceutical
industries for pollution control, mixture separation, and catalysis. Many
important chemical applications of ILs are considered for interfaces, including
electrochemical processes on electrodes of batteries and electroplating, in fuel
cell membranes, friction surfaces, dissolved solids, etc. Questions of interest
are concerned with how the length scale, dimensionality and surface properties
of the walls of the confining matrix modify the dynamics, thermodynamics and
structure of the confined molecules compared to their bulk counterparts. There
is a convention for using the term “confinement”. Usually it is used when the
size of the molecules is comparable to the size of the pores [82]. However,
when applied to associated liquids (as well as to ILs) this convention is not
fully consistent, because it is not a single molecule, but a molecular or ionic
associate, that may play the role of being the structural and dynamic entity.
Pinalla et al. have performed MD simulations of [DMIm][Cl] confined
between two parallel walls separated by 2.5-4.5 nm [83] and in a 4.49 nm nano
slit [84]. Density profiles in the transverse direction of walls indicate an
interfacial layering near the wall surface with an IL layer twice as dense
compared to the bulk IL and to the region where the layering decreases towards
the center of the slit. In this case the ionic diffusion was found to be faster than
in bulk, possibly due to the non-corrugated nature of the zones in the IL [84].
For this IL, the maximum number of ions at the interface has been found for
the 2.8-nm distance between walls. An orientational order parameter analysis
of confined ILs has shown that the cations between walls are tilted with respect
to the surface of the walls [84]. The orientation and layering of [DMIm][Cl]
between two oppositely charged planes have been found to be different
compared to those for the IL between uncharged surfaces. Monte Carlo and
MD simulations [85] of [HMIm][TFSI] in a silica nano slit of 2.5-4.5 nm have
shown that the cations and anions form a layered structure and 12-31%
25
reduction in density has been observed for different slit separations,
respectively. Relative ratios of constituents in the layers of ILs
([BMIm][TFSI]) are found to be proportional to the pore-filling by the IL. For
low and intermediate pore fillings, the first layer is formed by a mixture of
cations, anions and ion pairs. For higher loadings, four cation layers and three
anion layers are formed [86]. Direct experimental evidence showing layering
of an IL near pore wall surfaces was obtained by STM/AFM studies [69,89-
91].
[HMIm][EtSO4] has been investigated between mica surfaces by Jurado et al.
[92] who reported on a range of liquid-to-solid transitions in this system. The
solid-like IL has a layered structure with a thickness of about 60 nm near the
mica surface [92].
An analysis of AFM microscopy topographies of [BMIm][NTf2] on mica,
amorphous silica and oxidized Si(110) shows solid-like liquid structures with a
structural periodicity of about 0.6 nm perpendicular to surfaces [93].
Physical properties of [BMIm][PF6] have been studied by Singh et al. in
porous silica matrices [94]. They found that in the IR spectra of this IL the
vibration bands corresponding to the imidazolium ring are red-shifted.
Calculations suggested that a SiO2 matrix interacts more with heterocyclic
groups of [BMIm]+ cations than with the tail alkyl chains. Dielectric relaxation
measurements in the same system demonstrated layering of IL molecules near
the pore wall, while other IL molecules that remained in the central core were
less affected by interactions with pore walls [95].
Studies on NMR linewidths, relaxation times and chemical shifts can give
useful information about dynamics, diffusion coefficients and local interactions
in liquids, including ILs. Some of these results showed that the confined IL has
two characteristic regimes: (1) a less mobile regime (IL close to pore walls);
(2) a bulk-like regime (IL in the center of pores).
26
Solid-state NMR studies on [BMIm][PF6] phases on silica and laponite clay
[96] have shown that the nature of the support greatly affects the phase
behavior of the supported IL. In uncharged anorphous support (silica), IL
behaves as an almost homogeneous liquid phase with some restricted mobility,
while on a negatively charged layered support these ILs form two different
phases, i.e., a thin solid layer and a liquid phase. The imidazolium cation,
which is oriented towards the silica surface, interacts with both the surface and
the anion through the aromatic protons.
Increased diffusion of ILs in pores as well as two-component diffusion has
been observed by Chathoth et al., for [H2NC(dma)2][BETI] confined in
ordered mesoporous carbon (diameter ~ 8.8 ± 2.1 nm) [97,98]. Chathoth et al.
have suggested that the “fast diffusion coefficient” for this IL in pores might be
the result of structural changes of the IL within the pores: IL is forming a
layered structure near the pore wall [98]. However, the authors did not find any
reasonable explanation for the “slow diffusion coefficient” [98]. Rachocki et
al. [99] indirectly, by means of the fast field-cycling 1H nuclear magnetic
resonance (NMR) relaxometry method, studied translational diffusion of
cations in a gel polymer electrolyte based on ethoxylated bisphenol
dimethacrylate and [BMIm][BF4]. It has been found that the diffusion
coefficient of cations is a factor of 2-3 higher than that of these cations in pure
IL.
Iacob et al. [100] reported enhanced self-diffusion of [BMIm][BF4] in
unidirectional nanoporous membranes (porous silicon with pore sizes of 7.5–
10.4 nm). By combining broadband dielectric spectroscopy and NMR
diffusometry, they were able to determine the diffusion coefficient and the
diffusion rate over more than 13 orders of magnitude and to trace their
temperature dependences. The enhancement of diffusivities by more than two
orders of magnitude attributed by the authors to changes in molecular packing
27
and, hence, in its density leading to higher mobility and an electrical
conductivity in these ILs. A simple explanation can be formulated by
considering the problem of the packing density. Both experimental and
theoretical studies of spherical balls in cylindrical containers indicate that the
mass density decreases by up to 7% when the radii of the balls become
comparable to the radii of the confining cylinders [100]. This agrees well with
atomistic simulations of Shi and Sorescu [101], who studied diffusion in
[HMIm][NTf2] confined in carbon nanotubes of diameter 4.5 nm and observed
a significant decrease in the mass density in nanotubes compared to the bulk
value. As a result, the diffusion coefficients of ions confined in nanotubes
increased by about two orders of magnitude.
It has been shown by NMR diffusometry that silanization of porous silica
results in a significant change of the effective Ds for a confined IL [102].
[HMIm][ PF6] demonstrated a more than 10-fold decrease of Ds in polar silica
pores with a mean diameter of 7.5 μm, while silanization of the silica resulted
in a significant increase of Ds, which almost approached the bulk value [102].
Therefore, our review suggests that ionic liquids may adopt quite complicated
supra-molecular structures and may have complex dynamics. Translational
dynamics of ILs may be related with the structure formed in bulk solutions,
near solid surfaces and in confinement. NMR methods, such as 1H NMR and
multi-nuclear NMR, can be useful tools in studies of translational dynamics of
ILs. Different approaches used to treat diffusion data of ionic liquids have
originated from traditional NMR methods developed for studies of diffusion of
solutions and diffusion of molecular liquids. However, these traditional
methods in some cases are too simplified to be directly used to describe the
transport and structural properties of ILs.
28
CHAPTER 3. DIFFUSION OF IONIC LIQUIDS IN NON-RESTRICTED
VOLUMES
In Chapter 2 it was shown that ionic liquids are typically inhomogeneous nano-
structured liquid systems with certain trends in the formation of micellar
solutions or a liquid-crystal ordering. These particular properties are results of
different types of competitive interactions between ions involved, as well as the
thermal energy. Translational motion of ions in ILs is typically less intensive in
comparison with that in simple molecular liquids and the ILs often demonstrate
some dynamic heterogeneity. In the Chapter 3 we will examine these
phenomena using examples of different ILs in bulk, such as ethylammonium
nitrate and a series of halogen-free orthoborate ILs. We will also examine a
mixture of polyethylene glycol (usually used as base oil in some lubricants)
with two imidazolium orthoborate ILs where ions of these ILs manifest
different degrees of preference for the solvent molecules.
3.1 Diffusion in bulk ethylammonium nitrate
Ethylammonium nitrate (EAN), first synthesized by Paul Walden in 1914
[103], is the most commonly studied and reported protic room-temperature salt
IL. Its structure is shown in Figure 3.1. EAN IL consists of an equimolar
composition of ethylammonium (EA) cations and nitrate anions. EAN is used
as a replacement for organic solvents as a reaction medium, as a precipitating
agent for protein crystallization [4], an electrically conductive solvent in
electrochemistry [1], amongst other applications. It has been shown that,
similar to water, EAN can form a three-dimensional hydrogen bonding
network and can be used as an amphiphilic self-assembly medium [71].
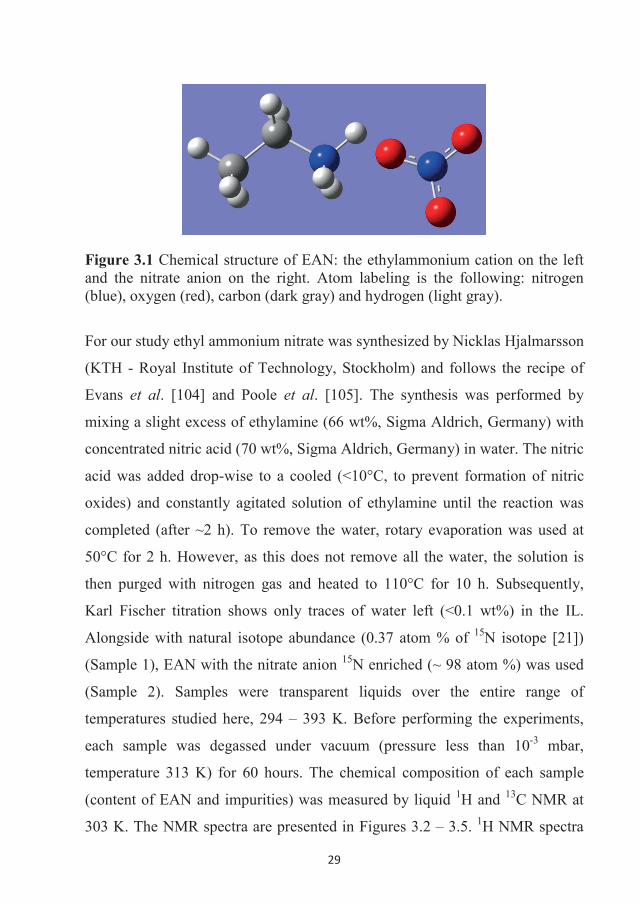
29
Figure 3.1 Chemical structure of EAN: the ethylammonium cation on the left and the nitrate anion on the right. Atom labeling is the following: nitrogen (blue), oxygen (red), carbon (dark gray) and hydrogen (light gray).
For our study ethyl ammonium nitrate was synthesized by Nicklas Hjalmarsson
(KTH - Royal Institute of Technology, Stockholm) and follows the recipe of
Evans et al. [104] and Poole et al. [105]. The synthesis was performed by
mixing a slight excess of ethylamine (66 wt%, Sigma Aldrich, Germany) with
concentrated nitric acid (70 wt%, Sigma Aldrich, Germany) in water. The nitric
acid was added drop-wise to a cooled (<10°C, to prevent formation of nitric
oxides) and constantly agitated solution of ethylamine until the reaction was
completed (after ~2 h). To remove the water, rotary evaporation was used at
50°C for 2 h. However, as this does not remove all the water, the solution is
then purged with nitrogen gas and heated to 110°C for 10 h. Subsequently,
Karl Fischer titration shows only traces of water left (<0.1 wt%) in the IL.
Alongside with natural isotope abundance (0.37 atom % of 15N isotope [21])
(Sample 1), EAN with the nitrate anion 15N enriched (~ 98 atom %) was used
(Sample 2). Samples were transparent liquids over the entire range of
temperatures studied here, 294 – 393 K. Before performing the experiments,
each sample was degassed under vacuum (pressure less than 10-3 mbar,
temperature 313 K) for 60 hours. The chemical composition of each sample
(content of EAN and impurities) was measured by liquid 1H and 13C NMR at
303 K. The NMR spectra are presented in Figures 3.2 – 3.5. 1H NMR spectra
30
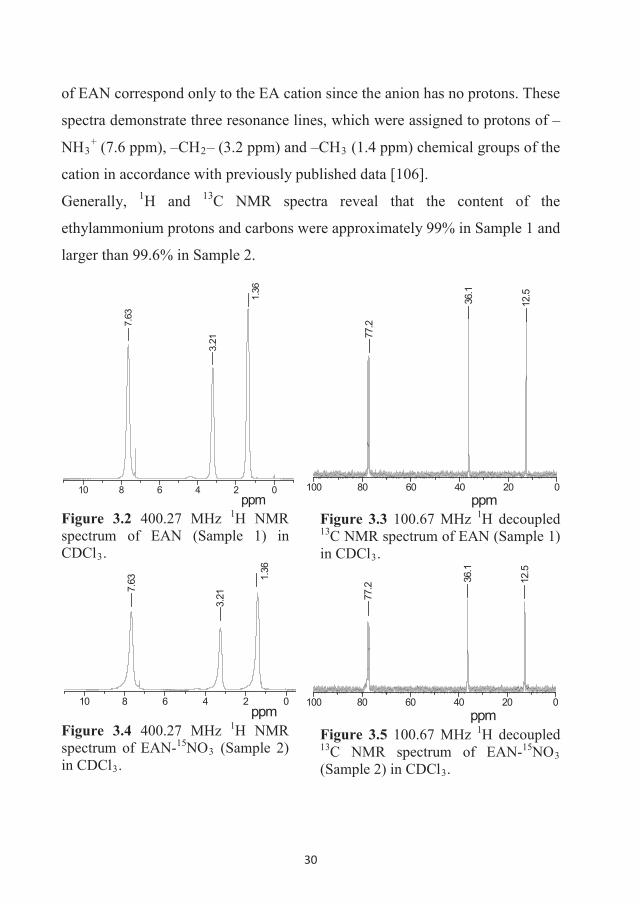
of EAN correspond only to the EA cation since the anion has no protons. These
spectra demonstrate three resonance lines, which were assigned to protons of –
NH3+ (7.6 ppm), –CH2– (3.2 ppm) and –CH3 (1.4 ppm) chemical groups of the
cation in accordance with previously published data [106].
Generally, 1H and 13C NMR spectra reveal that the content of the
ethylammonium protons and carbons were approximately 99% in Sample 1 and
larger than 99.6% in Sample 2.
10 8 6 4 2 0
1.36
3.21
ppm
7.63
Figure 3.2 400.27 MHz 1H NMR spectrum of EAN (Sample 1) in CDCl3.
100 80 60 40 20 0ppm
77.2
36.1
12.5
Figure 3.3 100.67 MHz 1H decoupled 13C NMR spectrum of EAN (Sample 1) in CDCl3.
10 8 6 4 2 0
1.36
3.21
ppm
7.63
Figure 3.4 400.27 MHz 1H NMR spectrum of EAN-15NO3 (Sample 2) in CDCl3.
100 80 60 40 20 0ppm
77.2
36.1
12.5
Figure 3.5 100.67 MHz 1H decoupled 13C NMR spectrum of EAN-15NO3(Sample 2) in CDCl3.
31
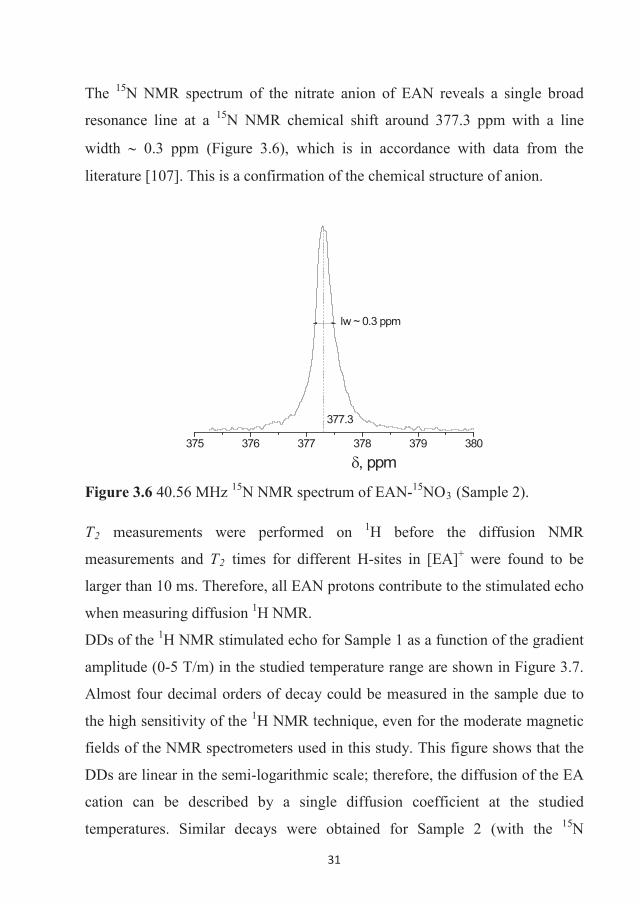
The 15N NMR spectrum of the nitrate anion of EAN reveals a single broad
resonance line at a 15N NMR chemical shift around 377.3 ppm with a line
width 0.3 ppm (Figure 3.6), which is in accordance with data from the
literature [107]. This is a confirmation of the chemical structure of anion.
375 376 377 378 379 380
, ppm
377.3
lw ~ 0.3 ppm
Figure 3.6 40.56 MHz 15N NMR spectrum of EAN-15NO3 (Sample 2).
T2 measurements were performed on 1H before the diffusion NMR
measurements and T2 times for different H-sites in [EA]+ were found to be
larger than 10 ms. Therefore, all EAN protons contribute to the stimulated echo
when measuring diffusion 1H NMR.
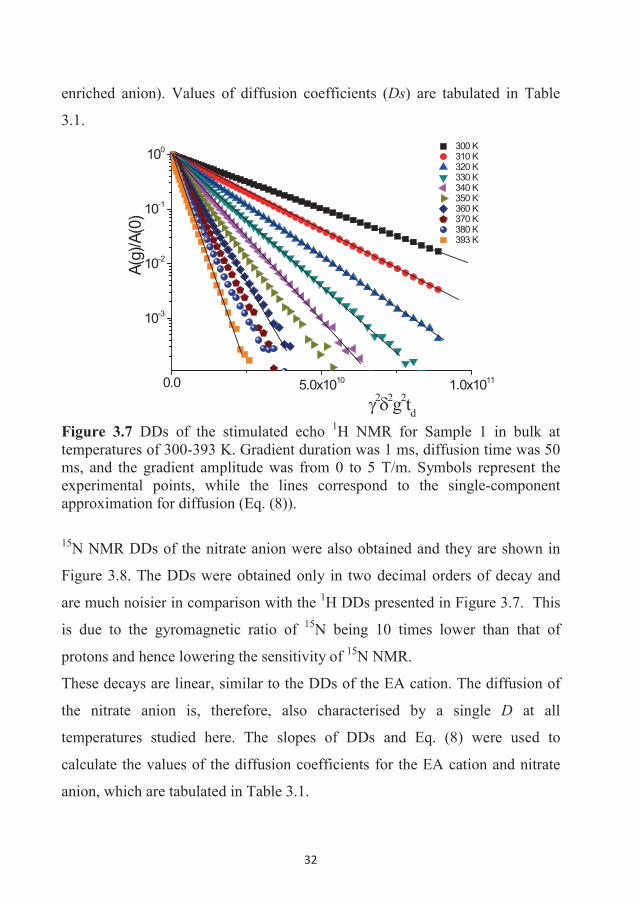
DDs of the 1H NMR stimulated echo for Sample 1 as a function of the gradient
amplitude (0-5 T/m) in the studied temperature range are shown in Figure 3.7.
Almost four decimal orders of decay could be measured in the sample due to
the high sensitivity of the 1H NMR technique, even for the moderate magnetic
fields of the NMR spectrometers used in this study. This figure shows that the
DDs are linear in the semi-logarithmic scale; therefore, the diffusion of the EA
cation can be described by a single diffusion coefficient at the studied
temperatures. Similar decays were obtained for Sample 2 (with the 15N
32
enriched anion). Values of diffusion coefficients (Ds) are tabulated in Table
3.1.
0.0 5.0x10¹⁰ 1.0x10¹¹
10-3
10-2
10-1
100 300 K 310 K 320 K 330 K 340 K 350 K 360 K 370 K 380 K 393 K
A(g)
/A(0
)
2 2g2td Figure 3.7 DDs of the stimulated echo 1H NMR for Sample 1 in bulk at temperatures of 300-393 K. Gradient duration was 1 ms, diffusion time was 50 ms, and the gradient amplitude was from 0 to 5 T/m. Symbols represent the experimental points, while the lines correspond to the single-component approximation for diffusion (Eq. (8)).
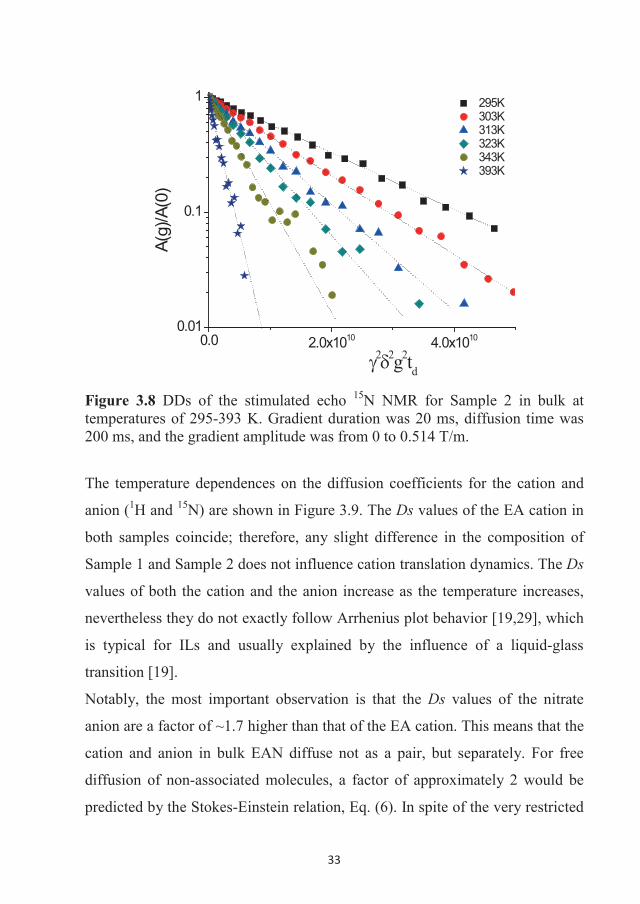
15N NMR DDs of the nitrate anion were also obtained and they are shown in
Figure 3.8. The DDs were obtained only in two decimal orders of decay and
are much noisier in comparison with the 1H DDs presented in Figure 3.7. This
is due to the gyromagnetic ratio of 15N being 10 times lower than that of
protons and hence lowering the sensitivity of 15N NMR.
These decays are linear, similar to the DDs of the EA cation. The diffusion of
the nitrate anion is, therefore, also characterised by a single D at all
temperatures studied here. The slopes of DDs and Eq. (8) were used to
calculate the values of the diffusion coefficients for the EA cation and nitrate
anion, which are tabulated in Table 3.1.
33
0.0 2.0x10¹⁰ 4.0x10100.01
0.1
1
2 2g2td
A(g)
/A(0
)
295K303K313K323K343K393K
Figure 3.8 DDs of the stimulated echo 15N NMR for Sample 2 in bulk at temperatures of 295-393 K. Gradient duration was 20 ms, diffusion time was 200 ms, and the gradient amplitude was from 0 to 0.514 T/m.
The temperature dependences on the diffusion coefficients for the cation and
anion (1H and 15N) are shown in Figure 3.9. The Ds values of the EA cation in
both samples coincide; therefore, any slight difference in the composition of
Sample 1 and Sample 2 does not influence cation translation dynamics. The Ds
values of both the cation and the anion increase as the temperature increases,
nevertheless they do not exactly follow Arrhenius plot behavior [19,29], which
is typical for ILs and usually explained by the influence of a liquid-glass
transition [19].
Notably, the most important observation is that the Ds values of the nitrate
anion are a factor of ~1.7 higher than that of the EA cation. This means that the
cation and anion in bulk EAN diffuse not as a pair, but separately. For free
diffusion of non-associated molecules, a factor of approximately 2 would be
predicted by the Stokes-Einstein relation, Eq. (6). In spite of the very restricted
34
applicability of such a model to ILs [19], the 1.7-factor difference in diffusion
coefficients may thus be due to the difference in size of the ions. An alternative
explanation lies in structuring of the IL. This subject is still being debated, but
it is clear that short range Coulombic interactions are insufficient to describe
the intermolecular forces and that hydrogen bonding and concomitant
solvophobicity are also important [74].
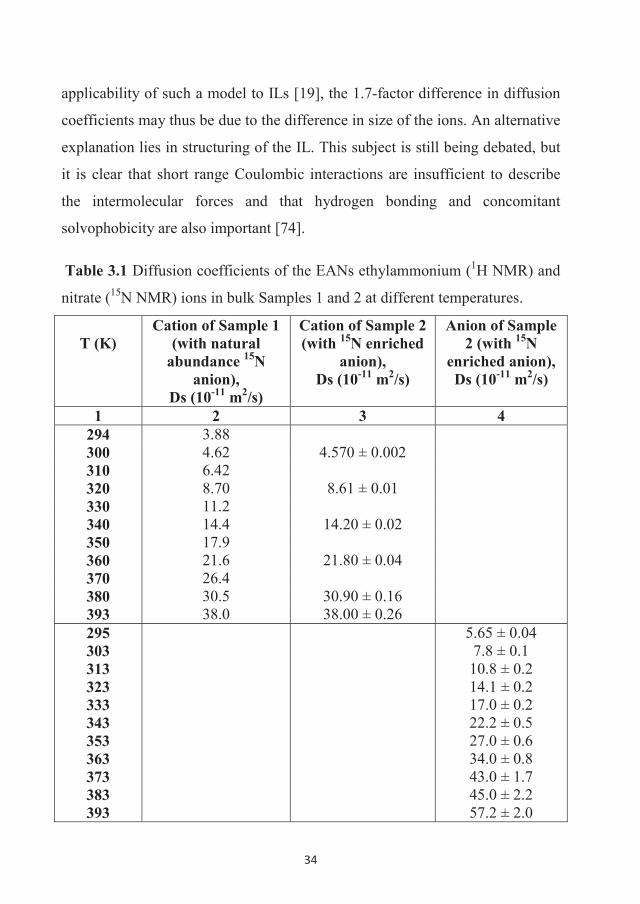
Table 3.1 Diffusion coefficients of the EANs ethylammonium (1H NMR) and
nitrate (15N NMR) ions in bulk Samples 1 and 2 at different temperatures.
T (K)Cation of Sample 1
(with natural abundance 15N
anion),Ds (10-11 m2/s)
Cation of Sample 2 (with 15N enriched
anion), Ds (10-11 m2/s)
Anion of Sample 2 (with 15N
enriched anion),Ds (10-11 m2/s)
1 2 3 4294 3.88300 4.62 4.570 ± 0.002310 6.42320 8.70 8.61 ± 0.01330 11.2340 14.4 14.20 ± 0.02350 17.9360 21.6 21.80 ± 0.04370 26.4380 30.5 30.90 ± 0.16393 38.0 38.00 ± 0.26295303313323333343353363373383393
5.65 ± 0.047.8 ± 0.1
10.8 ± 0.214.1 ± 0.217.0 ± 0.222.2 ± 0.527.0 ± 0.634.0 ± 0.843.0 ± 1.745.0 ± 2.257.2 ± 2.0
35
2.6 2.8 3.0 3.2 3.4
10-10
D s, m
2 /s
Ethyl ammonium, Sample1 Nitrate, Sample2 Ethyl ammonium, Sample2
1000/T, K-1
ED ~ 22.25 kJ/mol
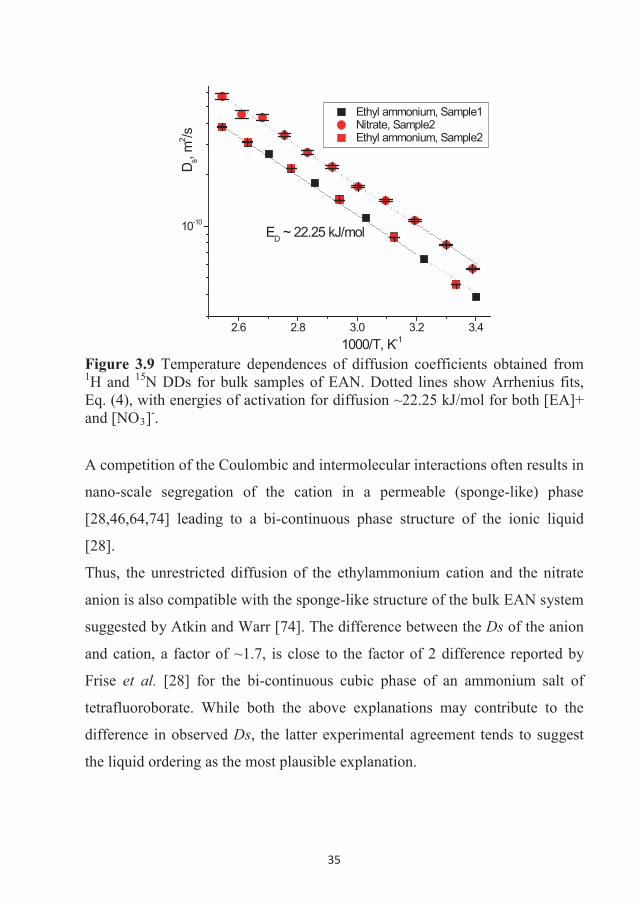
Figure 3.9 Temperature dependences of diffusion coefficients obtained from 1H and 15N DDs for bulk samples of EAN. Dotted lines show Arrhenius fits, Eq. (4), with energies of activation for diffusion ~22.25 kJ/mol for both [EA]+ and [NO3]-.
A competition of the Coulombic and intermolecular interactions often results in
nano-scale segregation of the cation in a permeable (sponge-like) phase
[28,46,64,74] leading to a bi-continuous phase structure of the ionic liquid
[28].
Thus, the unrestricted diffusion of the ethylammonium cation and the nitrate
anion is also compatible with the sponge-like structure of the bulk EAN system
suggested by Atkin and Warr [74]. The difference between the Ds of the anion
and cation, a factor of ~1.7, is close to the factor of 2 difference reported by
Frise et al. [28] for the bi-continuous cubic phase of an ammonium salt of
tetrafluoroborate. While both the above explanations may contribute to the
difference in observed Ds, the latter experimental agreement tends to suggest
the liquid ordering as the most plausible explanation.
36
3.2 Diffusion of some halogen-free orthoborate ionic liquids
Diffusivity of ions in EAN, as well as in a number of other “classic” ILs
[6,12,19,28,29,36,37] demonstrated the importance of this parameter and the
NMR diffusometry technique to characterise the mobility and nano-scale
inhomogeneity of ILs. Novel phosphonium and pyrrolidinium orthoborate ILs,
which are potential lubricants, were synthesised and characterised by different
physico-chemical methods, including NMR diffusometry [6,29]. 1H NMR
diffusion decays were obtained in the range of 293-373 K. The decays were
analysed and we calculated the temperature dependences of Ds corresponding
to cations and anions. The diffusivities of the ILs demonstrated some common
regularities as well as features typical for certain cations or anions.
3.2.1 Phosphonium orthoborate ionic liquids
The ILs were synthesised by Dr. Faiz Ullah Shah in the Chemistry of Interfaces
research group, Luleå University of Technology, and characterised and
described in an article by Shah et al. [7] following modified synthetic prptocols
of Yu et al. [110]. Each of the three studied here ionic liquids contain a
phosphonium cation [P6,6,6,14]+ and one of three orthoborate anions:
bis(mandelato)borate ([BMB]-), bis(salicilato)borate ([BScB]-) or
bis(oxalato)borate ([BOB]-). Structures of these ions are shown in Figure 3.10.
All samples of these ILs were transparent viscous liquids over the entire range
of temperatures studied: 303 - 333 K. Before performing the experiments, each
sample was degassed under vacuum (pressure less than 10-3 mbar, temperature
333 K) for 50 hours. The chemical composition of each sample (content of IL
and impurities) was checked by liquid 1H, 13C, 31P and 11B NMR spectra, and is
presented in the paper by Shah et al. [7].
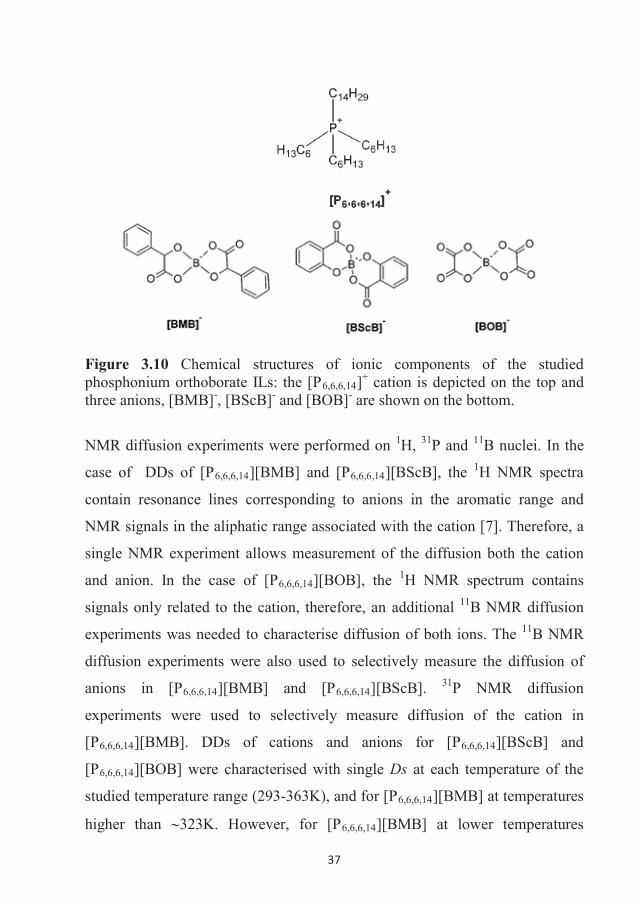
37
Figure 3.10 Chemical structures of ionic components of the studied phosphonium orthoborate ILs: the [P6,6,6,14]+ cation is depicted on the top and three anions, [BMB]-, [BScB]- and [BOB]- are shown on the bottom.
NMR diffusion experiments were performed on 1H, 31P and 11B nuclei. In the
case of DDs of [P6,6,6,14][BMB] and [P6,6,6,14][BScB], the 1H NMR spectra
contain resonance lines corresponding to anions in the aromatic range and
NMR signals in the aliphatic range associated with the cation [7]. Therefore, a
single NMR experiment allows measurement of the diffusion both the cation
and anion. In the case of [P6,6,6,14][BOB], the 1H NMR spectrum contains
signals only related to the cation, therefore, an additional 11B NMR diffusion
experiments was needed to characterise diffusion of both ions. The 11B NMR
diffusion experiments were also used to selectively measure the diffusion of
anions in [P6,6,6,14][BMB] and [P6,6,6,14][BScB]. 31P NMR diffusion
experiments were used to selectively measure diffusion of the cation in
[P6,6,6,14][BMB]. DDs of cations and anions for [P6,6,6,14][BScB] and
[P6,6,6,14][BOB] were characterised with single Ds at each temperature of the
studied temperature range (293-363K), and for [P6,6,6,14][BMB] at temperatures
higher than 323K. However, for [P6,6,6,14][BMB] at lower temperatures
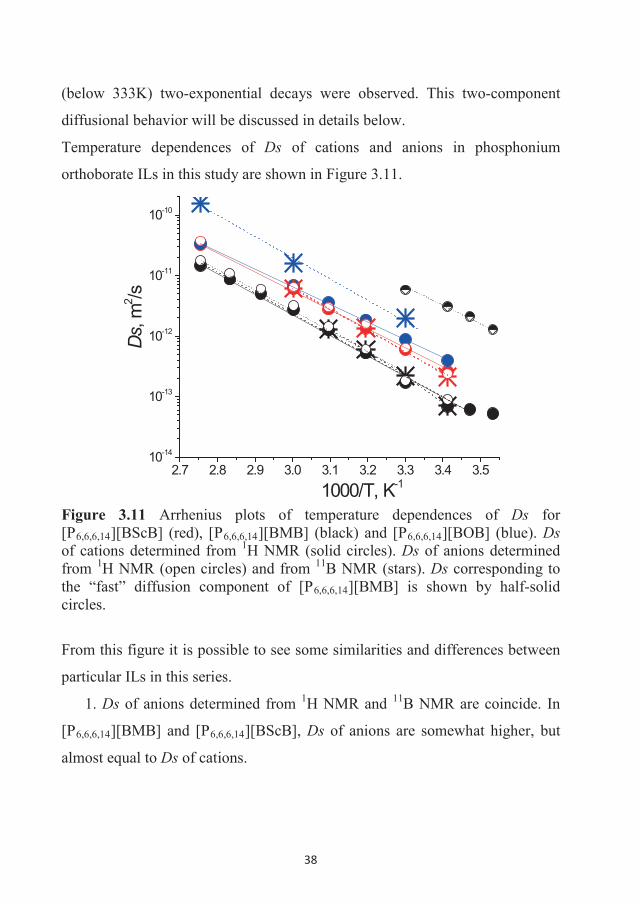
38
(below 333K) two-exponential decays were observed. This two-component
diffusional behavior will be discussed in details below.
Temperature dependences of Ds of cations and anions in phosphonium
orthoborate ILs in this study are shown in Figure 3.11.
2.7 2.8 2.9 3.0 3.1 3.2 3.3 3.4 3.510-14
10-13
10-12
10-11
10-10
Ds, m
2 /s
1000/T, K-1
Figure 3.11 Arrhenius plots of temperature dependences of Ds for [P6,6,6,14][BScB] (red), [P6,6,6,14][BMB] (black) and [P6,6,6,14][BOB] (blue). Dsof cations determined from 1H NMR (solid circles). Ds of anions determined from 1H NMR (open circles) and from 11B NMR (stars). Ds corresponding to the “fast” diffusion component of [P6,6,6,14][BMB] is shown by half-solid circles.
From this figure it is possible to see some similarities and differences between
particular ILs in this series.
1. Ds of anions determined from 1H NMR and 11B NMR are coincide. In
[P6,6,6,14][BMB] and [P6,6,6,14][BScB], Ds of anions are somewhat higher, but
almost equal to Ds of cations.
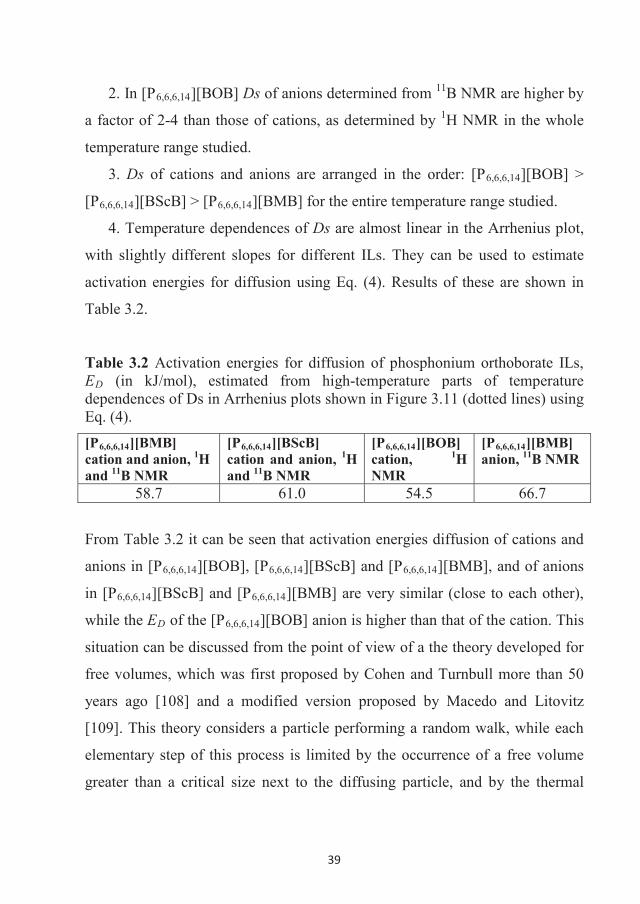
39
2. In [P6,6,6,14][BOB] Ds of anions determined from 11B NMR are higher by
a factor of 2-4 than those of cations, as determined by 1H NMR in the whole
temperature range studied.
3. Ds of cations and anions are arranged in the order: [P6,6,6,14][BOB] >
[P6,6,6,14][BScB] > [P6,6,6,14][BMB] for the entire temperature range studied.
4. Temperature dependences of Ds are almost linear in the Arrhenius plot,
with slightly different slopes for different ILs. They can be used to estimate
activation energies for diffusion using Eq. (4). Results of these are shown in
Table 3.2.
Table 3.2 Activation energies for diffusion of phosphonium orthoborate ILs, ED (in kJ/mol), estimated from high-temperature parts of temperature dependences of Ds in Arrhenius plots shown in Figure 3.11 (dotted lines) using Eq. (4).
[P6,6,6,14][BMB] cation and anion, 1Hand 11B NMR
[P6,6,6,14][BScB] cation and anion, 1Hand 11B NMR
[P6,6,6,14][BOB]cation, 1HNMR
[P6,6,6,14][BMB]anion, 11B NMR
58.7 61.0 54.5 66.7
From Table 3.2 it can be seen that activation energies diffusion of cations and
anions in [P6,6,6,14][BOB], [P6,6,6,14][BScB] and [P6,6,6,14][BMB], and of anions
in [P6,6,6,14][BScB] and [P6,6,6,14][BMB] are very similar (close to each other),
while the ED of the [P6,6,6,14][BOB] anion is higher than that of the cation. This
situation can be discussed from the point of view of a the theory developed for
free volumes, which was first proposed by Cohen and Turnbull more than 50
years ago [108] and a modified version proposed by Macedo and Litovitz
[109]. This theory considers a particle performing a random walk, while each
elementary step of this process is limited by the occurrence of a free volume
greater than a critical size next to the diffusing particle, and by the thermal
40
energy required to perform this step. In this model diffusion coefficients have
the following form:
kTE
aaDDsf
**exp* , (11)
where is a factor to correct for overlapping free volumes (in the range 0.5-1),
a is an average volume for a molecular in the system, a* is critical size of the
molecular volume (at a = a* molecules are packed tightly enough and do not
diffuse, usually suggested as the van der Waals volume per molecule), af = a –
a* is the free volume, E* is the energy threshold (activation energy). Close
values of diffusion coefficients and equal energies of activation of the diffusion
processes in [P6,6,6,14][BScB] and [P6,6,6,14][BMB] mean that these diffusion
processes occur in a homogeneous “matrix”, where diffusivities of ions are
determined mainly by the “free volume” term of Eq. (11). The free volume is
different for the cation and anion because of the difference in their sizes. For
smaller size anions a* is slightly smaller, which explains the differences in Ds
of anions and cations in these ILs.
The difference in Ds and ED between cations and anions in [P6,6,6,14][BOB] is
supposingly related with inhomogeneity (micro-phase separation of the
system), which is similar to that observed in EAN (Section 3.1). A pertinent
question is whether two-component diffusion observed for [P6,6,6,14][BMB] in
the low-temperature range is also related to a micro-phase separation in this IL.
Figure 3.12 shows diffusion decays typical for this system at temperatures
below 318 K. DDs for both, cations and anions have a bi-exponential form, Eq.
(10). This is typical for liquid-liquid phase or micro-phase separation.
Strictly speaking, the two-component approach based on application of Eq.
(10) in handling NMR diffusion data is acceptable only when the studied
molecules do not collide with any obstacles (for example, particles of solid
41
phase or phase boundaries in microphase-separated systems), or the moving
molecules do not participate in exchange between temporary “phases” with
lifetimes comparable to the diffusion time of the experiments [16].
0 1x10¹³ 2x10¹³
10-1
100
anion, 7.13 ppm cation, 1.29 ppm cation, 0.89 ppm
A(g,
)/A(0
)
2 2g2( - /3)Figure 3.12 1H NMR diffusion decays for anion and cation in [P6,6,6,14][BMB] at 293 K.
A common method to reveal the presence of spatial restrictions or time-
dependent exchange of possibly formed associates with their surroundings is to
compare the DDs obtained at different diffusion times. The most
comprehensive description of phenomena with corresponding time scales that
may cause deviation from the multi-exponential form, Eq. (10) may be found
in [16,25]. Figure 3.13 demonstrates diffusion decays at four temperatures in
the range of diffusion time of td = 61-511 ms.
As a first approach to formal analysis, we supposed that complicated DDs are
composed of two exponential components, which we called “fast” and “slow”
with corresponding diffusion coefficients and populations. Examining the
dependence of DDs on the increase of diffusion time td, we observe that the
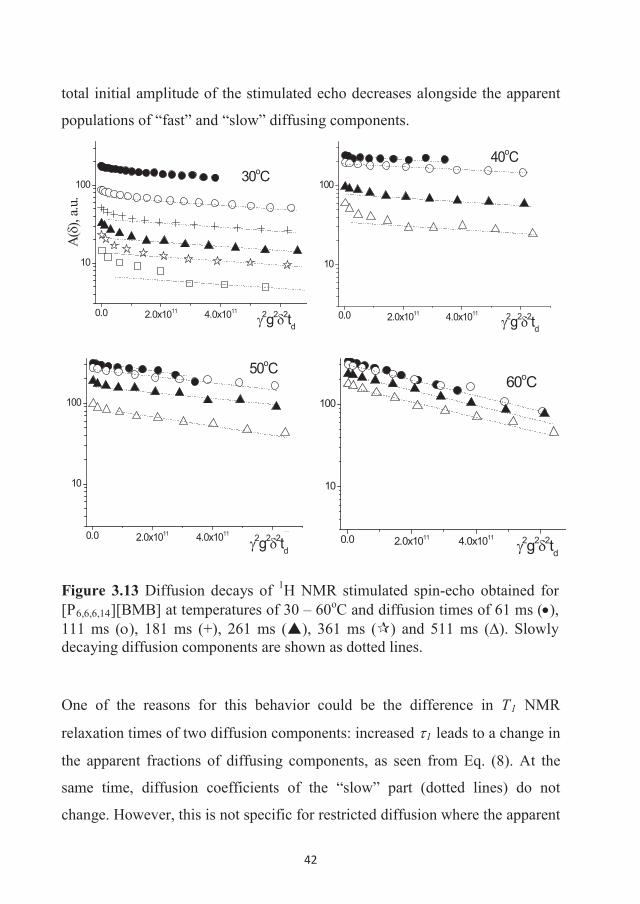
42
total initial amplitude of the stimulated echo decreases alongside the apparent
populations of “fast” and “slow” diffusing components.
0.0 2.0x10¹¹ 4.0x10¹¹ 6.0x10¹¹
10
100 30oC
A(
), a.u
.
2g2 2td
0.0 2.0x10¹¹ 4.0x10¹¹ 6.0x10¹¹
10
100
2g2 2td
40oC
0.0 2.0x10¹¹ 4.0x10¹¹ 6.0x10¹¹
10
100
2g2 2td
50oC
0.0 2.0x10¹¹ 4.0x10¹¹ 6.0x10¹¹
10
100
2g2 2td
60oC
Figure 3.13 Diffusion decays of 1H NMR stimulated spin-echo obtained for [P6,6,6,14][BMB] at temperatures of 30 – 60oC and diffusion times of 61 ms ( ), 111 ms ( ), 181 ms (+), 261 ms ( ), 361 ms ( ) and 511 ms ( ). Slowly decaying diffusion components are shown as dotted lines.
One of the reasons for this behavior could be the difference in T1 NMR
relaxation times of two diffusion components: increased 1 leads to a change in
the apparent fractions of diffusing components, as seen from Eq. (8). At the
same time, diffusion coefficients of the “slow” part (dotted lines) do not
change. However, this is not specific for restricted diffusion where the apparent
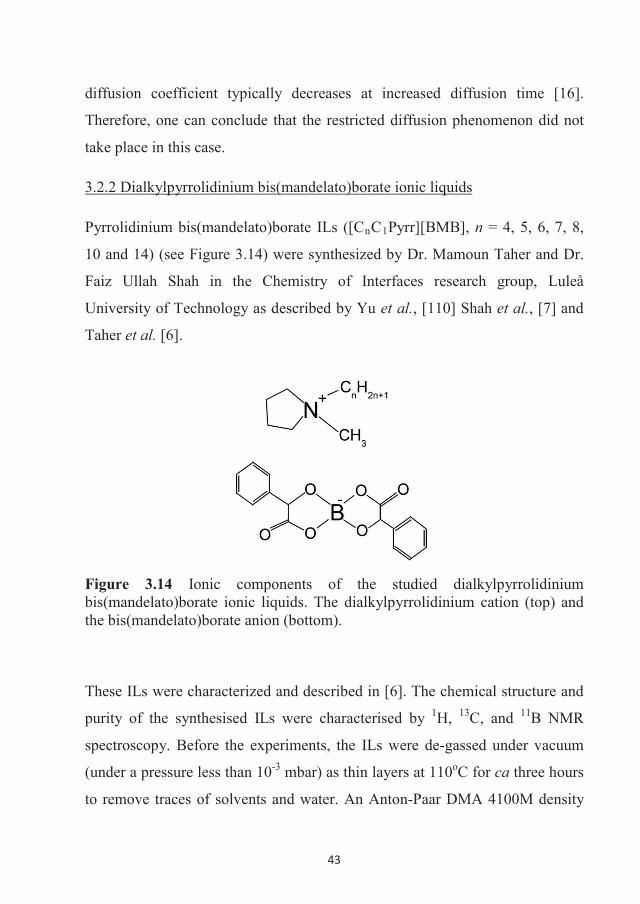
43
diffusion coefficient typically decreases at increased diffusion time [16].
Therefore, one can conclude that the restricted diffusion phenomenon did not
take place in this case.
3.2.2 Dialkylpyrrolidinium bis(mandelato)borate ionic liquids
Pyrrolidinium bis(mandelato)borate ILs ([CnC1Pyrr][BMB], n = 4, 5, 6, 7, 8,
10 and 14) (see Figure 3.14) were synthesized by Dr. Mamoun Taher and Dr.
Faiz Ullah Shah in the Chemistry of Interfaces research group, Luleå
University of Technology as described by Yu et al., [110] Shah et al., [7] and
Taher et al. [6].
Figure 3.14 Ionic components of the studied dialkylpyrrolidinium bis(mandelato)borate ionic liquids. The dialkylpyrrolidinium cation (top) and the bis(mandelato)borate anion (bottom).
These ILs were characterized and described in [6]. The chemical structure and
purity of the synthesised ILs were characterised by 1H, 13C, and 11B NMR
spectroscopy. Before the experiments, the ILs were de-gassed under vacuum
(under a pressure less than 10-3 mbar) as thin layers at 110oC for ca three hours
to remove traces of solvents and water. An Anton-Paar DMA 4100M density
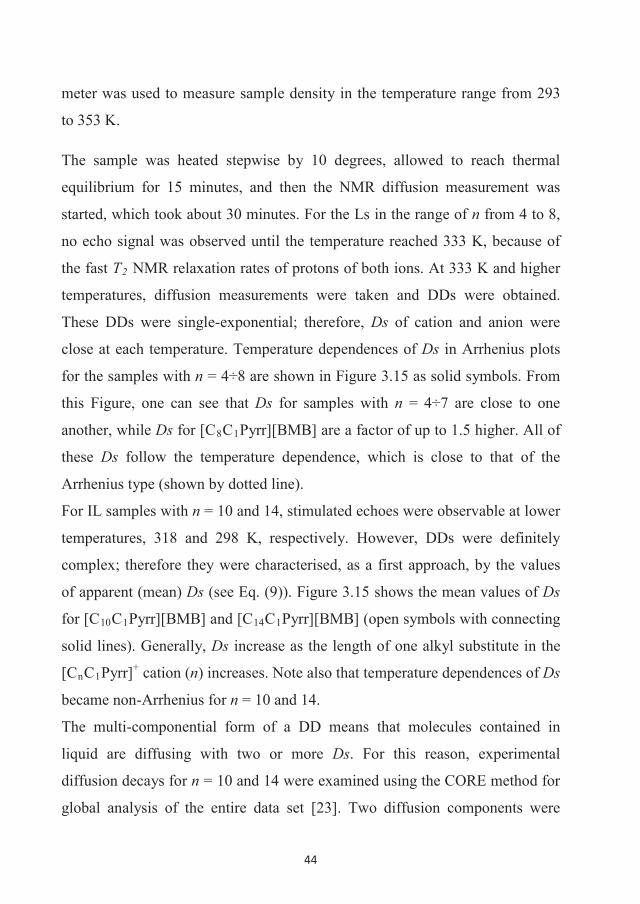
44
meter was used to measure sample density in the temperature range from 293
to 353 K.
The sample was heated stepwise by 10 degrees, allowed to reach thermal
equilibrium for 15 minutes, and then the NMR diffusion measurement was
started, which took about 30 minutes. For the Ls in the range of n from 4 to 8,
no echo signal was observed until the temperature reached 333 K, because of
the fast T2 NMR relaxation rates of protons of both ions. At 333 K and higher
temperatures, diffusion measurements were taken and DDs were obtained.
These DDs were single-exponential; therefore, Ds of cation and anion were
close at each temperature. Temperature dependences of Ds in Arrhenius plots
for the samples with n = 4÷8 are shown in Figure 3.15 as solid symbols. From
this Figure, one can see that Ds for samples with n = 4÷7 are close to one
another, while Ds for [C8C1Pyrr][BMB] are a factor of up to 1.5 higher. All of
these Ds follow the temperature dependence, which is close to that of the
Arrhenius type (shown by dotted line).
For IL samples with n = 10 and 14, stimulated echoes were observable at lower
temperatures, 318 and 298 K, respectively. However, DDs were definitely
complex; therefore they were characterised, as a first approach, by the values
of apparent (mean) Ds (see Eq. (9)). Figure 3.15 shows the mean values of Ds
for [C10C1Pyrr][BMB] and [C14C1Pyrr][BMB] (open symbols with connecting
solid lines). Generally, Ds increase as the length of one alkyl substitute in the
[CnC1Pyrr]+ cation (n) increases. Note also that temperature dependences of Ds
became non-Arrhenius for n = 10 and 14.
The multi-componential form of a DD means that molecules contained in
liquid are diffusing with two or more Ds. For this reason, experimental
diffusion decays for n = 10 and 14 were examined using the CORE method for
global analysis of the entire data set [23]. Two diffusion components were
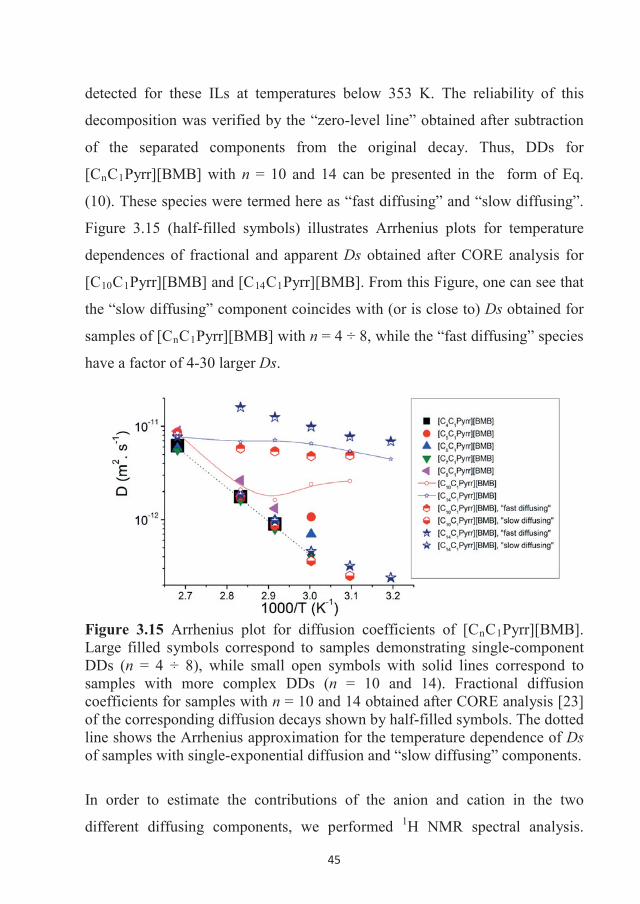
45
detected for these ILs at temperatures below 353 K. The reliability of this
decomposition was verified by the “zero-level line” obtained after subtraction
of the separated components from the original decay. Thus, DDs for
[CnC1Pyrr][BMB] with n = 10 and 14 can be presented in the form of Eq.
(10). These species were termed here as “fast diffusing” and “slow diffusing”.
Figure 3.15 (half-filled symbols) illustrates Arrhenius plots for temperature
dependences of fractional and apparent Ds obtained after CORE analysis for
[C10C1Pyrr][BMB] and [C14C1Pyrr][BMB]. From this Figure, one can see that
the “slow diffusing” component coincides with (or is close to) Ds obtained for
samples of [CnC1Pyrr][BMB] with n = 4 ÷ 8, while the “fast diffusing” species
have a factor of 4-30 larger Ds.
Figure 3.15 Arrhenius plot for diffusion coefficients of [CnC1Pyrr][BMB]. Large filled symbols correspond to samples demonstrating single-component DDs (n = 4 ÷ 8), while small open symbols with solid lines correspond to samples with more complex DDs (n = 10 and 14). Fractional diffusion coefficients for samples with n = 10 and 14 obtained after CORE analysis [23]of the corresponding diffusion decays shown by half-filled symbols. The dotted line shows the Arrhenius approximation for the temperature dependence of Dsof samples with single-exponential diffusion and “slow diffusing” components.
In order to estimate the contributions of the anion and cation in the two
different diffusing components, we performed 1H NMR spectral analysis.
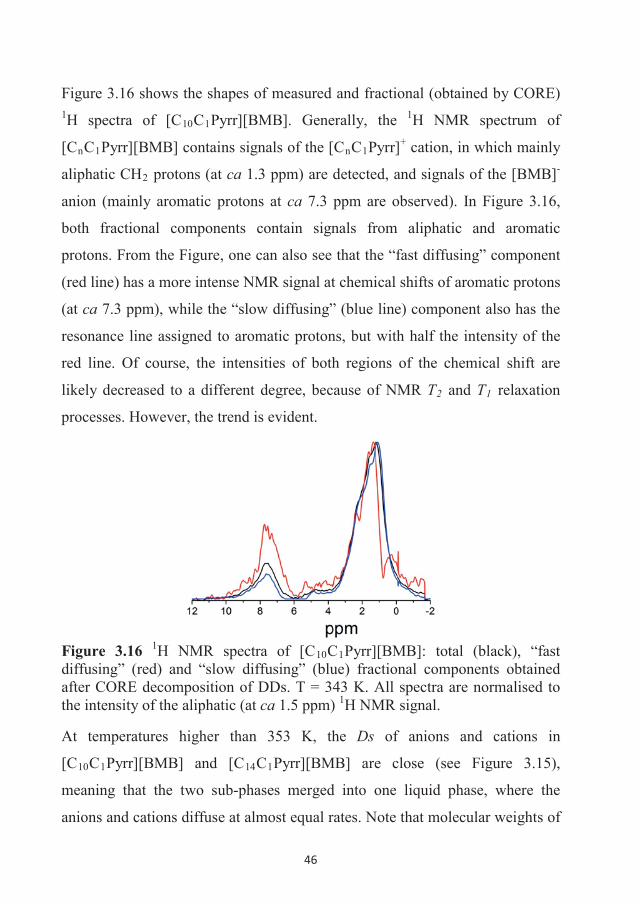
46
Figure 3.16 shows the shapes of measured and fractional (obtained by CORE) 1H spectra of [C10C1Pyrr][BMB]. Generally, the 1H NMR spectrum of
[CnC1Pyrr][BMB] contains signals of the [CnC1Pyrr]+ cation, in which mainly
aliphatic CH2 protons (at ca 1.3 ppm) are detected, and signals of the [BMB]-
anion (mainly aromatic protons at ca 7.3 ppm are observed). In Figure 3.16,
both fractional components contain signals from aliphatic and aromatic
protons. From the Figure, one can also see that the “fast diffusing” component
(red line) has a more intense NMR signal at chemical shifts of aromatic protons
(at ca 7.3 ppm), while the “slow diffusing” (blue line) component also has the
resonance line assigned to aromatic protons, but with half the intensity of the
red line. Of course, the intensities of both regions of the chemical shift are
likely decreased to a different degree, because of NMR T2 and T1 relaxation
processes. However, the trend is evident.
Figure 3.16 1H NMR spectra of [C10C1Pyrr][BMB]: total (black), “fast diffusing” (red) and “slow diffusing” (blue) fractional components obtained after CORE decomposition of DDs. T = 343 K. All spectra are normalised to the intensity of the aliphatic (at ca 1.5 ppm) 1H NMR signal.
At temperatures higher than 353 K, the Ds of anions and cations in
[C10C1Pyrr][BMB] and [C14C1Pyrr][BMB] are close (see Figure 3.15),
meaning that the two sub-phases merged into one liquid phase, where the
anions and cations diffuse at almost equal rates. Note that molecular weights of
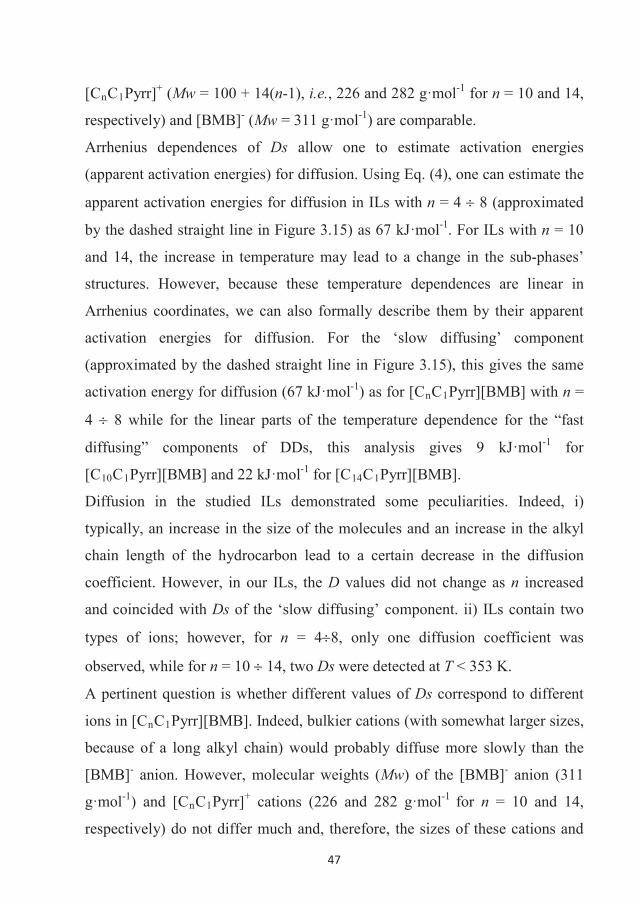
47
[CnC1Pyrr]+ (Mw = 100 + 14(n-1), i.e., 226 and 282 g·mol-1 for n = 10 and 14,
respectively) and [BMB]- (Mw = 311 g·mol-1) are comparable.
Arrhenius dependences of Ds allow one to estimate activation energies
(apparent activation energies) for diffusion. Using Eq. (4), one can estimate the
apparent activation energies for diffusion in ILs with n = 4 8 (approximated
by the dashed straight line in Figure 3.15) as 67 kJ·mol-1. For ILs with n = 10
and 14, the increase in temperature may lead to a change in the sub-phases’
structures. However, because these temperature dependences are linear in
Arrhenius coordinates, we can also formally describe them by their apparent
activation energies for diffusion. For the ‘slow diffusing’ component
(approximated by the dashed straight line in Figure 3.15), this gives the same
activation energy for diffusion (67 kJ·mol-1) as for [CnC1Pyrr][BMB] with n =
4 8 while for the linear parts of the temperature dependence for the “fast
diffusing” components of DDs, this analysis gives 9 kJ·mol-1 for
[C10C1Pyrr][BMB] and 22 kJ·mol-1 for [C14C1Pyrr][BMB].
Diffusion in the studied ILs demonstrated some peculiarities. Indeed, i)
typically, an increase in the size of the molecules and an increase in the alkyl
chain length of the hydrocarbon lead to a certain decrease in the diffusion
coefficient. However, in our ILs, the D values did not change as n increased
and coincided with Ds of the ‘slow diffusing’ component. ii) ILs contain two
types of ions; however, for n = 4 8, only one diffusion coefficient was
observed, while for n = 10 14, two Ds were detected at T < 353 K.
A pertinent question is whether different values of Ds correspond to different
ions in [CnC1Pyrr][BMB]. Indeed, bulkier cations (with somewhat larger sizes,
because of a long alkyl chain) would probably diffuse more slowly than the
[BMB]- anion. However, molecular weights (Mw) of the [BMB]- anion (311
g·mol-1) and [CnC1Pyrr]+ cations (226 and 282 g·mol-1 for n = 10 and 14,
respectively) do not differ much and, therefore, the sizes of these cations and
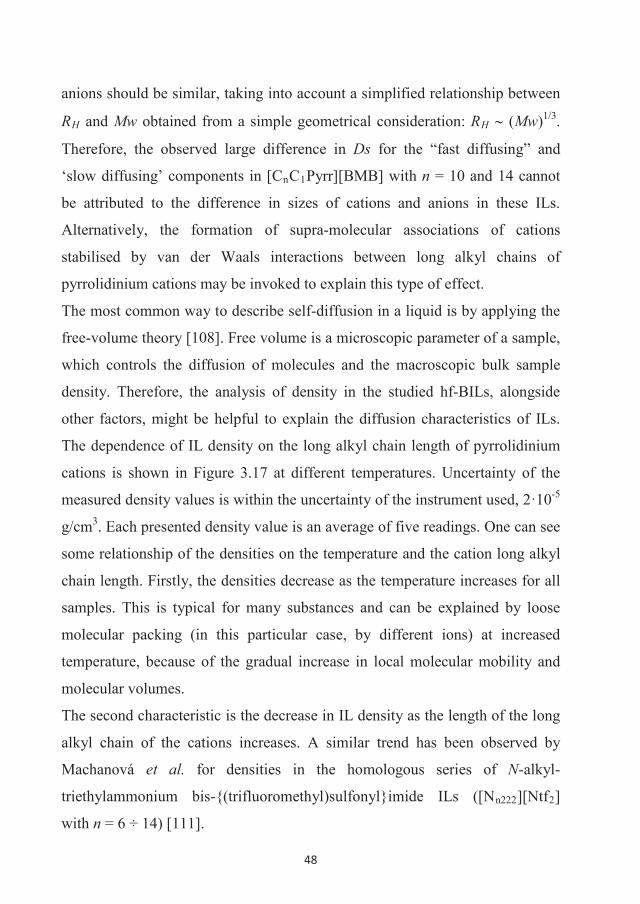
48
anions should be similar, taking into account a simplified relationship between
RH and Mw obtained from a simple geometrical consideration: RH (Mw)1/3.
Therefore, the observed large difference in Ds for the “fast diffusing” and
‘slow diffusing’ components in [CnC1Pyrr][BMB] with n = 10 and 14 cannot
be attributed to the difference in sizes of cations and anions in these ILs.
Alternatively, the formation of supra-molecular associations of cations
stabilised by van der Waals interactions between long alkyl chains of
pyrrolidinium cations may be invoked to explain this type of effect.
The most common way to describe self-diffusion in a liquid is by applying the
free-volume theory [108]. Free volume is a microscopic parameter of a sample,
which controls the diffusion of molecules and the macroscopic bulk sample
density. Therefore, the analysis of density in the studied hf-BILs, alongside
other factors, might be helpful to explain the diffusion characteristics of ILs.
The dependence of IL density on the long alkyl chain length of pyrrolidinium
cations is shown in Figure 3.17 at different temperatures. Uncertainty of the
measured density values is within the uncertainty of the instrument used, 2·10-5
g/cm3. Each presented density value is an average of five readings. One can see
some relationship of the densities on the temperature and the cation long alkyl
chain length. Firstly, the densities decrease as the temperature increases for all
samples. This is typical for many substances and can be explained by loose
molecular packing (in this particular case, by different ions) at increased
temperature, because of the gradual increase in local molecular mobility and
molecular volumes.
The second characteristic is the decrease in IL density as the length of the long
alkyl chain of the cations increases. A similar trend has been observed by
Machanová et al. for densities in the homologous series of N-alkyl-
triethylammonium bis-{(trifluoromethyl)sulfonyl}imide ILs ([Nn222][Ntf2]
with n = 6 ÷ 14) [111].
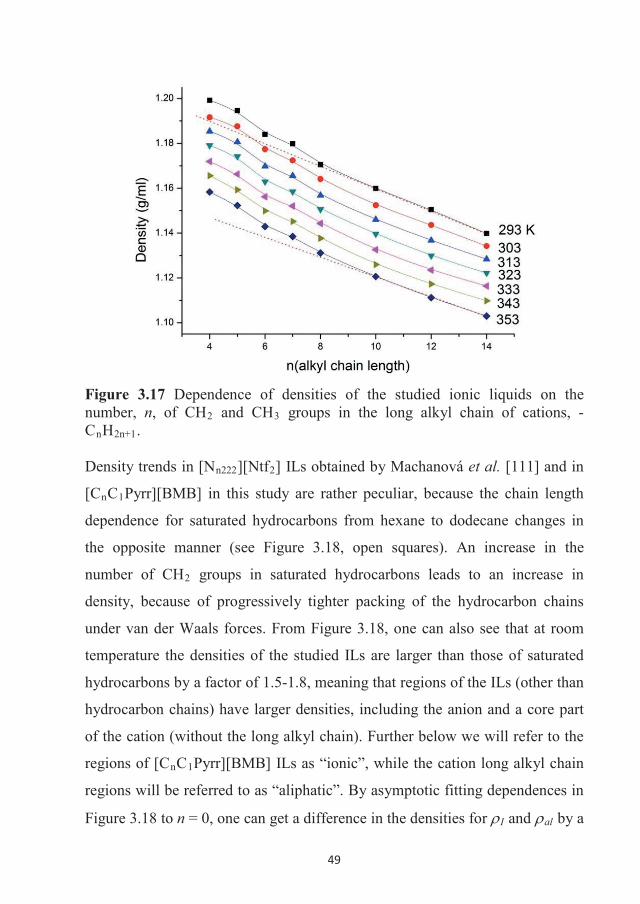
49
Figure 3.17 Dependence of densities of the studied ionic liquids on the number, n, of CH2 and CH3 groups in the long alkyl chain of cations, -CnH2n+1.
Density trends in [Nn222][Ntf2] ILs obtained by Machanová et al. [111] and in
[CnC1Pyrr][BMB] in this study are rather peculiar, because the chain length
dependence for saturated hydrocarbons from hexane to dodecane changes in
the opposite manner (see Figure 3.18, open squares). An increase in the
number of CH2 groups in saturated hydrocarbons leads to an increase in
density, because of progressively tighter packing of the hydrocarbon chains
under van der Waals forces. From Figure 3.18, one can also see that at room
temperature the densities of the studied ILs are larger than those of saturated
hydrocarbons by a factor of 1.5-1.8, meaning that regions of the ILs (other than
hydrocarbon chains) have larger densities, including the anion and a core part
of the cation (without the long alkyl chain). Further below we will refer to the
regions of [CnC1Pyrr][BMB] ILs as “ionic”, while the cation long alkyl chain
regions will be referred to as “aliphatic”. By asymptotic fitting dependences in
Figure 3.18 to n = 0, one can get a difference in the densities for I and al by a
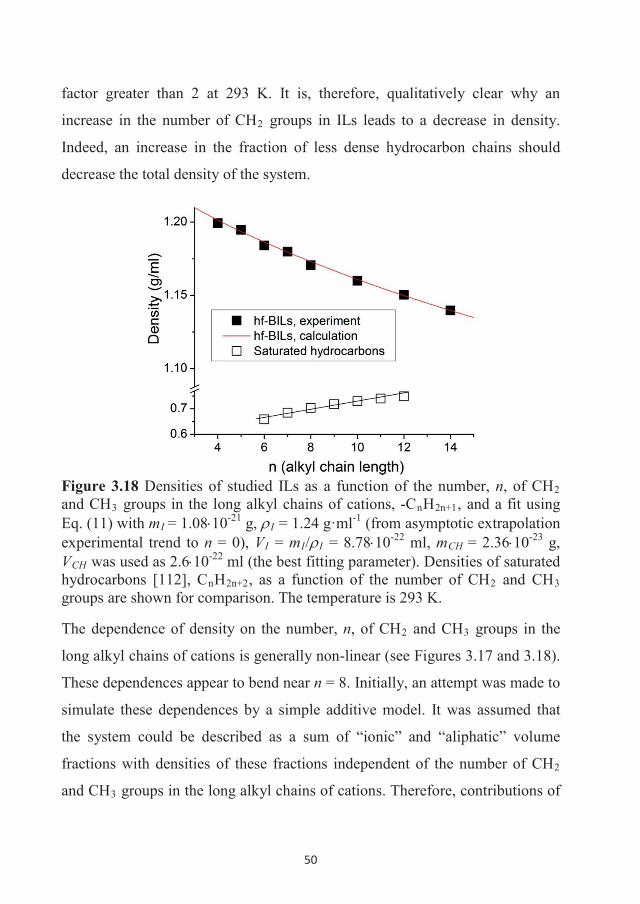
50
factor greater than 2 at 293 K. It is, therefore, qualitatively clear why an
increase in the number of CH2 groups in ILs leads to a decrease in density.
Indeed, an increase in the fraction of less dense hydrocarbon chains should
decrease the total density of the system.
Figure 3.18 Densities of studied ILs as a function of the number, n, of CH2and CH3 groups in the long alkyl chains of cations, -CnH2n+1, and a fit using Eq. (11) with mI = 1.08 10-21 g, I = 1.24 g·ml-1 (from asymptotic extrapolation experimental trend to n = 0), VI = mI/ I = 8.78 10-22 ml, mCH = 2.36 10-23 g, VCH was used as 2.6 10-22 ml (the best fitting parameter). Densities of saturated hydrocarbons [112], CnH2n+2, as a function of the number of CH2 and CH3groups are shown for comparison. The temperature is 293 K.
The dependence of density on the number, n, of CH2 and CH3 groups in the
long alkyl chains of cations is generally non-linear (see Figures 3.17 and 3.18).
These dependences appear to bend near n = 8. Initially, an attempt was made to
simulate these dependences by a simple additive model. It was assumed that
the system could be described as a sum of “ionic” and “aliphatic” volume
fractions with densities of these fractions independent of the number of CH2
and CH3 groups in the long alkyl chains of cations. Therefore, contributions of
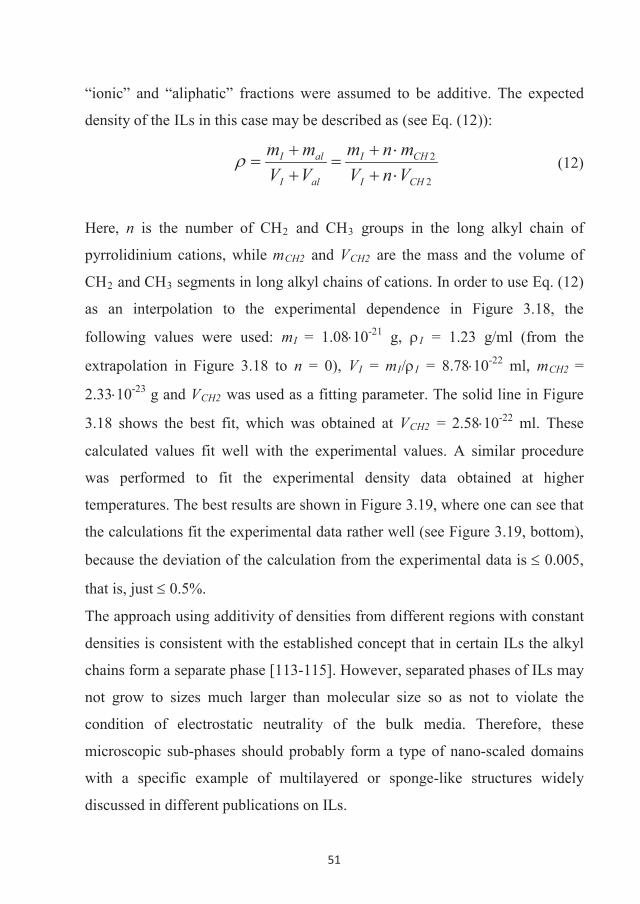
51
“ionic” and “aliphatic” fractions were assumed to be additive. The expected
density of the ILs in this case may be described as (see Eq. (12)):
2
2
CHI
CHI
alI
alI
VnVmnm
VVmm
(12)
Here, n is the number of CH2 and CH3 groups in the long alkyl chain of
pyrrolidinium cations, while mCH2 and VCH2 are the mass and the volume of
CH2 and CH3 segments in long alkyl chains of cations. In order to use Eq. (12)
as an interpolation to the experimental dependence in Figure 3.18, the
following values were used: mI = 1.08 10-21 g, I = 1.23 g/ml (from the
extrapolation in Figure 3.18 to n = 0), VI = mI/ I = 8.78 10-22 ml, mCH2 =
2.33 10-23 g and VCH2 was used as a fitting parameter. The solid line in Figure
3.18 shows the best fit, which was obtained at VCH2 = 2.58 10-22 ml. These
calculated values fit well with the experimental values. A similar procedure
was performed to fit the experimental density data obtained at higher
temperatures. The best results are shown in Figure 3.19, where one can see that
the calculations fit the experimental data rather well (see Figure 3.19, bottom),
because the deviation of the calculation from the experimental data is 0.005,
that is, just 0.5%.
The approach using additivity of densities from different regions with constant
densities is consistent with the established concept that in certain ILs the alkyl
chains form a separate phase [113-115]. However, separated phases of ILs may
not grow to sizes much larger than molecular size so as not to violate the
condition of electrostatic neutrality of the bulk media. Therefore, these
microscopic sub-phases should probably form a type of nano-scaled domains
with a specific example of multilayered or sponge-like structures widely
discussed in different publications on ILs.
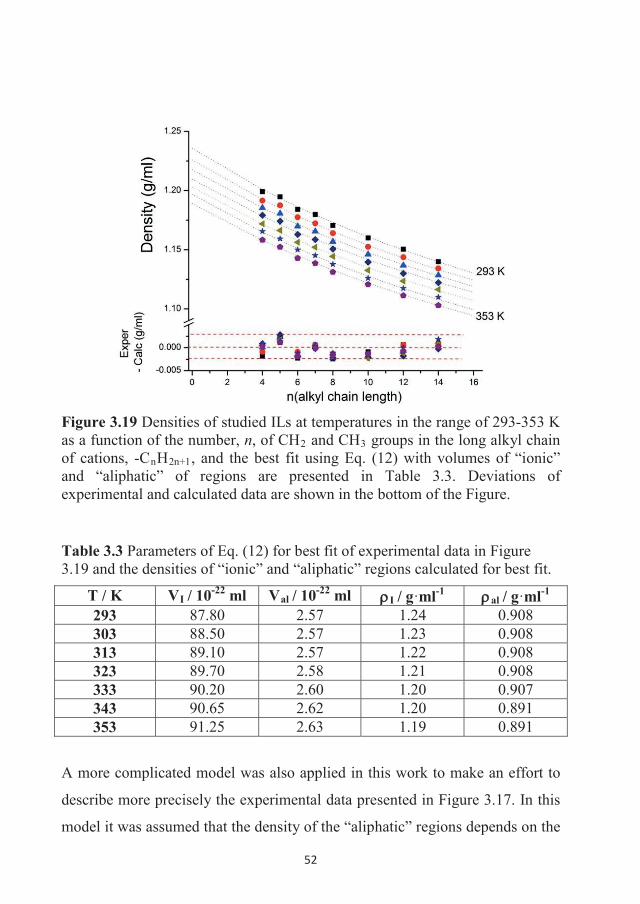
52
Figure 3.19 Densities of studied ILs at temperatures in the range of 293-353 K as a function of the number, n, of CH2 and CH3 groups in the long alkyl chain of cations, -CnH2n+1, and the best fit using Eq. (12) with volumes of “ionic”and “aliphatic” of regions are presented in Table 3.3. Deviations of experimental and calculated data are shown in the bottom of the Figure.
Table 3.3 Parameters of Eq. (12) for best fit of experimental data in Figure3.19 and the densities of “ionic” and “aliphatic” regions calculated for best fit.
T / K VI / 10-22 ml Val / 10-22 ml I / g·ml-1al / g·ml-1
293 87.80 2.57 1.24 0.908303 88.50 2.57 1.23 0.908313 89.10 2.57 1.22 0.908323 89.70 2.58 1.21 0.908333 90.20 2.60 1.20 0.907343 90.65 2.62 1.20 0.891353 91.25 2.63 1.19 0.891
A more complicated model was also applied in this work to make an effort to
describe more precisely the experimental data presented in Figure 3.17. In this
model it was assumed that the density of the “aliphatic” regions depends on the
53
length of the long hydrocarbon chains of the cations, similar to the case of
saturated hydrocarbons [112]. This assumption seems reasonable, because
“aliphatic” regions have a smaller density. Thus, the density for these regions
should be more sensitive to changes in the molecular structure of the
components in these IL systems. In summary, it was shown that this more
complicated model does not improve considerably the fit of the calculated
density values with the experimental ones. Therefore, the simple ‘additive’
model for the density of these ILs describes rather well the density
dependences of ILs on the length of long alkyl chains of dialkylpyrrolidinium
cations.
From this simple model, which originated from the idea of additivity of “ionic”
and “aliphatic” region contributions, it follows that the structure (micro-
structure) of the ILs can also be described well by a simple ‘mosaic type’
model. Indeed, this model may only be valid if these regions are separated into
phases or micro-phases with only slight inter-phase interactions, if any.
Table 3.3 shows that an increase in temperature leads to almost no change in
density for “aliphatic” (as already discussed above) and to a decrease in the
densities of “ionic” regions at temperatures up to 333 K. This means that
“ionic” regions are much more compressible than the less dense “aliphatic”
regions. Therefore, the increase in molecular mobility in “ionic” regions results
in an increase in molecular volumes and a decrease in densities. The densities
in the “aliphatic” regions, which contain long alkyl chains of cations are much
larger (by a factor of ~1.25) than those in saturated hydrocarbons with the same
chain length (see Figure 3.18, open squares) and are comparable with those in
highly ordered bilayers of saturated lipids [116]. This means that the long
hydrocarbon chains of cations are packed very tightly in the “aliphatic”
regions. A comparison of these values (0.891 - 0.908 g/ml) and the densities of
saturated hydrocarbons at high pressures [112] shows that the density of CH2
54
regions in ILs is larger than that of n-decane at 190 MPa (ca 1875 atm) and 298
K (0.82 g ml-1) and is comparable to the density of paraffin wax under normal
conditions (0.9 g/ml). The very tight packing of alkyl chains in ILs is also
confirmed by the minor dependence of their densities on temperature (see
Table 3.3, right column). In the temperature range of 293-333 K, al does not
change and it slightly decreases only at temperatures of 333-353 K.
According to the modern point of view, any substance composed of anions and
cations must possess some kind of short-range organisation to fulfil local
electro-neutrality conditions [64]. In the case of ILs, such short-range ordering
does not lead to long-range structures, but might lead to nano-segregated fluids
[64,117]. If the IL has to order its high-charge density components into local
structures, then the low-charge density components (not participating in those
structures) must be segregated elsewhere. This can lead to formation of the two
types of regions (medium-range nano-scale domains), a high-charge density
(polar) network permeated by low-charge density (non-polar) regions.
Our results show that ILs may spontaneously separate into two liquid sub-
phases with different diffusion coefficients. Because the separation occurs only
for sufficiently large hydrophobic cations, evidently, the driving forces of this
separation are both electrostatic and also so-called ‘hydrophobic’ interactions.
Alkyl chain length dependence, which was reported for sub-phase separation in
ILs, has been theoretically described by Shimizu et al. [64]. When alkyl side
chains are short (C2-C4), the non-polar domains consist of hydrocarbon-like
“islands” in the center of a continuous polar network, whereas for longer alkyl
side chains those islands start to connect, forming a second continuous micro-
phase, thus establishing a bi-continuous segregated phase. Later, in an
experimental study of volatility of ILs in a homologous series of 1-alkyl-3-
methylimidazolium bis(trifluoromethylsulfonyl)imide, [Cnmim][Ntf2], with n
= 2 ÷ 12, Rocha et al. [117] found a ‘percolation limit’ at around n = 6, at
55
which the contribution of hydrophobic interactions became comparable with
that of the electrostatic interaction between ions in these ILs. The effect of a
similar type of separation into two sub-phases with different Ds was observed
experimentally on IL diffusion in this study (Figure 3.15). 1H NMR spectra of
fractional diffusion components in sub-phases showed that the “fast-diffusing”
component (red line in Figure 3.16) has a more intense NMR signal at
chemical shifts of aromatic protons, while in the ‘slow-diffusing’ component
(blue line in Figure 3.16) the intensity of the resonance line assigned to
aromatic protons is considerably smaller. In pyrrolidinium-BMB ILs, both
cations and anions have aliphatic protons, but only BMB anions have aromatic
protons. Therefore, here the “slow diffusing” component may predominantly
be due to the cations, while the “fast-diffusing” component may predominantly
be due to the anions.
Self-diffusion under conditions of micro-phase separation is different from that
for a bulk liquid. Indeed, in systems with a phase separation on the molecular
levels, molecules (or ions) collide with phase boundaries. Moreover, long-scale
diffusion in curvilinear trajectories in different phases will additionally
decrease experimentally measured diffusion coefficients, which may be smaller
than the corresponding molecular diffusion coefficients. Some differences in
the micro-phase structures of our samples, [C10C1Pyrr][BMB] and
[C14C1Pyrr][BMB], may account for the difference in values of the “fast
diffusing” Ds, corresponding to the BMB anion. Applying Einstein’s equation
for mean-squared displacements (Eq. 13):
<r2> = 6· Ds ·td (13)
with measured Ds for cations and anions, one can acquire displacements for
cations in the range from 0.4 μm (at lower temperatures) to 1.9 μm (at higher
temperatures), and for anions such displacements will be around 2.4 μm.
56
Evidently, smaller displacements have less effect on the apparent Ds.
Therefore, Ds of cations are disturbed less by the internal micro-phase structure
than the Ds of anions.
In studies of the relationship between structures of cations and anions, and their
physicochemical properties in the homologous series of [CnMIm][Ntf2], it has
been shown that density dependences of these ILs on the alkyl chain length,
among other physical properties such as viscosity and conductivity, are
strongly correlated with the molecular structure of these ILs [64,117]. A group
contribution method for prediction of the density of ILs over a wide range of
temperature and pressure has been proposed by Paduszynski and Domanska
[115]. Lazzus distinguished 92 functional groups contributing additively to the
molar volume of ILs [118]. In the latter study, cations were modelled as ionic
moieties consisting of the cation core and a number of alkyl chains and/or
functional groups attached to the core, while anions were treated as separate
ionic moieties. Slattery et al. [114] have suggested that the molar volume Vm of
ILs can be considered as the sum of individual contributions of cations and
anions. It has been shown experimentally that Vm increases linearly with the
number of the CH2 units in the alkyl chain attached to the cation. Following
the observation of Rebelo et al. [113] the effective molar volume was assigned
to the methylimidazolium core and the CH2 groups. Machanová et al. have
studied densities of [Nn222][Ntf2] ILs (with n = 6 ÷ 14) at atmospheric pressure
as a function of the length of one of alkyl chains of the cation, as well as
temperature [111]. These authors have suggested that the molar volume of
cations varies as a quadratic function of T [111]. Therefore, additive density
models, which suggested linear and non-linear contributions of different
chemical groups present in ions to the molar volume, are not rare. Our model
originated from both density and diffusion dependences on the alkyl chain
length of the pyrrolidinium cations. The model is different from all previously
57
reported models, because it suggests that the molar volume is not a sum of
individual contributions from ions, but the sum of the partial long chain
volume of cations (“aliphatic” regions) and volumes of anions and the residual
part, i.e., without the long alkyl chain, of cations (“ionic” regions). This
approach seems to be reasonable, because long chains of cations may form
separate hydrophobic microscopic liquid sub-phases governed by van der
Waals inter-chain interactions [111,117].
One of basic approaches to describe diffusion processes is the theory of free
volume [108]. The equation for the diffusion coefficient with a free volume can
be written in a simplified form of Eq. (11):
faaDDs *exp*
.(14)
The free volume of the molecule can be estimated as (Eq. (15)):
*aaa avf ,(15)
where aav is the average volume for the molecule. Free volume is formed near
the molecule/ion, therefore, for molecules/ions composed of a number of
diverse chemical groups, the total free volume is a sum of free volumes
neighbouring the particular chemical groups. In our particular case of
dialkylpyrrolidinium cations the following equation can be written (Eq. (16)):
af (cation) = af (methyl-pyrrolidinium core) + af (n CH2) (16)
The density analysis of ILs showed (see Table 3.2) that the density of
“aliphatic” regions of CH2 groups under normal conditions is extremely high,
and comparable to that of saturated hydrocarbons at extremely high pressures,
due to chemical bonding of the alkyl chains with the methyl-pyrrolidinium
cation core. The exact mechanism, by which the cation cores may ‘compress’
the “aliphatic” regions is not yet clear. The primary process might be a
58
decrease in the mobility of the alkyl chains by the bound pyrrolidinium core or,
more likely, the pressure due to electrostatic forces between the cations and
anions [64]. Note that the density of a neutral liquid, n-methyl-pyrrolidine, is
only 0.819 g·ml-1 at 298 K. Therefore, electrostatic interactions between
pyrrolidinium cations and BMB anions contribute considerably to packing of
ions in these ILs, so that the densities of [CnC1Pyrr][BMB] ionic liquids are
larger than 1 g·ml-1 in the whole temperature interval and, for all ionic liquids
in this study, approaching 1.24 g·ml-1 for n = 0.
If the effect of the free volume on regions of long cation alkyl chains is
infinitesimal, Eq. (9) turns into the following relation (see Eq. (17)):
af (cation) = af (methyl-pyrrolidinium core). (17)
It is, therefore, evident why the Ds of the “slow-diffusing” component are not
influenced by the number of CH2 groups in the long alkyl chain of cations: n
does not influence the free volume of the dialkylpyrrolidinium cation.
Tight packing of alkyl cation chains may lead to ordering of long cation chains
in the studied ILs in the manner of a liquid crystal. Simulations showed that,
when cationic chains are adequately long, they tend to become parallel to each
other and generate liquid crystal-like layers [63]. More experiments are needed
to confirm this idea.
Therefore, 1H diffusion NMR demonstrated that ILs with the structure
[CnC1Pyrr][BMB] are rather complex systems in molecular organization and
diffusion. For n = 4 8, in the entire temperature range of study, these ILs show
single-component diffusion decays with almost equal diffusion coefficients.
For n = 10 and 14, the NMR results demonstrate the presence of two diffusion
coefficients, which differ by almost two orders of magnitude and correspond to
the two liquid sub-phases. The driving forces of this separation are both
electrostatic interactions between cations and anions and the hydrophobic
59
interaction between cation long alkyl chains. The dependence of IL density on
the number of CH2 groups in the long chain of cations can be described well
by a simple additive model, in which “ionic” and “aliphatic” regions make
additive contributions. The densities in “aliphatic” regions are comparable to
those of saturated hydrocarbons at extremely high pressures (>1850 atm),
evidently because of strong intermolecular electrostatic interactions in the
system. This leads to an infinitesimal free volume of the long alkyl chains of
the cations and independence of diffusion (“slow-diffusing” component) in the
cation-containing phase on the number of CH2 groups in the long alkyl chains
of the cations.
3.3 Diffusion and interaction of imidazolium BMB ionic liquid in mixtures
with polyethylene glycol
One advantage in the practical application of ILs is in the area of lubrication
[5-9]. ILs can be used as the lubricant itself or as an additive to common oils.
An example of traditional base oil is the low-molecular-mass polyether PEG,
which is used as a lubricant coating for various surfaces in aqueous and non-
aqueous environments [6,119]. New imidazolium ILs [120] are promising
additives to such a lubricant. NMR is quite effective in revealing ion-ion and
ion-solvent interactions in a complex system such as a mixture of PEG with an
IL.
We studied two ILs with a common structure [CnC1Im][BMB], where n was
chosen as 10 and 12. These ILs were synthesized by Dr. Mamoun Taher and
Dr. Faiz Ullah Shah in the Chemistry of Interfaces research group, Luleå
University of Technology, using a slight modification of a method reported
previously [110]. The structures of the ions are shown in Figures 3.20A,B.
Separation, purification and physical-chemical characterization of
[CnC1Im][BMB] was performed according to the procedure described
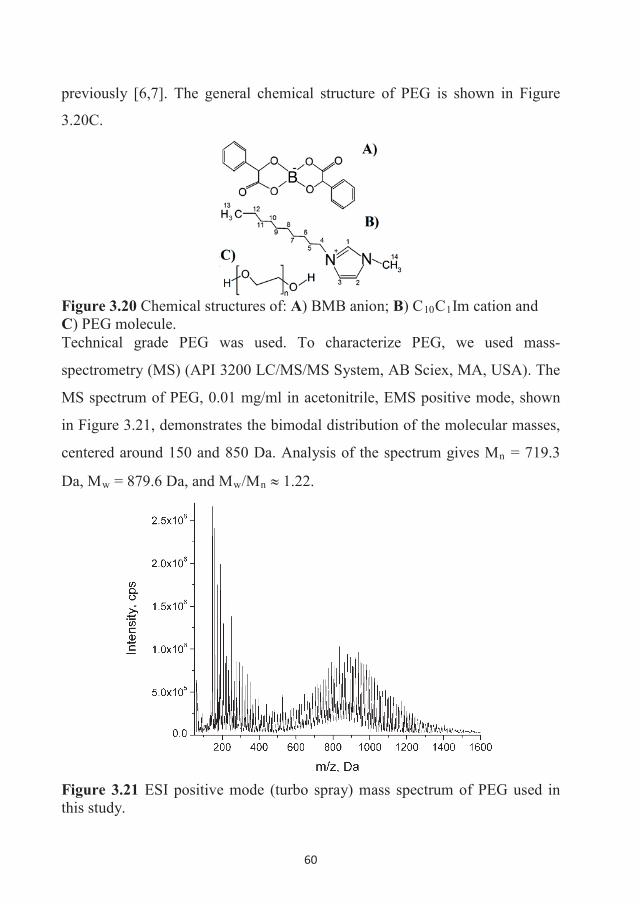
60
previously [6,7]. The general chemical structure of PEG is shown in Figure
3.20C.
Figure 3.20 Chemical structures of: A) BMB anion; B) C10C1Im cation and C) PEG molecule.Technical grade PEG was used. To characterize PEG, we used mass-
spectrometry (MS) (API 3200 LC/MS/MS System, AB Sciex, MA, USA). The
MS spectrum of PEG, 0.01 mg/ml in acetonitrile, EMS positive mode, shown
in Figure 3.21, demonstrates the bimodal distribution of the molecular masses,
centered around 150 and 850 Da. Analysis of the spectrum gives Mn = 719.3
Da, Mw = 879.6 Da, and Mw/Mn 1.22.
Figure 3.21 ESI positive mode (turbo spray) mass spectrum of PEG used in this study.
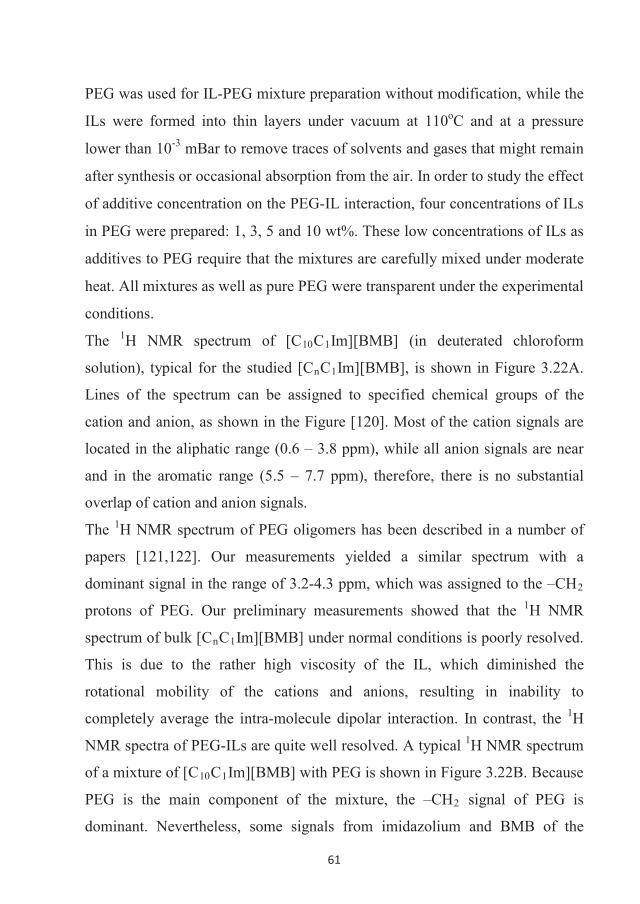
61
PEG was used for IL-PEG mixture preparation without modification, while the
ILs were formed into thin layers under vacuum at 110oC and at a pressure
lower than 10-3 mBar to remove traces of solvents and gases that might remain
after synthesis or occasional absorption from the air. In order to study the effect
of additive concentration on the PEG-IL interaction, four concentrations of ILs
in PEG were prepared: 1, 3, 5 and 10 wt%. These low concentrations of ILs as
additives to PEG require that the mixtures are carefully mixed under moderate
heat. All mixtures as well as pure PEG were transparent under the experimental
conditions.
The 1H NMR spectrum of [C10C1Im][BMB] (in deuterated chloroform
solution), typical for the studied [CnC1Im][BMB], is shown in Figure 3.22A.
Lines of the spectrum can be assigned to specified chemical groups of the
cation and anion, as shown in the Figure [120]. Most of the cation signals are
located in the aliphatic range (0.6 – 3.8 ppm), while all anion signals are near
and in the aromatic range (5.5 – 7.7 ppm), therefore, there is no substantial
overlap of cation and anion signals.
The 1H NMR spectrum of PEG oligomers has been described in a number of
papers [121,122]. Our measurements yielded a similar spectrum with a
dominant signal in the range of 3.2-4.3 ppm, which was assigned to the –CH2
protons of PEG. Our preliminary measurements showed that the 1H NMR
spectrum of bulk [CnC1Im][BMB] under normal conditions is poorly resolved.
This is due to the rather high viscosity of the IL, which diminished the
rotational mobility of the cations and anions, resulting in inability to
completely average the intra-molecule dipolar interaction. In contrast, the 1H
NMR spectra of PEG-ILs are quite well resolved. A typical 1H NMR spectrum
of a mixture of [C10C1Im][BMB] with PEG is shown in Figure 3.22B. Because
PEG is the main component of the mixture, the –CH2 signal of PEG is
dominant. Nevertheless, some signals from imidazolium and BMB of the
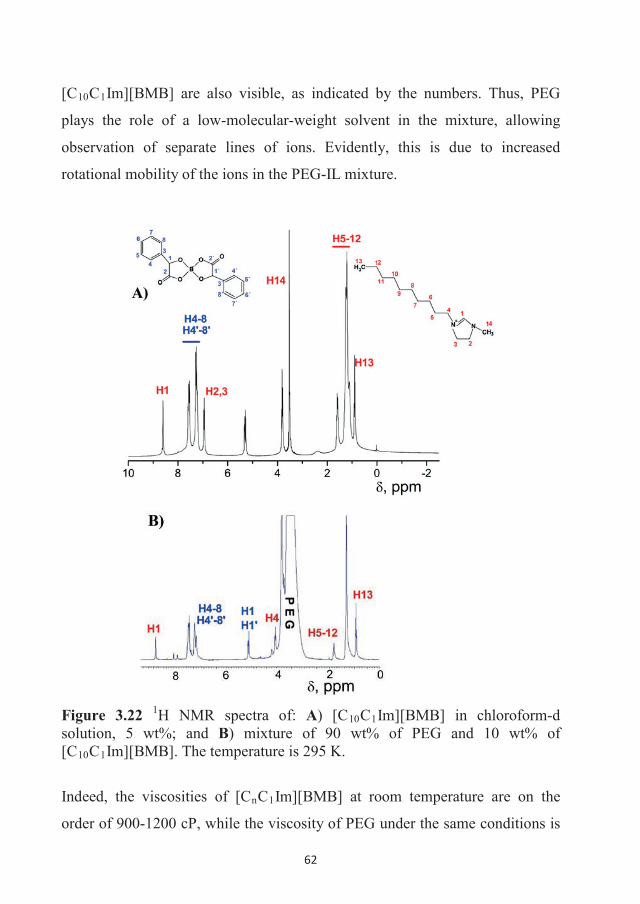
62
[C10C1Im][BMB] are also visible, as indicated by the numbers. Thus, PEG
plays the role of a low-molecular-weight solvent in the mixture, allowing
observation of separate lines of ions. Evidently, this is due to increased
rotational mobility of the ions in the PEG-IL mixture.
Figure 3.22 1H NMR spectra of: A) [C10C1Im][BMB] in chloroform-dsolution, 5 wt%; and B) mixture of 90 wt% of PEG and 10 wt% of [C10C1Im][BMB]. The temperature is 295 K.
Indeed, the viscosities of [CnC1Im][BMB] at room temperature are on the
order of 900-1200 cP, while the viscosity of PEG under the same conditions is
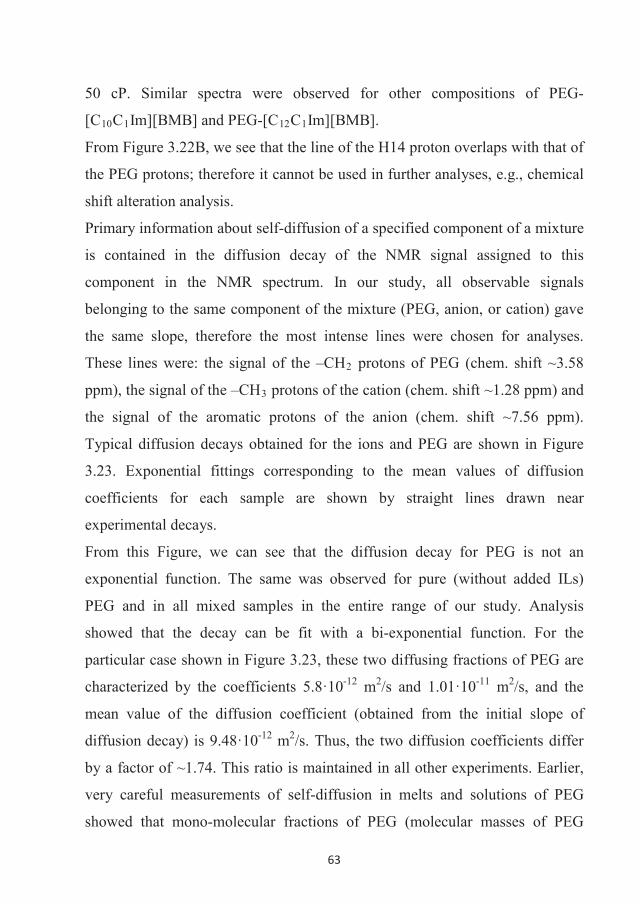
63
50 cP. Similar spectra were observed for other compositions of PEG-
[C10C1Im][BMB] and PEG-[C12C1Im][BMB].
From Figure 3.22B, we see that the line of the H14 proton overlaps with that of
the PEG protons; therefore it cannot be used in further analyses, e.g., chemical
shift alteration analysis.
Primary information about self-diffusion of a specified component of a mixture
is contained in the diffusion decay of the NMR signal assigned to this
component in the NMR spectrum. In our study, all observable signals
belonging to the same component of the mixture (PEG, anion, or cation) gave
the same slope, therefore the most intense lines were chosen for analyses.
These lines were: the signal of the –CH2 protons of PEG (chem. shift ~3.58
ppm), the signal of the –CH3 protons of the cation (chem. shift ~1.28 ppm) and
the signal of the aromatic protons of the anion (chem. shift ~7.56 ppm).
Typical diffusion decays obtained for the ions and PEG are shown in Figure
3.23. Exponential fittings corresponding to the mean values of diffusion
coefficients for each sample are shown by straight lines drawn near
experimental decays.
From this Figure, we can see that the diffusion decay for PEG is not an
exponential function. The same was observed for pure (without added ILs)
PEG and in all mixed samples in the entire range of our study. Analysis
showed that the decay can be fit with a bi-exponential function. For the
particular case shown in Figure 3.23, these two diffusing fractions of PEG are
characterized by the coefficients 5.8·10-12 m2/s and 1.01·10-11 m2/s, and the
mean value of the diffusion coefficient (obtained from the initial slope of
diffusion decay) is 9.48·10-12 m2/s. Thus, the two diffusion coefficients differ
by a factor of ~1.74. This ratio is maintained in all other experiments. Earlier,
very careful measurements of self-diffusion in melts and solutions of PEG
showed that mono-molecular fractions of PEG (molecular masses of PEG
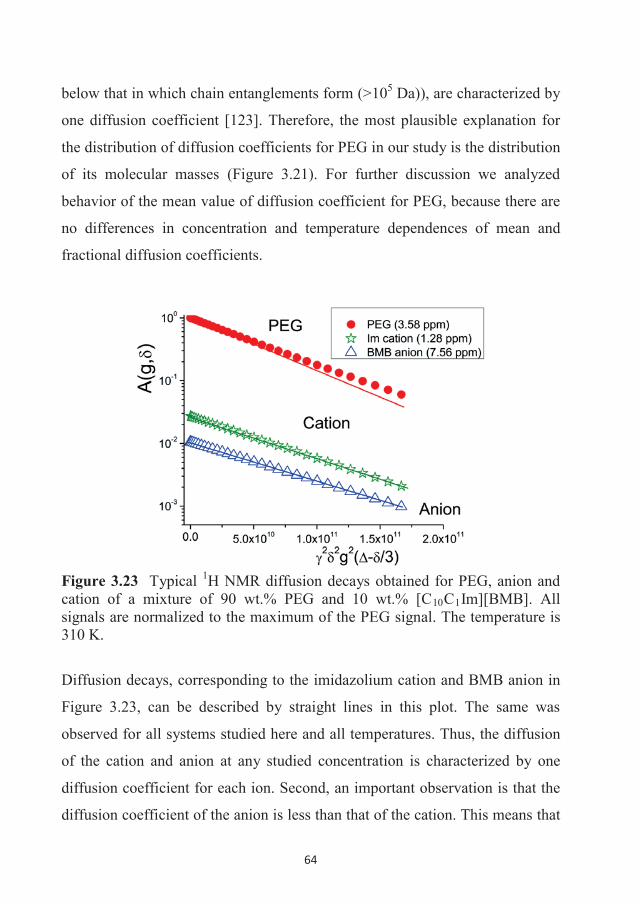
64
below that in which chain entanglements form (>105 Da)), are characterized by
one diffusion coefficient [123]. Therefore, the most plausible explanation for
the distribution of diffusion coefficients for PEG in our study is the distribution
of its molecular masses (Figure 3.21). For further discussion we analyzed
behavior of the mean value of diffusion coefficient for PEG, because there are
no differences in concentration and temperature dependences of mean and
fractional diffusion coefficients.
Figure 3.23 Typical 1H NMR diffusion decays obtained for PEG, anion and cation of a mixture of 90 wt.% PEG and 10 wt.% [C10C1Im][BMB]. All signals are normalized to the maximum of the PEG signal. The temperature is 310 K.
Diffusion decays, corresponding to the imidazolium cation and BMB anion in
Figure 3.23, can be described by straight lines in this plot. The same was
observed for all systems studied here and all temperatures. Thus, the diffusion
of the cation and anion at any studied concentration is characterized by one
diffusion coefficient for each ion. Second, an important observation is that the
diffusion coefficient of the anion is less than that of the cation. This means that
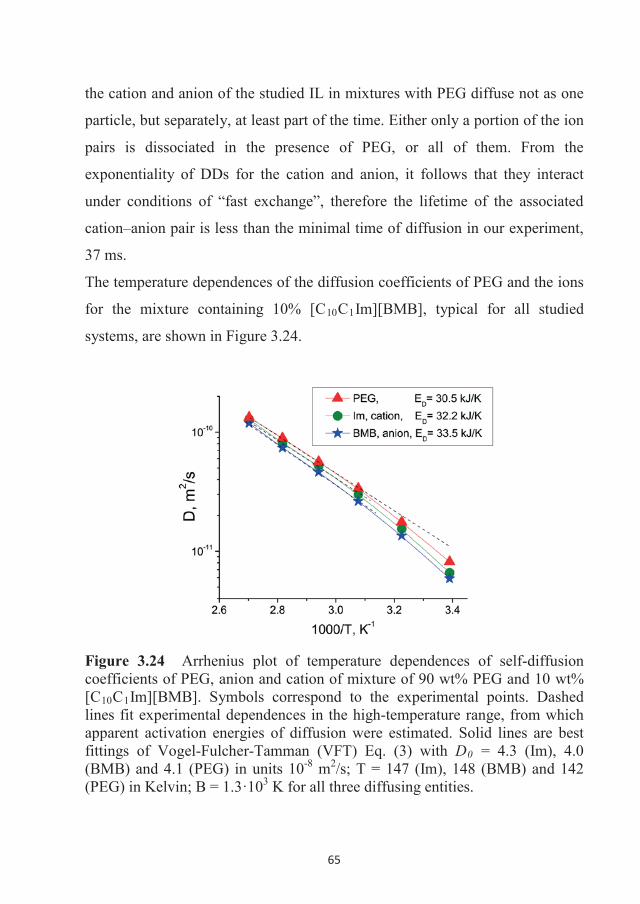
65
the cation and anion of the studied IL in mixtures with PEG diffuse not as one
particle, but separately, at least part of the time. Either only a portion of the ion
pairs is dissociated in the presence of PEG, or all of them. From the
exponentiality of DDs for the cation and anion, it follows that they interact
under conditions of “fast exchange”, therefore the lifetime of the associated
cation–anion pair is less than the minimal time of diffusion in our experiment,
37 ms.
The temperature dependences of the diffusion coefficients of PEG and the ions
for the mixture containing 10% [C10C1Im][BMB], typical for all studied
systems, are shown in Figure 3.24.
Figure 3.24 Arrhenius plot of temperature dependences of self-diffusion coefficients of PEG, anion and cation of mixture of 90 wt% PEG and 10 wt% [C10C1Im][BMB]. Symbols correspond to the experimental points. Dashed lines fit experimental dependences in the high-temperature range, from which apparent activation energies of diffusion were estimated. Solid lines are best fittings of Vogel-Fulcher-Tamman (VFT) Eq. (3) with D0 = 4.3 (Im), 4.0 (BMB) and 4.1 (PEG) in units 10-8 m2/s; T = 147 (Im), 148 (BMB) and 142 (PEG) in Kelvin; B = 1.3·103 K for all three diffusing entities.
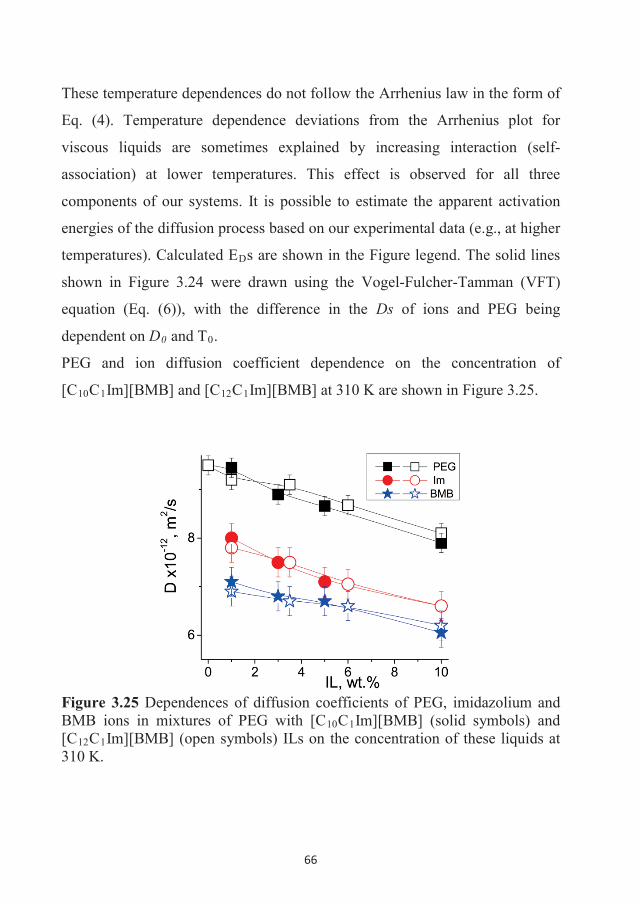
66
These temperature dependences do not follow the Arrhenius law in the form of
Eq. (4). Temperature dependence deviations from the Arrhenius plot for
viscous liquids are sometimes explained by increasing interaction (self-
association) at lower temperatures. This effect is observed for all three
components of our systems. It is possible to estimate the apparent activation
energies of the diffusion process based on our experimental data (e.g., at higher
temperatures). Calculated EDs are shown in the Figure legend. The solid lines
shown in Figure 3.24 were drawn using the Vogel-Fulcher-Tamman (VFT)
equation (Eq. (6)), with the difference in the Ds of ions and PEG being
dependent on D0 and T0.
PEG and ion diffusion coefficient dependence on the concentration of
[C10C1Im][BMB] and [C12C1Im][BMB] at 310 K are shown in Figure 3.25.
Figure 3.25 Dependences of diffusion coefficients of PEG, imidazolium and BMB ions in mixtures of PEG with [C10C1Im][BMB] (solid symbols) and [C12C1Im][BMB] (open symbols) ILs on the concentration of these liquids at 310 K.
67
Figures 3.24 and 3.25 demonstrate several characteristics of self-diffusion in
the systems studied.
1. Ds of both the cations and anion, and also of PEG concomitantly
decrease with increasing concentration of ILs in mixtures.
2. Diffusion coefficients of the anion are less than those of the cations,
approximately by a factor of 1.09.
Characteristic 1. Generally, diffusion of the molecules of a liquid depends on a
number of factors. In a very simplified case of the Stokes-Einstein equation,
(Eq. (6)) the concomitant decrease of all three diffusion coefficients with
increase of the concentration of ILs in Figure 3.25 may be related to the change
of one parameter common for all three diffusing species (one molecule and two
ions). According to Eq. (4), this might be just viscosity, which increases as the
concentration of ILs increases.
Characteristic 2. Diffusion coefficients of the anion are less than those of the
cations, by approximately a factor of 1.09. According to Eq. (4), at any
temperature and at common viscosities for the anion and cation, this might be
due to the larger hydrodynamic radius of the anion. Indeed, the molecular
masses of the anion and cations are different: M of the anion is around 311 Da,
while for [C10C1Im] it is 226 Da, and for [C12C1Im] it is 254 Da. Applying a
simple spherical model for a molecule, we can expect that RH (M)1/3. In our
case, this gives a difference in the RH of the anion and cations of factor of 1.07-
1.11, which can explain the observed difference in the diffusion coefficient of
the anion and cation. Some other factors also might be involved in the diffusion
process of the cations and anion, such as ion shape, formation of intermolecular
bonds, self-association or association with solvent (PEG) molecules.
Analyzing chemical shifts, we found that the chemical shift of the cation’s
methyl (H13) group does not change when the ILs are added to PEG.
Therefore, it was used as an internal reference. Chemical shifts of other
68
chemical groups of cations and anions (excluding H14 methyl of the cation)
were measured at different concentrations of ILs in PEG. Results are shown in
Figure 3.26. This Figure shows that the change of concentration of PEG does
not affect the BMB (Figure 3.26B) or PEG (Figure 3.26C) chemical shifts,
while it distinctly affects the imidazolium chemical shifts (Figure 3.26A),
affecting almost equally the imidazole ring’s proton H1 (8.87-8.96 ppm) and
protons H2 and H3 (7.53-7.61 ppm) as far as the H5-H12 protons of the alkyl
chain ( 1.76 ppm and 1.24 ppm). Therefore, only the imidazolium cation
interacts with PEG, and the most probable location of this interaction is the
imidazole ring. None of the effects observed for the chemical shift of the PEG
protons can be explained by any direct interaction of PEG’s protons with ILs.
Indeed, PEG may interact with the cation through the formation of hydrogen
bonds between PEG’s oxygens and protons of the cation [78]. It should be also
taken in account that, in these experiments, PEG in the mixtures is present in
excess.
The physical properties of the PEG-IL mixtures have been described in the
works of Wu et al. [78,124] They used low-molecular-weight fractions of PEG
ranging from 200 to 400 Da, and [BMIm][BF4] or [BMIm][BF6] ILs. The
miscibility of PEG with ILs has been demonstrated in their systems. NMR
spectroscopy was used to investigate the effects of PEG content and
temperature on the diffusion coefficient, chemical shift and NOESY spectra
[78]. It was shown that in the presence of PEG, the cation and anion are
characterized by different diffusion coefficients. Both PEG’s molecular mass
and concentration influence diffusion of the cation and anion. Their chemical
shift alteration and NOESY studies demonstrated that the oxygen atom of PEG
forms a hydrogen bond with the hydrogen atom of the cation, while another
hydrogen bond forms between the alkyl hydrogen of PEG and the 19F atom of
the anion [78].
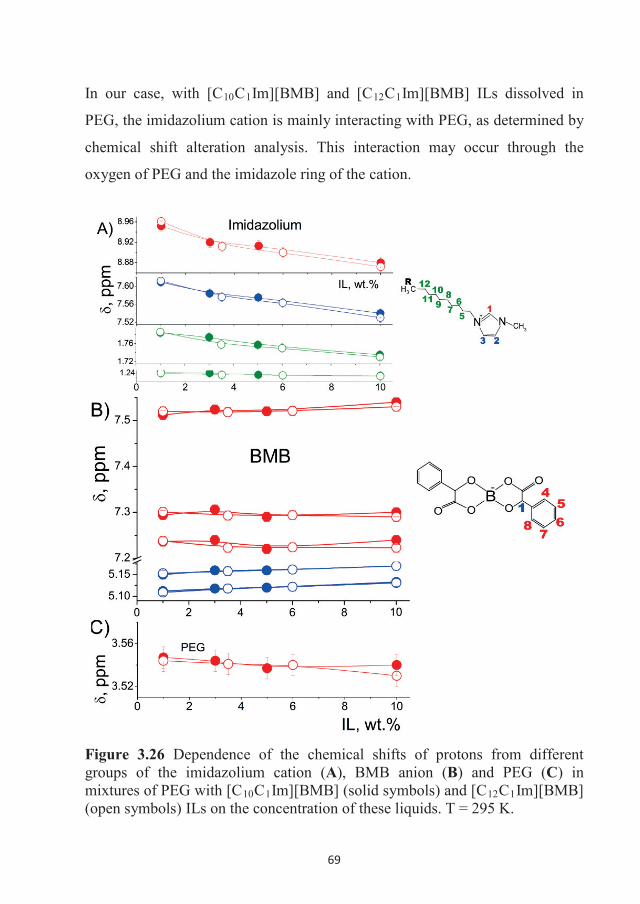
69
In our case, with [C10C1Im][BMB] and [C12C1Im][BMB] ILs dissolved in
PEG, the imidazolium cation is mainly interacting with PEG, as determined by
chemical shift alteration analysis. This interaction may occur through the
oxygen of PEG and the imidazole ring of the cation.
Figure 3.26 Dependence of the chemical shifts of protons from different groups of the imidazolium cation (A), BMB anion (B) and PEG (C) in mixtures of PEG with [C10C1Im][BMB] (solid symbols) and [C12C1Im][BMB] (open symbols) ILs on the concentration of these liquids. T = 295 K.
70
The BMB anion does not strongly interact with PEG, but it may be affected by
the effect of PEG indirectly, through interaction with the cation, which directly
interacts with PEG. The cation and anion are present in our systems in a
partially dissociated state. No aggregation effect was observed, similar to the
results reported by Wu et al. in mixtures of PEG with [BMIm][BF4] or
[BMIm][BF6] ILs [78]. The difference in diffusion coefficients of the cation
and anion can be described in the framework of the Stokes-Einstein model,
with the cation and anion represented as spheres.
Therefore, the mechanism has been demonstrated by which dissolution of ILs
in polyethylene glycol changes self-diffusion of PEG molecules and ions. PEG
behaves as a solvent for these ILs, allowing observation of separate lines in 1H
NMR spectra assigned to the cation and anion, as well as to PEG. The anion
(BMB) and cation (ImCnC1) may be present in both bound and free states, with
exchange between these states occurring in less than ~30 ms. NMR chemical
shift alteration analysis showed that the presence of PEG mainly changes the
chemical shifts of protons belonging to the imidazole ring of the cation, while
chemical shifts of protons belonging to the anion and PEG remain unchanged.
This demonstrates that imidazolium cation interacts mainly with PEG, which
may occur through the oxygen of PEG and the imidazole ring. The BMB anion
does not strongly interact with PEG, although it may be indirectly affected by
PEG, through interaction with the cation, which directly interacts with PEG.
Generally, our studies of EAN, phosphonium and pyrrolidinium orthoborate
ionic liquids in the bulk demonstrated that ions are characterised by different,
but close diffusion coefficients in homogeneous ILs. A change of chemical
structure of one of the ions, leading to change its diffusion coefficient and
activation energy of diffusion, and at the same time adjusts the Ds and ED for
diffusion of the second ion. The same effect was observed in ILs dissolved in
71
PEG where one of the ions strongly interacts with PEG, pulling with it the
second ion.
Certain sets of anions and cations (for example, a long-chained cation) may
lead to divergence of Ds and ED for the cation and anion in a certain
temperature range, explained by separation of the cation and anion in different
micro-phases (probably by formation of a sponge-like structure). In another
case, two-component diffusion for both the cation and anion is an indication of
liquid-liquid phase separation at scales larger than ionic size.
Effects of ion change, as well as dependences of density on the chain length
can be qualitatively explained by the free-volume theory.
72
CHAPTER 4. DIFFUSION OF IONIC LIQUIDS NEAR SOLID
SURFACES AND IN CONFINEMENT
4.1 Diffusion of ethylammonium nitrate confined between planes
The nanostructure of EAN can be modified due to the presence of a solid
surface, as has been shown by AFM, SAXS and SANS techniques [73,74,71].
Such alteration in the phase structure can affect the mobility of ions. Therefore,
in the next part of our experiments we studied the diffusion of EAN near solid
surfaces.
In this series of experiments, samples with EAN-containing thin plates
prepared from carefully cleaned or silanized glass or PTFE (Figure 4.1C) were
used. Thin glass
Science
and Technology Industrial Park, Taixing City, Jiangsu, China) were stacked
and placed in a square, cross-sectioned tube (Figure 4.1B). The mean spaces
between plates were estimated first from the stack height and plate thickness
and subsequently adjusted as fitting parameters. The spaces were filled with
EAN. In the experiment, the normal to the plates was oriented either along or
normal to the pulsed field gradient. It should be noted that these orientations of
flat plates are convenient for NMR studies because they do not induce
background gradients due to the difference 1n magnetic susceptibilities
between the material of the plates and the liquid [125]. Contact angle
measurements were done at the studied surfaces to examine their polarity. A
PTFE insert was used in some of the experiments (originally designed to
eliminate convection of liquid), creating compartments (Figure 4.1A). Twelve
PTFE disks with a diameter of 3.8 mm were placed on PTFE cylinders with a
length of 1.5 mm (separation between disks). The disks were oriented
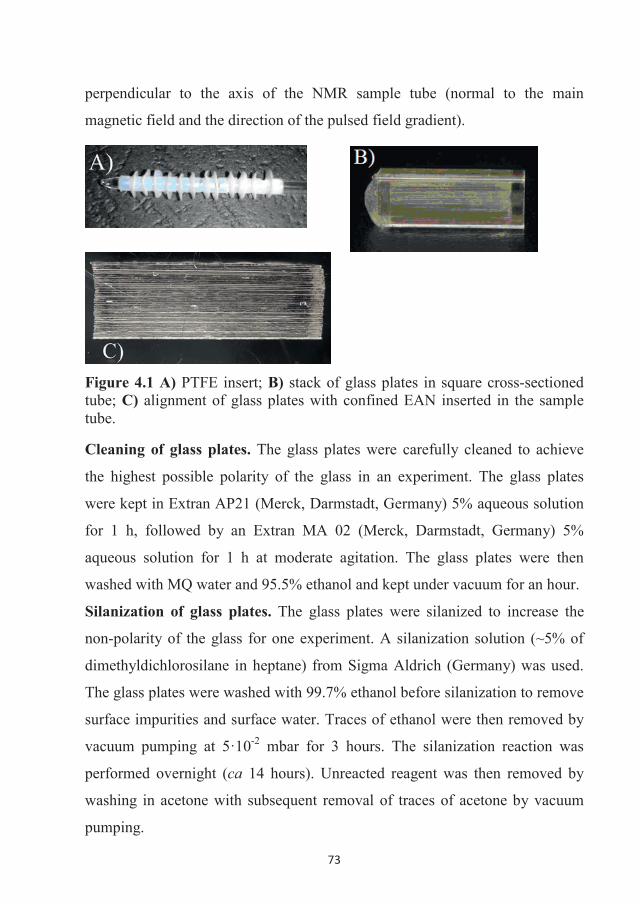
73
perpendicular to the axis of the NMR sample tube (normal to the main
magnetic field and the direction of the pulsed field gradient).
Figure 4.1 A) PTFE insert; B) stack of glass plates in square cross-sectioned tube; C) alignment of glass plates with confined EAN inserted in the sample tube.
Cleaning of glass plates. The glass plates were carefully cleaned to achieve
the highest possible polarity of the glass in an experiment. The glass plates
were kept in Extran AP21 (Merck, Darmstadt, Germany) 5% aqueous solution
for 1 h, followed by an Extran MA 02 (Merck, Darmstadt, Germany) 5%
aqueous solution for 1 h at moderate agitation. The glass plates were then
washed with MQ water and 95.5% ethanol and kept under vacuum for an hour.
Silanization of glass plates. The glass plates were silanized to increase the
non-polarity of the glass for one experiment. A silanization solution (~5% of
dimethyldichlorosilane in heptane) from Sigma Aldrich (Germany) was used.
The glass plates were washed with 99.7% ethanol before silanization to remove
surface impurities and surface water. Traces of ethanol were then removed by
vacuum pumping at 5·10-2 mbar for 3 hours. The silanization reaction was
performed overnight (ca 14 hours). Unreacted reagent was then removed by
washing in acetone with subsequent removal of traces of acetone by vacuum
pumping.
74
Contact angle measurements. The contact angle was measured using a pocket
goniometer (PG-X, FIBRO System AB, Sweden) at room temperature (21°C)
and calculated using the associated software. The liquid is pumped from a
reservoir to a needle that squeezes out small uniform drops of a selected size
onto the designated substrate. The substrate was rinsed with acetone and dried
with N2 gas prior to use. All contact angles were measured at least twice on
both sides of each substrate and on two different surfaces of each substrate.
The contact angle was measured using water (Milli-Q) to verify the polarity of
each substrate. The cleaned glass surface had a contact angle near 0°, the
silanized glass sample between 91° and 96°, and the PTFE ~105°. Therefore,
cleaned and silanized glass samples will henceforth be referred to as polar and
non-polar, respectively. Preparation of samples (filling with EAN) was
performed immediately after the cleaning or silanization procedure.
Diffusion of fluids near solid surfaces and in restricted geometry usually is
much more complicated than that in bulk, and it is time-dependent. In an
approach of elastic collisions it is apparent that diffusion of any particle (a
molecule or an ion) must be hindered in the direction normal to the barrier,
which obstructs the diffusion. For diffusion of fluids in a restricted geometry,
three regimes of diffusion can be distinguished, which are determined by the
ratio of the “pore” diameter, d, to the diffusion length, L (D0td)0.5 [126]. (i) In
the regime of a short diffusion time, mean squared displacements of particles
are much smaller than the pore diameter, (L << d). Therefore, only particles
near the pore wall have a chance to collide with the wall and the mean value of
the diffusion coefficient is close to D0. (ii) In the regime of an intermediate
diffusion time L d and a significant fraction of the particles will collide with
the pore wall. As a result of this, the apparent mean Ds is a descending
function of td. (iii) In the long diffusion time regime, also known as completely
restricted diffusion, L >> d. In this regime all fluid particles are equally
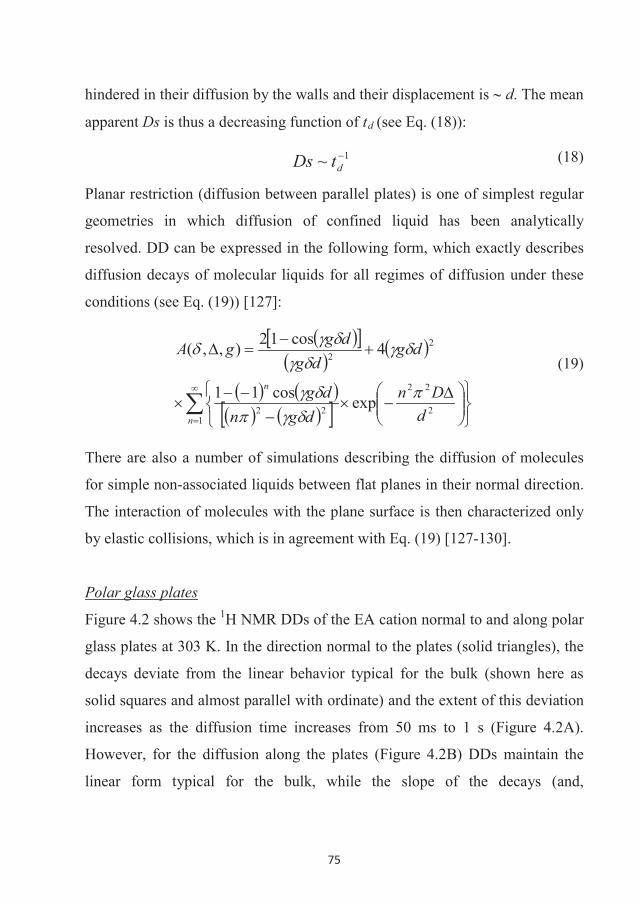
75
hindered in their diffusion by the walls and their displacement is d. The mean
apparent Ds is thus a decreasing function of td (see Eq. (18)):
1~ dtDs (18)
Planar restriction (diffusion between parallel plates) is one of simplest regular
geometries in which diffusion of confined liquid has been analytically
resolved. DD can be expressed in the following form, which exactly describes
diffusion decays of molecular liquids for all regimes of diffusion under these
conditions (see Eq. (19)) [127]:
12
22
22
22
expcos11
4cos12),,(
n
n
dDn
dgndg
dgdg
dggA(19)
There are also a number of simulations describing the diffusion of molecules
for simple non-associated liquids between flat planes in their normal direction.
The interaction of molecules with the plane surface is then characterized only
by elastic collisions, which is in agreement with Eq. (19) [127-130].
Polar glass plates
Figure 4.2 shows the 1H NMR DDs of the EA cation normal to and along polar
glass plates at 303 K. In the direction normal to the plates (solid triangles), the
decays deviate from the linear behavior typical for the bulk (shown here as
solid squares and almost parallel with ordinate) and the extent of this deviation
increases as the diffusion time increases from 50 ms to 1 s (Figure 4.2A).
However, for the diffusion along the plates (Figure 4.2B) DDs maintain the
linear form typical for the bulk, while the slope of the decays (and,
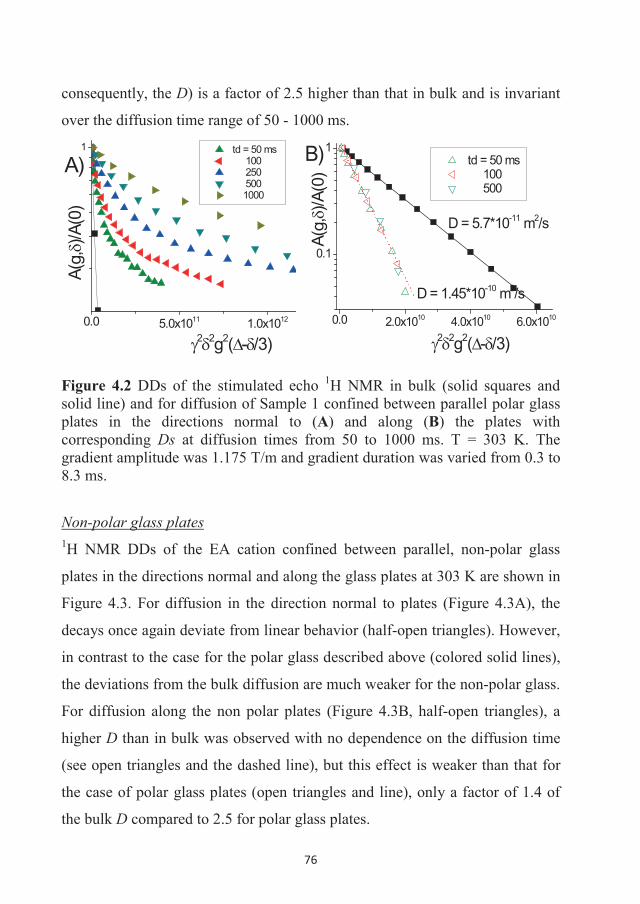
76
consequently, the D) is a factor of 2.5 higher than that in bulk and is invariant
over the diffusion time range of 50 - 1000 ms.
0.0 5.0x10¹¹ 1.0x10¹²
1 td = 50 ms 100 250 500 1000
A(g,
)/A(0
)
2 2g2( - /3)
A)
0.0 2.0x10¹⁰ 4.0x10¹⁰ 6.0x10¹⁰
0.1
1
D = 1.45*10-10 m2/s
2 2g2( - /3)A(
g,)/A
(0)
td = 50 ms 100 500
D = 5.7*10-11 m2/s
B)
Figure 4.2 DDs of the stimulated echo 1H NMR in bulk (solid squares and solid line) and for diffusion of Sample 1 confined between parallel polar glass plates in the directions normal to (A) and along (B) the plates with corresponding Ds at diffusion times from 50 to 1000 ms. T = 303 K. The gradient amplitude was 1.175 T/m and gradient duration was varied from 0.3 to 8.3 ms.
Non-polar glass plates1H NMR DDs of the EA cation confined between parallel, non-polar glass
plates in the directions normal and along the glass plates at 303 K are shown in
Figure 4.3. For diffusion in the direction normal to plates (Figure 4.3A), the
decays once again deviate from linear behavior (half-open triangles). However,
in contrast to the case for the polar glass described above (colored solid lines),
the deviations from the bulk diffusion are much weaker for the non-polar glass.
For diffusion along the non polar plates (Figure 4.3B, half-open triangles), a
higher D than in bulk was observed with no dependence on the diffusion time
(see open triangles and the dashed line), but this effect is weaker than that for
the case of polar glass plates (open triangles and line), only a factor of 1.4 of
the bulk D compared to 2.5 for polar glass plates.
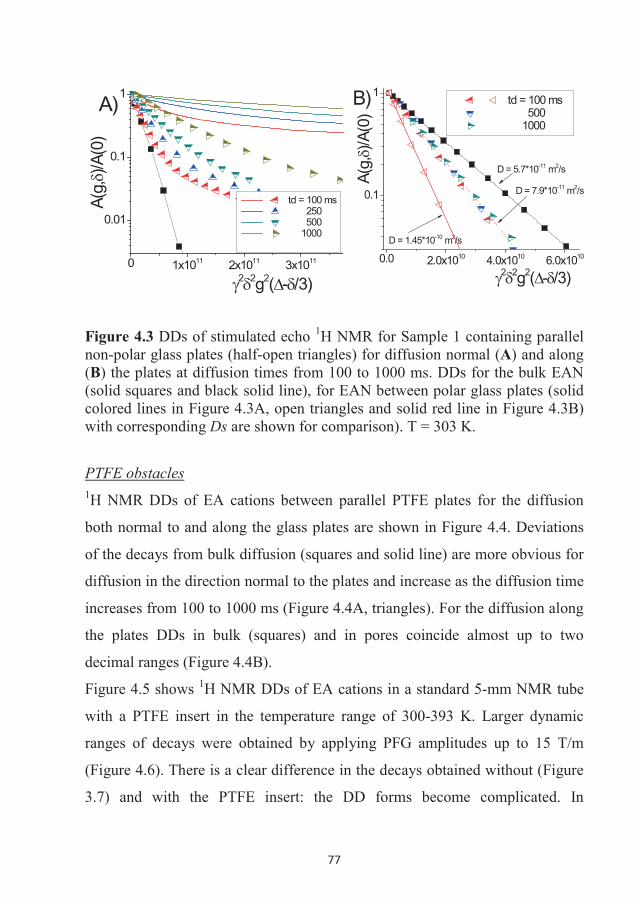
77
0 1x10¹¹ 2x10¹¹ 3x10¹¹
0.01
0.1
1
td = 100 ms 250 500 1000
A)
2 2g2( - /3)
A(g,
)/A(0
)
0.0 2.0x10¹⁰ 4.0x10¹⁰ 6.0x10¹⁰
0.1
1
D = 5.7*10-11 m2/s
D = 7.9*10-11 m2/s
D = 1.45*10-10 m2/s
td = 100 ms 500 1000
A(g,
)/A(0
)
2 2g2( - /3)
B)
Figure 4.3 DDs of stimulated echo 1H NMR for Sample 1 containing parallel non-polar glass plates (half-open triangles) for diffusion normal (A) and along (B) the plates at diffusion times from 100 to 1000 ms. DDs for the bulk EAN (solid squares and black solid line), for EAN between polar glass plates (solid colored lines in Figure 4.3A, open triangles and solid red line in Figure 4.3B) with corresponding Ds are shown for comparison). T = 303 K.
PTFE obstacles1H NMR DDs of EA cations between parallel PTFE plates for the diffusion
both normal to and along the glass plates are shown in Figure 4.4. Deviations
of the decays from bulk diffusion (squares and solid line) are more obvious for
diffusion in the direction normal to the plates and increase as the diffusion time
increases from 100 to 1000 ms (Figure 4.4A, triangles). For the diffusion along
the plates DDs in bulk (squares) and in pores coincide almost up to two
decimal ranges (Figure 4.4B).
Figure 4.5 shows 1H NMR DDs of EA cations in a standard 5-mm NMR tube
with a PTFE insert in the temperature range of 300-393 K. Larger dynamic
ranges of decays were obtained by applying PFG amplitudes up to 15 T/m
(Figure 4.6). There is a clear difference in the decays obtained without (Figure
3.7) and with the PTFE insert: the DD forms become complicated. In
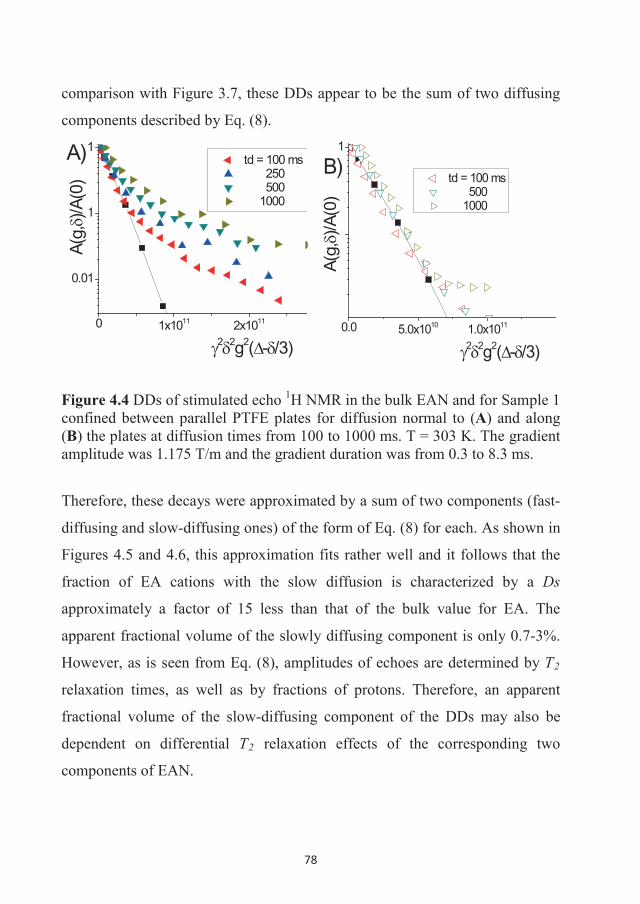
78
comparison with Figure 3.7, these DDs appear to be the sum of two diffusing
components described by Eq. (8).
0 1x10¹¹ 2x10¹¹
0.01
0.1
1 td = 100 ms 250 500 1000
2 2g2( - /3)
A(g,
)/A(0
)
A)
0.0 5.0x10¹⁰ 1.0x10¹¹
0.1
1
td = 100 ms 500 1000
A(g,
)/A(0
)2 2g2( - /3)
B)
Figure 4.4 DDs of stimulated echo 1H NMR in the bulk EAN and for Sample 1 confined between parallel PTFE plates for diffusion normal to (A) and along (B) the plates at diffusion times from 100 to 1000 ms. T = 303 K. The gradient amplitude was 1.175 T/m and the gradient duration was from 0.3 to 8.3 ms.
Therefore, these decays were approximated by a sum of two components (fast-
diffusing and slow-diffusing ones) of the form of Eq. (8) for each. As shown in
Figures 4.5 and 4.6, this approximation fits rather well and it follows that the
fraction of EA cations with the slow diffusion is characterized by a Ds
approximately a factor of 15 less than that of the bulk value for EA. The
apparent fractional volume of the slowly diffusing component is only 0.7-3%.
However, as is seen from Eq. (8), amplitudes of echoes are determined by T2
relaxation times, as well as by fractions of protons. Therefore, an apparent
fractional volume of the slow-diffusing component of the DDs may also be
dependent on differential T2 relaxation effects of the corresponding two
components of EAN.
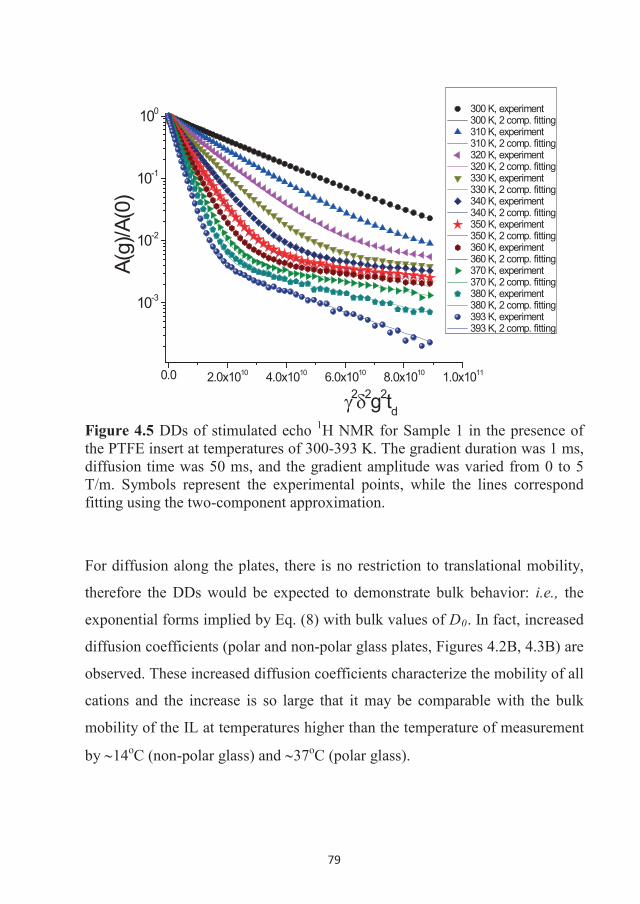
79
0.0 2.0x10¹⁰ 4.0x10¹⁰ 6.0x10¹⁰ 8.0x10¹⁰ 1.0x10¹¹
10-3
10-2
10-1
100 300 K, experiment 300 K, 2 comp. fitting 310 K, experiment 310 K, 2 comp. fitting 320 K, experiment 320 K, 2 comp. fitting 330 K, experiment 330 K, 2 comp. fitting 340 K, experiment 340 K, 2 comp. fitting 350 K, experiment 350 K, 2 comp. fitting 360 K, experiment 360 K, 2 comp. fitting 370 K, experiment 370 K, 2 comp. fitting 380 K, experiment 380 K, 2 comp. fitting 393 K, experiment 393 K, 2 comp. fitting
A(g)
/A(0
)
2 2g2td Figure 4.5 DDs of stimulated echo 1H NMR for Sample 1 in the presence of the PTFE insert at temperatures of 300-393 K. The gradient duration was 1 ms, diffusion time was 50 ms, and the gradient amplitude was varied from 0 to 5 T/m. Symbols represent the experimental points, while the lines correspond fitting using the two-component approximation.
For diffusion along the plates, there is no restriction to translational mobility,
therefore the DDs would be expected to demonstrate bulk behavior: i.e., the
exponential forms implied by Eq. (8) with bulk values of D0. In fact, increased
diffusion coefficients (polar and non-polar glass plates, Figures 4.2B, 4.3B) are
observed. These increased diffusion coefficients characterize the mobility of all
cations and the increase is so large that it may be comparable with the bulk
mobility of the IL at temperatures higher than the temperature of measurement
by 14oC (non-polar glass) and 37oC (polar glass).
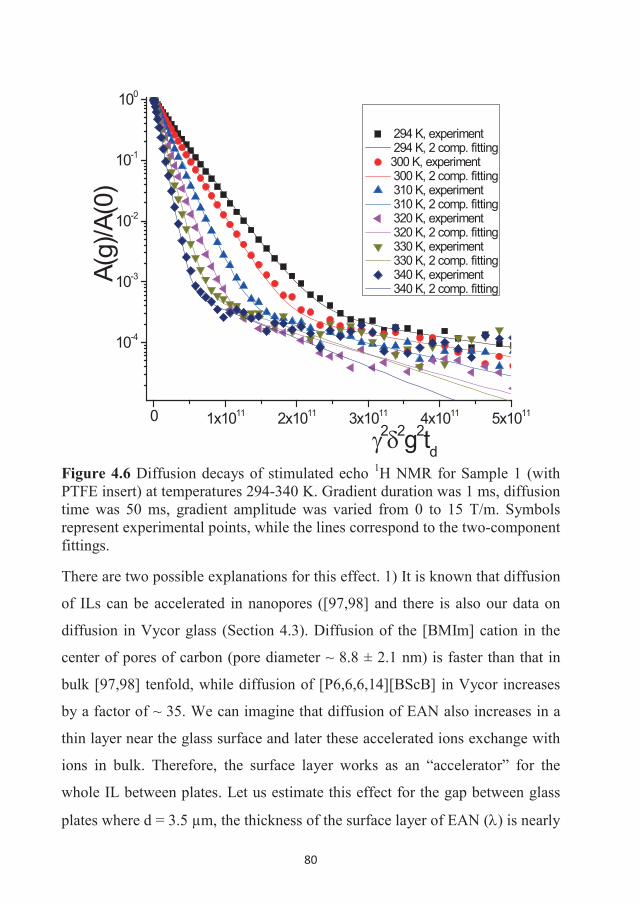
80
0 1x10¹¹ 2x10¹¹ 3x10¹¹ 4x10¹¹ 5x10¹¹
10-4
10-3
10-2
10-1
100
294 K, experiment 294 K, 2 comp. fitting300 K, experiment 300 K, 2 comp. fitting 310 K, experiment 310 K, 2 comp. fitting 320 K, experiment 320 K, 2 comp. fitting 330 K, experiment 330 K, 2 comp. fitting 340 K, experiment 340 K, 2 comp. fitting
A(g)
/A(0
)
2 2g2td Figure 4.6 Diffusion decays of stimulated echo 1H NMR for Sample 1 (with PTFE insert) at temperatures 294-340 K. Gradient duration was 1 ms, diffusion time was 50 ms, gradient amplitude was varied from 0 to 15 T/m. Symbols represent experimental points, while the lines correspond to the two-component fittings.
There are two possible explanations for this effect. 1) It is known that diffusion
of ILs can be accelerated in nanopores ([97,98] and there is also our data on
diffusion in Vycor glass (Section 4.3). Diffusion of the [BMIm] cation in the
center of pores of carbon (pore diameter ~ 8.8 ± 2.1 nm) is faster than that in
bulk [97,98] tenfold, while diffusion of [P6,6,6,14][BScB] in Vycor increases
by a factor of ~ 35. We can imagine that diffusion of EAN also increases in a
thin layer near the glass surface and later these accelerated ions exchange with
ions in bulk. Therefore, the surface layer works as an “accelerator” for the
whole IL between plates. Let us estimate this effect for the gap between glass
plates where d = 3.5 μm, the thickness of the surface layer of EAN ( ) is nearly
81
3.0 nm [73], bulk diffusion coefficient of [EA]+ cation is D0 = 5.7·10-11 m2/s,
and the diffusion coefficient in the layer is DL. If we suggest “fast exchange”
conditions between the surface layer and the bulk, then:
))/(())/(( 0|| ddDdDD L(20)
This estimation gives DL ~ 5.2·10-8 m2/s ~ 1000·D0. Such a high value is
intermediate between liquid and gas water and thought not reasonable. Other
hand, for = 60 nm [92] the calculation gives DL ~ 2.6·10-9 m2/s ~ 46·D0. This
is comparable with bulk liquid water and seems rather reasonable.
2) A rearrangement of the bulk structure of EAN to the layered structure, while
the layers are oriented along the glass plates and occupy all the volume
between the glass plates. Such an effect has not previously been observed
before ionic liquids. In this case, some structural ordering of EAN is expected.
To check this possibility, we prepared samples with EAN where a small
amount of D2O (0.8 wt.%) was added and performed 2H NMR for the EAN
sample in bulk and confined between parallel glass plates. Measurements were
performed at 2H NMR frequency of 61.434 MHz; quadrupolar echo pulse
sequence was used. The results are shown in Figure 4.7. The NMR spectrum
line for D2O in EAN confined between plates is twice as broad as the line for
the bulk system, but it does not demonstrate any splitting characteristic for
ordered systems [21].
We also attempted estimate how much splitting and ordering of the D2O
molecules might be occurring, which is not resolved in the 2H NMR spectrum
of Figure 4.7 between the plates. Results of estimations are shown on Figure
4.8. This analysis gives f 4.8 Hz.
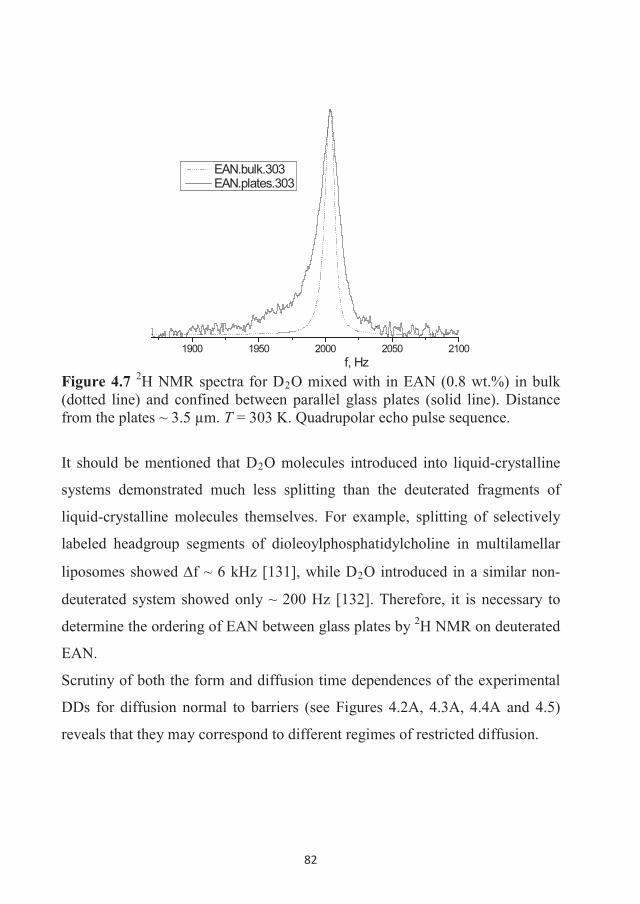
82
1900 1950 2000 2050 2100f, Hz
EAN.bulk.303EAN.plates.303
Figure 4.7 2H NMR spectra for D2O mixed with in EAN (0.8 wt.%) in bulk (dotted line) and confined between parallel glass plates (solid line). Distance from the plates ~ 3.5 μm. T = 303 K. Quadrupolar echo pulse sequence.
It should be mentioned that D2O molecules introduced into liquid-crystalline
systems demonstrated much less splitting than the deuterated fragments of
liquid-crystalline molecules themselves. For example, splitting of selectively
labeled headgroup segments of dioleoylphosphatidylcholine in multilamellar
liposomes showed f ~ 6 kHz [131], while D2O introduced in a similar non-
deuterated system showed only ~ 200 Hz [132]. Therefore, it is necessary to
determine the ordering of EAN between glass plates by 2H NMR on deuterated
EAN.
Scrutiny of both the form and diffusion time dependences of the experimental
DDs for diffusion normal to barriers (see Figures 4.2A, 4.3A, 4.4A and 4.5)
reveals that they may correspond to different regimes of restricted diffusion.
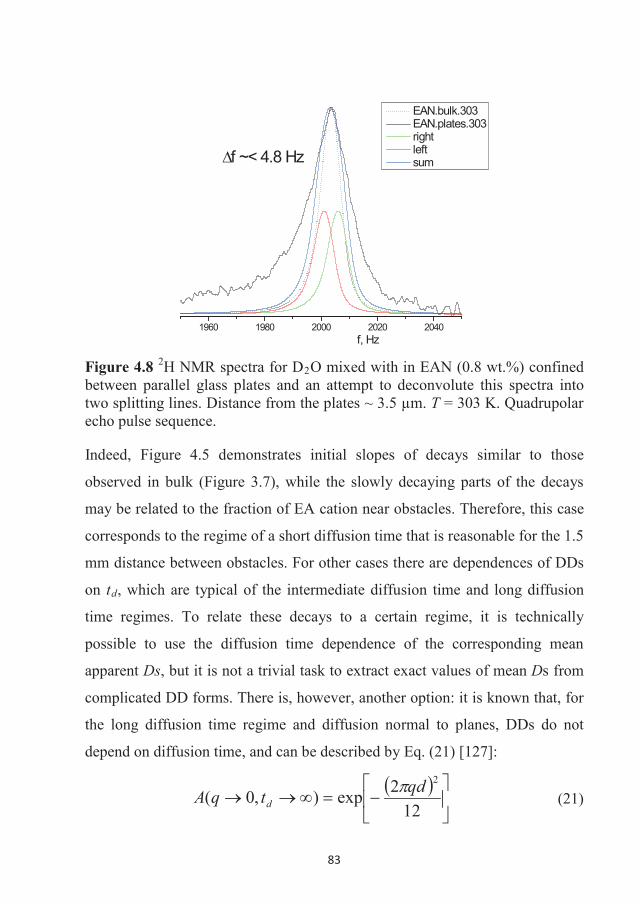
83
1960 1980 2000 2020 2040f, Hz
EAN.bulk.303EAN.plates.303rightleftsumf ~< 4.8 Hz
Figure 4.8 2H NMR spectra for D2O mixed with in EAN (0.8 wt.%) confined between parallel glass plates and an attempt to deconvolute this spectra into two splitting lines. Distance from the plates ~ 3.5 μm. T = 303 K. Quadrupolar echo pulse sequence.
Indeed, Figure 4.5 demonstrates initial slopes of decays similar to those
observed in bulk (Figure 3.7), while the slowly decaying parts of the decays
may be related to the fraction of EA cation near obstacles. Therefore, this case
corresponds to the regime of a short diffusion time that is reasonable for the 1.5
mm distance between obstacles. For other cases there are dependences of DDs
on td, which are typical of the intermediate diffusion time and long diffusion
time regimes. To relate these decays to a certain regime, it is technically
possible to use the diffusion time dependence of the corresponding mean
apparent Ds, but it is not a trivial task to extract exact values of mean Ds from
complicated DD forms. There is, however, another option: it is known that, for
the long diffusion time regime and diffusion normal to planes, DDs do not
depend on diffusion time, and can be described by Eq. (21) [127]:
122exp),0(
2qdtqA d (21)
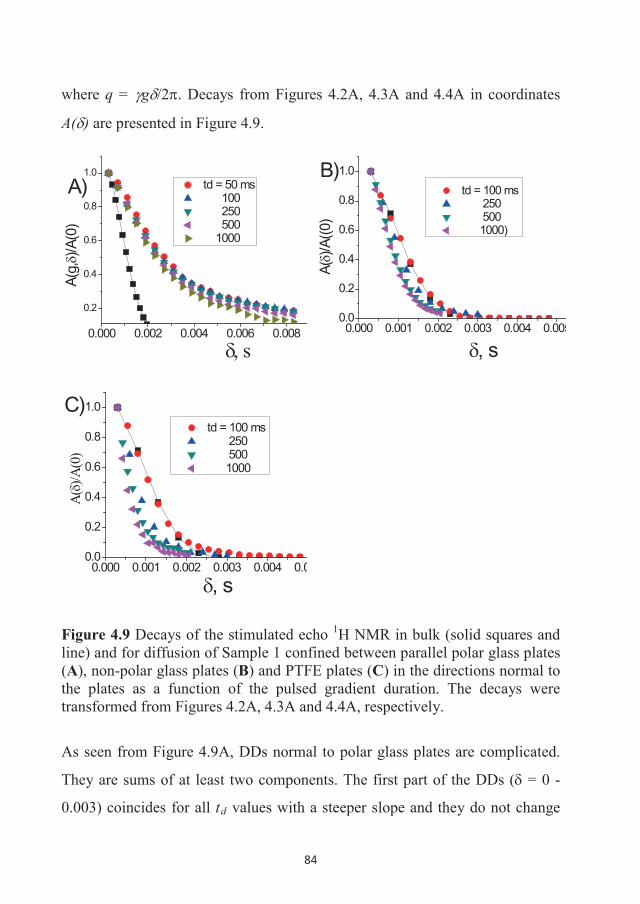
84
where q = g /2 . Decays from Figures 4.2A, 4.3A and 4.4A in coordinates
A( ) are presented in Figure 4.9.
0.000 0.002 0.004 0.006 0.008
0.2
0.4
0.6
0.8
1.0 td = 50 ms 100 250 500 1000
A(g,
)/A(0
)
s
A)
0.000 0.001 0.002 0.003 0.004 0.0050.0
0.2
0.4
0.6
0.8
1.0
A()/A
((0)
, s
td = 100 ms 250 500 1000)
B)
0.000 0.001 0.002 0.003 0.004 0.00.0
0.2
0.4
0.6
0.8
1.0
A()/A
(0)
, s
td = 100 ms 250 500 1000
C)
Figure 4.9 Decays of the stimulated echo 1H NMR in bulk (solid squares and line) and for diffusion of Sample 1 confined between parallel polar glass plates (A), non-polar glass plates (B) and PTFE plates (C) in the directions normal to the plates as a function of the pulsed gradient duration. The decays were transformed from Figures 4.2A, 4.3A and 4.4A, respectively.
As seen from Figure 4.9A, DDs normal to polar glass plates are complicated.
They are sums of at least two components. The first part of the DDs ( = 0 -
0.003) coincides for all td values with a steeper slope and they do not change
85
with diffusion time; therefore, it corresponds to the short diffusion time regime.
The remaining part of the DDs ( > 0.003) displays a gentler slope, which
increases as td increases. Therefore, it corresponds to the intermediate diffusion
time regime.
It follows from Eq. (21) that the distance between planes in the long diffusion
time regime can be determined as the square root of the slope of the DD in
coordinates ln[A(q)] versus -(4 q)2/12. Initial slopes of DDs were analyzed in
Figure 4.9A (polar glass plates) in this way and the mean distance between the
plates was estimated to be ~ 4.6 m. An iterative procedure (Eq. (19)) (which
is more universal) was applied to the case of the long diffusion time regime.
The equation was solved iteratively, with the number of iterations being varied
up to 1000. The separation between planes was first estimated by
measurements and then used as a fitting parameter, as well as Ds, to better
describe experimental DDs. One of the characteristics of diffusion in the long
diffusion time regime is that for very regular distances between planes, DDs
usually demonstrate a so-called “diffusion diffraction” effect, i.e., periodic
oscillations on DDs [127]. No such oscillations on DDs were detected in these
experiments (Figure 4.9A). According to a previous study [15], “diffusion
diffraction” effects should occur if the distribution of distances between plates
is rather broad. A Gaussian distribution of distances between planes was
introduced to reproduce such a case. Best fits of calculated DDs to the
experimental ones are shown in Figure 4.10. The calculated DDs (colored solid
lines) describe the initial parts of the experimental DDs (which correspond to
the long diffusion time regime) rather well, while discrepancies are larger for
shorter diffusion time regimes (tail of DDs in Figure 4.10). The mean distance
between planes in these simulations is 3.7 μm. Thus, theory describes the
initial parts of DDs for EAN between polar glass plates as well as restricted
diffusion in the long diffusion time regime, while a fraction (around 0.4) with
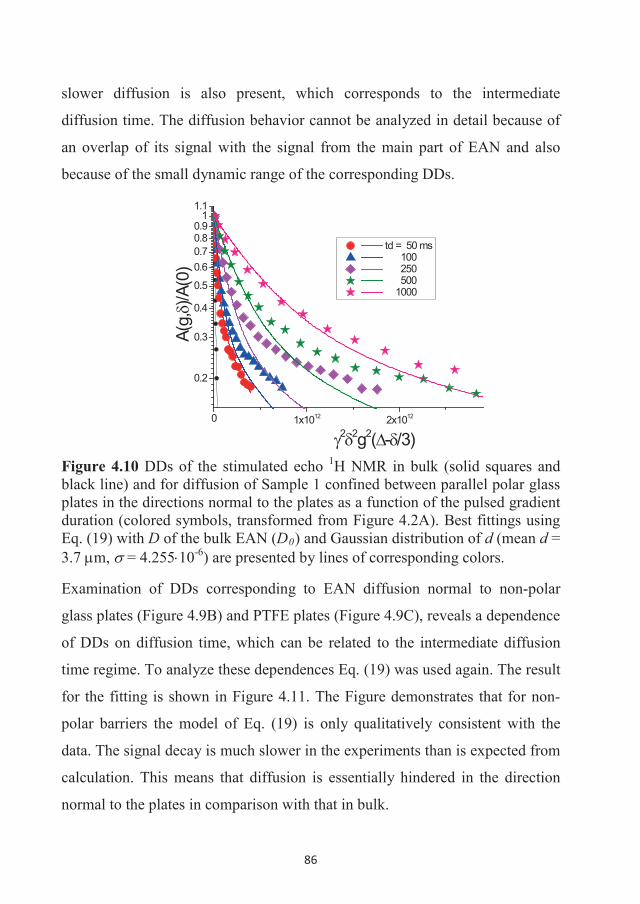
86
slower diffusion is also present, which corresponds to the intermediate
diffusion time. The diffusion behavior cannot be analyzed in detail because of
an overlap of its signal with the signal from the main part of EAN and also
because of the small dynamic range of the corresponding DDs.
0 1x10¹² 2x10¹²
0.2
0.3
0.4
0.5
0.60.70.80.9
11.1
2 2g2( - /3)
A(g,
)/A(0
)
td = 50 ms 100 250 500 1000
Figure 4.10 DDs of the stimulated echo 1H NMR in bulk (solid squares and black line) and for diffusion of Sample 1 confined between parallel polar glass plates in the directions normal to the plates as a function of the pulsed gradient duration (colored symbols, transformed from Figure 4.2A). Best fittings using Eq. (19) with D of the bulk EAN (D0) and Gaussian distribution of d (mean d =3.7 m, = 4.255 10-6) are presented by lines of corresponding colors.
Examination of DDs corresponding to EAN diffusion normal to non-polar
glass plates (Figure 4.9B) and PTFE plates (Figure 4.9C), reveals a dependence
of DDs on diffusion time, which can be related to the intermediate diffusion
time regime. To analyze these dependences Eq. (19) was used again. The result
for the fitting is shown in Figure 4.11. The Figure demonstrates that for non-
polar barriers the model of Eq. (19) is only qualitatively consistent with the
data. The signal decay is much slower in the experiments than is expected from
calculation. This means that diffusion is essentially hindered in the direction
normal to the plates in comparison with that in bulk.
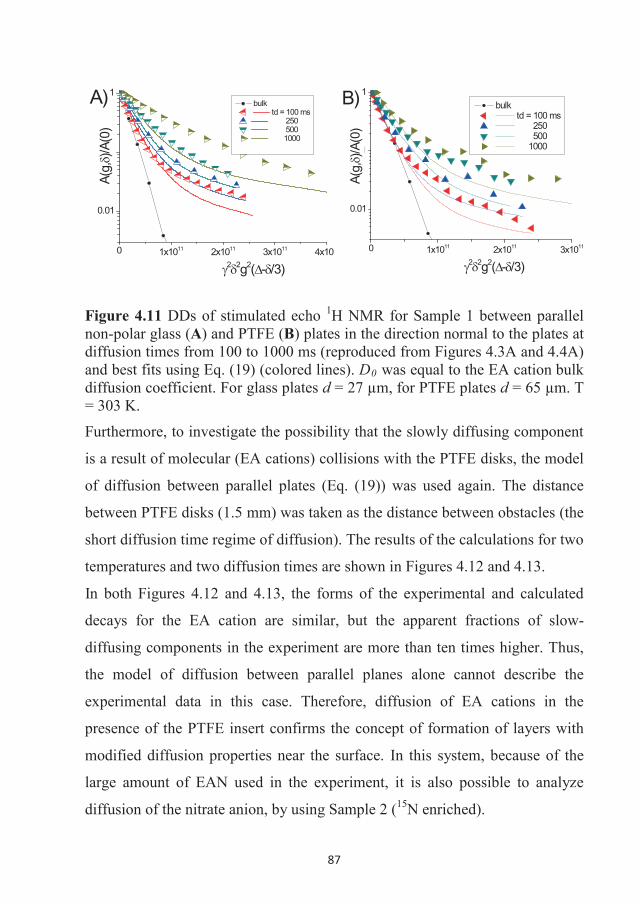
87
0 1x10¹¹ 2x10¹¹ 3x10¹¹ 4x101
0.01
0.1
1 bulk
td = 100 ms 250 500 1000
2 2g2( - /3)
A(g,
)/A(0
)A)
0 1x10¹¹ 2x10¹¹ 3x10¹¹
0.01
0.1
1 bulk
td = 100 ms 250 500 1000
2 2g2( - /3)
A(g,
)/A(0
)
B)
Figure 4.11 DDs of stimulated echo 1H NMR for Sample 1 between parallel non-polar glass (A) and PTFE (B) plates in the direction normal to the plates at diffusion times from 100 to 1000 ms (reproduced from Figures 4.3A and 4.4A) and best fits using Eq. (19) (colored lines). D0 was equal to the EA cation bulk diffusion coefficient. For glass plates d = 27 μm, for PTFE plates d = 65 μm. T = 303 K.
Furthermore, to investigate the possibility that the slowly diffusing component
is a result of molecular (EA cations) collisions with the PTFE disks, the model
of diffusion between parallel plates (Eq. (19)) was used again. The distance
between PTFE disks (1.5 mm) was taken as the distance between obstacles (the
short diffusion time regime of diffusion). The results of the calculations for two
temperatures and two diffusion times are shown in Figures 4.12 and 4.13.
In both Figures 4.12 and 4.13, the forms of the experimental and calculated
decays for the EA cation are similar, but the apparent fractions of slow-
diffusing components in the experiment are more than ten times higher. Thus,
the model of diffusion between parallel planes alone cannot describe the
experimental data in this case. Therefore, diffusion of EA cations in the
presence of the PTFE insert confirms the concept of formation of layers with
modified diffusion properties near the surface. In this system, because of the
large amount of EAN used in the experiment, it is also possible to analyze
diffusion of the nitrate anion, by using Sample 2 (15N enriched).
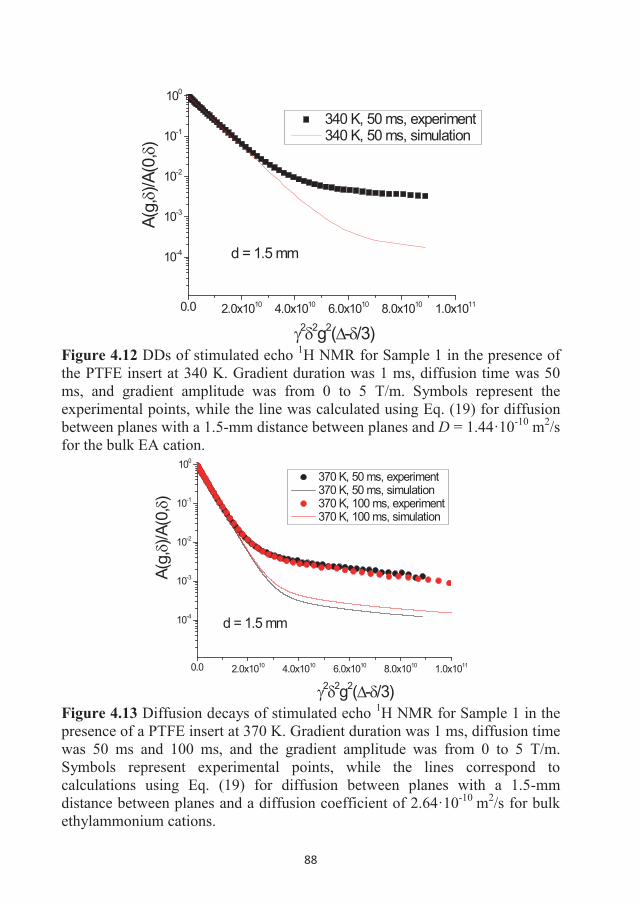
88
0.0 2.0x10¹⁰ 4.0x10¹⁰ 6.0x10¹⁰ 8.0x10¹⁰ 1.0x10¹¹
10-4
10-3
10-2
10-1
100
340 K, 50 ms, experiment 340 K, 50 ms, simulation
A(g,
)/A(0
,)
2 2g2( - /3)
d = 1.5 mm
Figure 4.12 DDs of stimulated echo 1H NMR for Sample 1 in the presence of the PTFE insert at 340 K. Gradient duration was 1 ms, diffusion time was 50 ms, and gradient amplitude was from 0 to 5 T/m. Symbols represent the experimental points, while the line was calculated using Eq. (19) for diffusion between planes with a 1.5-mm distance between planes and D = 1.44·10-10 m2/s for the bulk EA cation.
0.0 2.0x10¹⁰ 4.0x10¹⁰ 6.0x10¹⁰ 8.0x10¹⁰ 1.0x10¹¹
10-4
10-3
10-2
10-1
100
370 K, 50 ms, experiment 370 K, 50 ms, simulation 370 K, 100 ms, experiment 370 K, 100 ms, simulation
A(g,
)/A(0
,)
2 2g2( - /3)
d = 1.5 mm
Figure 4.13 Diffusion decays of stimulated echo 1H NMR for Sample 1 in the presence of a PTFE insert at 370 K. Gradient duration was 1 ms, diffusion time was 50 ms and 100 ms, and the gradient amplitude was from 0 to 5 T/m. Symbols represent experimental points, while the lines correspond to calculations using Eq. (19) for diffusion between planes with a 1.5-mm distance between planes and a diffusion coefficient of 2.64·10-10 m2/s for bulk ethylammonium cations.
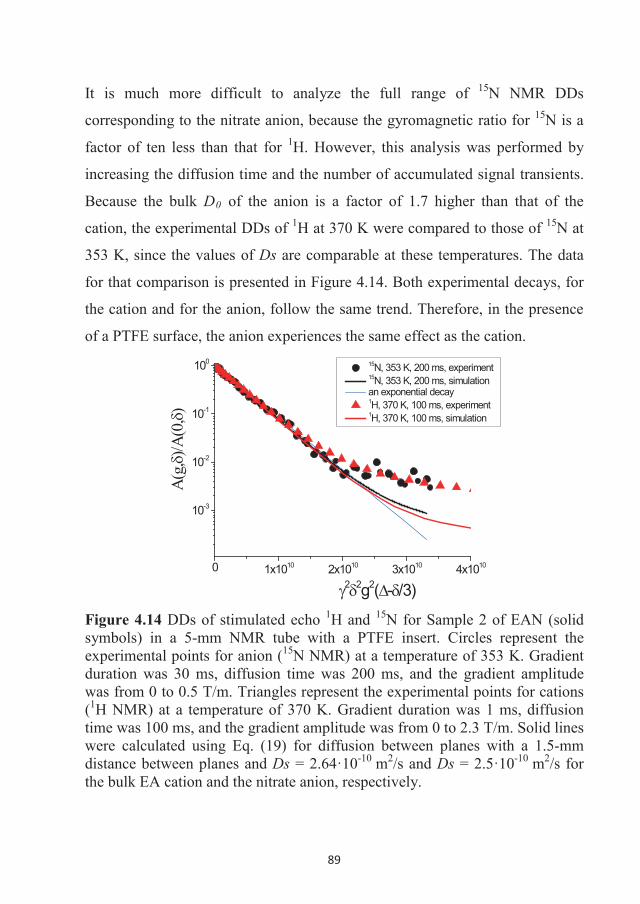
89
It is much more difficult to analyze the full range of 15N NMR DDs
corresponding to the nitrate anion, because the gyromagnetic ratio for 15N is a
factor of ten less than that for 1H. However, this analysis was performed by
increasing the diffusion time and the number of accumulated signal transients.
Because the bulk D0 of the anion is a factor of 1.7 higher than that of the
cation, the experimental DDs of 1H at 370 K were compared to those of 15N at
353 K, since the values of Ds are comparable at these temperatures. The data
for that comparison is presented in Figure 4.14. Both experimental decays, for
the cation and for the anion, follow the same trend. Therefore, in the presence
of a PTFE surface, the anion experiences the same effect as the cation.
0 1x10¹⁰ 2x10¹⁰ 3x10¹⁰ 4x10¹⁰
10-3
10-2
10-1
100 15N, 353 K, 200 ms, experiment15N, 353 K, 200 ms, simulation an exponential decay1H, 370 K, 100 ms, experiment1H, 370 K, 100 ms, simulation
A(g
,)/A
(0,)
2 2g2( - /3)
Figure 4.14 DDs of stimulated echo 1H and 15N for Sample 2 of EAN (solid symbols) in a 5-mm NMR tube with a PTFE insert. Circles represent the experimental points for anion (15N NMR) at a temperature of 353 K. Gradient duration was 30 ms, diffusion time was 200 ms, and the gradient amplitude was from 0 to 0.5 T/m. Triangles represent the experimental points for cations (1H NMR) at a temperature of 370 K. Gradient duration was 1 ms, diffusion time was 100 ms, and the gradient amplitude was from 0 to 2.3 T/m. Solid lines were calculated using Eq. (19) for diffusion between planes with a 1.5-mm distance between planes and Ds = 2.64·10-10 m2/s and Ds = 2.5·10-10 m2/s for the bulk EA cation and the nitrate anion, respectively.
90
Generally, this study demonstrates that the presence of both polar (glass) as
well as non-polar (silanized glass or PTFE) surfaces strongly influences the
diffusion of the EA cation. The nitrate anion behaves in the same way as the
EA cation, at least near the PTFE surface. The presence of a solid surface
induces apparent changes in diffusion of the IL. Because of the apparent
anisotropy of diffusion in disturbed regions (hindered normal to plates and
accelerated along the plates) it seems reasonable to suggest the formation of
layers of the IL near surface: EAN forms layers near solid polar and non-polar
surfaces where diffusion is reduced in the direction normal to the surface and
can be increased along the surface. It has earlier been shown by NMR
diffusometry that silanization of porous silica results in a significant change of
the effective Ds for a confined IL [102]. 1-hexyl-3methylimidazolium
hexafluorophosphate demonstrated a more than 10-fold decrease of Ds in polar
silica pores with a mean diameter 7.5 μm, while silanization of the silica
resulted in a significant increase of Ds, which approached the bulk value [102].
Quasielastic neutron scattering studies revealed that the diffusivity of the 1-
butyl-3-methylimidazolium cation in the center of non-polar pores of
mesoporous carbon, with a mean pore size of 8.8 nm, is faster than that of an
unconfined cation [97,98]. The authors ascribed this unusual behavior to
structural changes of the IL in the pores. A small-angle neutron scattering
study of the same samples substantiated a distinct change in structure, which
had the form of layers [98]. Concerning this study, it is evident that diffusion of
ions is anisotropic. This might occur if EAN ions form layers near the surfaces.
Our study for the first time demonstrated dynamic anisotropy for the ionic
liquid between parallel glass plates, which propagates over micron-scale
distance from the solid surface.
In the case of the PTFE insert, by making the simple assumption of
homogeneity of the “non bulk-like” material near the PTFE surface, it can be
91
characterized by a certain thickness, . Based on these assumptions and taking
into account the apparent fraction of the slow-diffusing components for
diffusion of EA in the presence of the PTFE insert (Figure 4.13), the thickness
of the layer, , can be estimated. Consider the liquid between two PTFE disks
of the PTFE insert. This liquid is separated by disks from the top and from the
bottom, and by the PTFE stem in the center. The disks are separated by 1.5 mm
and have an external diameter of 3.8 mm, while the stem has a diameter of 1.5
mm. Thus, the volume of the liquid is V = 0.0143 cm3, while the surface of the
disks and stem is S = 0.262 cm2. The volume fraction of the “non bulk-like”
material is the product of and the surface area of PTFE, therefore its volume
fraction is the slow-diffusion
component observed in Figure 4.13 and its calculated value by Eq. (19
0.0006. Thus, is ( ) cm = 0.000032 cm = 320 nm.
The value of much exceeds the thicknesses of previously observed
solid-like layers formed by ILs near the liquid/solid interface (~50-60 nm)
[92,93]. It should be stressed that the technique is most appropriate for the
study of dynamics rather than phase separation, and the approximations leading
to this conclusion are rather simple. Nonetheless, they are reasonably robust
and greater sophistication of the model will not materially affect the inferred
dimensions of the interfacial volume.
Confinement of water between non-polar surfaces leads to long-range
attractive forces, which have been measured up to distances comparable with
the dimensions quoted [133]. It is thus tempting to ascribe such interfacial
behavior to a phenomenon analogous to the hydrophobic effect in water given
the strongly hydrogen bonding nature of EAN. This would, however, be a
highly contentious issue given that the structure of water adjacent to
hydrophobic surfaces is much debated and that the distances inferred here are
92
far larger than the thickness of reduced density films ordinarily discussed. No
difference in dynamics was noted with pure water, indicating that if the
phenomenon is related to solvophobicity, the effects are much greater than in
water.
EAN has been studied by Atkin and co-workers at the air-liquid interface with
both vibrational sum frequency spectroscopy and X-ray reflectivity [73]. The
air-liquid interface can be thought of as non-polar and might be expected to
order the ions in a similar fashion to the non-polar surfaces employed here.
Significant interfacial structure could indeed be inferred, but the transition
from bulk structure to the interface was interpreted as occurring over an
approximately 30 Å thick layer. This is a much smaller effect than the current
measurements suggest, so this comparison would appear to be uninformative.
An additional characteristic of EA cations near a PTFE surface was determined
by analyzing the 1H NMR spectrum shape corresponding to the EA cations,
which contribute to the slow-diffusing component. Figure 4.15 shows the
change in the 1H NMR spectrum at different factors of decay corresponding to
the DD at 350 K, presented in Figure 4.5 (red stars). At small values of PFG
(initial part of the DD), the spectrum contains the contribution of the bulk EA
cation fraction, while at factors of decay less than 0.01, the signal from the
bulk EA cation is almost completely suppressed and only the signal (and
spectrum) from the slow-diffusing component is observed. Figure 4.5 shows
that the spectrum begins to change at a factor of decay of 0.04 (blue line) and
continues to change as long as the factor of decay decreases. During this
process of change, the resonance line corresponding to the –NH3+ group
decreases in relative intensity, while resonance lines corresponding to –NH3+
and –CH3 groups become broader. The line corresponding to the –CH2– group
is unclear. Taken together, this means that in the reduced diffusion state (near
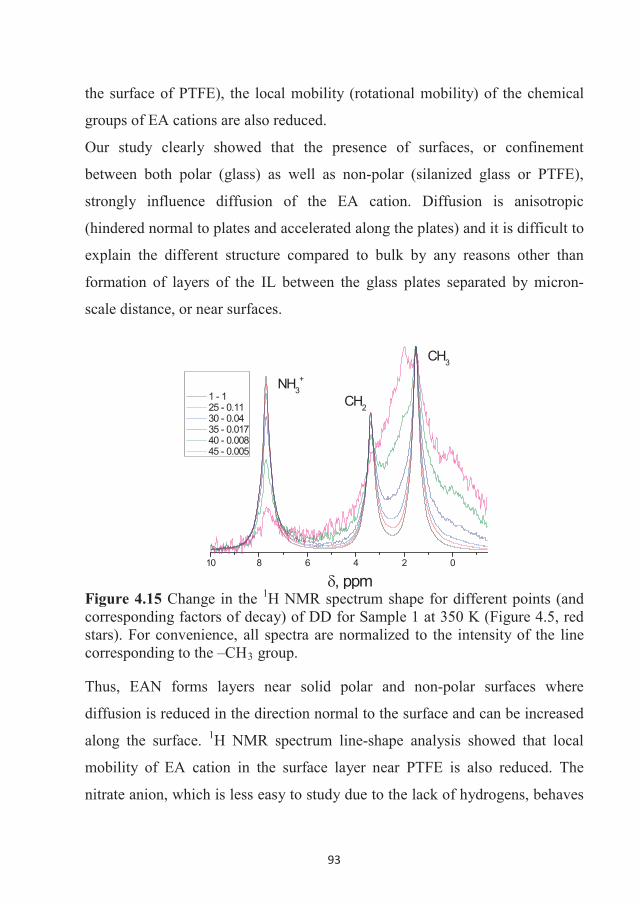
93
the surface of PTFE), the local mobility (rotational mobility) of the chemical
groups of EA cations are also reduced.
Our study clearly showed that the presence of surfaces, or confinement
between both polar (glass) as well as non-polar (silanized glass or PTFE),
strongly influence diffusion of the EA cation. Diffusion is anisotropic
(hindered normal to plates and accelerated along the plates) and it is difficult to
explain the different structure compared to bulk by any reasons other than
formation of layers of the IL between the glass plates separated by micron-
scale distance, or near surfaces.
10 8 6 4 2 0
CH3
CH2
NH3+
, ppm
1 - 1 25 - 0.11 30 - 0.04 35 - 0.017 40 - 0.008 45 - 0.005
Figure 4.15 Change in the 1H NMR spectrum shape for different points (and corresponding factors of decay) of DD for Sample 1 at 350 K (Figure 4.5, red stars). For convenience, all spectra are normalized to the intensity of the line corresponding to the –CH3 group.
Thus, EAN forms layers near solid polar and non-polar surfaces where
diffusion is reduced in the direction normal to the surface and can be increased
along the surface. 1H NMR spectrum line-shape analysis showed that local
mobility of EA cation in the surface layer near PTFE is also reduced. The
nitrate anion, which is less easy to study due to the lack of hydrogens, behaves
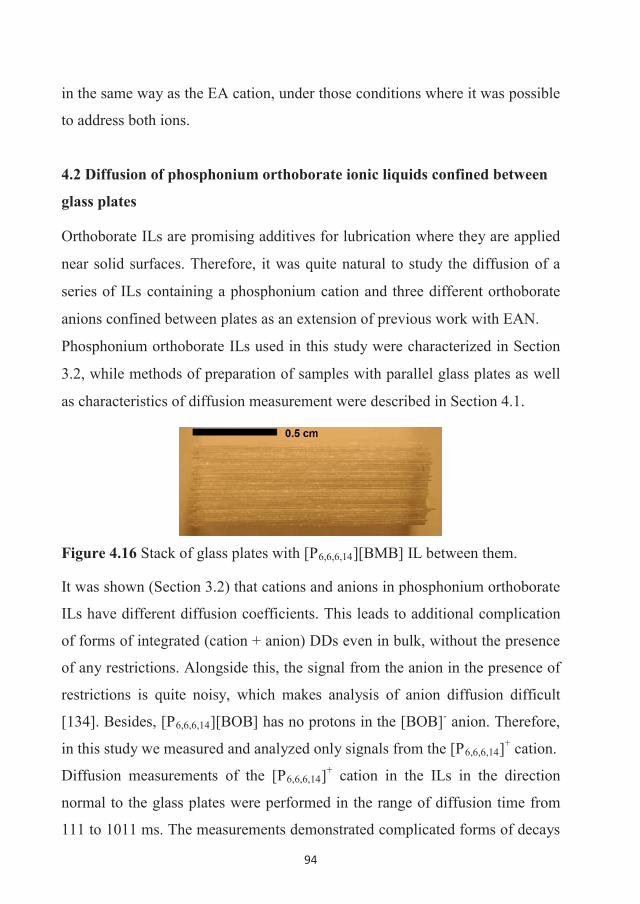
94
in the same way as the EA cation, under those conditions where it was possible
to address both ions.
4.2 Diffusion of phosphonium orthoborate ionic liquids confined between
glass plates
Orthoborate ILs are promising additives for lubrication where they are applied
near solid surfaces. Therefore, it was quite natural to study the diffusion of a
series of ILs containing a phosphonium cation and three different orthoborate
anions confined between plates as an extension of previous work with EAN.
Phosphonium orthoborate ILs used in this study were characterized in Section
3.2, while methods of preparation of samples with parallel glass plates as well
as characteristics of diffusion measurement were described in Section 4.1.
Figure 4.16 Stack of glass plates with [P6,6,6,14][BMB] IL between them.
It was shown (Section 3.2) that cations and anions in phosphonium orthoborate
ILs have different diffusion coefficients. This leads to additional complication
of forms of integrated (cation + anion) DDs even in bulk, without the presence
of any restrictions. Alongside this, the signal from the anion in the presence of
restrictions is quite noisy, which makes analysis of anion diffusion difficult
[134]. Besides, [P6,6,6,14][BOB] has no protons in the [BOB]- anion. Therefore,
in this study we measured and analyzed only signals from the [P6,6,6,14]+ cation.
Diffusion measurements of the [P6,6,6,14]+ cation in the ILs in the direction
normal to the glass plates were performed in the range of diffusion time from
111 to 1011 ms. The measurements demonstrated complicated forms of decays
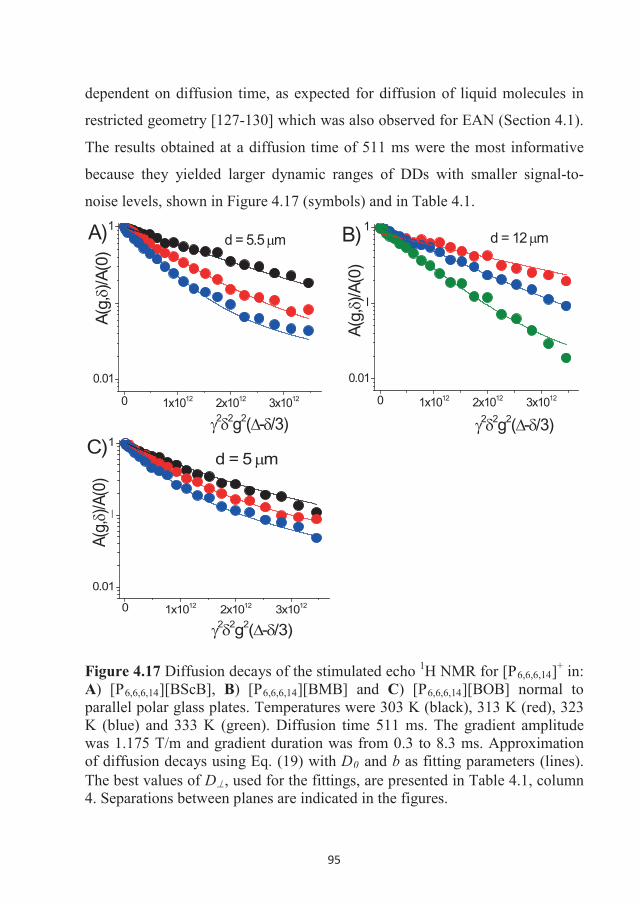
95
dependent on diffusion time, as expected for diffusion of liquid molecules in
restricted geometry [127-130] which was also observed for EAN (Section 4.1).
The results obtained at a diffusion time of 511 ms were the most informative
because they yielded larger dynamic ranges of DDs with smaller signal-to-
noise levels, shown in Figure 4.17 (symbols) and in Table 4.1.
0 1x10¹² 2x10¹² 3x10¹²
0.01
0.1
1
2 2g2( - /3)
A(g,
)/A(0
)
d = 5.5 mA)
0 1x10¹² 2x10¹² 3x10¹²
0.01
0.1
1
A(g,
)/A(0
)
B)
2 2g2( - /3)
d = 12 m
0 1x10¹² 2x10¹² 3x10¹²
0.01
0.1
1
A(g,
)/A(0
)
2 2g2( - /3)
d = 5 mC)
Figure 4.17 Diffusion decays of the stimulated echo 1H NMR for [P6,6,6,14]+ in: A) [P6,6,6,14][BScB], B) [P6,6,6,14][BMB] and C) [P6,6,6,14][BOB] normal to parallel polar glass plates. Temperatures were 303 K (black), 313 K (red), 323 K (blue) and 333 K (green). Diffusion time 511 ms. The gradient amplitudewas 1.175 T/m and gradient duration was from 0.3 to 8.3 ms. Approximation of diffusion decays using Eq. (19) with D0 and b as fitting parameters (lines). The best values of D , used for the fittings, are presented in Table 4.1, column 4. Separations between planes are indicated in the figures.
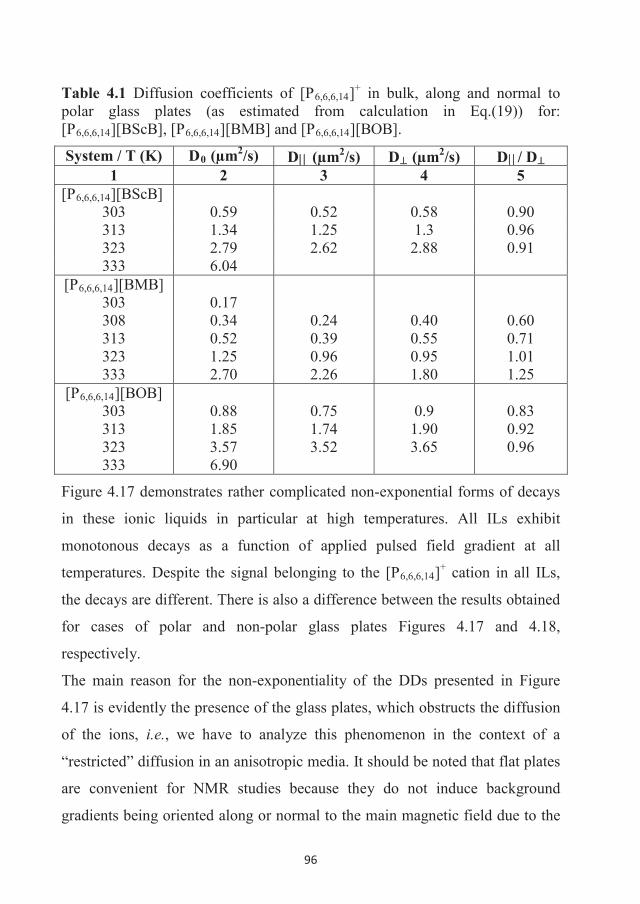
96
Table 4.1 Diffusion coefficients of [P6,6,6,14]+ in bulk, along and normal to polar glass plates (as estimated from calculation in Eq.(19)) for: [P6,6,6,14][BScB], [P6,6,6,14][BMB] and [P6,6,6,14][BOB].
System / T (K) D0 (μm2/s) D (μm2/s) D (μm2/s) D / D1 2 3 4 5
[P6,6,6,14][BScB]303 0.59 0.52 0.58 0.90313 1.34 1.25 1.3 0.96323 2.79 2.62 2.88 0.91333 6.04
[P6,6,6,14][BMB]303308313323333
0.170.340.521.252.70
0.240.390.962.26
0.400.550.951.80
0.600.711.011.25
[P6,6,6,14][BOB]303313323333
0.881.853.576.90
0.751.743.52
0.91.903.65
0.830.920.96
Figure 4.17 demonstrates rather complicated non-exponential forms of decays
in these ionic liquids in particular at high temperatures. All ILs exhibit
monotonous decays as a function of applied pulsed field gradient at all
temperatures. Despite the signal belonging to the [P6,6,6,14]+ cation in all ILs,
the decays are different. There is also a difference between the results obtained
for cases of polar and non-polar glass plates Figures 4.17 and 4.18,
respectively.
The main reason for the non-exponentiality of the DDs presented in Figure
4.17 is evidently the presence of the glass plates, which obstructs the diffusion
of the ions, i.e., we have to analyze this phenomenon in the context of a
“restricted” diffusion in an anisotropic media. It should be noted that flat plates
are convenient for NMR studies because they do not induce background
gradients being oriented along or normal to the main magnetic field due to the
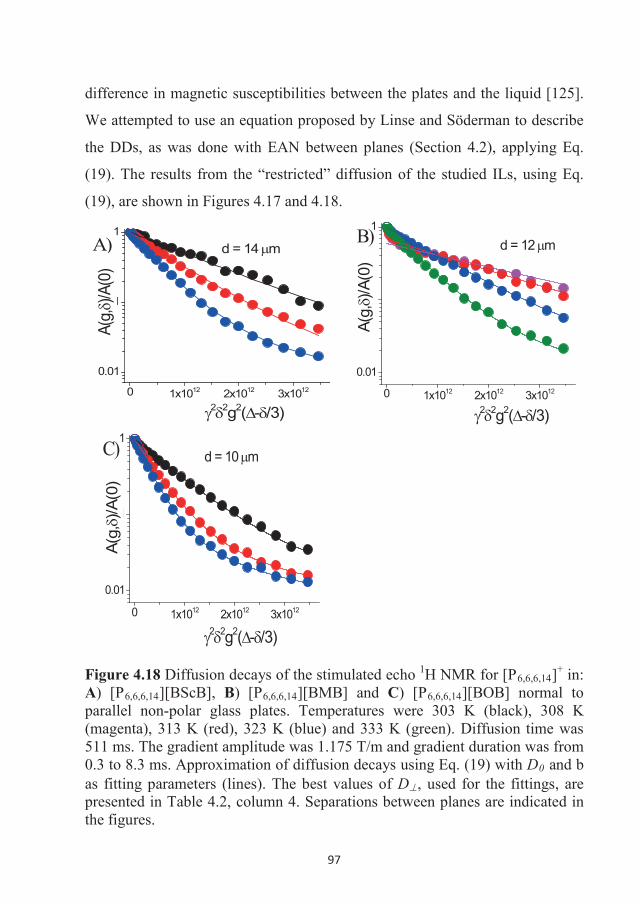
97
difference in magnetic susceptibilities between the plates and the liquid [125].
We attempted to use an equation proposed by Linse and Söderman to describe
the DDs, as was done with EAN between planes (Section 4.2), applying Eq.
(19). The results from the “restricted” diffusion of the studied ILs, using Eq.
(19), are shown in Figures 4.17 and 4.18.
0 1x10¹² 2x10¹² 3x10¹²
0.01
0.1
1
2 2g2( - /3)
A)
A(g,
)/A(0
)
d = 14 m
0 1x10¹² 2x10¹² 3x10¹²
0.01
0.1
1
2 2g2( - /3)
A(g,
)/A(0
)
B) d = 12 m
0 1x10¹² 2x10¹² 3x10¹²
0.01
0.1
1
A(g,
)/A(0
)
C)
2 2g2( - /3)
d = 10 m
Figure 4.18 Diffusion decays of the stimulated echo 1H NMR for [P6,6,6,14]+ in: A) [P6,6,6,14][BScB], B) [P6,6,6,14][BMB] and C) [P6,6,6,14][BOB] normal to parallel non-polar glass plates. Temperatures were 303 K (black), 308 K (magenta), 313 K (red), 323 K (blue) and 333 K (green). Diffusion time was511 ms. The gradient amplitude was 1.175 T/m and gradient duration was from 0.3 to 8.3 ms. Approximation of diffusion decays using Eq. (19) with D0 and b as fitting parameters (lines). The best values of D , used for the fittings, are presented in Table 4.2, column 4. Separations between planes are indicated in the figures.
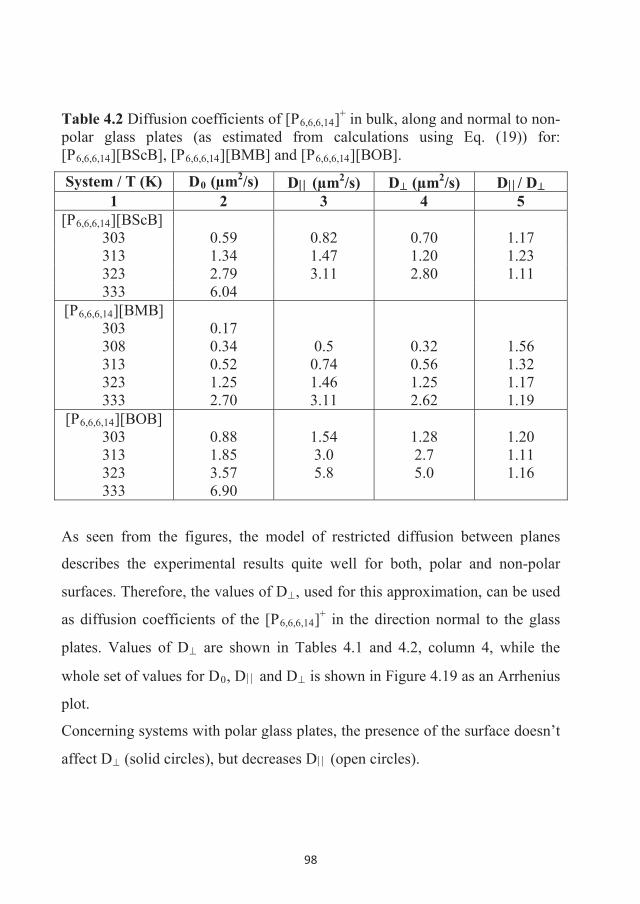
98
Table 4.2 Diffusion coefficients of [P6,6,6,14]+ in bulk, along and normal to non-polar glass plates (as estimated from calculations using Eq. (19)) for: [P6,6,6,14][BScB], [P6,6,6,14][BMB] and [P6,6,6,14][BOB].
System / T (K) D0 (μm2/s) D (μm2/s) D (μm2/s) D / D1 2 3 4 5
[P6,6,6,14][BScB]303 0.59 0.82 0.70 1.17313 1.34 1.47 1.20 1.23323 2.79 3.11 2.80 1.11333 6.04
[P6,6,6,14][BMB]303308313323333
0.170.340.521.252.70
0.50.741.463.11
0.320.561.252.62
1.561.321.171.19
[P6,6,6,14][BOB]303313323333
0.881.853.576.90
1.543.05.8
1.282.75.0
1.201.111.16
As seen from the figures, the model of restricted diffusion between planes
describes the experimental results quite well for both, polar and non-polar
surfaces. Therefore, the values of D , used for this approximation, can be used
as diffusion coefficients of the [P6,6,6,14]+ in the direction normal to the glass
plates. Values of D are shown in Tables 4.1 and 4.2, column 4, while the
whole set of values for D0, D and D is shown in Figure 4.19 as an Arrhenius
plot.
Concerning systems with polar glass plates, the presence of the surface doesn’t
affect D (solid circles), but decreases D (open circles).
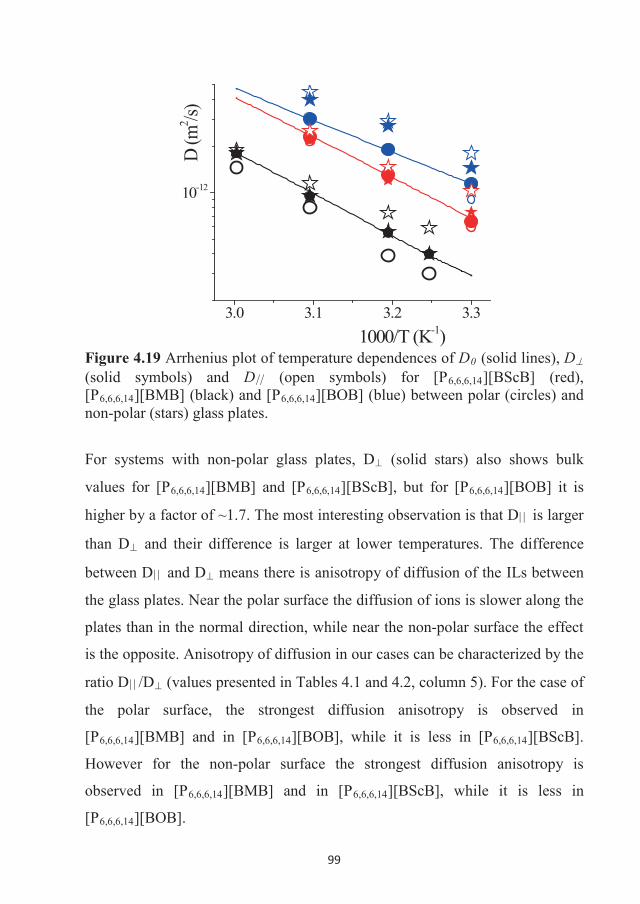
99
3.0 3.1 3.2 3.3
10-12D
(m2 /s)
1000/T (K-1)Figure 4.19 Arrhenius plot of temperature dependences of D0 (solid lines), D(solid symbols) and D (open symbols) for [P6,6,6,14][BScB] (red), [P6,6,6,14][BMB] (black) and [P6,6,6,14][BOB] (blue) between polar (circles) and non-polar (stars) glass plates.
For systems with non-polar glass plates, D (solid stars) also shows bulk
values for [P6,6,6,14][BMB] and [P6,6,6,14][BScB], but for [P6,6,6,14][BOB] it is
higher by a factor of ~1.7. The most interesting observation is that D is larger
than D and their difference is larger at lower temperatures. The difference
between D and D means there is anisotropy of diffusion of the ILs between
the glass plates. Near the polar surface the diffusion of ions is slower along the
plates than in the normal direction, while near the non-polar surface the effect
is the opposite. Anisotropy of diffusion in our cases can be characterized by the
ratio D /D (values presented in Tables 4.1 and 4.2, column 5). For the case of
the polar surface, the strongest diffusion anisotropy is observed in
[P6,6,6,14][BMB] and in [P6,6,6,14][BOB], while it is less in [P6,6,6,14][BScB].
However for the non-polar surface the strongest diffusion anisotropy is
observed in [P6,6,6,14][BMB] and in [P6,6,6,14][BScB], while it is less in
[P6,6,6,14][BOB].
100
Numerous studies have suggested formation of “solid-like” layers, a structure
that IL ions may form on solid surfaces and in confined geometries [82,92-95].
Literature data are rather diverse and depend on the surface and the IL used.
Translational dynamics of ionic liquids confined in pores may demonstrate
rather high mobility of ILs [82]. On the other hand, NMR diffusion data for
[BMIm][BF4] confined in porous silica (pore size diameter of ~12 and 15 nm)
showed no decrease in ionic mobility [135]. From neutron scattering data, it
has been concluded that confinement may enhance, rather than suppress,
diffusivity of a certain fraction of the cations. Studies by Chathoth et al. show
that diffusivity of the [BMIm] cation in the center of hydrophobic pores of
carbon (pore diameter ~ 8.8 ± 2.1 nm) is faster than that in bulk [97,98]. On the
other hand, [HMIm][PF6] demonstrated a more than 10-fold decrease in
diffusivity due to being confined in silica nanopores with a diameter of 7.5 ±
0.7 nm [102]. Most published results have been obtained using nanoporous
systems, while our studied systems relate to macropores according to their
interplanar distance of 5 14 μm. However, we showed for the first time in
this work, to the best of our knowledge, that the effect of confinement on the
diffusivity of ionic liquids can be observed for specified ILs and in specified
temperature ranges, even in the micrometer-scale range.
The effect of silanization of a surface on the diffusion of ILs has been studied
on [HMIm][PF6] confined in silica nanopores [102] and has been shown to
prevent formation of hydrogen bonds with the surface, which leads to an
increase in diffusivity. Evidently, silanization of macropores does not have
such a strong effect on diffusion in macropores, because just a small fraction of
the ions may participate in formation of hydrogen bonds in such systems.
Generally, the effects of confinement on diffusion of ILs in nanopores were
discussed, taking into consideration the interaction of these ions with the pores.
However, for macropores, because the fraction of molecules (ions) near the
101
pore walls is small, we suggest that the effect of macropores on the
microstructure of ILs plays a more important role. Indeed, the macroscopically
isotropic sponge-like microstructure of bulk ILs contains phase borders
hindering the translational mobility of ions across the phase borders. If this
structure rearranged from more to less layered, with layers oriented along
pores, the effect of the phase borders will be decreased and the diffusion
coefficient should increase relative to that in bulk. At higher temperatures, the
sponge-like microstructure of IL may be destroyed as a result of thermal
fluctuations, therefore all diffusion coefficients, D , D and D0, merge and
self-diffusion of ions in ILs becomes isotropic as in ordinary isotropic liquids.
Therefore, we studied the self-diffusion of the [P6,6,6,14]+ cation in three ionic
liquids containing a phosphonium [P6,6,6,14]+ cation and orthoborate anions:
bis(mandelato)borate ([BMB]-), bis(salicilato)borate ([BScB]-) or
bis(oxalato)borate ([BOB]-) by 1H NMR pulsed field gradient techniques
between glass plates with a spacing near 3.5 14 μm. For the first time, we
observed the anisotropy of diffusion in this specific type of micrometer-scale
confinement. Diffusion accelerated near the non-polar, while it decelerated
near the polar surface. Effects observed in this study may be explained as a
rearrangement of the microstructure, compared to the ionic liquids in bulk, to a
more layered structure in the two-dimensional space between the glass plates.
4.3 Diffusion of phosphonium BScB ionic liquid in mesopores of Vycor
Porous Vycor glass is suggested as a typical mesoporous material. The pore
space of Vycor is formed by a process of spinodal decomposition of a boron-
rich phase, which is then chemically etched out. This results in a random,
interconnected pore space [136,137]. Mean pore diameter is 4 nm. Besides
pore diameter, another parameter that characterises the pores is the chord
length. Chords are defined by the intersection of lines with the two-phase
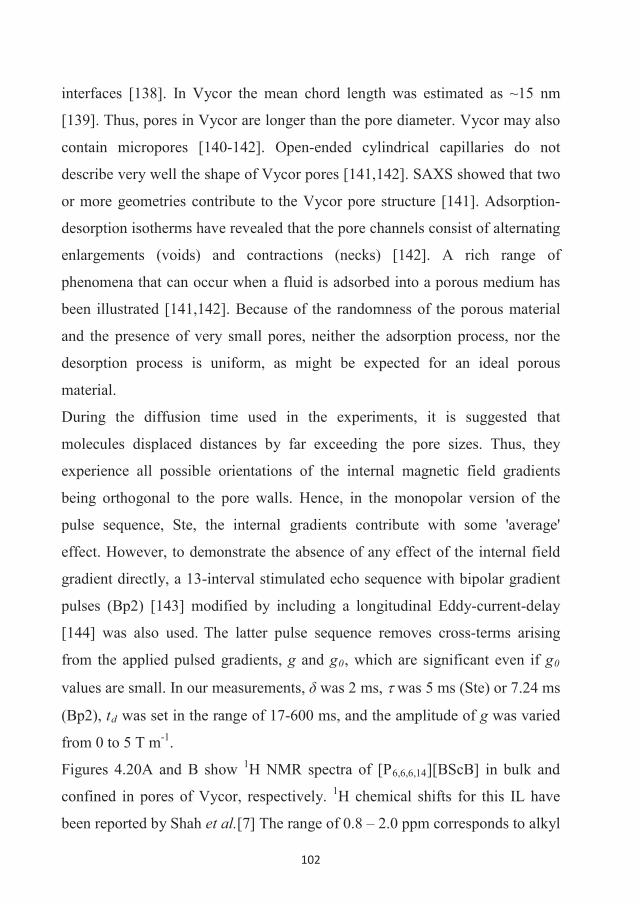
102
interfaces [138]. In Vycor the mean chord length was estimated as ~15 nm
[139]. Thus, pores in Vycor are longer than the pore diameter. Vycor may also
contain micropores [140-142]. Open-ended cylindrical capillaries do not
describe very well the shape of Vycor pores [141,142]. SAXS showed that two
or more geometries contribute to the Vycor pore structure [141]. Adsorption-
desorption isotherms have revealed that the pore channels consist of alternating
enlargements (voids) and contractions (necks) [142]. A rich range of
phenomena that can occur when a fluid is adsorbed into a porous medium has
been illustrated [141,142]. Because of the randomness of the porous material
and the presence of very small pores, neither the adsorption process, nor the
desorption process is uniform, as might be expected for an ideal porous
material.
During the diffusion time used in the experiments, it is suggested that
molecules displaced distances by far exceeding the pore sizes. Thus, they
experience all possible orientations of the internal magnetic field gradients
being orthogonal to the pore walls. Hence, in the monopolar version of the
pulse sequence, Ste, the internal gradients contribute with some 'average'
effect. However, to demonstrate the absence of any effect of the internal field
gradient directly, a 13-interval stimulated echo sequence with bipolar gradient
pulses (Bp2) [143] modified by including a longitudinal Eddy-current-delay
[144] was also used. The latter pulse sequence removes cross-terms arising
from the applied pulsed gradients, g and g0, which are significant even if g0
values are small. In our measurements, was 2 ms, was 5 ms (Ste) or 7.24 ms
(Bp2), td was set in the range of 17-600 ms, and the amplitude of g was varied
from 0 to 5 T m-1.
Figures 4.20A and B show 1H NMR spectra of [P6,6,6,14][BScB] in bulk and
confined in pores of Vycor, respectively. 1H chemical shifts for this IL have
been reported by Shah et al.[7] The range of 0.8 – 2.0 ppm corresponds to alkyl
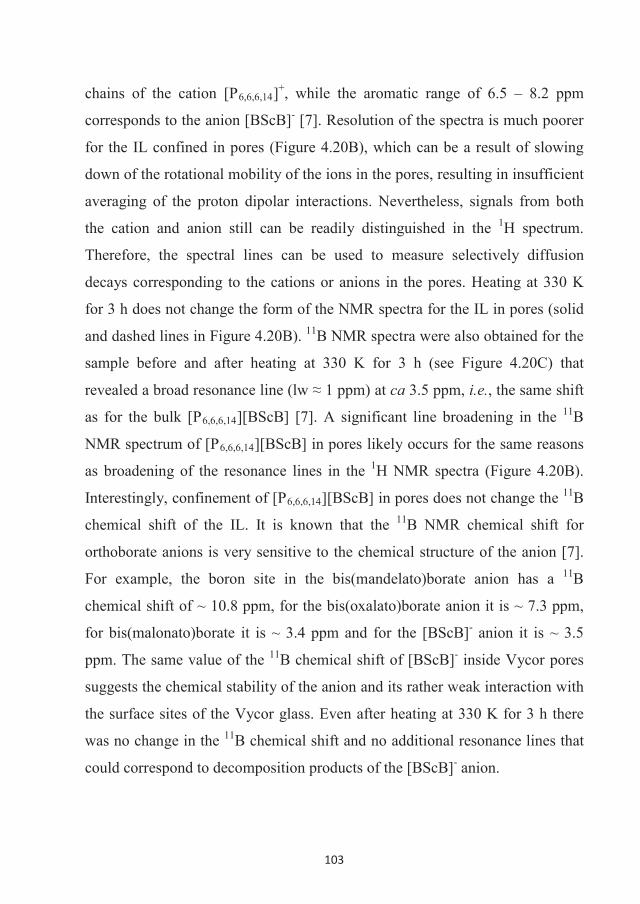
103
chains of the cation [P6,6,6,14]+, while the aromatic range of 6.5 – 8.2 ppm
corresponds to the anion [BScB]- [7]. Resolution of the spectra is much poorer
for the IL confined in pores (Figure 4.20B), which can be a result of slowing
down of the rotational mobility of the ions in the pores, resulting in insufficient
averaging of the proton dipolar interactions. Nevertheless, signals from both
the cation and anion still can be readily distinguished in the 1H spectrum.
Therefore, the spectral lines can be used to measure selectively diffusion
decays corresponding to the cations or anions in the pores. Heating at 330 K
for 3 h does not change the form of the NMR spectra for the IL in pores (solid
and dashed lines in Figure 4.20B). 11B NMR spectra were also obtained for the
sample before and after heating at 330 K for 3 h (see Figure 4.20C) that
ca 3.5 ppm, i.e., the same shift
as for the bulk [P6,6,6,14][BScB] [7]. A significant line broadening in the 11B
NMR spectrum of [P6,6,6,14][BScB] in pores likely occurs for the same reasons
as broadening of the resonance lines in the 1H NMR spectra (Figure 4.20B).
Interestingly, confinement of [P6,6,6,14][BScB] in pores does not change the 11B
chemical shift of the IL. It is known that the 11B NMR chemical shift for
orthoborate anions is very sensitive to the chemical structure of the anion [7].
For example, the boron site in the bis(mandelato)borate anion has a 11B
chemical shift of ~ 10.8 ppm, for the bis(oxalato)borate anion it is ~ 7.3 ppm,
for bis(malonato)borate it is ~ 3.4 ppm and for the [BScB]- anion it is ~ 3.5
ppm. The same value of the 11B chemical shift of [BScB]- inside Vycor pores
suggests the chemical stability of the anion and its rather weak interaction with
the surface sites of the Vycor glass. Even after heating at 330 K for 3 h there
was no change in the 11B chemical shift and no additional resonance lines that
could correspond to decomposition products of the [BScB]- anion.
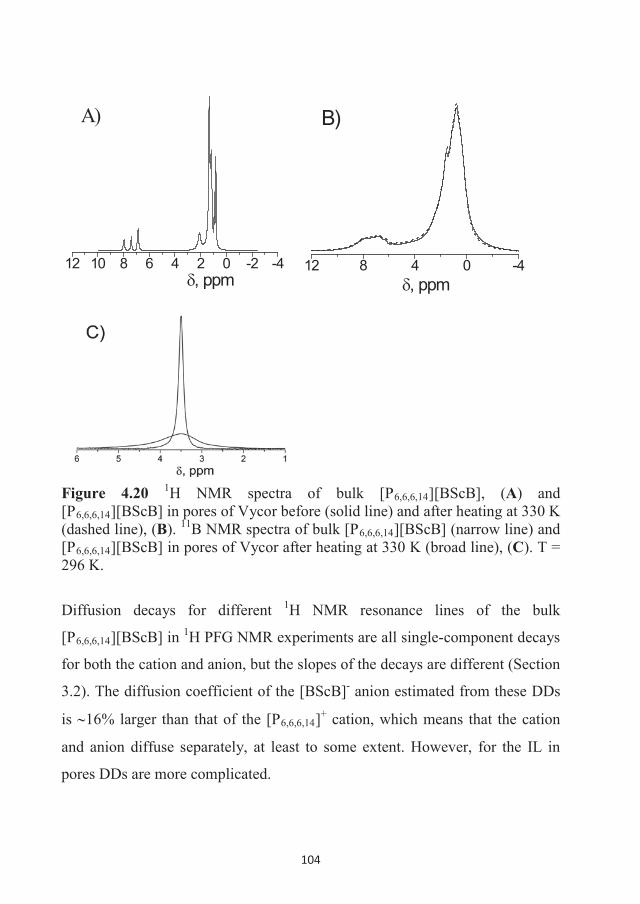
104
12 10 8 6 4 2 0 -2 -4, ppm
A)
12 8 4 0 -4, ppm
B)
Figure 4.20 1H NMR spectra of bulk [P6,6,6,14][BScB], (A) and [P6,6,6,14][BScB] in pores of Vycor before (solid line) and after heating at 330 K (dashed line), (B). 11B NMR spectra of bulk [P6,6,6,14][BScB] (narrow line) and [P6,6,6,14][BScB] in pores of Vycor after heating at 330 K (broad line), (C). T = 296 K.
Diffusion decays for different 1H NMR resonance lines of the bulk
[P6,6,6,14][BScB] in 1H PFG NMR experiments are all single-component decays
for both the cation and anion, but the slopes of the decays are different (Section
3.2). The diffusion coefficient of the [BScB]- anion estimated from these DDs
is 16% larger than that of the [P6,6,6,14]+ cation, which means that the cation
and anion diffuse separately, at least to some extent. However, for the IL in
pores DDs are more complicated.
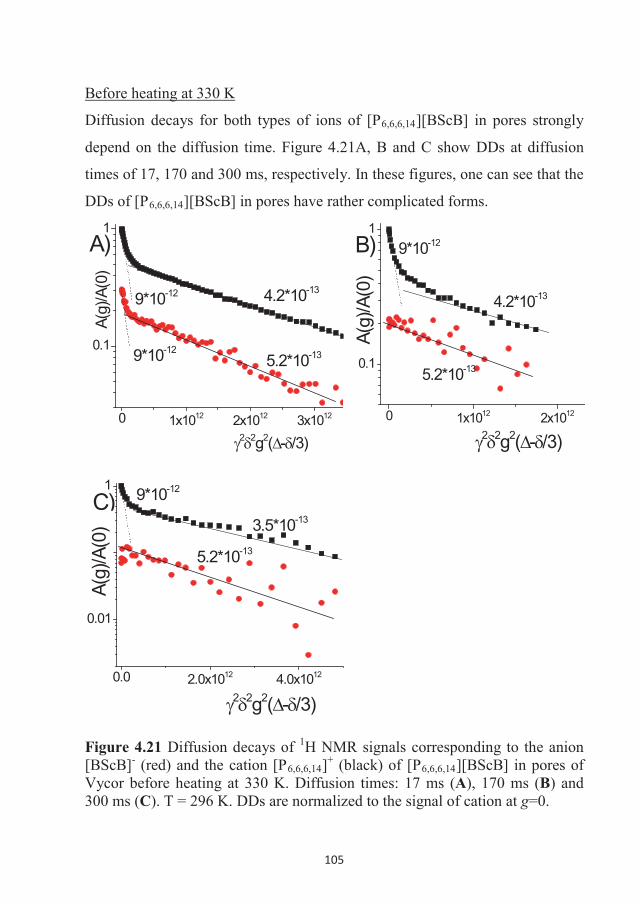
105
Before heating at 330 K
Diffusion decays for both types of ions of [P6,6,6,14][BScB] in pores strongly
depend on the diffusion time. Figure 4.21A, B and C show DDs at diffusion
times of 17, 170 and 300 ms, respectively. In these figures, one can see that the
DDs of [P6,6,6,14][BScB] in pores have rather complicated forms.
0 1x10¹² 2x10¹² 3x10¹²
0.1
1
2 2g2( - /3)
9*10-12
4.2*10-13
5.2*10-13
9*10-12
A)
A(g)
/A(0
)
0 1x10¹² 2x10¹²
0.1
1
2 2g2( - /3)
A(g)
/A(0
)
4.2*10-13
B) 9*10-12
5.2*10-13
0.0 2.0x10¹² 4.0x10¹²
0.01
0.1
1 9*10-12
5.2*10-13
C)
A(g)
/A(0
)
2 2g2( - /3)
3.5*10-13
Figure 4.21 Diffusion decays of 1H NMR signals corresponding to the anion [BScB]- (red) and the cation [P6,6,6,14]+ (black) of [P6,6,6,14][BScB] in pores of Vycor before heating at 330 K. Diffusion times: 17 ms (A), 170 ms (B) and 300 ms (C). T = 296 K. DDs are normalized to the signal of cation at g=0.
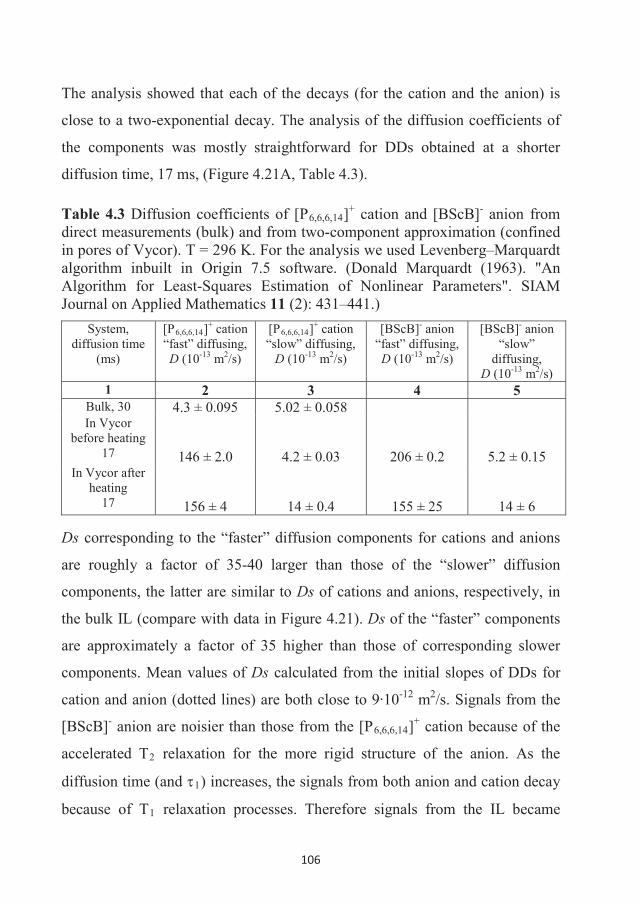
106
The analysis showed that each of the decays (for the cation and the anion) is
close to a two-exponential decay. The analysis of the diffusion coefficients of
the components was mostly straightforward for DDs obtained at a shorter
diffusion time, 17 ms, (Figure 4.21A, Table 4.3).
Table 4.3 Diffusion coefficients of [P6,6,6,14]+ cation and [BScB]- anion from direct measurements (bulk) and from two-component approximation (confined in pores of Vycor). T = 296 K. For the analysis we used Levenberg–Marquardt algorithm inbuilt in Origin 7.5 software. (Donald Marquardt (1963). "An Algorithm for Least-Squares Estimation of Nonlinear Parameters". SIAM Journal on Applied Mathematics 11 (2): 431–441.)
System, diffusion time
(ms)
[P6,6,6,14]+ cation “fast” diffusing,D (10-13 m2/s)
[P6,6,6,14]+ cation “slow” diffusing,
D (10-13 m2/s)
[BScB]- anion “fast” diffusing,D (10-13 m2/s)
[BScB]- anion “slow”
diffusing,D (10-13 m2/s)
1 2 3 4 5Bulk, 30 4.3 ± 0.095 5.02 ± 0.058In Vycor
before heating17 146 ± 2.0 4.2 ± 0.03 206 ± 0.2 5.2 ± 0.15
In Vycor after heating
17 156 ± 4 14 ± 0.4 155 ± 25 14 ± 6
Ds corresponding to the “faster” diffusion components for cations and anions
are roughly a factor of 35-40 larger than those of the “slower” diffusion
components, the latter are similar to Ds of cations and anions, respectively, in
the bulk IL (compare with data in Figure 4.21). Ds of the “faster” components
are approximately a factor of 35 higher than those of corresponding slower
components. Mean values of Ds calculated from the initial slopes of DDs for
cation and anion (dotte -12 m2/s. Signals from the
[BScB]- anion are noisier than those from the [P6,6,6,14]+ cation because of the
accelerated T2 relaxation for the more rigid structure of the anion. As the
diffusion time (and 1) increases, the signals from both anion and cation decay
because of T1 relaxation processes. Therefore signals from the IL became
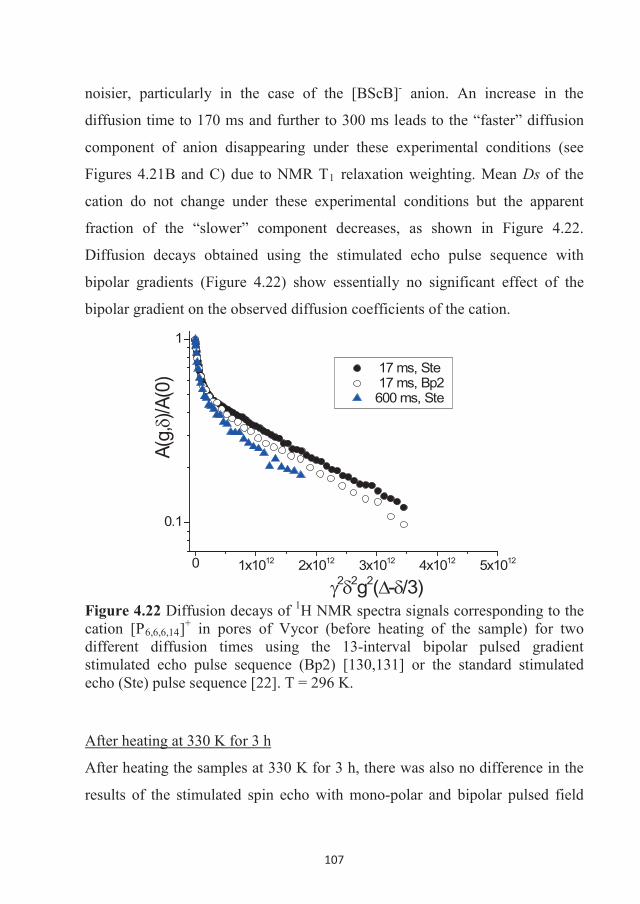
107
noisier, particularly in the case of the [BScB]- anion. An increase in the
diffusion time to 170 ms and further to 300 ms leads to the “faster” diffusion
component of anion disappearing under these experimental conditions (see
Figures 4.21B and C) due to NMR T1 relaxation weighting. Mean Ds of the
cation do not change under these experimental conditions but the apparent
fraction of the “slower” component decreases, as shown in Figure 4.22.
Diffusion decays obtained using the stimulated echo pulse sequence with
bipolar gradients (Figure 4.22) show essentially no significant effect of the
bipolar gradient on the observed diffusion coefficients of the cation.
0 1x10¹² 2x10¹² 3x10¹² 4x10¹² 5x10¹²
0.1
1
A(g,
)/A(0
)
2 2g2( - /3)
17 ms, Ste 17 ms, Bp2 600 ms, Ste
Figure 4.22 Diffusion decays of 1H NMR spectra signals corresponding to the cation [P6,6,6,14]+ in pores of Vycor (before heating of the sample) for two different diffusion times using the 13-interval bipolar pulsed gradient stimulated echo pulse sequence (Bp2) [130,131] or the standard stimulated echo (Ste) pulse sequence [22]. T = 296 K.
After heating at 330 K for 3 h
After heating the samples at 330 K for 3 h, there was also no difference in the
results of the stimulated spin echo with mono-polar and bipolar pulsed field
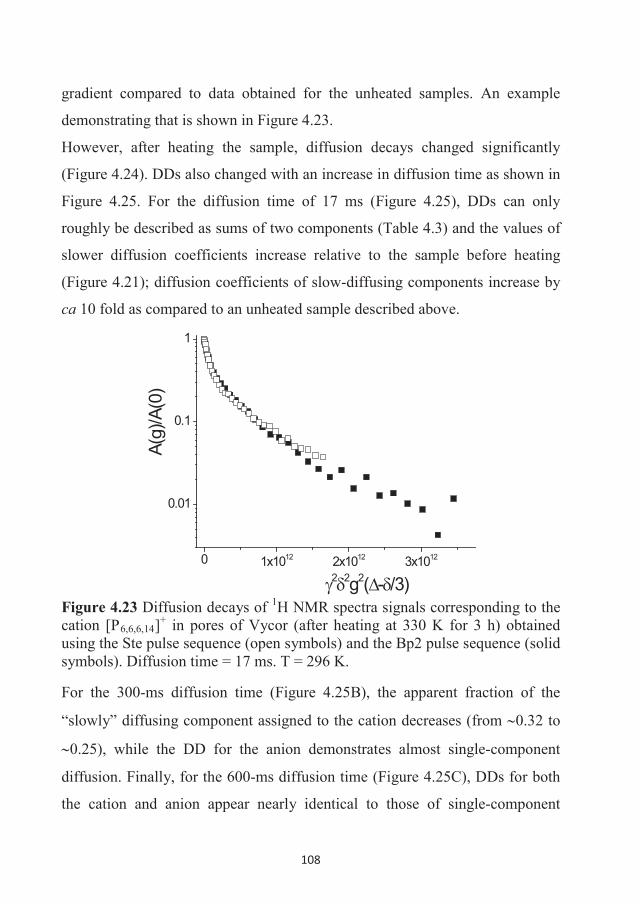
108
gradient compared to data obtained for the unheated samples. An example
demonstrating that is shown in Figure 4.23.
However, after heating the sample, diffusion decays changed significantly
(Figure 4.24). DDs also changed with an increase in diffusion time as shown in
Figure 4.25. For the diffusion time of 17 ms (Figure 4.25), DDs can only
roughly be described as sums of two components (Table 4.3) and the values of
slower diffusion coefficients increase relative to the sample before heating
(Figure 4.21); diffusion coefficients of slow-diffusing components increase by
ca 10 fold as compared to an unheated sample described above.
0 1x10¹² 2x10¹² 3x10¹²
0.01
0.1
1
A(g)
/A(0
)
2 2g2( - /3) Figure 4.23 Diffusion decays of 1H NMR spectra signals corresponding to the cation [P6,6,6,14]+ in pores of Vycor (after heating at 330 K for 3 h) obtained using the Ste pulse sequence (open symbols) and the Bp2 pulse sequence (solid symbols). Diffusion time = 17 ms. T = 296 K.
For the 300-ms diffusion time (Figure 4.25B), the apparent fraction of the
“slowly” diffusing component assigned to the cation decreases (from 0.32 to
0.25), while the DD for the anion demonstrates almost single-component
diffusion. Finally, for the 600-ms diffusion time (Figure 4.25C), DDs for both
the cation and anion appear nearly identical to those of single-component
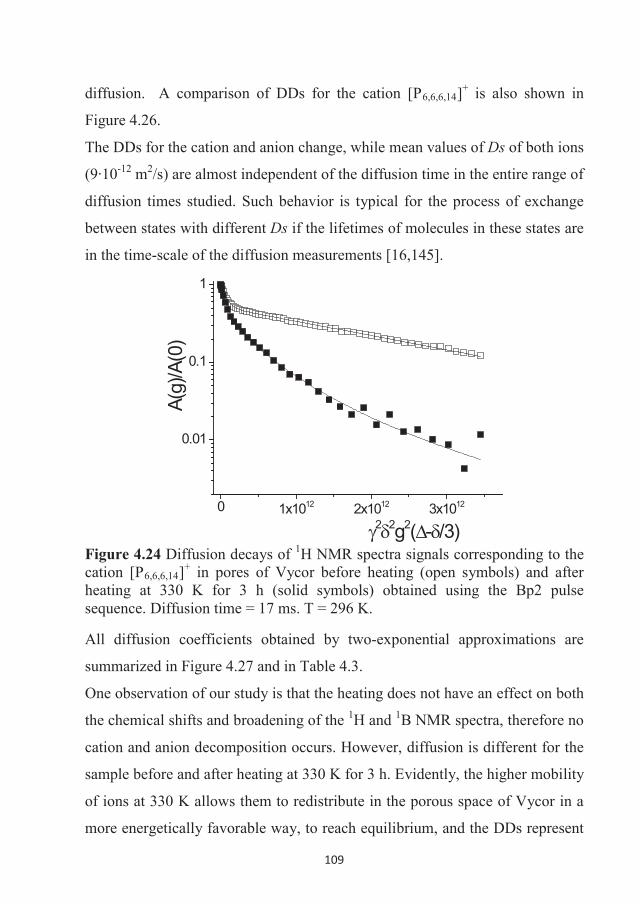
109
diffusion. A comparison of DDs for the cation [P6,6,6,14]+ is also shown in
Figure 4.26.
The DDs for the cation and anion change, while mean values of Ds of both ions -12 m2/s) are almost independent of the diffusion time in the entire range of
diffusion times studied. Such behavior is typical for the process of exchange
between states with different Ds if the lifetimes of molecules in these states are
in the time-scale of the diffusion measurements [16,145].
0 1x10¹² 2x10¹² 3x10¹²
0.01
0.1
1
A(g)
/A(0
)
2 2g2( - /3) Figure 4.24 Diffusion decays of 1H NMR spectra signals corresponding to the cation [P6,6,6,14]+ in pores of Vycor before heating (open symbols) and after heating at 330 K for 3 h (solid symbols) obtained using the Bp2 pulse sequence. Diffusion time = 17 ms. T = 296 K.
All diffusion coefficients obtained by two-exponential approximations are
summarized in Figure 4.27 and in Table 4.3.
One observation of our study is that the heating does not have an effect on both
the chemical shifts and broadening of the 1H and 1B NMR spectra, therefore no
cation and anion decomposition occurs. However, diffusion is different for the
sample before and after heating at 330 K for 3 h. Evidently, the higher mobility
of ions at 330 K allows them to redistribute in the porous space of Vycor in a
more energetically favorable way, to reach equilibrium, and the DDs represent
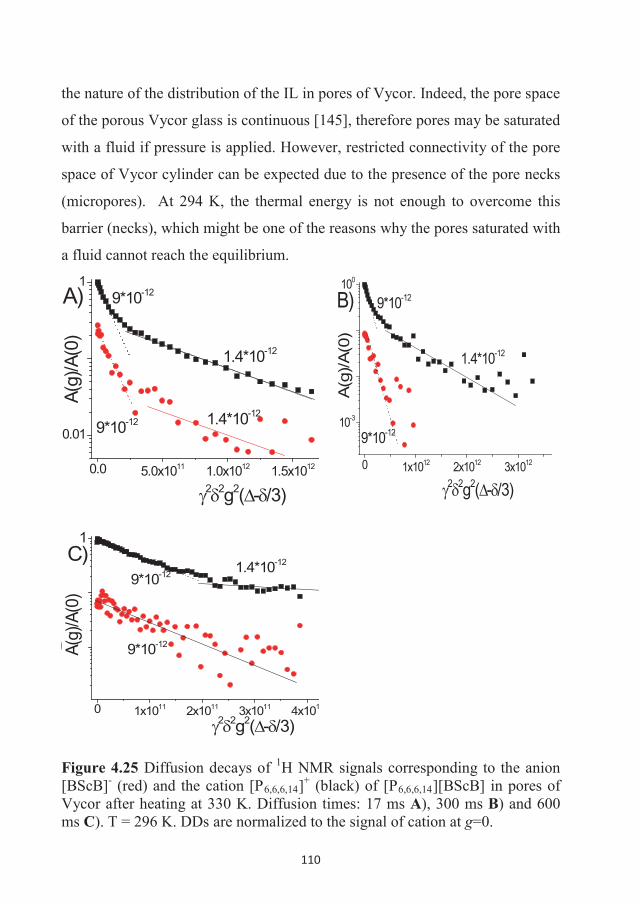
110
the nature of the distribution of the IL in pores of Vycor. Indeed, the pore space
of the porous Vycor glass is continuous [145], therefore pores may be saturated
with a fluid if pressure is applied. However, restricted connectivity of the pore
space of Vycor cylinder can be expected due to the presence of the pore necks
(micropores). At 294 K, the thermal energy is not enough to overcome this
barrier (necks), which might be one of the reasons why the pores saturated with
a fluid cannot reach the equilibrium.
0.0 5.0x10¹¹ 1.0x10¹² 1.5x10¹²
0.01
0.1
1
2 2g2( - /3)
1.4*10-12
1.4*10-12
9*10-12
9*10-12A)
A(g)
/A(0
)
0 1x10¹² 2x10¹² 3x10¹²
10-3
10-2
10-1
100
2 2g2( - /3)
A(g
)/A(0
)1.4*10-12
9*10-12B)
9*10-12
0 1x10¹¹ 2x10¹¹ 3x10¹¹ 4x101
0.01
0.1
1
A(g)
/A(0
)
1.4*10-12
9*10-12
9*10-12
C)
2 2g2( - /3)
Figure 4.25 Diffusion decays of 1H NMR signals corresponding to the anion [BScB]- (red) and the cation [P6,6,6,14]+ (black) of [P6,6,6,14][BScB] in pores of Vycor after heating at 330 K. Diffusion times: 17 ms A), 300 ms B) and 600 ms C). T = 296 K. DDs are normalized to the signal of cation at g=0.
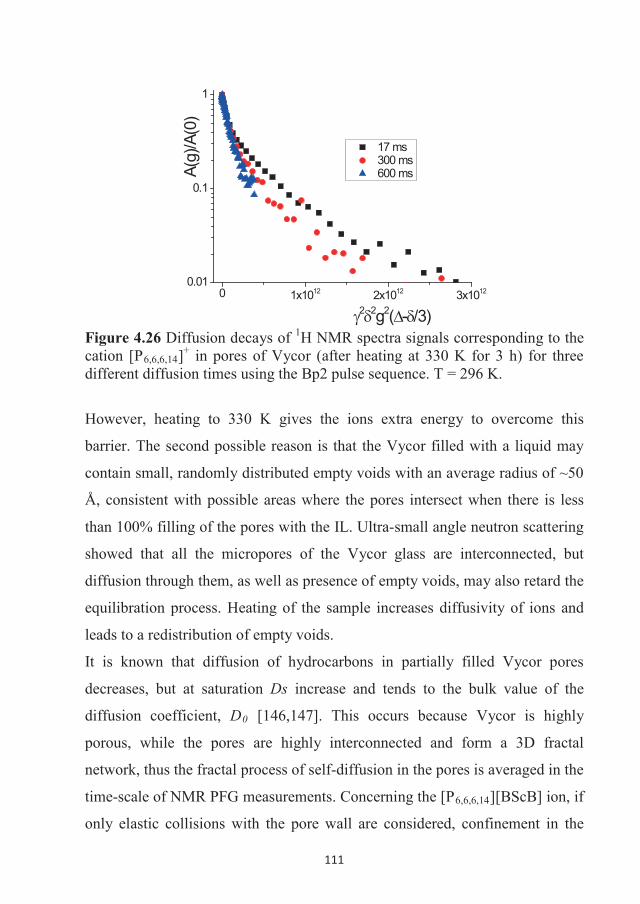
111
0 1x10¹² 2x10¹² 3x10120.01
0.1
1
A(g)
/A(0
)
2 2g2( - /3)
17 ms 300 ms 600 ms
Figure 4.26 Diffusion decays of 1H NMR spectra signals corresponding to the cation [P6,6,6,14]+ in pores of Vycor (after heating at 330 K for 3 h) for three different diffusion times using the Bp2 pulse sequence. T = 296 K.
However, heating to 330 K gives the ions extra energy to overcome this
barrier. The second possible reason is that the Vycor filled with a liquid may
contain small, randomly distributed empty voids with an average radius of ~50
Å, consistent with possible areas where the pores intersect when there is less
than 100% filling of the pores with the IL. Ultra-small angle neutron scattering
showed that all the micropores of the Vycor glass are interconnected, but
diffusion through them, as well as presence of empty voids, may also retard the
equilibration process. Heating of the sample increases diffusivity of ions and
leads to a redistribution of empty voids.
It is known that diffusion of hydrocarbons in partially filled Vycor pores
decreases, but at saturation Ds increase and tends to the bulk value of the
diffusion coefficient, D0 [146,147]. This occurs because Vycor is highly
porous, while the pores are highly interconnected and form a 3D fractal
network, thus the fractal process of self-diffusion in the pores is averaged in the
time-scale of NMR PFG measurements. Concerning the [P6,6,6,14][BScB] ion, if
only elastic collisions with the pore wall are considered, confinement in the
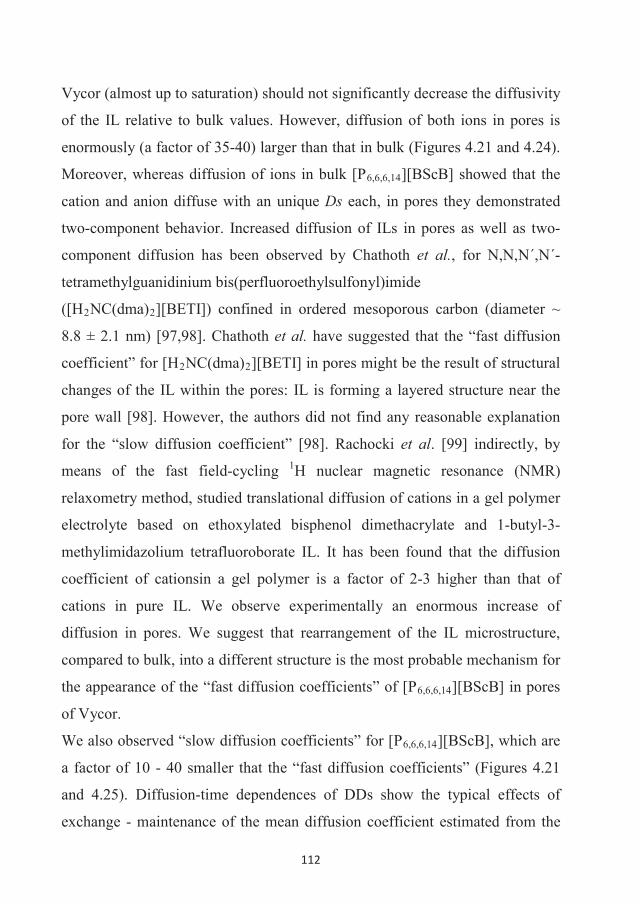
112
Vycor (almost up to saturation) should not significantly decrease the diffusivity
of the IL relative to bulk values. However, diffusion of both ions in pores is
enormously (a factor of 35-40) larger than that in bulk (Figures 4.21 and 4.24).
Moreover, whereas diffusion of ions in bulk [P6,6,6,14][BScB] showed that the
cation and anion diffuse with an unique Ds each, in pores they demonstrated
two-component behavior. Increased diffusion of ILs in pores as well as two-
component diffusion has been observed by Chathoth et al., for N,N,N´,N´-
tetramethylguanidinium bis(perfluoroethylsulfonyl)imide
([H2NC(dma)2][BETI]) confined in ordered mesoporous carbon (diameter ~
8.8 ± 2.1 nm) [97,98]. Chathoth et al. have suggested that the “fast diffusion
coefficient” for [H2NC(dma)2][BETI] in pores might be the result of structural
changes of the IL within the pores: IL is forming a layered structure near the
pore wall [98]. However, the authors did not find any reasonable explanation
for the “slow diffusion coefficient” [98]. Rachocki et al. [99] indirectly, by
means of the fast field-cycling 1H nuclear magnetic resonance (NMR)
relaxometry method, studied translational diffusion of cations in a gel polymer
electrolyte based on ethoxylated bisphenol dimethacrylate and 1-butyl-3-
methylimidazolium tetrafluoroborate IL. It has been found that the diffusion
coefficient of cationsin a gel polymer is a factor of 2-3 higher than that of
cations in pure IL. We observe experimentally an enormous increase of
diffusion in pores. We suggest that rearrangement of the IL microstructure,
compared to bulk, into a different structure is the most probable mechanism for
the appearance of the “fast diffusion coefficients” of [P6,6,6,14][BScB] in pores
of Vycor.
We also observed “slow diffusion coefficients” for [P6,6,6,14][BScB], which are
a factor of 10 - 40 smaller that the “fast diffusion coefficients” (Figures 4.21
and 4.25). Diffusion-time dependences of DDs show the typical effects of
exchange - maintenance of the mean diffusion coefficient estimated from the
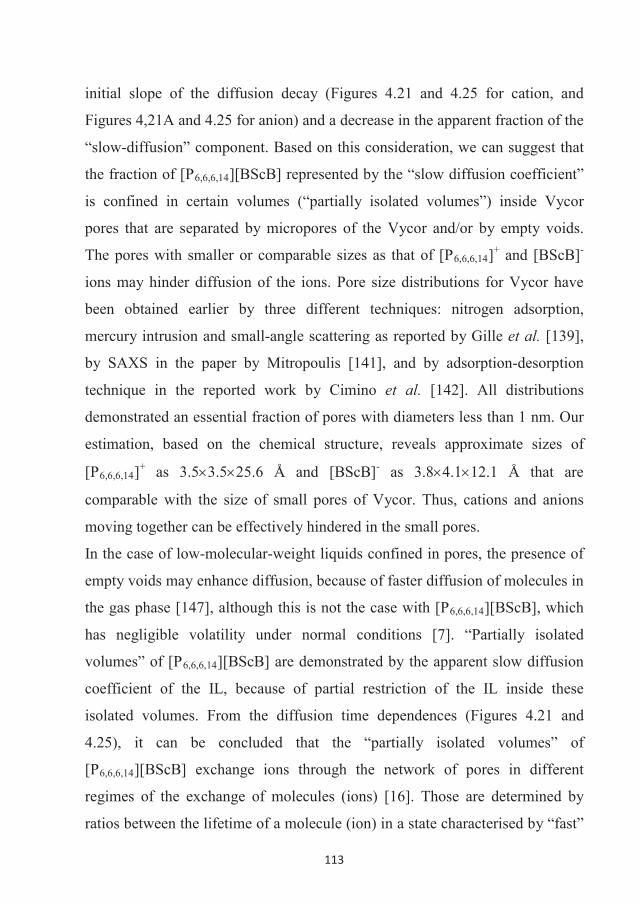
113
initial slope of the diffusion decay (Figures 4.21 and 4.25 for cation, and
Figures 4,21A and 4.25 for anion) and a decrease in the apparent fraction of the
“slow-diffusion” component. Based on this consideration, we can suggest that
the fraction of [P6,6,6,14][BScB] represented by the “slow diffusion coefficient”
is confined in certain volumes (“partially isolated volumes”) inside Vycor
pores that are separated by micropores of the Vycor and/or by empty voids.
The pores with smaller or comparable sizes as that of [P6,6,6,14]+ and [BScB]-
ions may hinder diffusion of the ions. Pore size distributions for Vycor have
been obtained earlier by three different techniques: nitrogen adsorption,
mercury intrusion and small-angle scattering as reported by Gille et al. [139],
by SAXS in the paper by Mitropoulis [141], and by adsorption-desorption
technique in the reported work by Cimino et al. [142]. All distributions
demonstrated an essential fraction of pores with diameters less than 1 nm. Our
estimation, based on the chemical structure, reveals approximate sizes of
[P6,6,6,14]+ as 3.5 3.5 25.6 Å and [BScB]- as 3.8 4.1 12.1 Å that are
comparable with the size of small pores of Vycor. Thus, cations and anions
moving together can be effectively hindered in the small pores.
In the case of low-molecular-weight liquids confined in pores, the presence of
empty voids may enhance diffusion, because of faster diffusion of molecules in
the gas phase [147], although this is not the case with [P6,6,6,14][BScB], which
has negligible volatility under normal conditions [7]. “Partially isolated
volumes” of [P6,6,6,14][BScB] are demonstrated by the apparent slow diffusion
coefficient of the IL, because of partial restriction of the IL inside these
isolated volumes. From the diffusion time dependences (Figures 4.21 and
4.25), it can be concluded that the “partially isolated volumes” of
[P6,6,6,14][BScB] exchange ions through the network of pores in different
regimes of the exchange of molecules (ions) [16]. Those are determined by
ratios between the lifetime of a molecule (ion) in a state characterised by “fast”
114
or “slow” diffusion coefficients and the diffusion time (td) of the NMR
diffusion experiment. For [P6,6,6,14]+ in the sample before heating and in the
range of diffusion time from 17 to 300 ms, there is a “slow exchange” regime
where DD maintains its complex form in the entire range of td. For [BScB]-,
the “fast diffusion coefficient” is observed only at 17 ms, but disappears at
longer diffusion times, most probably because of the short T1 NMR relaxation
of [BScB]- protons due to absorption in the micropores. The “slow diffusion
coefficient” of the anion is comparable with that of the cation in the whole
range of 17 - 170 ms (Figures 4.21A and 4.21B) and corresponds to diffusion
in “partially isolated volumes” of pores. Thus, the anion also diffuses in pores
in the “slow exchange” regime. After heating at 330 K, redistribution of the IL
leads to a change of the diffusion regime. Now the DD for [P6,6,6,14]+ and
[BScB]- continuously changes from two-exponential (Figure 4.25A) to single-
exponential (Figures 4.25B and 4.25C), so the cation and anion diffuse in pores
between different volumes in the “intermediate exchange” regime. Therefore,
redistribution of the IL as a result of heating facilitates exchange conditions for
the cation and for the anion.
The time scale for averaging of diffusion is evident from the experimental
DDs, but we can also estimate spatial scales of “partially isolated volumes”,
which are characterized by slow diffusion using Einstein’s relation for the
mean-squared displacement (Eq. (3)). For the cation in the sample before
heating (Ds ~4.2·10-13 m2/s, maximal td = 300 ms), displacement in these
volumes is less than 0.5 μm. No averaging occurs at this scale. After the
heating Ds is ~ 1.7·10-12 m2/s at averaging td ~ 300 ms, therefore displacement,
which is effective for averaging of diffusion in these volumes, is approximately
1 μm.
Confinement in pores of Vycor may provide at least two types of effects for
ions: (i) interaction of ions with silica surfaces, and (ii) confinement of the IL
115
in cylinders with diameters of nearly 40 Å. For the hydrophobic [P6,6,6,14]+ ion,
the interaction with a hydrophilic silica surface may be a short-range and
attractive interaction. Otherwise, the [BScB]- anion with its oxygen groups has
a structure that resembles the catechol molecule [148,149]. Catechol strongly
adheres on silica surfaces by making hydrogen bonds with a hydroxyl and a
phenylene ring contributing to its adhesion [149]. These bonds are reversible
[148], therefore they may fluctuate and adhesion may not stop the diffusion
process. The difference between catechol and [BScB]- is that catechol is a flat
molecule, while [BScB]- is bulky, therefore, the former’s energy of interaction
as well as lifetime of bonding with silica surfaces should be lower. The silica
surface interaction of the anion is suggested to be stronger than that of the
cation, which may explain the decrease in the anion signal in connected thin
pores, “partially isolated volumes”, for a sample before heating (Figures 4.21B,
4.21C).
Some ILs are prone to forming microstructures as a result of microphase
separation in a certain range of temperatures due to competition of electrostatic
and “hydrophobic” interactions [11,32,54,64], which has been confirmed by
NMR diffusion measurements [28]. We suggest that confinement of an IL in
pores, resulting in introducing additional interactions of ions with pores and
restricting microphase volumes, may lead to modification or complete
destruction of the microphase structure present in the bulk IL.
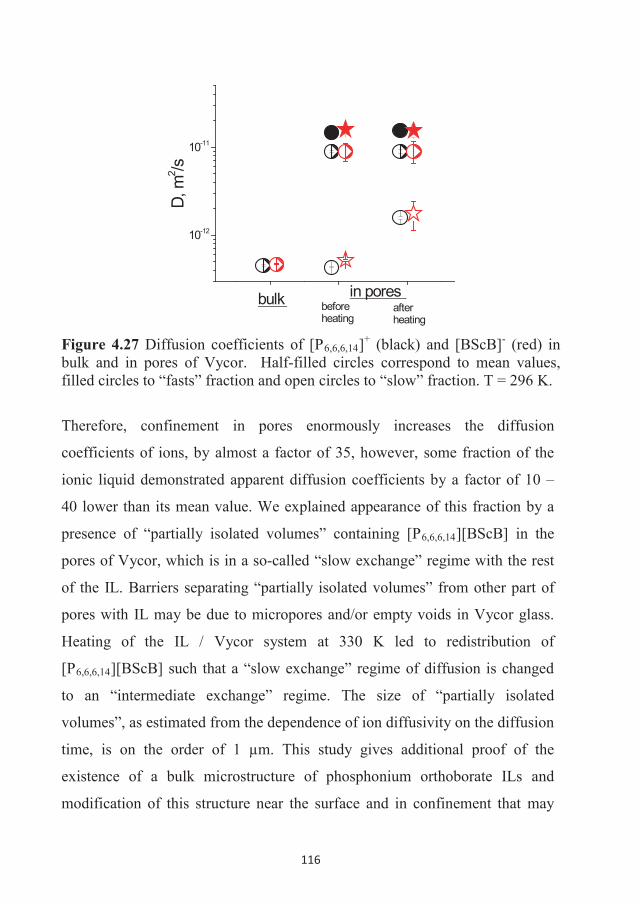
116
10-12
10-11
in poresafterheating
beforeheating
bulk
D, m
2 /s
Figure 4.27 Diffusion coefficients of [P6,6,6,14]+ (black) and [BScB]- (red) in bulk and in pores of Vycor. Half-filled circles correspond to mean values, filled circles to “fasts” fraction and open circles to “slow” fraction. T = 296 K.
Therefore, confinement in pores enormously increases the diffusion
coefficients of ions, by almost a factor of 35, however, some fraction of the
ionic liquid demonstrated apparent diffusion coefficients by a factor of 10 –
40 lower than its mean value. We explained appearance of this fraction by a
presence of “partially isolated volumes” containing [P6,6,6,14][BScB] in the
pores of Vycor, which is in a so-called “slow exchange” regime with the rest
of the IL. Barriers separating “partially isolated volumes” from other part of
pores with IL may be due to micropores and/or empty voids in Vycor glass.
Heating of the IL / Vycor system at 330 K led to redistribution of
[P6,6,6,14][BScB] such that a “slow exchange” regime of diffusion is changed
to an “intermediate exchange” regime. The size of “partially isolated
volumes”, as estimated from the dependence of ion diffusivity on the diffusion
time, is on the order of 1 μm. This study gives additional proof of the
existence of a bulk microstructure of phosphonium orthoborate ILs and
modification of this structure near the surface and in confinement that may
117
influence the lubrication properties of these ILS and their use in other
applications.
Overall conclusions
This thesis is focused on studies of translational dynamics of ionic liquids in
bulk and in confinement. The main classes of systems are:
(i) Neat ILs: ethylammonium nitrate (EAN); phosphonium ortoborates
(bis(mandelato)borate, [P6,6,6,14][BMB], bis(salicilato)borate, [P6,6,6,14][BScB],
bis(oxalato)borate, [P6,6,6,14][BOB]); pyrrilidinium (bis(mandelato)borate,
[CnC1Pyrr][BMB], with n = 4, 5, 6, 7, 8, 10 and 14.
(ii) Mixtures of imidazolium (bis(mandelato)borate, [CnC1Im][BMB] (n = 10
and 12) with polyethylene glycol (technical grade, Mn = 719.3 Da, Mw = 879.6
Da, Mw/Mn 1.22) in the concentration range of ILs 0 ÷ 10 wt.%.
(iii) [P6,6,6,14][BScB] confined in Vycor porous glass (mean pore diameter 4
nm).
(iv) EAN and phosphonium ortoborates ([P6,6,6,14][BMB], [P6,6,6,14][BScB] and
[P6,6,6,14][BOB]) confined between parallel polar and non-polar glass plates
separated by a 3.5 – 14 μm distance.
NMR stimulated echo diffusion decays were obtained and analyzed. Self-
diffusion coefficients, Ds, and activation energies, ED, for diffusion were
calculated. Ds of cations and anions are principally different, but they are quite
close for some systems ([P6,6,6,14][BMB], [P6,6,6,14][BScB], [CnC1Pyrr][BMB],
with n = 4, 5, 6, 7, 8), while Ds for anions are higher by a factor of ~1.7 for
EAN and by a factor of ~2-4 for [P6,6,6,14][BOB]. Changes in the chemical
structure of one of the ions in the series of phosphonium orthoborates with
different anions and in the series of [CnC1Pyrr][BMB] (n = 4÷7 and 8) with
118
different cation chain length leads to a change in its Ds and ED, and at the same
time adjust Ds and the ED for diffusion of the second ion. The same effect was
observed in ILs dissolved in PEG where one of ions strongly interacting with
PEG, pulling with it the second ion.
The comparable values of Ds and equal energies of activation of the diffusion
mean that the diffusion process occurs in a homogeneous “matrix”. Here it is
determined mainly by the probability of appearance of a free volume near an
ion, comparable with the ion size. For smaller size anions the probability is
slightly higher that lead to faster diffusion of ions. The difference in Ds
between cations and anions in EAN, as well as Ds and ED in [P6,6,6,14][BOB]
may be related to inhomogeneity (micro-phase separation of the system),
where the cation and anion diffuse in different micro-phases.
Two-component diffusion for both ions in ([P6,6,6,14][BMB] at the 293 ~323 K
temperature range and in [CnC1Pyrr][BMB] at n = 10 and 14 demonstrate the
presence of two diffusion coefficients, which differ by almost two orders of
magnitude and correspond to the two liquid sub-phases. The driving forces of
this separation for [CnC1Pyrr][BMB] are both electrostatic interactions
between cations and anions and the “hydrophobic” interaction between cation
long alkyl chains. The dependence of IL density on the number of CH2 groups
in the long chain of cations can be described well by a simple additive model,
in which “ionic” and “aliphatic” regions make additive contributions. The
densities in “aliphatic” regions are comparable to those of saturated
hydrocarbons at extremely high pressures (>1850 atm), evidently because of
strong intermolecular electrostatic interactions in the system. This leads to an
infinitesimal free volume of the long alkyl chains of the cations and
independence of diffusion (“slow-diffusing” component) in the cation-
containing phase on the number of CH2 groups in the long alkyl chains of the
119
cations. Effects of ion change, as well as dependences of density on the chain
length can be qualitatively explained by the free-volume theory.
In mixtures of [CnC1Im][BMB] with PEG the anion and cation may be present
in both bound and free states, with exchange between these states occurring in
less than ~30 ms. NMR chemical shift alteration analysis showed that the
imidazolium cation interacts mainly with PEG, which may occur through the
oxygen of PEG and the imidazole ring. The [BMB]- anion does not strongly
interact with PEG, although it may be indirectly affected by PEG, through
interaction with the [CnC1Im]+ cation, which directly interacts with PEG.
Confinement of [P6,6,6,14][BScB] in 4 nm Vycor mesopores enormously
increases the Ds of ions, by almost a factor of 35, which is related to lower
packing of ions in pores. Moreover, the IL demonstrated dynamic
heterogeneity, the presence of apparent Ds by a factor of 10 – 40 lower than its
mean value, which is related to the presence of micropores and empty voids.
Heating of the IL / Vycor system at 330 K led to redistribution of
[P6,6,6,14][BScB].
Confinement between polar and non-polar glass plates modifies diffusion in
EAN and phosphonium orthoborate ILs. For the first time, macroscopic
anisotropy of diffusion in this specific type of micrometer-scale (3.5 – 14 μm)
confinement was observed. The Ds of EAN cation along the plates increases so
much that it may be related with the bulk mobility of the IL at temperatures
higher than the temperature of measurement by 14oC (non-polar glass) and
37oC (polar glass). Ds of orthoborate anions increases between non-polar
glass plates and decreases between polar glass plates. Near the
polytetrafluoroethylene surface, EAN forms a layer with a thickness of ~ 300
nm with reduced diffusion of both ions in the normal direction to the surface.
120
The anisotropy of diffusion was explained by the formation of layers of the IL
between the glass plates or near surfaces, with structure different from the bulk.
Properties of ILs near solid surfaces and in nano-confinements are different
from the bulk properties. The difference depends on the nature of the surfaces.
This might be useful for understanding of lubricating properties of these ILs.
Future work
The key ideas for future work are:
To further investigate both translational and local, bulk dynamics of
ionic liquids, demonstrating the difference in diffusion coefficients by a
factor larger than 1.5 (EAN, [P6,6,6,14][BOB]); to further investigate
their structure; to elucidate the relation between dynamics and
microstructure of the ionic liquids; to study the relation between
dynamic and macroscopic properties of these ionic liquids.
To investigate reasons and detailed mechanisms of liquid-liquid phase
separations in ionic liquids, which was observed in [P6,6,6,14][BMB] and
in [CnC1Pyrr][BMB].
To further investigate mechanisms of dynamic heterogeneities observed
for ionic liquids confined in mesoporous solids.
To study dynamics inside the micrometer-size layers formed between
glass plates and near the PTFE surface.
121
References
[1] C. Zhao, G.T. Burrell, A.A.J. Torriero, F. Separovic, N.F. Dunlop, D.R.
MacFarlane, A.M. Bond, Electrochemistry of room temperature protic ionic
liquids, J. Phys. Chem. B, 113 (2008) 6923-6936.
[2] M. Lazzari, M. Mastragostino, F. Soavi, Capacitance response of carbons in
solvent-free ionic liquid electrolytes, Electrochem. Commun., 9 (2007)
1567-1572.
[3] R.D. Rogers, K.R. Seddon, Ionic liquids - solvents of the future? Science,
302 (2003) 792-793.
[4] J.A. Garlitz, C.A. Summers, R.A. Flowers II, G.E.O. Borgstahl,
Ethylammonium nitrate: a protein crystallization reagent, Acta Cryst. D, 55
(1999) 2037-2038.
[5] F.U. Shah, S. Glavatskih, O.N. Antzutkin, Boron in tribology: from borates
to ionic liquids, Tribol. Lett., 51 (2013) 281-301.
[6] M. Taher, F.U. Shah, A. Filippov, P. de Baets, S. Glavatskih, O.N.
Antzutkin, Halogen-free pyrrolidinium bis(mandelato)borate ionic liquids:
some physicochemical properties and lubrication performance as additives
to polyethylene glycol, RSC Adv., 4 (2014) 30617-30623.
[7] F.U. Shah, S. Glavatskih, D.R. MacFarlane, A. Somers, M. Forsyth, O.N.
Antzutkin, Novel halogen-free chelated orthoborate-phosphonium ionic
liquids: synthesis and tribophysical properties, Phys. Chem. Chem. Phys., 13
(2011) 12865-12873.
[8] M.-D. Bermudez, A.-E. Jimenez, J. Sanes, F.-J. Carrion, Ionic liquids as
advanced lubricant fluids, Molecules, 14 (2009) 2888-2908.
[9] A.E. Somers, P.C. Howlett, D.R. MacFarlane, M. Forsyth, A review of ionic
liquid lubricants, Lubricants, 1 (2013) 3-21.
[10] N.V. Plechkova, K.R. Seddon, Applications of ionic liquids in the chemical
industry, Chem. Soc. Rev., 37 (2008) 123-150.
122
[11] T.L. Greaves, C.J. Drummond,
applications, Chem. Rev., 108 (2008) 206-237.
[12] K. Damodaran, Recent NMR studies of ionic liquids, Annual Reports NMR
Spectrosc., 88 (2016) 215-244.
[13] M. Gouverneur, J. Kopp, L. van Müllen, M. Schönhoff, Direct
determination of ionic transference numbers in ionic liquids by
electrophoretic NMR, Phys. Chem. Chem. Phys., 17 (2015) 30680-30686.
[14] P.T. Callaghan, Principles of Nuclear Magnetic Resonance Microscopy;
Clarendon; Oxford, 1991.
[15] P.T. Callaghan, A. Coy, D. MacGowan, K.J. Packer, F.O. Zelaya,
Diffraction-like effects in NMR diffusion studies of fluids in porous solids,
Nature, 351 (1991) 467-469.
[16] J. Kärger, H. Pfeifer, W. Heink, Principles and Application of Self-diffusion
Measurements by Nuclear Magnetic Resonance, New York: Academic
Press, 12 (1988) 1-89.
[17] P. Atkins, J. de Paula, Atkin’s Physical Chemistry. Oxford University Press.
Tenth Ed., 2014, 1008 p.
[18] A. Noda, K. Hayamizu, M. Watanabe, Pulsed-gradient spin-echo 1H and
19F ionic diffusion coefficient, viscosity, and ionic conductivity of non-
chloroaluminate room-temperature ionic liquids, J. Phys. Chem. B, 105
(2001) 4603-4610.
[19] H. Tokuda, K. Hayamizu, K. Ishii, A.B.H. Susan, M. Watanabe,
Physicochemical properties and structures of room temperature ionic liquids.
2. Variation of alkyl chain length in imidazolium cation, J. Phys. Chem. B,
109 (2005) 6103-6110.
[20] T.-Y. Wu, S.-G. Su, H. P. Wang, Y.-C. Lin, S.-T. Gung, M.-W. Lin, I.-W.
Sun, Electrochemical studies and self-diffusion coefficients in cyclic
ammonium based ionic liquids with allyl substituents, Electrochim. Acta, 56
(2011) 3209-3218.
123
[21] M. Levitt, Spin Dynamics. Basics of Nuclear Magnetic Resonance (2nd Ed);
Wiley & Sons; New York, 2008.
[22] J.E. Tanner, Use of the stimulated echo in NMR diffusion studies, J. Chem.
Phys., 52 (1970) 2523-2526.
[23] P. Stilbs, K. Paulsen, P.C. Griffiths, Global least-squares analysis of large,
correlated spectral data sets: application to component-resolved FT-PGSE
NMR spectroscopy, J. Phys. Chem., 100 (1996) 8180-8189.
[24] G. Orädd, G. Lindblom, Lateral diffusion studied by pulsed field gradient
NMR on oriented lipid membranes, Magn. Reson. Chem., 42 (2004) 123-
131.
[25] W. Price, NMR studies of translational motion, Cambridge University Press,
2009, 393 p.
[26] R. Giernoth, NMR spectroscopy in ionic liquids. Topics Current Chem., 290
(2010) 263-283.
[27] H. Li, In: Structures and interactions of ionic liquids; Zhang, S; Wang, J;
Zhao, Q; and Zhou, Q., Eds.; Springer: Book Series: Structure and Bonding,
151 (2014) 175-193.
[28] A.E. Frise, T. Ichikawa, M. Yoshio, H. Ohno, S.V. Dvinskikh, T. Kato, I.
Furó, Ion conductive behaviour in a confined nanostructure: NMR
observation of self-diffusion in a liquid-crystalline bicontinuous cubic phase,
Chem. Commun., 46 (2010) 728-730.
[29] A. Filippov, F.U. Shah, M. Taher, S. Glavatskih, O.N. Antzutkin, NMR self-
diffusion study of a phosphonium bis(mandelato)borate ionic liquid, Phys.
Chem. Chem. Phys., 15 (2013) 9281-9287.
[30] J.-F. Huang, P.-Y. Chen, I-W. Sun, S.P. Wang, NMR evidence of hydrogen
bond in 1-ethyl-3-methylimidazolium-tetrafluoroborate room temperature
ionic liquid, Spectroscop. Lett., 34 (2001) 591-603.
124
[31] G. Annat, D.R. MacFarlane, M. Forsyth, Transport properties in ionic
liquids and ionic liquis mixtures: the challenges of NMR pulsed field
gradient diffusion measurements, J. Phys. Chem. B, 111 (2007) 9018-9024.
[32] G.L. Burrell, I.M. Burgar, Q. Gong, N.F. Dunlop, F. Separovi , NMR
relaxation and self-diffusion study at high and low magnetic fields of ionic
association in protic ionic liquids, J. Phys. Chem. B, 114 (2010) 11436-
11443.
[33] K. Hayamizu, S. Tsuzuki, S. Seki and Y. Umebayashi, Nuclear magnetic
resonance studies on the rotational and translational motions of ionic liquids
composed of 1-ethyl-3-methylimidazolium cation and
bis(trifluoromethanesulfonyl)amide and bis(fluorosulfonyl)amide anions and
their binary systems including lithium salts, J. Chem. Phys., 135 (2011)
084505-1– 084505-11.
[34] T.G.A. Youngs, J.D. Holbrey, C.L. Mullan, S.E. Norman, M.C. Lagunas, C.
D`Agostino, M.D. Mantle, L.F. Gladden, D.T. Bowron, C. Hardacre,
Neutron diffraction, NMR and molecular dynamics study
of glucose dissolved in theionic liquid 1-ethyl-3-methylimidazolium acetate,
Chem. Sci., 2 (2011) 1594-1605.
[35] K. Hayamizu, S. Tsuzuki, S. Seki, Y. Umebayashi, Multinuclear NMR
studies on translational and rotational motion for two ionic liquids composed
of BF4 anion, J. Phys. Chem. B, 116 (2012) 11284-11291.
[36] P. Judenstein, S. Huet, P. Lesot, Multiscale NMR investigation of
mesogenic ionic liquid electrolytes with strong anisotropic orientational and
diffusional behavior, RSC Adv., 3 (2013) 16604-16611.
[37] C. Herriot, S. Khatun, E.T. Fox, P. Judenstein, M. Armand, W.A.
Henderson, S. Greenbaum, Diffusion coefficients from 13C PGSE NMR
measurements – fluorine-free ionic liquids with the DCTA anion, J. Phys.
Chem. Lett., 3 (2012) 441-444.
125
[38] E.J. Maginn, Molecular simulation of ionic liquids: current status and future
opportunities, J. Phys.: Condens. Matter, 21 (2009) 37311/1-37311/17.
[39] J.R. Sangoro, C. Iacob, S. Naumov, R. Valiullin, H. Rexhausen, J. Hunger,
R. Buchner, V. Strehmel, J. Kärger, F. Kremer, Diffusion in ionic liquids:
the interplay between molecular structure and dynamics, Soft Matter, 7
(2011) 1678-1681.
[40] H. Tokuda, K. Hayamizu, K. Ishii, A.B.H. Susan, M. Watanabe,
Physicochemical properties and structures of room temperature ionic liquids.
1. Variation of anionic species, J. Phys. Chem. B, 108 (2004) 16593-16600.
[41] H. Tokuda, K. Ishii, A.B.H. Susan, S. Tsuzuki, K. Hayamizu, M. Watanabe,
Physicochemical properties and structures of room temperature ionic liquids.
3. Variation of cationic structures, J. Phys. Chem. B, 110 (2006) 2833-2839.
[42] H. Tokuda, S. Tsuzuki, A.B.H. Susan, K. Hayamizu, M. Watanabe, How
ionic are room-temperature ionic liquids? An indicator of the
physicochemical properties, J. Phys. Chem. B, 110 (2006) 19593-19600.
[43] A. Menjoge, J. Dixon, J.F. Brennecke, E.J. Maginn, S. Vasenkov, Influence
of water on diffusion in imidazolium-based ionic liquids: a pulsed field
gradient NMR study, J. Phys. Chem. B, 113 (2009) 6353-6359.
[44] M. Klähn, A. Seduraman, P. Wu, A model for self-diffusion of guanidinium-
based ionic liquids: a molecular simulation study, J. Phys. Chem. B, 112
(2008) 13849-13861.
[45] A.E. Bradley, C. Hardacre, J.D. Holbrey, S. Johnston, S.E.J. McMath, M.
Nieuwenhuyzen, Small-angle X-ray scattering studies of liquid crystalline 1-
alkyl-3-methylimidazolium salt, Chem. Mater., 14 (2002) 629-635.
[46] B.L. Bhargava, R. Devane, M.L. Klein, S. Balasubramanian, Dynamics in a
room-temperature ionic liquid: A computer simulation study of 1, 3-
dimethylimidazolium chloride, Soft Matter, 3 (2007) 1395-1400.
126
[47] M. Blesic, J.N.C. Lopes, M.F.C. Gomes, L.P.N. Rebelo, Solubility of
alkanes, alkanols and their fluorinated counterparts in
tetraalkylphosphonium ionic liquids, Phys. Chem. Chem. Phys., 12 (2010)
9685-9692.
[48] E.W. Castner, J.F. Wishart, Spotlight of ionic liquids, J. Chem. Phys., 132
(2010) 120901.
[49] C.L. Hussey, I.-W. Sun, S.K.D. Strubinger, P.A. Barnard, Some
observations about the diffusion coefficients of anionic transition-metal
halide-complexes in room-temperature haloaluminate ionic liquids, J.
Electrochem. Soc., 137 (1990) 2515-2516.
[50] T.M. Alam, D.R. Dreyer, C.W. Bielawski, R.S. Ruoff, Combined
measurements of translational and rotational diffusion in quaternary acyclic
ammonium and cyclic pyrrolidinium ionic liquids, J. Phys Chem. B, 117
(2013) 1967-1977.
[51] F. Castiglione, M. Moreno, G. Raos, A. Famulari, A. Mele, G.B.
Appetecchi, S. Passerini, Structural organization and transport properties of
novel pyrrolidinium-based ionic liquids with perfluoroalkyl sulfonylimide
anions, J. Phys. Chem. B, 113 (2009) 10750-10759.
[52] E.W. Castner, C.J. Margulis, M. Maroncelli, J.F. Wishard, Ionic liquids:
structure and photochemical reactivity, Annu. Rev. Phys. Chem., 62 (2011)
85-105.
[53] H. Weingaertner, Understanding ionic liquids at the molecular level: facts,
problems, and controversies, Angew. Chem. Int. Ed., 47 (2008) 654-670.
[54] O. Russina, A. Triolo, L. Gontrani, R. Caminiti, Mesoscopic structural
heterogeneities in room-temperature ionic liquids, Phys. Chem. Lett., 3
(2011) 27-33.
[55] Y. Wang, W. Jiang, T. Yan, G.A. Voth, Understanding ionic liquids through
atomistic and coarse-grained molecular dynamics simulations, Acc. Chem.
Res., 40 (2007) 1193-1199.
127
[56] E.J. Maginn, Atomistic simulation of the thermodynamic and transport
properties of ionic liquids, Acc. Chem. Res., 40 (2007) 1200-1207.
[57] S.G. Raju, S. Balasubramanian, Emergence of nanoscale order in room
temperature ionic liquids: Simulation of symmetric 1,3-didecylimidazolium
hexafluorophosphate, J. Mater. Chem., 19 (2009) 4343-4347.
[58] O. Russina, A. Triolo, New experimental evidence supporting the
mesoscopic segregation model in room temperature ionic liquids, Faraday
Discuss., 154 (2012) 97-109.
[59] B.L. Bhargava, S. Balasubramanian, M.L. Klein, Modeling room
temperature ionic liquids. Chem. Commun., 19 (2008) 3339-3351.
[60] S. Urahata, M. Ribeiro, Structure of ionic liquids of 1-alkyl-3-
methylimidazolium cations: a systematic computer simulation study, J.
Chem Phys., 120 (2004) 1855-1863.
[61] Y. Wang, G.A. Voth, Unique spatial heterogeneity in ionic liquids, J. Am.
Chem. Soc., 127 (2005) 12192-12193.
[62] J.N.A. Canongia Lopes, A.A.H. Padua, Nanostructural organization in ionic
liquids, J. Phys. Chem. B, 110 (2006) 3330-3335.
[63] Y. Ji, R. Shi, Y. Wang, G. Saielli, Effect of chain length in the structure of
ionic liquids: from spatial heterogeneity to ionic liquid crystals, J. Phys.
Chem. B, 117 (2013) 1104-1109.
[64] K. Shimizu, M.F.C. Gomes, A.A.H. Padua, L.P.N. Rebelo, J.N.C. Lopes,
Three commentaries on the nano-segregated structure of ionic liquids, J.
Mol. Struc., 946 (2010) 70-76.
[65] A. Triolo, O. Russina, H.-J. Bleif, E. Di Cola, Nanoscale segregation in
room temperature ionic liquids, J. Phys. Chem. B, 111 (2007) 4641-4644.
128
[66] O. Russina, A. Triolo, L. Gontrani, R. Caminiti, D. Xiao, L. G. Hines, Jr., R.
A. Bartsch, E.L. Quitevis, N. Pleckhova, K.R. Seddon, Morphology and
intermolecular dynamics of 1-alkyl-3-methylimidazolium
bis{(trifluoromethane)sulfonyl} amide ionic liquids: structural and dynamic
evidence of nanoscale segregation, J. Phys. Condens. Matter, 21 (2009)
424121.
[67] A. Triolo, O. Russina, B. Fazio, G.B. Appetecchi, M. Carewska, S.
Passerini, Nanoscale organization in piperidinium-based room temperature
ionic liquids, J. Chem. Phys., 130 (2009) 164521.
[68] S.S. Sarangi, B.L. Bhargava, S. Balasubramanian, Nanoclusters of room
temperature ionic liquids: a molecular dynamics simulation study, Phys.
Chem. Chem. Phys. 11 (2009) 8745-8751.
[69] R. Atkin, S.Z. El Abedin, R. Hayes, L.H.S. Gasparotto, N. Borisenko, F.
Endress, AFM and STM studies on the surface interaction of [BMP] TFSA
and [EMIm] TFSA ionic liquids with Au(111), J. Phys. Chem. B, 113
(2009) 13266-13272.
[70] R. Hayes, S.Z. El Abedin, R. Atkin, Pronounced structure in confined
aprotic room-temperature ionic liquids, J. Phys. Chem. B, 113 (2009) 7049-
7052.
[71] H.J. Jiang, P.A. FitzGerald, A. Dolan, R. Atkin, G.G. Warr, Amphiphilic
self-assembly of alkanols in protic ionic liquids, J. Phys. Chem. B, 118
(2014) 9983-9990.
[72] T. Pott, P. Meleard, New insight into the nanostructure of ionic liquids: a
small angle X-ray scattering (SAXS) study on liquid tri-alkyl-methyl-
ammonium bis(trifluoromethansulfonyl)amides and their mixtures, Phys.
Chem. Chem. Phys., 11 (2009) 5469-5475.
129
[73] P. Niga, D. Wakeham, A. Nelson, G.G. Warr, M. Rutland, R. Atkin,
Structure of the ethylammonium nitrate surface: an X-ray reflectivity and
vibrational sum frequency spectroscopy study, Langmuir, 26 (2010) 8282-
8288.
[74] R. Atkin, G.G. Warr, The smallest amphiphiles: nanostructure in protic
room-temperature ionic liquids with short alkyl groups, J. Phys. Chem. B,
112 (2008) 4164-4166.
[75] Y. Umebayashi, W.-L. Chung, T. Mitsugi, S. Fukuda, M. Takeuchi, K. Fujii,
T. Takamuku, R. Kanzaki, S. Ishiguro, Liquid structure and ion-ion
interactions of ethylamonium nitrate ionic liquid studied by large angle X-
ray scattering and molecular dynamic simulations. J. Comput. Chem. Japan,
7 (2008) 1-13.
[76] A.B.A. Rupp, S. Welle, P. Klose, H. Scherer, I Krossing, Effect of dimethyl
carbonate on the dynamic properties and ionicities of ionic liquids with
[MIII(hfip)4]-(M=B,Al) anions, ChemPhysChem, 16 (2015) 1940-1947.
[77] A. Filippov, N. Azancheev, M. Taher, F.U. Shah, P. Rabét, S. Glavatskih,
O.N. Antzutkin, Self-diffusion and interactions in mixtures of imidazolium
bis(mandelato)borate ionic liquids with poly(ethylene glycol): 1H NMR
study, Magn. Reson. Chem., 53 (2015) 493-497.
[78] T.-Y. Wu, H.-C. Wang, S.-G. Su, S.-T. Gung, M.-W. Lin, S.-G. Su.
Aggregation influence of polyethyleneglycol organic solvents with ionic
liquids BMIBF4 and BMIPF6, J. Chinese Chem. Soc., 57 (2010) 44-54.
[79] M. Liang, S. Khatun, E. W. Castner, Communication: unusual structure and
transport in ionic liquid-hexane mixtures, J. Chem Phys., 142 (2015)
121101/1-121101/4.
[80] A. Radhi, K.A. Le, M.E. Ries, T. Budtova, Macroscopic and microscopic
study of 1-ethyl-3-methyl-imidazolium acetate-DMSO mixtures, J. Phys.
Chem. B, 119 (2015) 1633-1640.
130
[81] B.A. Marekha, O.N. Kalugin, M. Bria, R. Buchner, A. Idrissi, Translational
diffusion in mixtures of imidazolium ILs with polar aprotic molecular
solvents, J. Phys. Chem. B, 118 (2014) 5509-5517.
[82] M.P. Singh, R.K. Singh, S. Chandra, Ionic liquids confined in porous
matrices: Physicochemical properties and applications, Prog. Mater. Sci., 64
(2014) 73-120.
[83] C. Pinalla, M. Del Popolo, R. Lynden-Bell, J. Kohanoff, Structure and
dynamics of a con- fined ionic liquid. Topics of relevance to dye-sensitized
solar cells, J. Phys. Chem. B, 109 (2005) 17922-17927.
[84] C. Pinalla, M. Del Popolo, J. Kohanoff, R. M. Lynden-Bell, Polarization
relaxation in an ionic liquid confined between electrified walls. J. Phys.
Chem. B, 111 (2007) 4877-4884.
[85] W. Shi, D.R. Luebke, Enhanced gas absorption in the ionic liquid 1-n-hexyl-
3-methylimidazolium bis(trifluoromethylsulfonyl) amide ([hmim][TfxN])
confined in silica slit pores: a molecular simulation study, Langmuir, 29
(2013) 5563-5572.
[86] B. Coasne, L. Viau, A. Vioux, Loading-controlled stiffening in
nanoconfined ionic liquids, J. Phys. Chem. Lett., 2 (2011) 1150-1154.
[87] B. Lee, H. Luo, C. Y. Yuan, J. S. Lin, S. Dai, Synthesis and characterization
of organic–inorganic hybrid mesoporous silica materials with new
templates, Chem. Comm., 42 (2004) 240-241.
[88] P.K. Mandal, A Paul, A Samanta, Excitation wavelength dependent
fluorescence behavior of the room temperature ionic liquids and dissolved
dipolar solutes, J. Photochem. Photobiol. A: Chemistry, 182 (2006) 113-120.
[89] R. Atkin, G.G. Warr, Structure in confined room-temperature ionic
liquids, J. Phys. Chem. C, 111 (2007) 5162–5168.
131
[90] R. Hayes, N. Borisenko, M.K. Tam, P.C. Howlett, F. Endres, R. Atkin,
Double layer structure of ionic liquids at the Au(111) electrode interface: an
atomic force microscopy investigation, J. Phys. Chem. C, 115 (2011) 6855-
6863.
[91] R. Hayes, G.G. Warr, R. Atkin, At the interface: solvation and designing
ionic liquids, Phys. Chem. Chem. Phys., 12 (2010) 1709-1723.
[92] L.A. Jurado, H. Kim, A. Arcifa, A. Rossi, C. Leal, N.D. Spencer, R.M.
Espinosa-Marzal, Irreversible structural change of a dry ionic liquid under
nanoconfinement, Phys. Chem. Chem. Phys., 17 (2015) 13613-13624.
[93] S. Bovio, A. Podesta, C. Lenardi, P. Milani, Evidence of extended solidlike
layering in [Bmim][NTf2] ionic liquid thin films at room temperature, J.
Phys. Chem. B, 113 (2009) 6600-6603.
[94] M.P. Singh, R.K. Singh, S. Chandra, Properties of ionic liquids in porous
silica matrix, ChemPhysChem, 11 (2010) 2036-2043.
[95] M.P. Singh, Y.L. Verma, A.K. Gupta, R.K. Singh, S. Chandra, Changes in
dynamic behavior of ionic liquid in silica nano-pores, Ionics, 20 (2014) 507-
516.
[96] M.R. Castillo, J.M. Fraile, J.A. Mayoral, Structure and dynamics of 1-butyl-
3-methylimidazolium hexafluorophosphate phases on silica and laponite
clay: from liquid to solid behavior, Langmuir, 28 (2012) 11364-11375.
[97] S.M. Chathoth, E. Mamontov, S. Dai, X. Wang, P.F. Fulvio, D.J.
Wesolowski, Fast diffusion in a room temperature ionic liquid confined in
mesoporous carbon, Europhys. Lett., 97 (2012) 66004.
[98] S.M. Chathoth, E. Mamontov, P.F. Fulvio, X. Wang, G.A. Baker, S. Dai,
D.J. Wesolowski, An unusual slowdown of fast diffusion in a room
temperature ionic liquid confined in mesoporous carbon, Europhys. Lett.,
102 (2013) 16004.
132
[99] A. Rachocki, E. Andrzejewska, A. Dembna, J. Tritt-Goc, Translational
dynamics of ionic liquid imidazolium cations at solid/liquid interface in gel
polymer electrolyte, Eur. Polym. J., 71 (2015) 210-220.
[100] C. Iacob, J.R. Sangoro, W.K. Kipnusu, R. Valiullin, J. Kärger, F. Kremer,
Enhanced charge transport in nano-confined ionic liquids, Soft Matter, 8
(2012) 289-293.
[101] W. Shi, D.C. Sorescu, Molecular simulations of CO2 and H2 sorption into
ionic liquid 1-n-hexyl-3-methylimidazolium
bis(trifluoromethylsulfonyl)amide ([hmim][Tf2N]) confined in carbon
nanotubes, J. Phys. Chem. B, 114 (2010) 15029-15041.
[102] C. Iacob, J.R. Sangoro, P. Papadopoulus, T. Schubert, S. Naumov, R.
Valiullin, J. Kärger, F. Kremer, Charge transport and diffusion of ionic
liquids in nanoporous silica membranes, Phys. Chem. Chem. Phys., 12
(2010) 13798-13803.
[103] P. Walden, Über die Moleculargröße und Elektrische Leitfähigkeit Einiger
Geschmolzener Salze, Bull. Acad. Imp. Sci. St Petersburg, 8 (1914) 405-
422.
[104] D.F. Evans, A. Yamauchi, R. Roman, E.Z. Casassa, Micelle formation in
ethylammonium nitrate, a low-melting fused salt, J. Colloid Interf. Sci., 88
(1982) 89-96.
[105] C.F. Poole, B.R. Kersten, S.S.J. Ho, M.E. Coddens, K.G. Furton, Organic
salts, liquid at room temperature, as mobile phases in liquid
chromatography, J. Chromatogr. A, 352 (1986) 407-425.
[106] J.C. Thater, V. Gerard, C. Stubenrauch, Microemulsions with the ionic
liquid ethylammonium nitrate: phase behavior, composition, microstructure,
Langmuir, 30 (2014) 8283-8289.
[107] F.A. Bovey, Nuclear Magnetic Resonance Spectroscopy (2nd Ed.)
Academic Press; New York, 1988.
133
[108] M. Cohen, D. Turnbull, Molecular transport in liquids and glasses, J. Chem.
Phys., 31 (1959) 1164-1169.
[109] P.B. Macedo, T.A. Litovitz, On the relative roles of free volume and
activation energy in the viscosity of liquids, J. Chem. Phys., 42 (1965) 245-
256.
[110] S.Yu, S.Lindeman, C.D. Tran, Chiral ionic liquids: synthesis, properties, and
enantiomeric recognition, J. Org. Chem., 73(2008) 2576-2591.
[111] K. Machanová, A. Boisset, Z. Sedláková, M. Anouti, M. Bendová, J.
Jacquemin, Thermophysical properties of ammonium-based
bis{(trifluoromethyl)sulfonyl} imide ionic liquids: volumetric and transport
properties, J. Chem. Eng. Data, 57 (2012) 2227-2235.
[112] K. Liu, Y. Wu, M.A. McHugh, H. Baled, R.M. Enick, B.D. Morreale,
Equation of state modeling of high-pressure, high-temperature hydrocarbon
density data, J. Supercritical Fluids, 55 (2010) 701-711.
[113] L.P.N. Rebelo, J.N.C. Lopes, J.M.S.S. Esperanca, H.J.R. Guedes, J. Lachwa,
V. Najdanovic-Visak, Z.P. Visak, Accounting for the unique, doubly dual
nature of ionic liquids from a molecular thermodynamics and modelling
standpoints, Acc. Chem. Res., 40 (2007) 1114-1121.
[114] J. Slattery, C. Daguenet, P. Dyson, T. Schubert, I. Krossing, How to predict
the physical properties of ionic liquids, Angew. Chem. Int. Ed., 46 (2007)
5384-5388.
[115] K. Paduszynski, U. Domanska, A new group contribution method for
prediction of density of pure ionic liquids over a wide range of temperature
and pressure, Ind. Eng. Chem. Res., 51 (2012) 591-604.
[116] A. Filippov, B. Munavirov, G. Gröbner, M. Rudakova, Lateral diffusion in
equimolar mixtures of natural sphingomyelins with
dioleoylphosphatidylcholine, Magn. Reson. Imaging, 30 (2012) 413-421.
134
[117] M.A.A. Rocha, C.F.R.A.C. Lima, L.R. Gomes, B, Schröder, J.A.P.
Coutinho, I.M. Marrucho, J.M.S.S. Esperanca, L.P.N. Rebelo, K. Shimizu,
J.C. Lopes and L.M.N.B.F. Santos, High-accuracy vapor pressure data of the
extended [CnC1im][Ntf2] ionic liquid series: trend changes and structural
shifts, J. Phys. Chem. B, 115 (2011) 10919-10926.
[118] J. Lazzus, -T-P of ionic liquids,
Chem. Eng. Commun., 197 (2010) 974-1015.
[119] P.C. Nalam, J.N. Clasohm, A. Mashaghi, N.D. Spencer, Macrotribological
studies of poly (L-lysine)-graft-poly(ethylene glycol) in aqueous glycerol
mixtures, Tribol. Lett., 37 (2010) 541-552.
[120] F.U. Shah, S. Glavatskih, P.M. Dean, D.R. MacFarlane, M. Forsyth, O.N.
Antzutkin, Halogen-free chelated orthoborate ionic liquids and organic ionic
plastic crystals, J. Mater. Chem., 22 (2012) 6928-6938.
[121] J.M. Dust, Z.-H. Fang, J.M. Harris, Proton NMR characterization of
poly(ethylene glycols) and derivatives, Macromolecules, 23 (1990) 3742-
3746.
[122] J. Malmström, Characterization of 40 kDa poly(ethylene glycol)
polymers by proton transfer reaction QTOF mass spectrometry and1H-NMR spectroscopy, Anal. Bioanal. Chem., 403 (2012) 1167-1177.
[123] V.A. Sevreugin, V.D. Skirda, A.I. Maklakov, Macromolecule self-diffusion
in poly(ethylene glycol) melts, Polymer, 27 (1986) 290-292.
[124] T.-Y. Wu, B.-K. Chen, L. Hao, K.-F. Lin, I.-W. Sun, Thermophysical
properties of a room temperature ionic liquid (1-methyl-3-pentyl-
imidazolium hexafluorophosphate) with poly(ethylene glycol), J. Taiwan
Inst. Chem. Eng., 42 (2011) 914-921.
[125] J.A. Glassel, K.H. Lee, J. On the interpretation of water nuclear magnetic
resonance relaxation times in heterogeneous systems, J. Am. Chem. Soc., 96
(1974) 970-978.
135
[126] P.T. Callaghan J. Stepishnik, in «Advances in Magnetic and Optical
Resonance» (W. S. Warren, Ed.), vol. 19, pp. 326-389. Academic Press; San
Diego, 1996.
[127] P. Linse, O. Söderman, The validity of the short-gradient-pulse
approximation in NMR studies of restricted diffusion, J. Magn. Reson. A,
116 (1995) 77-86.
[128] C.H. Neuman, Spin echo of spins diffusing in a bounded medium, J. Chem.
Phys., 60 (1974) 4508-4511.
[129] B. Balinov, B. Jönsson, P. Linse, O. Söderman, The NMR self-diffusion
method applied to restricted diffusion. Simulation of echo attenuation from
molecules in spheres and between planes, J. Magn. Reson. A, 104 (1993)
17-25.
[130] D. Topgaard, O. Söderman, Experimental determination of pore size and
shape using q-space NMR microscopy in the long diffusion-time limit,
Magn. Reson. Imag., 21 (2003) 69-76.
[131] A.S. Ulrich, A. Watts, Molecular response on the lipid headgroup to bilayer
hydration monitored by 2H-NMR, Biophys. J., 66 (1994) 1441-1449.
[132] F. Volke, St. Eisenblatter, G. Klose, Hydration force parameters of
phosphatidylcholine lipid bilayers as determined from 2H-NMR studies of
deuterated water, Biophys. J., 67 (1994) 1882-1887.
[133] A. Carambassis, L.C. Jonker, P. Attard, M.W. Rutland, Forces measured
between hydrophobic surfaces due to a sub-microscopic bridging bubble,
Phys. Rev. Lett., 80 (1998) 5357-5360.
[134] A. Filippov, N. Azancheev, F.U. Shah, S. Glavatskih, O.N. Antzutkin, Self-
diffusion of phosphonium bis(salicylato)borate ionic liquid in pores of
Vycor porous glass: A 1H NMR study, Micropor. Mesopor. Mater., 2016,
under review.
136
[135] T. Echelmeyer, H.W. Meyer, L.V. Wullen, Novel ternary composite
electrolytes: Li ion conducting ionic liquids in silica glass, Chem. Mater., 21
(2009) 2280-2285.
[136] P. Levitz, G. Ehret, S.K. Sinha, J.M. Drake, Porous Vycor glass: The
microstructure as probed by electron microscopy, direct energy transfer,
small-angle scattering, and molecular adsorption, J. Chem. Phys, 95 (1991)
6151-6161.
[137] Corning Glass Works, O. E. M. Sales Service, Box 5000, Corning, NY
14830.
[138] B. Lu, S. Torquato, Chord-length and free-path distribution functions for
many-body systems, J. Chem. Phys, 98 (1993) 6472-6482.
[139] W. Gille, D. Enke, F. Janowski, Pore size distribution and chord length
distribution of porous Vycor Glass (PVG), J. Porous Mater, 9 (2002)
221-230.
[140] M.H. Kim, C.J. Glinka, Ultra small angle neutron scattering study of the
nanometer to micrometer structure of porous Vycor, Micropor. Mesopor.
Mater, 91 (2006) 305-311.
[141] A.C. Mitropoulos, Small-angle X-ray scattering studies of adsorption in
Vycor glass, J. Colloid Interface Sci., 336 (2009) 679-690.
[142] R. Cimino, K.A. Cychosz, M. Tommers, A.V. Neimark, Experimental and
theoretical studies of scanning adsorption-desorption isotherms, Colloids
and Surfaces A: Physicochem. Eng. Aspects, 437 (2013) 76-89.
[143] R.M. Cotts, M.J.R. Hoch, T. Sun, J.T. Markert, Pulsed field gradient
stimulated echo methods for improved NMR diffusion measurements in
heterogeneous systems, J. Magn. Reson., 83 (1989) 252-256.
[144] S.J. Gibbs, C.S. Johnson Jr., A PFG NMR experiment for accurate diffusion
and flow studies in the presence of Eddy currents. J. Magn. Reson., 93
(1991) 39-402.
137
[145] V. Skirda, A. Filippov, A. Sagidullin, A. Mutina, R. Archipov, G. Pimenov,
Restricted diffusion and molecular exchange processes in porous media as
studied by pulsed field gradient NMR, in: Fluid Transport in Nanoporous
Materials. Book series: NATO Science Series II-Mathematics Physics and
Chemistry, 219 (2006) 255-278.
[146] D. Kondrashova, M. Dvoyashkin, R. Valiullin, Structural characterization of
porous solids by simultaneously monitoring the low-temperature phase
equilibria and diffusion of intrapore fluids using nuclear magnetic
resonance, New J. Phys., 13 (2011) 015008.
[147] N.K. Dvoyashkin, A.I. Maklakov, Determination of geometrical and
transport properties of porous medium by pulsed field gradient method,
Colloid J., 58 (1996) 561-565.
[148] S.A. Mian, L.M. Yang, L.C. Saha, E. Ahmed, M. Ajmal, E. Ganz, A
fundamental understanding of catechol and water adsorption on a
hydrophilic silica surface: exploring the underwater adhesion mechanism of
mussels on an atomic scale, Langmuir, 30 (2014) 6906-6914.
[149] S.A. Mian, L.M. Yang, L.C. Saha, J. Jang, L. Wang, X. Gao, S..Nagase,
Density functional theory study of catechol adhesion on silica surfaces, J.
Phys. Chem., 114 (2010) 20793-20800.


Article I

1
Long-range dynamics for ethylammonium nitrate in
bulk and in confinement
Andrei Filippov,a,b,* Oleg I. Gnezdilov,b Nicklas Hjalmarsson,c Oleg N.
Antzutkin,a
Sergei Glavatskih,d,e and Mark W. Rutlandc,f
aChemistry of Interfaces, Luleå University of Technology, SE-97187 Luleå, SwedenbInstitute of Physics, Kazan Federal University, 420008 Kazan, RussiacSurface and Corrosion Science, KTH Royal Institute of Technology, SE-10044
Stockholm, SwedendSystem and Component Design, KTH Royal Institute of Technology, SE-10044
Stockholm, SwedeneDepartment of Mechanical Construction and Production, Ghent University,
B-9000 Ghent, BelgiumfSP Technical Research Institute of Sweden, Chemistry Materials and Surfaces, Box
5607, SE-114 86 Stockholm, Sweden
*Corresponding author: [email protected]
Tel: +46 (0)73-6782225
ABSTRACT: Self-diffusion of ions in the protic ionic liquid
ethylammonium nitrate (EAN) was studied by 1H and 15N NMR pulsed
field gradient techniques between 294 and 393 K. The ions were studied
both in bulk as well as confined between polar and silanized glass plates,
between polytetrafluoroethylene (PTFE) plates and in the presence of a
PTFE insert in a 5-mm NMR tube. At all temperatures, the bulk diffusion
of the ethylammonium cation (measured by 1H NMR) and the nitrate anion
2
(measured by 15N NMR) can both be described by a unique diffusion
coefficient. However, the diffusion coefficient of the anion is a factor of
1.7 higher than that of the cation, which is in agreement with separate
(unpaired) diffusion of the cation and anion. The presence of solid surfaces
induces regions of EAN in their vicinity where diffusion is reduced in the
direction normal to the surface and may be increased along the surfaces.
Line-shape analysis in 1H NMR spectra showed that local mobility of
ethylammonium cations in the surface layers near PTFE is also reduced.
Keywords: Ionic liquid; Surface induced phase change; Nuclear magnetic
resonance; Pulsed-field gradient, NMR diffusometry; Nano-structure;
Association; Ion dynamics; Liquid confinement
1. IntroductionIonic liquids (ILs) are molten salts that form typically from organic cations and
either organic or inorganic anions [1,2]. Their applications are continuously
expanding, for example as electrolyte material in lithium batteries [3] and
ultracapacitors [4], media for chemical reaction and separation [2,5], as
lubricants [6], etc. Ethylammonium nitrate (EAN), first synthesized by Paul
Walden in 1914 [7], is the most commonly reported protic IL. EAN is used as a
replacement for organic solvents as a reaction medium, as a precipitating agent
for protein crystallization [5], an electrically conductive solvent in
electrochemistry [3], amongst other applications. Similarly to water, EAN can
form a three-dimensional hydrogen bonding network and can be used as an
amphiphilic self-assembly medium [8].
Recently, small-angle neutron scattering revealed that EAN itself exhibits an
inherent amphiphilic nanostructure in the pure liquid state [9]. This result
3
provides experimental evidence of nano-scale heterogeneity for ILs with alkyl
chains shorter than C4. The calculated Bragg spacing is approximately twice
the ion-pair dimension of the IL, which suggests that the IL is structured on the
length scale of the ions, with the (hydrogenous) alkyl groups associated
together and segregated from the H-bonded ionic moieties –ND3+ and NO3
-.
The liquid – solid interface can significantly change bulk properties of ILs [10-
12]. For example, the existence of thin, 0.6 – 0.8 nm, ordered layers were
inferred by X-ray diffraction in imidazolium-based ILs [10]. Recently, atomic
force microscopy (AFM) has provided evidence of extended solid-like layers in
1-butyl-3-methyl-imidazolium bis(trifluoromethylsulfonyl)-imide near the
liquid/solid interface on mica and amorphous silica [11], and, similarly, solid-
like layers in 1-hexyl-3-methylimidazolium ethylsulfate [12] were obtained.
The purpose of this work was to study dynamic properties of EAN in the
bulk and in the presence of both polar and nonpolar surfaces. Previous
measurements in orthoborate ILs indicated that diffusion behavior is complex
and temperature dependent [13,14]; therefore, it was decided to investigate
whether the strongly hydrogen bonding protic ILs would display similar
behavior. Nuclear magnetic resonance (NMR) is an effective technique for
examining the interactions between ions in a complex system, such as ILs
[15,16]. Local and translational mobilities of the cations and anions can be
investigated using different modifications of the NMR technique [13,14,17,18].
Its potential to study bulk dynamics as well as near-surface and confined
dynamics of liquids has been proven in diverse complex liquids, such as
surfactants, polymers and ILs [14,19-21].
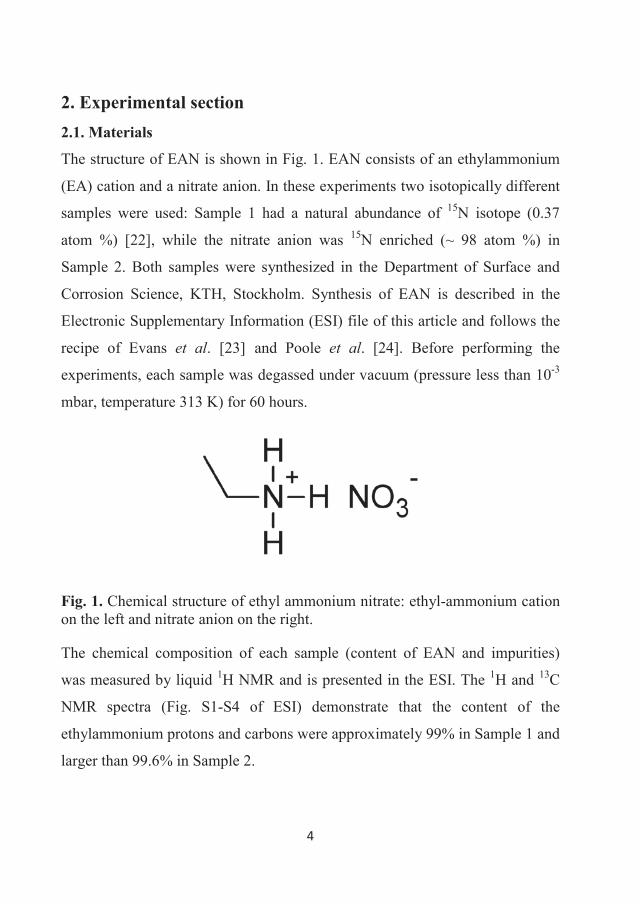
4
2. Experimental section2.1. Materials
The structure of EAN is shown in Fig. 1. EAN consists of an ethylammonium
(EA) cation and a nitrate anion. In these experiments two isotopically different
samples were used: Sample 1 had a natural abundance of 15N isotope (0.37
atom %) [22], while the nitrate anion was 15N enriched (~ 98 atom %) in
Sample 2. Both samples were synthesized in the Department of Surface and
Corrosion Science, KTH, Stockholm. Synthesis of EAN is described in the
Electronic Supplementary Information (ESI) file of this article and follows the
recipe of Evans et al. [23] and Poole et al. [24]. Before performing the
experiments, each sample was degassed under vacuum (pressure less than 10-3
mbar, temperature 313 K) for 60 hours.
Fig. 1. Chemical structure of ethyl ammonium nitrate: ethyl-ammonium cation on the left and nitrate anion on the right.
The chemical composition of each sample (content of EAN and impurities)
was measured by liquid 1H NMR and is presented in the ESI. The 1H and 13C
NMR spectra (Fig. S1-S4 of ESI) demonstrate that the content of the
ethylammonium protons and carbons were approximately 99% in Sample 1 and
larger than 99.6% in Sample 2.
5
2.2. Nuclear magnetic resonance
NMR measurements were partially performed on a Bruker Avance III (Bruker
BioSpin AG, Fällanden, Switzerland) NMR spectrometer. Working frequencies
were 400.27 MHz and 40.56 MHz for 1H and 15N, respectively. Data was
processed using Bruker Topspin 3.1 software. 1H (Samples 1 and 2) and 15N
(Sample 2) NMR self-diffusion measurements of EAN in bulk and in the
presence of a PTFE insert were performed with a Pulsed-Field-Gradient (PFG)
probe Diff50 (Bruker). A sample (approximately 300 μl) was placed in a
standard 5-mm glass sample tube and sealed with a plastic stopper to avoid
contact with air. Before each measurement, the sample was equilibrated at the
specified temperature for 20 min. A PTFE insert was used in some of the
experiments (originally designed to eliminate convection of liquid), creating
compartments (Fig. S5(A)): Twelve PTFE disks with a diameter of 3.8 mm
were placed on PTFE cylinders with a length of 1.5 mm (separation between
disks). The disks were oriented perpendicular to the axis of the NMR sample
tube (normal to the main magnetic field and the direction of the pulsed field
gradient).1H NMR diffusion measurements of the EAN (Sample 1) in bulk and on
samples containing freshly cleaned or silanized glass, or PTFE plates were
performed on an Chemagnetics InfinityPlus CMX-360 spectrometer with a
working frequency of 359.9 MHz. An NMR goniometer probe was used, which
enables macroscopically-aligned layers to be oriented with the plate’s normal
at different angles, with respect to the main magnetic field. The gradient
amplitude was 1.175 T/m and gradient duration was varied from 0.3 to 8.3 ms.
In this series of experiments, samples with EAN contained thin plates prepared
from carefully cleaned or silanized glass or PTFE (Fig. S5, right). Thin glass
plates (5 14 x 0.08 mm, Thermo Scientific Menzel Gläser, Menzel GmbH,
6
Braunschweig, Germany) or PTFE (5 14 x 0.1 mm, Science and Technology
Industrial Park, Taixing City, Jiangsu, China) were stacked and placed in a
square, cross-sectioned tube. The spaces between plates were filled with EAN.
Cleaning and silanization protocols are presented in the ESI. Contact angle
measurements were done at the studied surfaces to examine their
hydrophobicity (described in the ESI). The experiments showed that the
cleaned glass surface had a contact angle near 0°, the silanized glass surface
between 91° and 96°, and the PTFE ~105°. Therefore, cleaned and silanized
glasses will, henceforth, be referred to as polar and nonpolar, respectively.
The primary information for the diffusion is contained in the diffusion decay
(DD) of the NMR stimulated echo amplitude A. which in the case of simple
non-associating molecular liquid can be described by the following equation
(Eq. 1) [25,26]:
2 2 211
2 1
2(2 , , , ) exp exp2 dIA g g Dt
T T(1)
where I is the factor proportional to the proton content in the system; 1 and 2
are spin-lattice and spin-spin relaxation times, respectively; and 1 are time
intervals in the pulse sequence; is the gyromagnetic ratio for a used nucleus;
g and are the amplitude and duration of the gradient pulse; td =( - /3) is the
diffusion time; =( + 1); and D is the self-diffusion coefficient.
3. Results and discussion3.1. Diffusion of EAN in bulk 1H NMR spectra of EAN correspond only to the EA cation (Fig. S1 and S3 of
the ESI) since the anion has no protons. These spectra demonstrated three
resonance lines, which were assigned to protons of –NH3+ (7.6 ppm), –CH2–
(3.2 ppm) and –CH3 (1.4 ppm) chemical groups of the cation in accordance
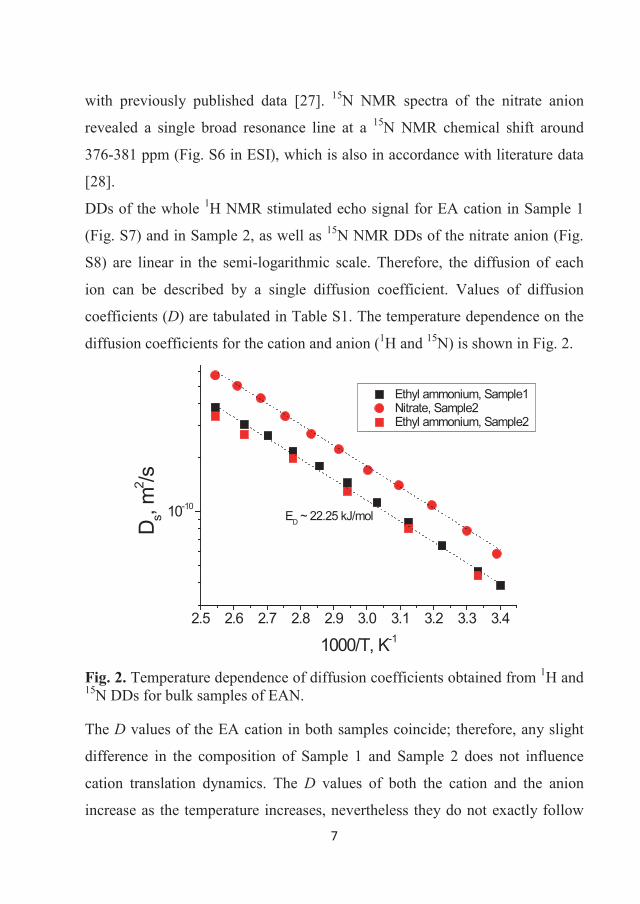
7
with previously published data [27]. 15N NMR spectra of the nitrate anion
revealed a single broad resonance line at a 15N NMR chemical shift around
376-381 ppm (Fig. S6 in ESI), which is also in accordance with literature data
[28].
DDs of the whole 1H NMR stimulated echo signal for EA cation in Sample 1
(Fig. S7) and in Sample 2, as well as 15N NMR DDs of the nitrate anion (Fig.
S8) are linear in the semi-logarithmic scale. Therefore, the diffusion of each
ion can be described by a single diffusion coefficient. Values of diffusion
coefficients (D) are tabulated in Table S1. The temperature dependence on the
diffusion coefficients for the cation and anion (1H and 15N) is shown in Fig. 2.
2.5 2.6 2.7 2.8 2.9 3.0 3.1 3.2 3.3 3.4
10-10
Ethyl ammonium, Sample1 Nitrate, Sample2 Ethyl ammonium, Sample2
D s, m
2 /s
1000/T, K-1
ED ~ 22.25 kJ/mol
Fig. 2. Temperature dependence of diffusion coefficients obtained from 1H and 15N DDs for bulk samples of EAN.
The D values of the EA cation in both samples coincide; therefore, any slight
difference in the composition of Sample 1 and Sample 2 does not influence
cation translation dynamics. The D values of both the cation and the anion
increase as the temperature increases, nevertheless they do not exactly follow
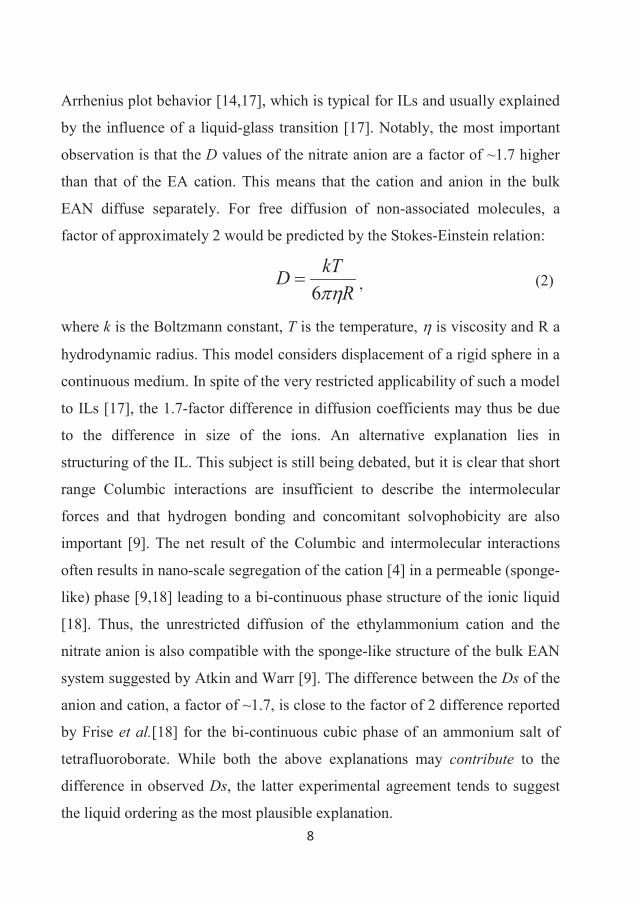
8
Arrhenius plot behavior [14,17], which is typical for ILs and usually explained
by the influence of a liquid-glass transition [17]. Notably, the most important
observation is that the D values of the nitrate anion are a factor of ~1.7 higher
than that of the EA cation. This means that the cation and anion in the bulk
EAN diffuse separately. For free diffusion of non-associated molecules, a
factor of approximately 2 would be predicted by the Stokes-Einstein relation:
RkTD
6 , (2)
where k is the Boltzmann constant, T is the temperature, is viscosity and R a
hydrodynamic radius. This model considers displacement of a rigid sphere in a
continuous medium. In spite of the very restricted applicability of such a model
to ILs [17], the 1.7-factor difference in diffusion coefficients may thus be due
to the difference in size of the ions. An alternative explanation lies in
structuring of the IL. This subject is still being debated, but it is clear that short
range Columbic interactions are insufficient to describe the intermolecular
forces and that hydrogen bonding and concomitant solvophobicity are also
important [9]. The net result of the Columbic and intermolecular interactions
often results in nano-scale segregation of the cation [4] in a permeable (sponge-
like) phase [9,18] leading to a bi-continuous phase structure of the ionic liquid
[18]. Thus, the unrestricted diffusion of the ethylammonium cation and the
nitrate anion is also compatible with the sponge-like structure of the bulk EAN
system suggested by Atkin and Warr [9]. The difference between the Ds of the
anion and cation, a factor of ~1.7, is close to the factor of 2 difference reported
by Frise et al.[18] for the bi-continuous cubic phase of an ammonium salt of
tetrafluoroborate. While both the above explanations may contribute to the
difference in observed Ds, the latter experimental agreement tends to suggest
the liquid ordering as the most plausible explanation.
9
3.2. Diffusion of EA cation between parallel glass plates
Polar glass plates
Fig. 3 (colored symbols) shows the 1H NMR DDs of the EA cation normal and
along to polar glass plates. In the direction normal to the plates (Fig. 3A), the
decays deviate from the linear behavior typical for the bulk (shown here as
solid squares and almost parallel with ordinate) and the extent of this deviation
increases as the diffusion time increases from 50 ms to 1 s. However, for the
diffusion along the plates (Fig. 3B) DDs maintain the linear form typical for
the bulk, while the slope of the decays (and, consequently, the D) is a factor of
2.5 higher than that in the bulk and is invariant over the diffusion time range 50
- 1000 ms.
Nonpolar glass plates1H NMR DDs of the EA cation confined between parallel, nonpolar glass
plates in the directions normal and along the glass plates are shown in Fig. 4.
For diffusion in the direction normal to plates (Fig. 4A), the decays deviate
from linear behavior (triangles). However, in contrast to the case for the polar
glass described above the deviations from the bulk diffusion are much weaker.
For diffusion along the nonpolar plates (Fig. 4B, open triangles), a higher D
than in the bulk was observed with no dependence on the diffusion time, but
this effect is weaker than that for the case of polar glass plates, only a factor of
1.4 of the bulk D compared to 2.5 for polar glass plates.
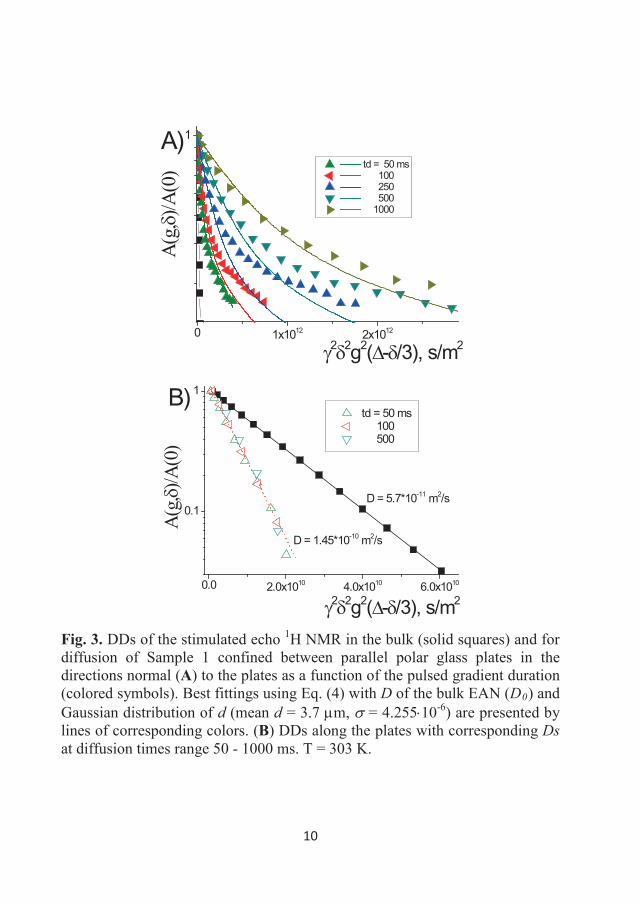
10
0 1x10¹² 2x10¹²
1
2 2g2( - /3), s/m2
A)A(
g,)/A
(0) td = 50 ms
100 250 500 1000
0.0 2.0x10¹⁰ 4.0x10¹⁰ 6.0x10¹⁰
0.1
1
D = 1.45*10-10 m2/s
2 2g2( - /3), s/m2
A(g,
)/A(0
)
td = 50 ms 100 500
D = 5.7*10-11 m2/s
B)
Fig. 3. DDs of the stimulated echo 1H NMR in the bulk (solid squares) and for diffusion of Sample 1 confined between parallel polar glass plates in the directions normal (A) to the plates as a function of the pulsed gradient duration (colored symbols). Best fittings using Eq. (4) with D of the bulk EAN (D0) and Gaussian distribution of d (mean d = 3.7 m, = 4.255 10-6) are presented bylines of corresponding colors. (B) DDs along the plates with corresponding Dsat diffusion times range 50 - 1000 ms. T = 303 K.
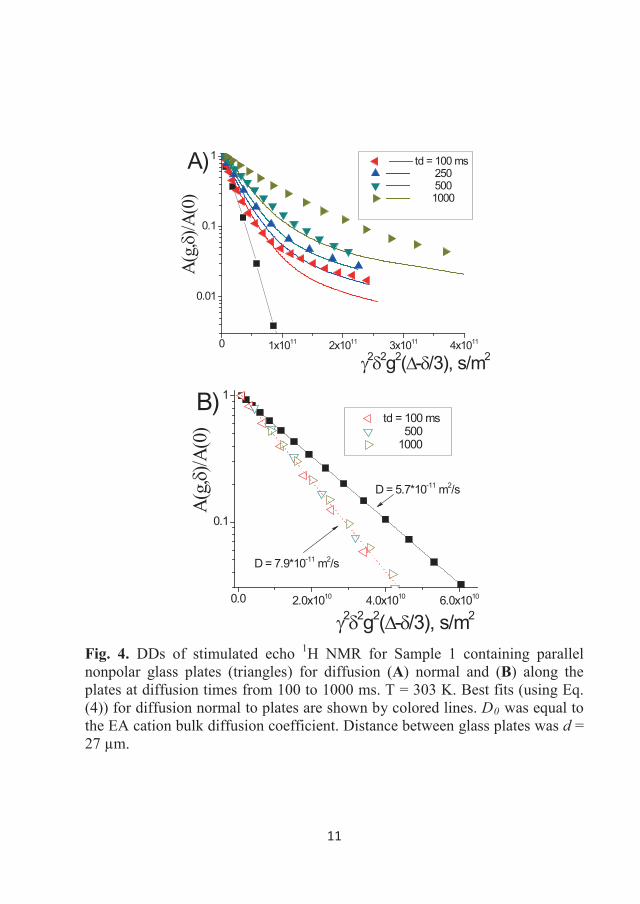
11
0 1x10¹¹ 2x10¹¹ 3x10¹¹ 4x10¹¹
0.01
0.1
1
2 2g2( - /3), s/m2
td = 100 ms 250 500 1000
A(g,
)/A(0
)A)
0.0 2.0x10¹⁰ 4.0x10¹⁰ 6.0x10¹⁰
0.1
1
A(g,
)/A(0
)
D = 5.7*10-11 m2/s
D = 7.9*10-11 m2/s
td = 100 ms 500 1000
2 2g2( - /3), s/m2
B)
Fig. 4. DDs of stimulated echo 1H NMR for Sample 1 containing parallel nonpolar glass plates (triangles) for diffusion (A) normal and (B) along the plates at diffusion times from 100 to 1000 ms. T = 303 K. Best fits (using Eq. (4)) for diffusion normal to plates are shown by colored lines. D0 was equal to the EA cation bulk diffusion coefficient. Distance between glass plates was d =27 μm.
12
3.3. Diffusion of ethylammonium and nitrate in the sample containing
PTFE obstacles1H NMR DDs of EA cations between parallel PTFE plates for the diffusion
both normal to and along the glass plates are shown in Fig. 5. Deviations of the
decays from bulk diffusion (squares) are more obvious for diffusion in the
direction normal to the plates and increase as the diffusion time increases from
100 to 1000 ms (Fig. 5A). For the diffusion along the plates DDs in bulk
(squares) and in pores coincide almost up to two decimal ranges (Fig 5B),
however, some small fraction has less D (dotted lines).
The apparent fractional volume of the slowly diffusing component is only 0.7-
3%. However, as it is seen from Eq. (1) amplitudes of echoes are determined
by T2 relaxation times, as well as by fractions of protons. Therefore, an
apparent fractional volume of the slow-diffusing component of the DDs may
also be dependent on differential T2 relaxation effects of the corresponding two
components of EAN.
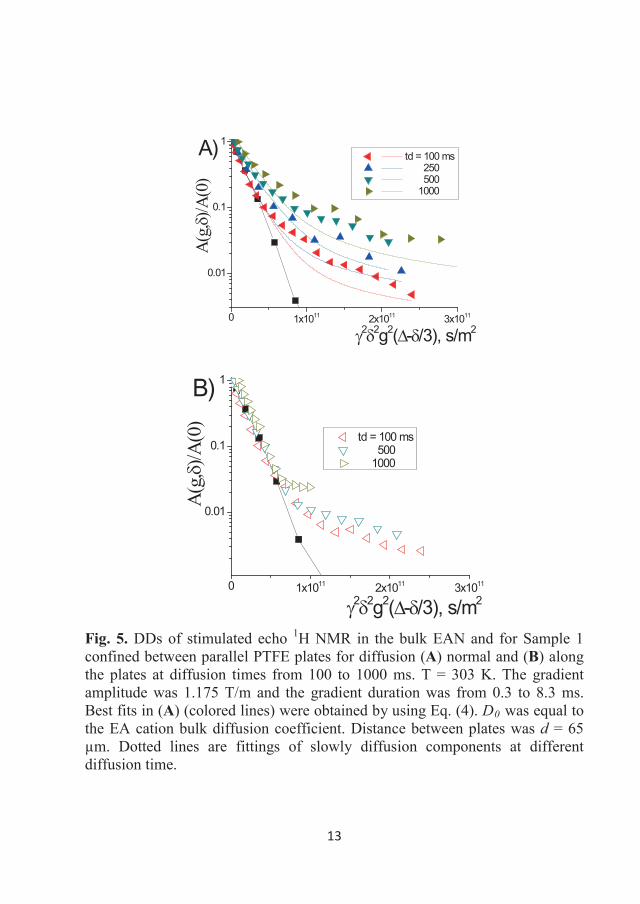
13
0 1x10¹¹ 2x10¹¹ 3x10¹¹
0.01
0.1
1
2 2g2( - /3), s/m2
td = 100 ms 250 500 1000
A(g,
)/A(0
)
A)
0 1x10¹¹ 2x10¹¹ 3x10¹¹
0.01
0.1
1
td = 100 ms 500 1000
A(g
,)/A
(0)
2 2g2( - /3), s/m2
B)
Fig. 5. DDs of stimulated echo 1H NMR in the bulk EAN and for Sample 1 confined between parallel PTFE plates for diffusion (A) normal and (B) along the plates at diffusion times from 100 to 1000 ms. T = 303 K. The gradient amplitude was 1.175 T/m and the gradient duration was from 0.3 to 8.3 ms. Best fits in (A) (colored lines) were obtained by using Eq. (4). D0 was equal to the EA cation bulk diffusion coefficient. Distance between plates was d = 65 μm. Dotted lines are fittings of slowly diffusion components at different diffusion time.
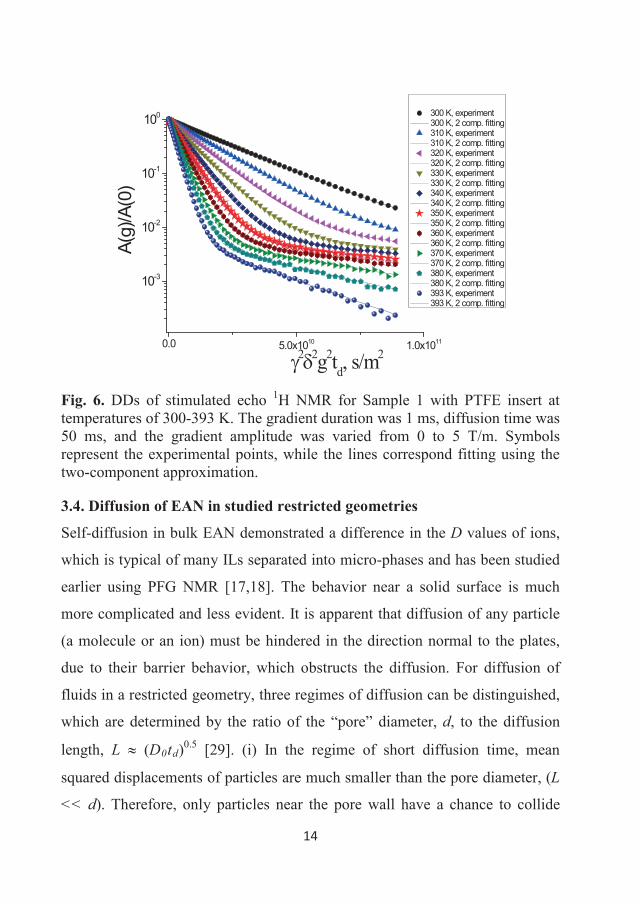
14
0.0 5.0x10¹⁰ 1.0x10¹¹
10-3
10-2
10-1
100 300 K, experiment 300 K, 2 comp. fitting 310 K, experiment 310 K, 2 comp. fitting 320 K, experiment 320 K, 2 comp. fitting 330 K, experiment 330 K, 2 comp. fitting 340 K, experiment 340 K, 2 comp. fitting 350 K, experiment 350 K, 2 comp. fitting 360 K, experiment 360 K, 2 comp. fitting 370 K, experiment 370 K, 2 comp. fitting 380 K, experiment 380 K, 2 comp. fitting 393 K, experiment 393 K, 2 comp. fitting
A(g)
/A(0
)
2 2g2td, s/m2
Fig. 6. DDs of stimulated echo 1H NMR for Sample 1 with PTFE insert at temperatures of 300-393 K. The gradient duration was 1 ms, diffusion time was 50 ms, and the gradient amplitude was varied from 0 to 5 T/m. Symbols represent the experimental points, while the lines correspond fitting using the two-component approximation.
3.4. Diffusion of EAN in studied restricted geometries
Self-diffusion in bulk EAN demonstrated a difference in the D values of ions,
which is typical of many ILs separated into micro-phases and has been studied
earlier using PFG NMR [17,18]. The behavior near a solid surface is much
more complicated and less evident. It is apparent that diffusion of any particle
(a molecule or an ion) must be hindered in the direction normal to the plates,
due to their barrier behavior, which obstructs the diffusion. For diffusion of
fluids in a restricted geometry, three regimes of diffusion can be distinguished,
which are determined by the ratio of the “pore” diameter, d, to the diffusion
length, L (D0td)0.5 [29]. (i) In the regime of short diffusion time, mean
squared displacements of particles are much smaller than the pore diameter, (L
<< d). Therefore, only particles near the pore wall have a chance to collide
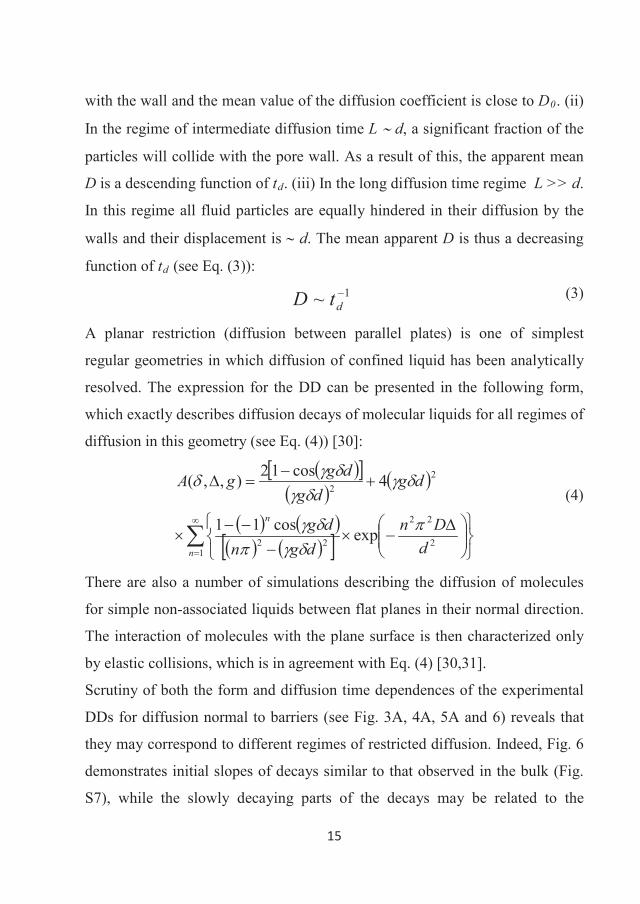
15
with the wall and the mean value of the diffusion coefficient is close to D0. (ii)
In the regime of intermediate diffusion time L d, a significant fraction of the
particles will collide with the pore wall. As a result of this, the apparent mean
D is a descending function of td. (iii) In the long diffusion time regime L >> d.
In this regime all fluid particles are equally hindered in their diffusion by the
walls and their displacement is d. The mean apparent D is thus a decreasing
function of td (see Eq. (3)):1~ dtD (3)
A planar restriction (diffusion between parallel plates) is one of simplest
regular geometries in which diffusion of confined liquid has been analytically
resolved. The expression for the DD can be presented in the following form,
which exactly describes diffusion decays of molecular liquids for all regimes of
diffusion in this geometry (see Eq. (4)) [30]:
12
22
22
22
expcos11
4cos12),,(
n
n
dDn
dgndg
dgdg
dggA(4)
There are also a number of simulations describing the diffusion of molecules
for simple non-associated liquids between flat planes in their normal direction.
The interaction of molecules with the plane surface is then characterized only
by elastic collisions, which is in agreement with Eq. (4) [30,31].
Scrutiny of both the form and diffusion time dependences of the experimental
DDs for diffusion normal to barriers (see Fig. 3A, 4A, 5A and 6) reveals that
they may correspond to different regimes of restricted diffusion. Indeed, Fig. 6
demonstrates initial slopes of decays similar to that observed in the bulk (Fig.
S7), while the slowly decaying parts of the decays may be related to the
16
fraction of EA cation near obstacles. Therefore, this case corresponds to the
regime of short diffusion time that is reasonable for the 1.5 mm distance
between obstacles (separation between disks in the PTFE insert). For other
cases there are dependences of DDs on td, which are typical of the intermediate
diffusion time and long diffusion time regimes. To relate these decays to a
certain regime, it is technically possible to use the diffusion time dependence
of the corresponding mean apparent D, but it is not a trivial task to extract
exact values of mean Ds from complicated DD forms. There is, however,
another option: it is known that, for the long diffusion time regime and
diffusion normal to planes, DDs do not depend on diffusion time, and can be
described by Eq. (5) [30]:
122exp),0(
2qdtqA d (5)
where q = g /2 . DDs from Fig. 3A, 4A and 5A in coordinates A( ) are
presented in Fig. 7.
As is seen from Fig. 7A, DDs normal to polar glass plates are complicated.
They are sums of at least two components. The first part of the DDs ( = 0 -
0.003) coincides for all td with a steeper slope and they do not change with
diffusion time; therefore, it corresponds to the short diffusion time regime. The
remaining part of the DDs ( > 0.003) displays gentler slope, which increases
as td increases. Therefore, it corresponds to the intermediate diffusion time
regime.
It follows from Eq. (5) that the distance between planes in the long diffusion
time regime can be determined as a square root of the slope of the DD in
coordinates ln[A(q)] versus -(4 q)2/12. Initial slopes of DDs were analyzed in
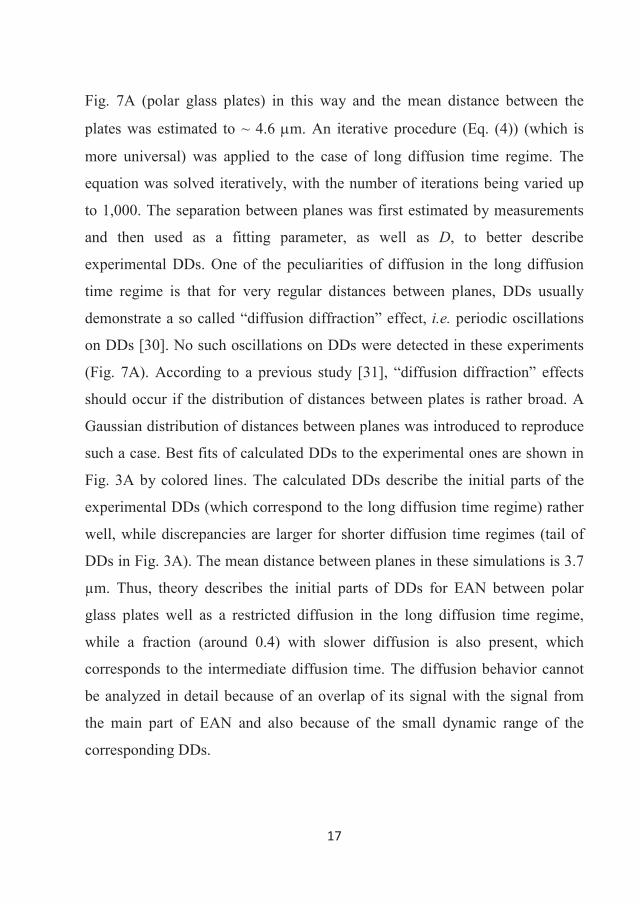
17
Fig. 7A (polar glass plates) in this way and the mean distance between the
plates was estimated to ~ 4.6 m. An iterative procedure (Eq. (4)) (which is
more universal) was applied to the case of long diffusion time regime. The
equation was solved iteratively, with the number of iterations being varied up
to 1,000. The separation between planes was first estimated by measurements
and then used as a fitting parameter, as well as D, to better describe
experimental DDs. One of the peculiarities of diffusion in the long diffusion
time regime is that for very regular distances between planes, DDs usually
demonstrate a so called “diffusion diffraction” effect, i.e. periodic oscillations
on DDs [30]. No such oscillations on DDs were detected in these experiments
(Fig. 7A). According to a previous study [31], “diffusion diffraction” effects
should occur if the distribution of distances between plates is rather broad. A
Gaussian distribution of distances between planes was introduced to reproduce
such a case. Best fits of calculated DDs to the experimental ones are shown in
Fig. 3A by colored lines. The calculated DDs describe the initial parts of the
experimental DDs (which correspond to the long diffusion time regime) rather
well, while discrepancies are larger for shorter diffusion time regimes (tail of
DDs in Fig. 3A). The mean distance between planes in these simulations is 3.7
μm. Thus, theory describes the initial parts of DDs for EAN between polar
glass plates well as a restricted diffusion in the long diffusion time regime,
while a fraction (around 0.4) with slower diffusion is also present, which
corresponds to the intermediate diffusion time. The diffusion behavior cannot
be analyzed in detail because of an overlap of its signal with the signal from
the main part of EAN and also because of the small dynamic range of the
corresponding DDs.
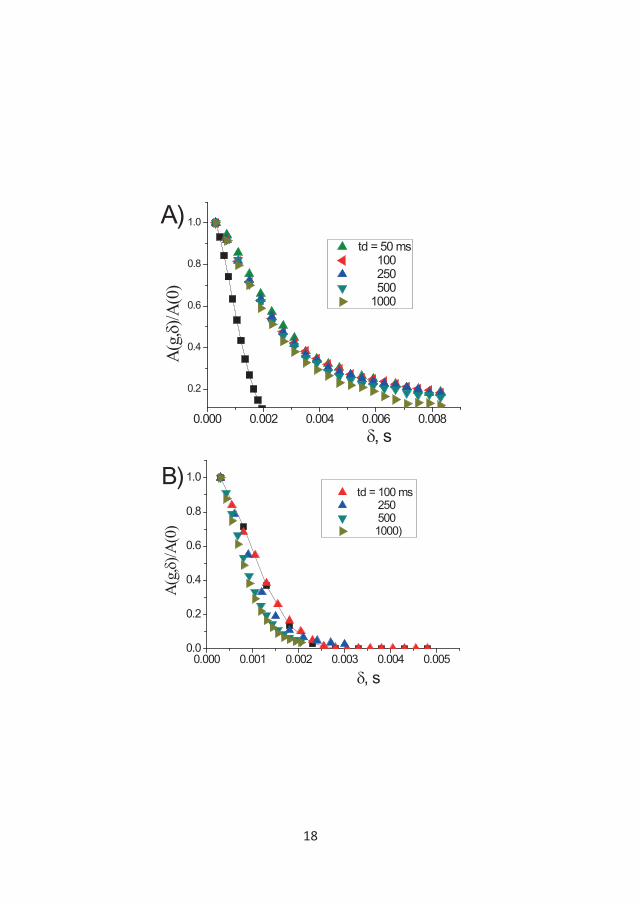
18
0.000 0.002 0.004 0.006 0.008
0.2
0.4
0.6
0.8
1.0
, s
td = 50 ms 100 250 500 1000
A(g,
)/A(0
)
A)
0.000 0.001 0.002 0.003 0.004 0.0050.0
0.2
0.4
0.6
0.8
1.0
, s
A(g,
)/A(0
)
td = 100 ms 250 500 1000)
B)
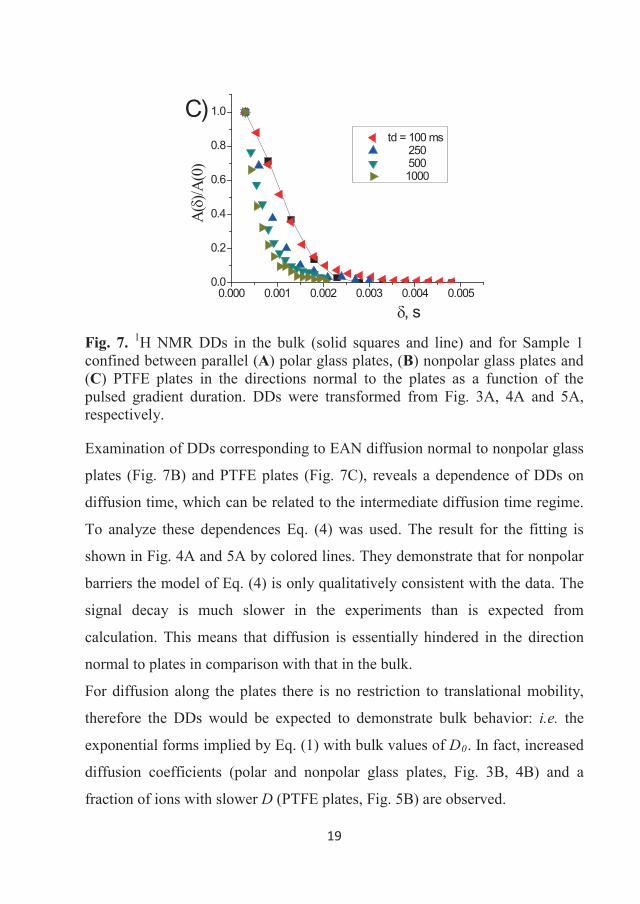
19
0.000 0.001 0.002 0.003 0.004 0.0050.0
0.2
0.4
0.6
0.8
1.0
A()/A
(0)
, s
td = 100 ms 250 500 1000
C)
Fig. 7. 1H NMR DDs in the bulk (solid squares and line) and for Sample 1 confined between parallel (A) polar glass plates, (B) nonpolar glass plates and (C) PTFE plates in the directions normal to the plates as a function of the pulsed gradient duration. DDs were transformed from Fig. 3A, 4A and 5A, respectively.
Examination of DDs corresponding to EAN diffusion normal to nonpolar glass
plates (Fig. 7B) and PTFE plates (Fig. 7C), reveals a dependence of DDs on
diffusion time, which can be related to the intermediate diffusion time regime.
To analyze these dependences Eq. (4) was used. The result for the fitting is
shown in Fig. 4A and 5A by colored lines. They demonstrate that for nonpolar
barriers the model of Eq. (4) is only qualitatively consistent with the data. The
signal decay is much slower in the experiments than is expected from
calculation. This means that diffusion is essentially hindered in the direction
normal to plates in comparison with that in the bulk.
For diffusion along the plates there is no restriction to translational mobility,
therefore the DDs would be expected to demonstrate bulk behavior: i.e. the
exponential forms implied by Eq. (1) with bulk values of D0. In fact, increased
diffusion coefficients (polar and nonpolar glass plates, Fig. 3B, 4B) and a
fraction of ions with slower D (PTFE plates, Fig. 5B) are observed.
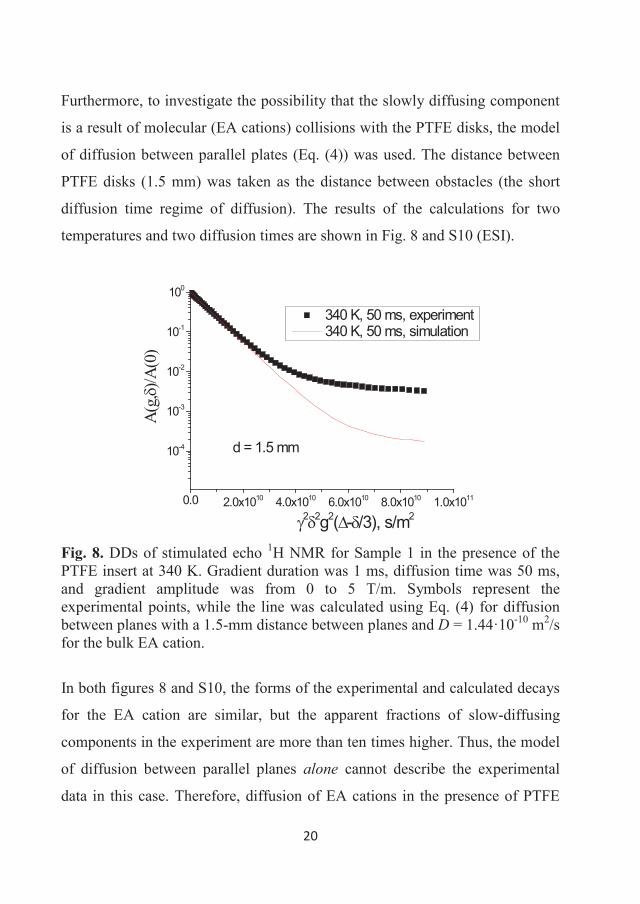
20
Furthermore, to investigate the possibility that the slowly diffusing component
is a result of molecular (EA cations) collisions with the PTFE disks, the model
of diffusion between parallel plates (Eq. (4)) was used. The distance between
PTFE disks (1.5 mm) was taken as the distance between obstacles (the short
diffusion time regime of diffusion). The results of the calculations for two
temperatures and two diffusion times are shown in Fig. 8 and S10 (ESI).
0.0 2.0x10¹⁰ 4.0x10¹⁰ 6.0x10¹⁰ 8.0x10¹⁰ 1.0x10¹¹
10-4
10-3
10-2
10-1
100
340 K, 50 ms, experiment 340 K, 50 ms, simulation
A(g
,)/A
(0)
2 2g2( - /3), s/m2
d = 1.5 mm
Fig. 8. DDs of stimulated echo 1H NMR for Sample 1 in the presence of the PTFE insert at 340 K. Gradient duration was 1 ms, diffusion time was 50 ms, and gradient amplitude was from 0 to 5 T/m. Symbols represent the experimental points, while the line was calculated using Eq. (4) for diffusion between planes with a 1.5-mm distance between planes and D = 1.44·10-10 m2/s for the bulk EA cation.
In both figures 8 and S10, the forms of the experimental and calculated decays
for the EA cation are similar, but the apparent fractions of slow-diffusing
components in the experiment are more than ten times higher. Thus, the model
of diffusion between parallel planes alone cannot describe the experimental
data in this case. Therefore, diffusion of EA cations in the presence of PTFE
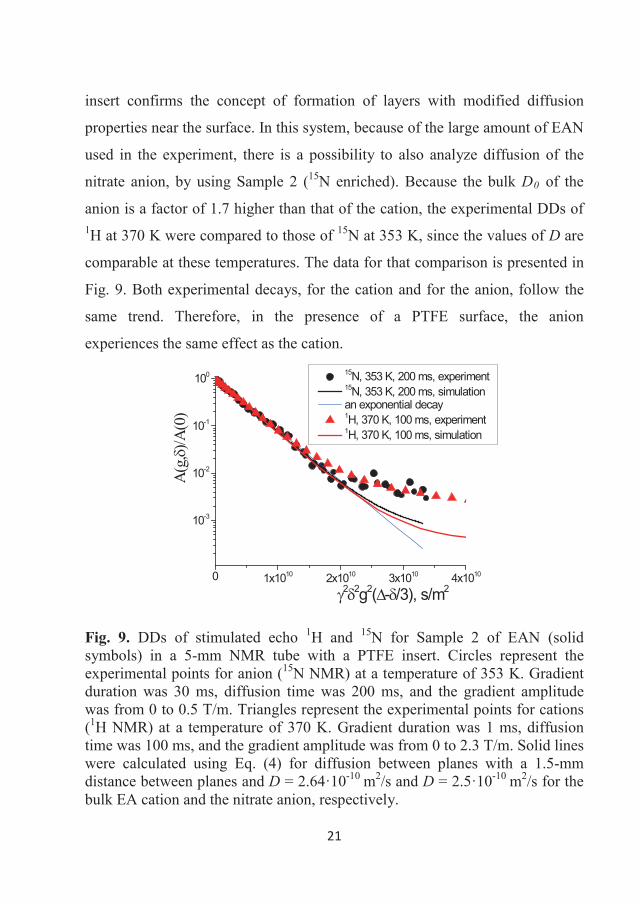
21
insert confirms the concept of formation of layers with modified diffusion
properties near the surface. In this system, because of the large amount of EAN
used in the experiment, there is a possibility to also analyze diffusion of the
nitrate anion, by using Sample 2 (15N enriched). Because the bulk D0 of the
anion is a factor of 1.7 higher than that of the cation, the experimental DDs of 1H at 370 K were compared to those of 15N at 353 K, since the values of D are
comparable at these temperatures. The data for that comparison is presented in
Fig. 9. Both experimental decays, for the cation and for the anion, follow the
same trend. Therefore, in the presence of a PTFE surface, the anion
experiences the same effect as the cation.
0 1x10¹⁰ 2x10¹⁰ 3x10¹⁰ 4x10¹⁰
10-3
10-2
10-1
100 15N, 353 K, 200 ms, experiment15N, 353 K, 200 ms, simulation an exponential decay1H, 370 K, 100 ms, experiment1H, 370 K, 100 ms, simulation
A(g
,)/A
(0)
2 2g2( - /3), s/m2
Fig. 9. DDs of stimulated echo 1H and 15N for Sample 2 of EAN (solid symbols) in a 5-mm NMR tube with a PTFE insert. Circles represent the experimental points for anion (15N NMR) at a temperature of 353 K. Gradient duration was 30 ms, diffusion time was 200 ms, and the gradient amplitude was from 0 to 0.5 T/m. Triangles represent the experimental points for cations(1H NMR) at a temperature of 370 K. Gradient duration was 1 ms, diffusion time was 100 ms, and the gradient amplitude was from 0 to 2.3 T/m. Solid lines were calculated using Eq. (4) for diffusion between planes with a 1.5-mm distance between planes and D = 2.64·10-10 m2/s and D = 2.5·10-10 m2/s for the bulk EA cation and the nitrate anion, respectively.
22
Generally, this study demonstrates that the presence of both polar (glass) as
well as nonpolar (silanized glass or PTFE) surfaces strongly influences the
diffusion of EA cation. The nitrate anion behaves in the same way as the EA
cation, at least near the PTFE surface. Presence of a solid surface induces
apparent changes in local diffusion of the IL. Because of the apparent
anisotropy of diffusion in disturbed regions (hindered normal to plates and
accelerated along the plates) it seems reasonable to suggest that EAN forms
layers near solid polar and nonpolar surfaces where diffusion is reduced in the
direction normal to the surface and can be increased along the surface. It has
earlier been shown by NMR diffusometry that silanization of porous silica
results in a significant change of the effective D for a confined IL [21]. 1-
hexyl-3methylimidazolium hexafluorophosphate demonstrated a more than 10-
fold decrease of D in polar silica pores with a mean diameter 7.5 μm, while
silanization of the silica resulted in a significant increase of D, which
approached the bulk value. Quasielastic neutron scattering studies revealed that
the diffusivity of the 1-butyl-3-methylimidazolium cation in the centre of non-
polar pores of mesoporous carbon, with a mean pore size of 8.8 nm, is faster
than that of an unconfined cation [32]. The authors ascribed this unusual
behavior to structural changes of the IL in the pores; a small-angle neutron
scattering study of the same samples substantiated a distinct change in
structure, which had the form of layers [32]. Concerning this study, it is evident
that diffusion of ions is anisotropic. This might occur if EAN form layers near
the surfaces.
23
3.5. Characteristics of self-diffusion and structure of EAN near a PTFE
surface
By making the simple assumption of homogeneity of the “non bulk-like”
material near the PTFE surface, it can be characterized by a certain thickness,
. Based on these assumptions and taking into account the apparent fraction of
the slow-diffusing components for diffusion of EA in the presence of the PTFE
insert (Fig. 6) and deviations of DDs from single-component behavior at the
diffusion of EA cation along PTFE plates (Fig. 5B), the thickness of the layer,
, is estimated to 300 nm (ESI, page ). This value much exceeds thicknesses
of previously observed solid-like layers formed by ILs near the liquid/solid
interface (~50-60 nm) [11,12]. It should be stressed that the technique is most
appropriate for the study of dynamics rather than phase separation, and the
approximations leading to this conclusion are rather simple. Nonetheless, they
are reasonably robust and an increased sophistication of the model will not
materially affect the inferred dimensions of the interfacial volume.
Confinement of water between hydrophobic surfaces leads to long-range
attractive forces, which have been measured up to distances comparable with
the dimensions quoted [33]. Nanobubbles have been observed to form on
hydrophobic surfaces in water. It is thus tempting to ascribe such interfacial
behavior to a phenomenon analogous to the hydrophobic effect in water given
the strongly hydrogen bonding nature of EAN. This would, however, be a
highly contentious issue given that the structure of water adjacent to
hydrophobic surfaces is much debated and that the distances inferred here are
far larger than the thickness of reduced density films ordinarily discussed. No
difference in dynamics was noted with pure water, indicating that if the
phenomenon is related to solvophobicity, the effects are much greater than in
water.
24
EAN has been studied by Atkin and co-workers at the air-liquid interface with
both vibrational sum frequency spectroscopy and X-ray reflectivity [34]. The
air-liquid interface can be thought of as nonpolar and might be expected to
order the ions in a similar fashion to the nonpolar surfaces employed here.
Significant interfacial structure could indeed be inferred, but the transition
from bulk structure to the interface was interpreted as occurring over an
approximately 30 Å thick layer. This is a much smaller effect than the current
measurements suggest, so this comparison would appear to be uninformative.
An additional characteristic of EA cations near a PTFE surface was determined
by analyzing the 1H NMR spectrum shape corresponding to the EA cations,
which contribute to the slow-diffusing component (discussed in ESI). It was
shown that in the reduced diffusion state (near the surface of PTFE), the local
mobility (rotational mobility) of the chemical groups of EA cations are also
reduced.
4. Conclusion
Self-diffusion of ions in the protic ionic liquid ethylammonium nitrate was
studied in the range 294 - 393 K in bulk as well as confined between polar and
silanized glass plates, and between PTFE plates. Diffusion coefficients of the
anion are a factor of 1.7 higher than that of the cation, which is in agreement
with a concept of separate diffusion of the cation and anion; thus entirely
supports the earlier suggested bi-continuous bulk phase of EAN [9,18]. The
presence of solid surfaces induces regions of EAN in their vicinity where
diffusion may be increased or hindered in different degrees dependent on
polarity of the surface that agrees with earlier findings for other ionic liquids
inside mesopores and macropores [21,32]. Diffusion of a fraction of EAN may
increase along the surface and always hindered in the normal direction even a
surfaces spacing is as much as 1.5 mm. This observation was explained by the
25
formation of layers of the IL near surfaces with different structure to the bulk.
Surface layers of ILs with wideness from 0.8 to 50 nm were reported before
[10-12], but for EAN near PTFE an enormous width of the layer estimated as
300 nm was detected for the first time. 1H NMR spectrum line-shape analysis
showed that local mobility of EA cation in this surface layer near PTFE is also
reduced.
While the implied dimensions of the boundary or confined films are
unexpectedly large, and by no means precise, the observation of different
regions is unambiguous and has important implications for the use of ILs in
surface intensive applications or under confinement such as lubrication and
electrochemistry.
Acknowledgements
The Knut and Alice Wallenberg foundation (project number KAW 2012.0078)
and the Swedish Research Council (project numbers 621-2013-5171 (OA),
621-2011-4600 and 621-2014-4694 (SG), 621-2011-4361 (MR)) are gratefully
acknowledged for their financial support. The Foundation in memory of J. C.
and Seth M. Kempe is gratefully acknowledged for providing grants, from
which NMR equipment and probes at LTU have been purchased. NMR
measurements were partly carried out on the equipment of the Federal Centre
of Collective Facilities of Kazan Federal University, Russia.
References
[1] T.L. Greaves, C.J. Drummond, Chem. Rev. 108 (2008) 206-237.
[2] R.D. Rogers, K.R. Seddon, Science 302(2003) 792-793.
[3] C. Zhao, G.T. Burrell, A.A.J. Torriero, F. Separovic, N.F. Dunlop, D.R.
MacFarlane, A.M. Bond, J. Phys. Chem. B 113 (2008) 6923-6936.
26
[4] M. Lazzari, M. Mastragostino, F. Soavi, Electrochem. Commun. 9 (2007)
1567-1572.
[5] J.A. Garlitz, C.A. Summers, R.A. Flowers II, G.E.O. Borgstahl, Acta
Cryst. D 55 (1999) 2037-2038.
[6] F.U. Shah, S. Glavatskih, O.N. Antzutkin, Tribol. Lett. 51 (2013) 281-
301.
[7] P. Walden, Bull. Acad. Imp. Sci. St Petersburg 8 (1914) 405-422.
[8] H.J. Jiang, P.A. FitzGerald, A. Dolan, R. Atkin, G.G. Warr, J. Phys.
Chem. B 118 (2014) 9983-9990.
[9] R. Atkin, G.G. Warr, J. Phys. Chem. B 112 (2008) 4164-4166.
[10] E. Sloutskin, B.M. Ocko, L. Tamam, I. Kuzmenko, T. Gog, M. Deutsch,
J. Am. Chem. Soc. 21 (2005) 7796-7804.
[11] S. Bovio, A. Podesta, C. Lenardi, P. Milani, J. Phys. Chem. B 113 (2009)
6600-6603.
[12] L.A. Jurado, H. Kim, A. Arcifa, A. Rossi, C. Leal, N.D. Spencer, R.M.
Espinosa-Marzal, Phys. Chem. Chem. Phys. 17 (2015) 13613-13624.
[13] M. Taher, F.U. Shah, A. Filippov, P. de Baets, S. Glavatskih, O.N.
Antzutkin, RSC Adv. 4 (2014) 30617-30623.
[14] A. Filippov, F.U. Shah, M. Taher, S. Glavatskih, O.N. Antzutkin, Phys.
Chem. Chem. Phys. 15 (2013) 9281-9287.
[15] R. Giernoth, Topics Curr. Chem. 290 (2010) 263-283.
[16] H. Li, In: Structures and Interactions of Ionic Liquids; S. Zhang, J.
Wang, Q. Zhao, Q. Zhou, (Eds.) Springer: Book Series: Structure and
Bonding, 151 (2014) 175-193.
[17] H. Tokuda, K. Hayamizu, K. Ishii, A.B.H. Susan, M. Watanabe, J. Phys.
Chem. B 109 (2005) 6103-6110.
27
[18] A.E. Frise, T. Ichikawa, M. Yoshio, H. Ohno, S.V. Dvinskikh, T. Kato, I.
Furo, Chem. Commun. 46 (2010) 728-730.
[19] H. Walderhaug, O. Soderman, D. Topgaard, Prog. Nucl. Magn. Reson.
Spectrosc. 56 (2010) 406-425.
[20] A. Filippov, B. Munavirov, T. Sparrman, V. Ishmuhametova, M.
Rudakova, P. Shriram, S. Tavelin, Langmuir 27 (2011) 3754-3761.
[21] C. Iacob, J.R. Sangoro, P. Papadopoulus, T. Schubert, S. Naumov, R.
Valiullin, J. Kärger, F. Kremer, Phys. Chem. Chem. Phys. 12 (2010)
13798-13803.
[22] M. Levitt, Spin Dynamics. Basics of Nuclear Magnetic Resonance (2nd
Ed); Wiley & Sons; New York, 2008.
[23] D.F. Evans, A. Yamauchi, R. Roman, E.Z. Casassa, J. Colloid Interf. Sci.
88 (1982) 89-96.
[24] C.F. Poole, B.R. Kersten, S.S.J. Ho, M.E. Coddens, K.G. Furton, J.
Chromatogr. A 352 (1986) 407-425.
[25] P.T. Callaghan, Principles of Nuclear Magnetic Resonance Microscopy;
Clarendon; Oxford, 1991.
[26] J.E. Tanner, J. Chem. Phys. 52 (1970) 2523-2526.
[27] J.C. Thater, V. Gerard, C. Stubenrauch, Langmuir 30 (2014) 8283-8289.
[28] F.A. Bovey, Nuclear Magnetic Resonance Spectroscopy (2nd Ed.)
Academic Press; New York, 1988.
[29] P.T. Callaghan J. Stepishnik, in «Advances in Magnetic and Optical
Resonance» (W. S. Warren, Ed.), vol. 19, pp. 326-389. Academic Press;
San Diego, 1996.
[30] P. Linse, O. Söderman, J. Magn. Reson. A 116 (1995) 77-86.
[31] P.T. Callaghan, A. Coy, D. MacGowan, K.J. Packer, F.O. Zelaya, Nature
351 (1991) 467-469.
28
[32] S.M. Chathoth, E. Mamontov, P.F. Fulvio, X. Wang, G.A. Baker, S. Dai,
D.J. Wesolowski, Europhys. Lett. 102 (2013) 16004.
[33] A. Carambassis, L.C. Jonker, P. Attard, M.W. Rutland, Phys. Rev. Lett.
80 (1998) 5357-5360.
[34] P. Niga, D. Wakeham, A. Nelson, G.G. Warr, M. Rutland, R. Atkin,
Langmuir 26 (2010) 8282-8288.
29
Electronic Supplementary Information
Long-range dynamics for ethylammonium nitrate in
bulk and in confinement
Andrei Filippov,a,b,* Oleg I. Gnezdilov,b Nicklas Hjalmarsson,c Oleg N.
Antzutkin,a
Sergei Glavatskih,d,e and Mark W. Rutlandc,f
aChemistry of Interfaces, Luleå University of Technology, SE-97187 Luleå, SwedenbInstitute of Physics, Kazan Federal University, 420008 Kazan, RussiacSurface and Corrosion Science, KTH Royal Institute of Technology, SE-10044
Stockholm, SwedendSystem and Component Design, KTH Royal Institute of Technology, SE-10044
Stockholm, SwedeneDepartment of Mechanical Construction and Production, Ghent University,
B-9000 Ghent, BelgiumfSP Technical Research Institute of Sweden, Chemistry Materials and Surfaces, Box
5607, SE-114 86 Stockholm, Sweden
Synthesis. Ethyl ammonium nitrate (EAN) was synthesized by mixing a slight
excess of ethylamine (66 wt%, Sigma Aldrich, Germany) with concentrated
nitric acid (70 wt%, Sigma Aldrich, Germany) in water. The nitric acid was
added drop-wise to a cooled (<10°C to prevent nitric oxides forming) and
constantly agitated solution of ethylamine until the reaction was complete (~2
h). To remove the water, rotary evaporation was used at 50°C for 2 h.
However, as this does not remove all the water the solution is then purged with
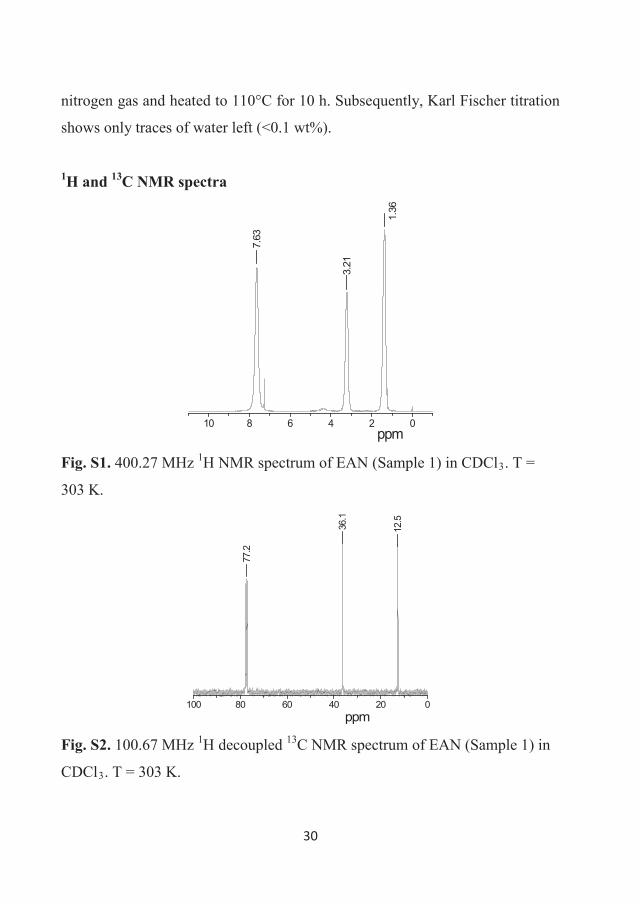
30
nitrogen gas and heated to 110°C for 10 h. Subsequently, Karl Fischer titration
shows only traces of water left (<0.1 wt%).
1H and 13C NMR spectra
10 8 6 4 2 0
1.36
3.21
ppm
7.63
Fig. S1. 400.27 MHz 1H NMR spectrum of EAN (Sample 1) in CDCl3. T =
303 K.
100 80 60 40 20 0ppm
77.2
36.1
12.5
Fig. S2. 100.67 MHz 1H decoupled 13C NMR spectrum of EAN (Sample 1) in
CDCl3. T = 303 K.
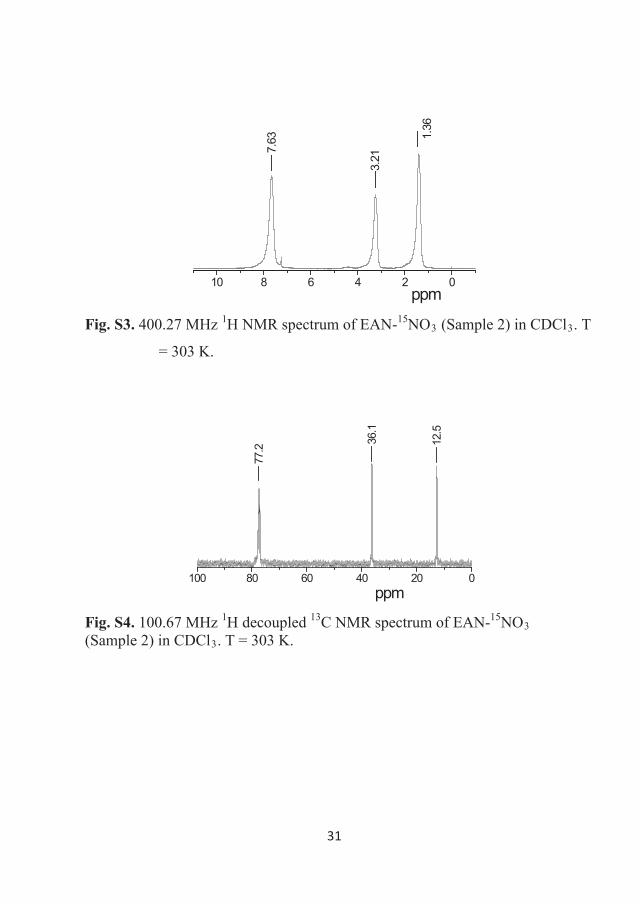
31
10 8 6 4 2 0
1.36
3.21
ppm7.
63
Fig. S3. 400.27 MHz 1H NMR spectrum of EAN-15NO3 (Sample 2) in CDCl3. T
= 303 K.
100 80 60 40 20 0ppm
77.2
36.1
12.5
Fig. S4. 100.67 MHz 1H decoupled 13C NMR spectrum of EAN-15NO3(Sample 2) in CDCl3. T = 303 K.
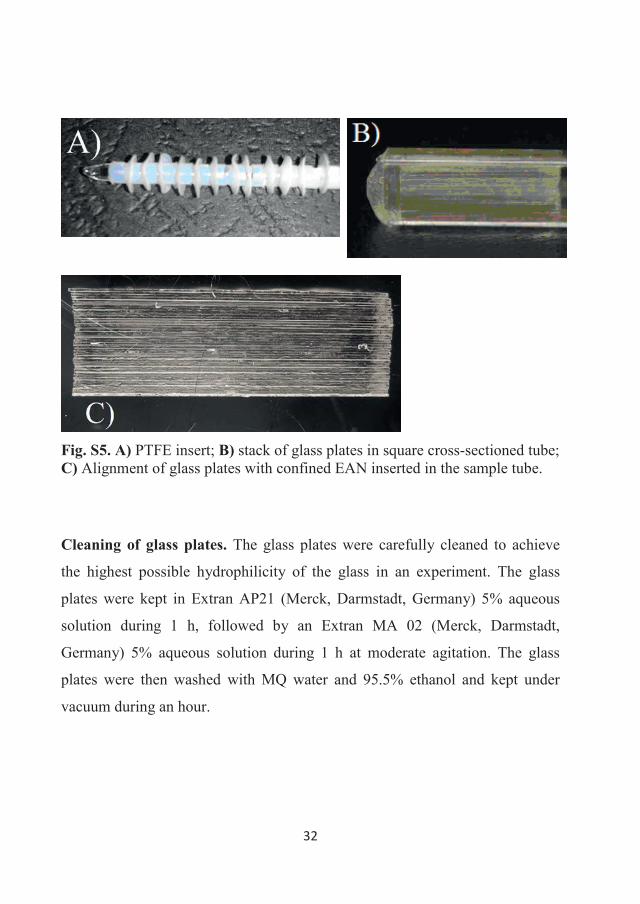
32
Fig. S5. A) PTFE insert; B) stack of glass plates in square cross-sectioned tube; C) Alignment of glass plates with confined EAN inserted in the sample tube.
Cleaning of glass plates. The glass plates were carefully cleaned to achieve
the highest possible hydrophilicity of the glass in an experiment. The glass
plates were kept in Extran AP21 (Merck, Darmstadt, Germany) 5% aqueous
solution during 1 h, followed by an Extran MA 02 (Merck, Darmstadt,
Germany) 5% aqueous solution during 1 h at moderate agitation. The glass
plates were then washed with MQ water and 95.5% ethanol and kept under
vacuum during an hour.
33
Silanization of glass plates. The glass plates were silanized to increase the
hydrophobicity of the glass in one experiment. A silanization solution (~5% of
dimethyldichlorosilane in heptane) from Sigma Aldrich (Germany) was used.
The glass plates were washed with 99.7% ethanol before silanization to remove
surface impurities and surface water. Traces of ethanol were then removed by
vacuum pumping at 5·10-2 mbar for 3 hours. The silanization reaction was
performed overnight (ca 14 hours). Unreacted reagent was then removed by
washing in acetone with subsequent removal of traces of acetone by vacuum
pumping.
Contact angle measurements. The contact angle was measured using a pocket
goniometer (PG-X, FIBRO System AB, Sweden) at room temperature (21 °C)
and calculated using the associated software. The liquid is pumped from a
reservoir to a needle that squeezes out small uniform drops of a selected size
onto the designated substrate. The substrate was rinsed with acetone and dried
with N2 gas prior to use. All contact angles where measured at least twice on
both sides of each substrate and on two different surfaces of each substrate.
The contact angle was measured using water (Milli-Q) to verify the
hydrophobicity of each substrate. The cleaned glass surface had a contact angle
near 0°, the silanized glass sample between 91° and 96°, and the PTFE ~105°.
Therefore, cleaned and silanized glasses will henceforth be referred to as polar
and nonpolar, respectively. Preparation of samples (filling with EAN) was
performed immediately after cleaning or silanization procedure.
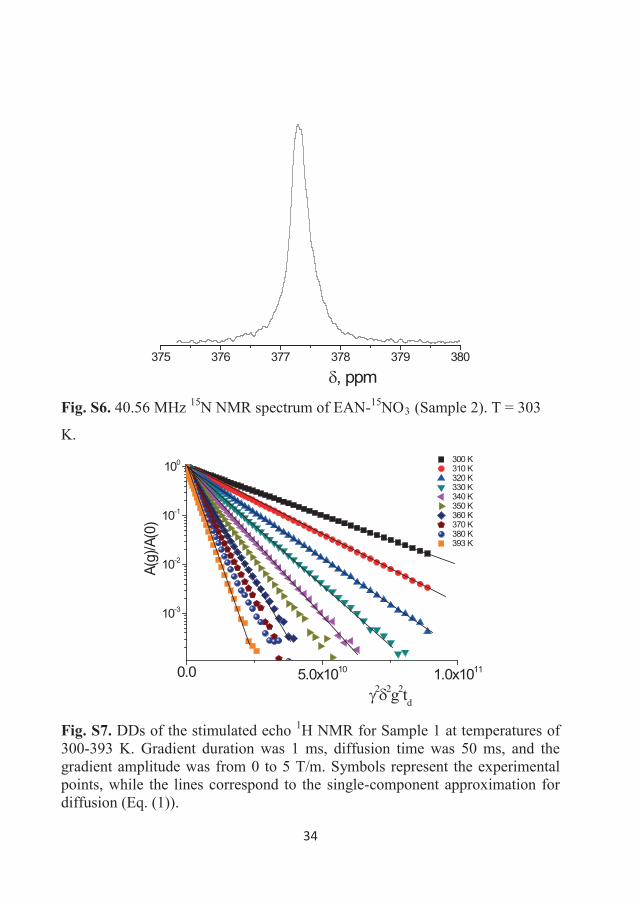
34
375 376 377 378 379 380
, ppm
Fig. S6. 40.56 MHz 15N NMR spectrum of EAN-15NO3 (Sample 2). T = 303
K.
0.0 5.0x10¹⁰ 1.0x10¹¹
10-3
10-2
10-1
100 300 K 310 K 320 K 330 K 340 K 350 K 360 K 370 K 380 K 393 K
A(g)
/A(0
)
2 2g2td
Fig. S7. DDs of the stimulated echo 1H NMR for Sample 1 at temperatures of 300-393 K. Gradient duration was 1 ms, diffusion time was 50 ms, and the gradient amplitude was from 0 to 5 T/m. Symbols represent the experimental points, while the lines correspond to the single-component approximation for diffusion (Eq. (1)).
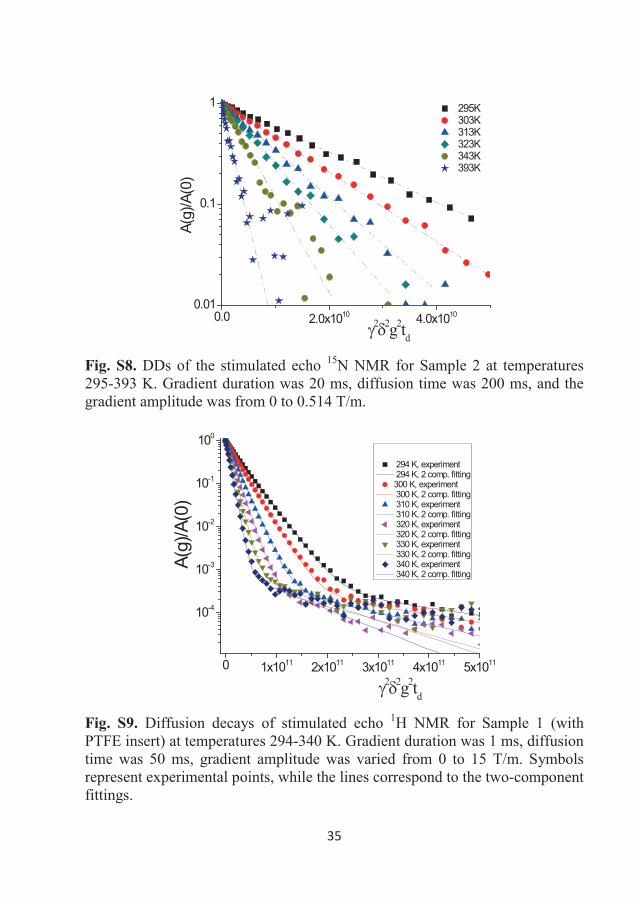
35
0.0 2.0x10¹⁰ 4.0x10100.01
0.1
1
2 2g2td
A(g)
/A(0
)
295K303K313K323K343K393K
Fig. S8. DDs of the stimulated echo 15N NMR for Sample 2 at temperatures 295-393 K. Gradient duration was 20 ms, diffusion time was 200 ms, and the gradient amplitude was from 0 to 0.514 T/m.
0 1x10¹¹ 2x10¹¹ 3x10¹¹ 4x10¹¹ 5x10¹¹
10-4
10-3
10-2
10-1
100
294 K, experiment 294 K, 2 comp. fitting300 K, experiment 300 K, 2 comp. fitting 310 K, experiment 310 K, 2 comp. fitting 320 K, experiment 320 K, 2 comp. fitting 330 K, experiment 330 K, 2 comp. fitting 340 K, experiment 340 K, 2 comp. fitting
A(g)
/A(0
)
2 2g2tdFig. S9. Diffusion decays of stimulated echo 1H NMR for Sample 1 (with PTFE insert) at temperatures 294-340 K. Gradient duration was 1 ms, diffusion time was 50 ms, gradient amplitude was varied from 0 to 15 T/m. Symbols represent experimental points, while the lines correspond to the two-component fittings.
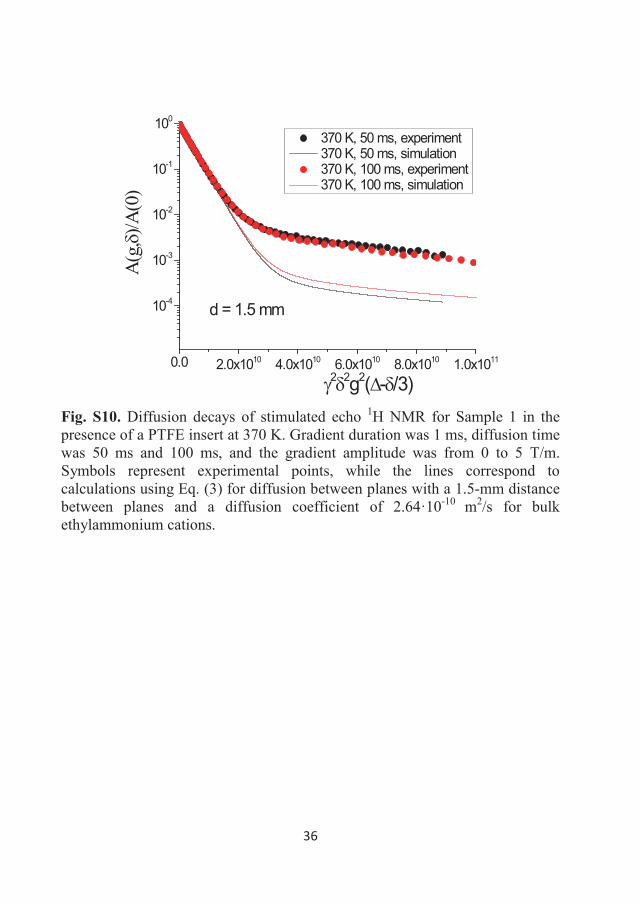
36
0.0 2.0x10¹⁰ 4.0x10¹⁰ 6.0x10¹⁰ 8.0x10¹⁰ 1.0x10¹¹
10-4
10-3
10-2
10-1
100
370 K, 50 ms, experiment 370 K, 50 ms, simulation 370 K, 100 ms, experiment 370 K, 100 ms, simulation
A(g
,)/A
(0)
2 2g2( - /3)
d = 1.5 mm
Fig. S10. Diffusion decays of stimulated echo 1H NMR for Sample 1 in the presence of a PTFE insert at 370 K. Gradient duration was 1 ms, diffusion time was 50 ms and 100 ms, and the gradient amplitude was from 0 to 5 T/m. Symbols represent experimental points, while the lines correspond to calculations using Eq. (3) for diffusion between planes with a 1.5-mm distance between planes and a diffusion coefficient of 2.64·10-10 m2/s for bulk ethylammonium cations.
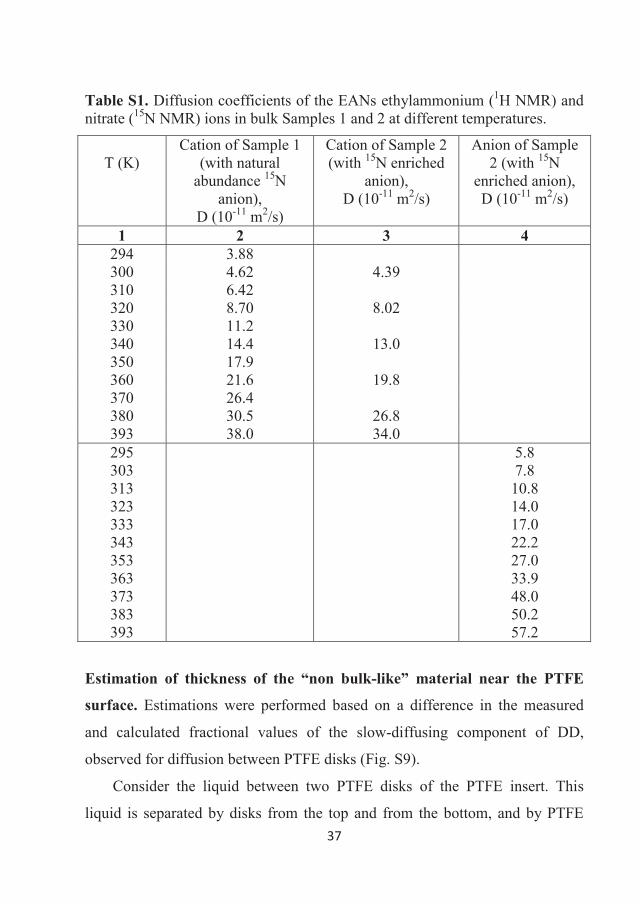
37
Table S1. Diffusion coefficients of the EANs ethylammonium (1H NMR) and nitrate (15N NMR) ions in bulk Samples 1 and 2 at different temperatures.
T (K)Cation of Sample 1
(with natural abundance 15N
anion),D (10-11 m2/s)
Cation of Sample 2 (with 15N enriched
anion), D (10-11 m2/s)
Anion of Sample 2 (with 15N
enriched anion),D (10-11 m2/s)
1 2 3 4294 3.88300 4.62 4.39310 6.42320 8.70 8.02330 11.2340 14.4 13.0350 17.9360 21.6 19.8370 26.4380 30.5 26.8393 38.0 34.0295303313323333343353363373383393
5.87.8
10.814.017.022.227.033.948.050.257.2
Estimation of thickness of the “non bulk-like” material near the PTFE
surface. Estimations were performed based on a difference in the measured
and calculated fractional values of the slow-diffusing component of DD,
observed for diffusion between PTFE disks (Fig. S9).
Consider the liquid between two PTFE disks of the PTFE insert. This
liquid is separated by disks from the top and from the bottom, and by PTFE
38
stem in the center. The disks are separated by 1.5 mm and have external
diameter 3.8 mm, while the stem has a diameter of 1.5 mm. Thus, the volume
of the liquid is V = 0.0143 cm3, while the surface of disks and stem is S =
0.262 cm2. The volume fraction of the “non bulk-like” material is the product
of and the surface area of PTFE, therefore its volume fraction is
which is equal to the difference of slow-diffusion component observed in Fig.
cm » 0.000032 cm = 320 nm.
Local mobility of EA cations near a PTFE surface
An additional characteristic of EA cations near a PTFE surface was determined
by analyzing the 1H NMR spectrum shape corresponding to the EA cations,
which contribute to the slow-diffusing component. Fig. S11 shows the change
in the 1H NMR spectrum at different factors of decay corresponding to the DD
at 350 K, presented in Fig. 6 (red stars). At small values of PFG (initial part of
the DD), the spectrum contains the contribution of the bulk EA cation fraction,
while at factors of decay less than 0.01, the signal from the bulk EA cation is
almost completely suppressed and only the signal (and spectrum) from the
slow-diffusing component is observed. Fig. S11 shows that the spectrum
begins to change at a factor of decay of 0.04 (blue line) and continues to
change as long as the factor of decay decreases. During this process of change,
the resonance line corresponding to the –NH3+ group decreases in relative
intensity, while resonance lines corresponding to –NH3+ and –CH3 groups
become broader. The line corresponding to the –CH2– group is unclear. Taken
together, this means that in the reduced diffusion state (near the surface of
PTFE), the local mobility (rotational mobility) of the chemical groups of EA
cations are also reduced.
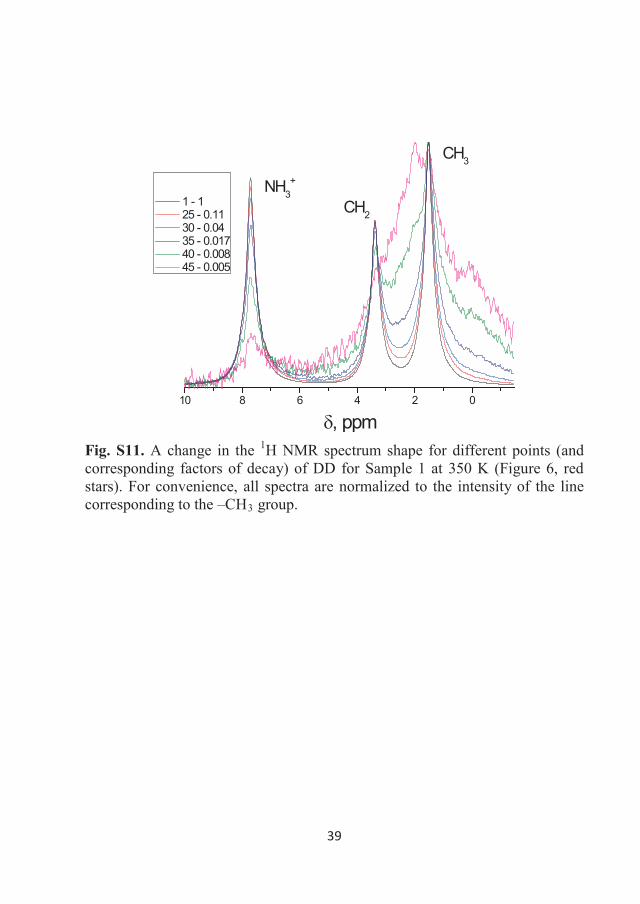
39
10 8 6 4 2 0
CH3
CH2
NH3+
, ppm
1 - 1 25 - 0.11 30 - 0.04 35 - 0.017 40 - 0.008 45 - 0.005
Fig. S11. A change in the 1H NMR spectrum shape for different points (and corresponding factors of decay) of DD for Sample 1 at 350 K (Figure 6, red stars). For convenience, all spectra are normalized to the intensity of the line corresponding to the –CH3 group.


Article II

This journal is c the Owner Societies 2013 Phys. Chem. Chem. Phys., 2013, 15, 9281--9287 9281
Cite this: Phys. Chem.Chem.Phys.,2013,15, 9281
NMR self-diffusion study of a phosphoniumbis(mandelato)borate ionic liquid
Andrei Filippov,*ab Faiz Ullah Shah,a Mamoun Taher,a Sergei Glavatskihcd andOleg N. Antzutkinae
Newly synthesised halogen-free boron based ionic liquids (hf-BILs) composed of chelated orthoborate
anions and phosphonium cations have hydrolytic stability, low melting point and outstanding wear and
friction reducing properties. We report here the peculiarities of self-diffusion in one representative from this
class, trihexyltetradecylphosphonium bis(mandelato)borate, [P6,6,6,14][BMB], in the temperature range of its
practical interest, 20–100 1C. NMR techniques demonstrated complicated diffusional behaviour – the ionic
liquid can exist in one or two liquid ‘‘phases’’. In the low-temperature range (20–50 1C), two phases coexist
where the cations, [P6,6,6,14], are contained mainly in the phase with slower diffusion coefficients while the
anions, [BMB], are in the phase with faster diffusion coefficients. Cations have lower diffusion coefficients
with a factor of 20 as compared with the anions, an effect which is caused by aggregation of cations into
domains due to so-called ‘‘hydrophobic interaction’’ of their hydrocarbon chains. As the temperature rises
above 60 1C, the two phases merge into one where both ions have equal diffusion coefficients. This is
caused by thermal motion making the cation domains smaller in size and more easily interacting with
anions. As a result, anions and cations diffuse in this high-temperature range as a pair.
1. Introduction
Ionic liquids are salts that reside in the liquid state at tem-peratures below 100 1C. Therefore, they are electrolytes undernormal conditions (room temperature, 1 atm pressure) and canbe used in many applications in technology and medicine.1
Newly synthesised halogen-free boron based ionic liquids (hf-BILs)composed of chelated orthoborate anions and phosphoniumcations have hydrolytic stability, lowmelting point and outstandingwear and friction reducing properties.2 Lubrication is known todepend on molecular motion in liquid or semi-liquid layersbetween interacting surfaces, consequently local mobility andtranslational motion (diffusion) are key phenomena for under-standing molecular mechanisms of lubricant action.3 Numerousmethods can be used to study molecular mobility; however,NMR is an exceptionally informative technique for studying local
molecular motion and translational diffusion coefficients.4
It can be used to study the local mobility of molecules and ions(by analysing NMR relaxation times), as well as to study transla-tional diffusion, which is particularly important for ionic liquids.The application of NMR to examine ionic liquid diffusion hasbeen demonstrated in a number of previous studies whereproton pulsed field gradient spin-echo and stimulated echo havebeen used.5–10
The purpose of this work was to study the mobility of cationsand anions in one of the representative hf-BILs, trihexyltetra-decylphosphonium bis(mandelato)borate, [P6,6,6,14][BMB], inthe temperature range of its practical importance. The selectedionic liquid has good potential to reduce both wear and frictionat steel–aluminium contacts.2 This ionic liquid contains aphosphorous nucleus in the cation, a boron nucleus in theanion, and protons in both ionic components. Therefore,multinuclear (1H, 31P) NMR is thought to have an advantagein the selective measurements. We applied 1H NMR and 31PNMR to study diffusion of the cation in this hf-BIL separately.
2. Experimental section2.1 Synthesis and structure of the ionic liquid
We studied the ionic liquid [P6,6,6,14][BMB]. The structure of theions is shown in Fig. 1. Synthesis, separation, purification and
a Chemistry of Interfaces, Luleå University of Technology, SE-91187 Luleå, Sweden.
E-mail: [email protected]; Tel: +46 920491839b Kazan (Volga Region) Federal University, Kremlevskaya Str., 18, 420008, Kazan,
Russiac System and Component Design, KTH Royal Institute of Technology,
SE-10044 Stockholm, Swedend Department of Mechanical Construction and Production, Ghent University,
B-9052 Zwijnaarde, Belgiume Department of Physics, Warwick University, CV4 7AL, Coventry, UK
Received 14th March 2013,Accepted 18th April 2013
DOI: 10.1039/c3cp51132d
www.rsc.org/pccp
PCCP
PAPER
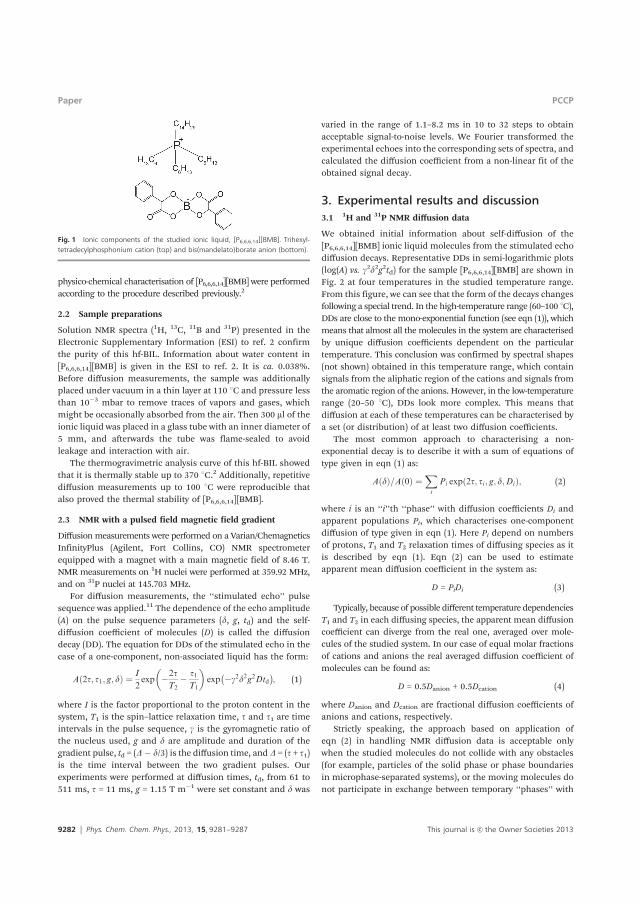
9282 Phys. Chem. Chem. Phys., 2013, 15, 9281--9287 This journal is c the Owner Societies 2013
physico-chemical characterisation of [P6,6,6,14][BMB] were performedaccording to the procedure described previously.2
2.2 Sample preparations
Solution NMR spectra (1H, 13C, 11B and 31P) presented in theElectronic Supplementary Information (ESI) to ref. 2 confirmthe purity of this hf-BIL. Information about water content in[P6,6,6,14][BMB] is given in the ESI to ref. 2. It is ca. 0.038%.Before diffusion measurements, the sample was additionallyplaced under vacuum in a thin layer at 110 1C and pressure lessthan 10�3 mbar to remove traces of vapors and gases, whichmight be occasionally absorbed from the air. Then 300 ml of theionic liquid was placed in a glass tube with an inner diameter of5 mm, and afterwards the tube was flame-sealed to avoidleakage and interaction with air.
The thermogravimetric analysis curve of this hf-BIL showedthat it is thermally stable up to 370 1C.2 Additionally, repetitivediffusion measurements up to 100 1C were reproducible thatalso proved the thermal stability of [P6,6,6,14][BMB].
2.3 NMR with a pulsed field magnetic field gradient
Diffusionmeasurements were performed on a Varian/ChemagneticsInfinityPlus (Agilent, Fort Collins, CO) NMR spectrometerequipped with a magnet with a main magnetic field of 8.46 T.NMR measurements on 1H nuclei were performed at 359.92 MHz,and on 31P nuclei at 145.703 MHz.
For diffusion measurements, the ‘‘stimulated echo’’ pulsesequence was applied.11 The dependence of the echo amplitude(A) on the pulse sequence parameters (d, g, td) and the self-diffusion coefficient of molecules (D) is called the diffusiondecay (DD). The equation for DDs of the stimulated echo in thecase of a one-component, non-associated liquid has the form:
A 2t; t1; g; dð Þ ¼ I
2exp �2t
T2� t1T1
� �exp �g2d2g2Dtd
� �; (1)
where I is the factor proportional to the proton content in thesystem, T1 is the spin–lattice relaxation time, t and t1 are timeintervals in the pulse sequence, g is the gyromagnetic ratio ofthe nucleus used, g and d are amplitude and duration of thegradient pulse, td = (D� d/3) is the diffusion time, and D = (t + t1)is the time interval between the two gradient pulses. Ourexperiments were performed at diffusion times, td, from 61 to511 ms, t = 11 ms, g = 1.15 T m�1 were set constant and d was
varied in the range of 1.1–8.2 ms in 10 to 32 steps to obtainacceptable signal-to-noise levels. We Fourier transformed theexperimental echoes into the corresponding sets of spectra, andcalculated the diffusion coefficient from a non-linear fit of theobtained signal decay.
3. Experimental results and discussion3.1 1H and 31P NMR diffusion data
We obtained initial information about self-diffusion of the[P6,6,6,14][BMB] ionic liquid molecules from the stimulated echodiffusion decays. Representative DDs in semi-logarithmic plots(log(A) vs. g2d2g2td) for the sample [P6,6,6,14][BMB] are shown inFig. 2 at four temperatures in the studied temperature range.From this figure, we can see that the form of the decays changesfollowing a special trend. In the high-temperature range (60–100 1C),DDs are close to the mono-exponential function (see eqn (1)), whichmeans that almost all the molecules in the system are characterisedby unique diffusion coefficients dependent on the particulartemperature. This conclusion was confirmed by spectral shapes(not shown) obtained in this temperature range, which containsignals from the aliphatic region of the cations and signals fromthe aromatic region of the anions. However, in the low-temperaturerange (20–50 1C), DDs look more complex. This means thatdiffusion at each of these temperatures can be characterised bya set (or distribution) of at least two diffusion coefficients.
The most common approach to characterising a non-exponential decay is to describe it with a sum of equations oftype given in eqn (1) as:
AðdÞ=Að0Þ ¼Xi
Pi exp 2t; ti; g; d;Dið Þ; (2)
where i is an ‘‘i’’th ‘‘phase’’ with diffusion coefficients Di andapparent populations Pi, which characterises one-componentdiffusion of type given in eqn (1). Here Pi depend on numbersof protons, T1 and T2 relaxation times of diffusing species as itis described by eqn (1). Eqn (2) can be used to estimateapparent mean diffusion coefficient in the system as:
D = PiDi (3)
Typically, because of possible different temperature dependenciesT1 and T2 in each diffusing species, the apparent mean diffusioncoefficient can diverge from the real one, averaged over mole-cules of the studied system. In our case of equal molar fractionsof cations and anions the real averaged diffusion coefficient ofmolecules can be found as:
D = 0.5Danion + 0.5Dcation (4)
where Danion and Dcation are fractional diffusion coefficients ofanions and cations, respectively.
Strictly speaking, the approach based on application ofeqn (2) in handling NMR diffusion data is acceptable onlywhen the studied molecules do not collide with any obstacles(for example, particles of the solid phase or phase boundariesin microphase-separated systems), or the moving molecules donot participate in exchange between temporary ‘‘phases’’ with
Fig. 1 Ionic components of the studied ionic liquid, [P6,6,6,14][BMB]. Trihexyl-tetradecylphosphonium cation (top) and bis(mandelato)borate anion (bottom).
Paper PCCP
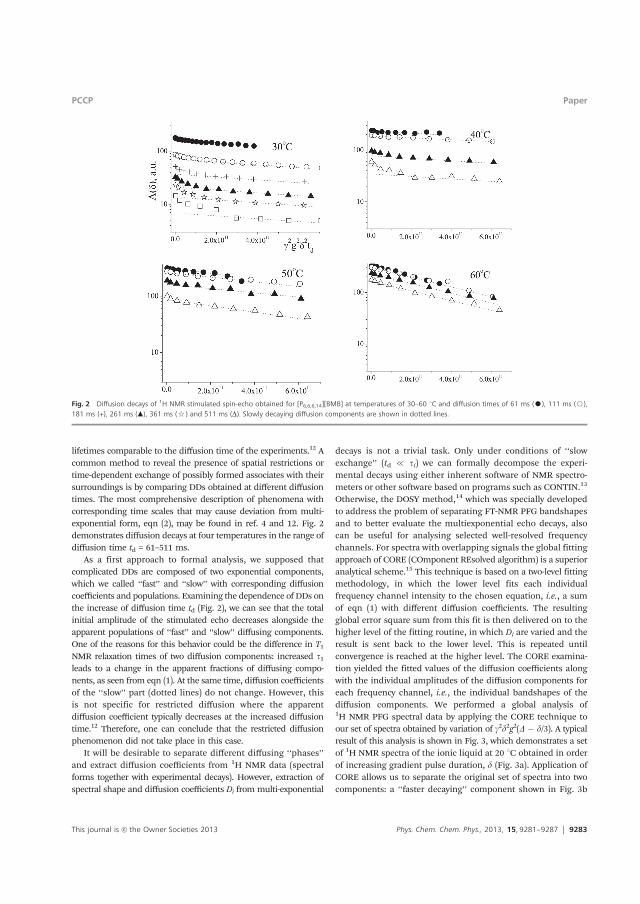
This journal is c the Owner Societies 2013 Phys. Chem. Chem. Phys., 2013, 15, 9281--9287 9283
lifetimes comparable to the diffusion time of the experiments.12 Acommon method to reveal the presence of spatial restrictions ortime-dependent exchange of possibly formed associates with theirsurroundings is by comparing DDs obtained at different diffusiontimes. The most comprehensive description of phenomena withcorresponding time scales that may cause deviation from multi-exponential form, eqn (2), may be found in ref. 4 and 12. Fig. 2demonstrates diffusion decays at four temperatures in the range ofdiffusion time td = 61–511 ms.
As a first approach to formal analysis, we supposed thatcomplicated DDs are composed of two exponential components,which we called ‘‘fast’’ and ‘‘slow’’ with corresponding diffusioncoefficients and populations. Examining the dependence of DDs onthe increase of diffusion time td (Fig. 2), we can see that the totalinitial amplitude of the stimulated echo decreases alongside theapparent populations of ‘‘fast’’ and ‘‘slow’’ diffusing components.One of the reasons for this behavior could be the difference in T1NMR relaxation times of two diffusion components: increased t1leads to a change in the apparent fractions of diffusing compo-nents, as seen from eqn (1). At the same time, diffusion coefficientsof the ‘‘slow’’ part (dotted lines) do not change. However, thisis not specific for restricted diffusion where the apparentdiffusion coefficient typically decreases at the increased diffusiontime.12 Therefore, one can conclude that the restricted diffusionphenomenon did not take place in this case.
It will be desirable to separate different diffusing ‘‘phases’’and extract diffusion coefficients from 1H NMR data (spectralforms together with experimental decays). However, extraction ofspectral shape and diffusion coefficients Di from multi-exponential
decays is not a trivial task. Only under conditions of ‘‘slowexchange’’ (td { ti) we can formally decompose the experi-mental decays using either inherent software of NMR spectro-meters or other software based on programs such as CONTIN.13
Otherwise, the DOSY method,14 which was specially developedto address the problem of separating FT-NMR PFG bandshapesand to better evaluate the multiexponential echo decays, alsocan be useful for analysing selected well-resolved frequencychannels. For spectra with overlapping signals the global fittingapproach of CORE (COmponent REsolved algorithm) is a superioranalytical scheme.15 This technique is based on a two-level fittingmethodology, in which the lower level fits each individualfrequency channel intensity to the chosen equation, i.e., a sumof eqn (1) with different diffusion coefficients. The resultingglobal error square sum from this fit is then delivered on to thehigher level of the fitting routine, in which Di are varied and theresult is sent back to the lower level. This is repeated untilconvergence is reached at the higher level. The CORE examina-tion yielded the fitted values of the diffusion coefficients alongwith the individual amplitudes of the diffusion components foreach frequency channel, i.e., the individual bandshapes of thediffusion components. We performed a global analysis of1H NMR PFG spectral data by applying the CORE technique toour set of spectra obtained by variation of g2d2g2(D � d/3). A typicalresult of this analysis is shown in Fig. 3, which demonstrates a setof 1H NMR spectra of the ionic liquid at 20 1C obtained in orderof increasing gradient pulse duration, d (Fig. 3a). Application ofCORE allows us to separate the original set of spectra into twocomponents: a ‘‘faster decaying’’ component shown in Fig. 3b
Fig. 2 Diffusion decays of 1H NMR stimulated spin-echo obtained for [P6,6,6,14][BMB] at temperatures of 30–60 1C and diffusion times of 61 ms (K), 111 ms (J),181 ms (+), 261 ms (m), 361 ms ($) and 511 ms (D). Slowly decaying diffusion components are shown in dotted lines.
PCCP Paper
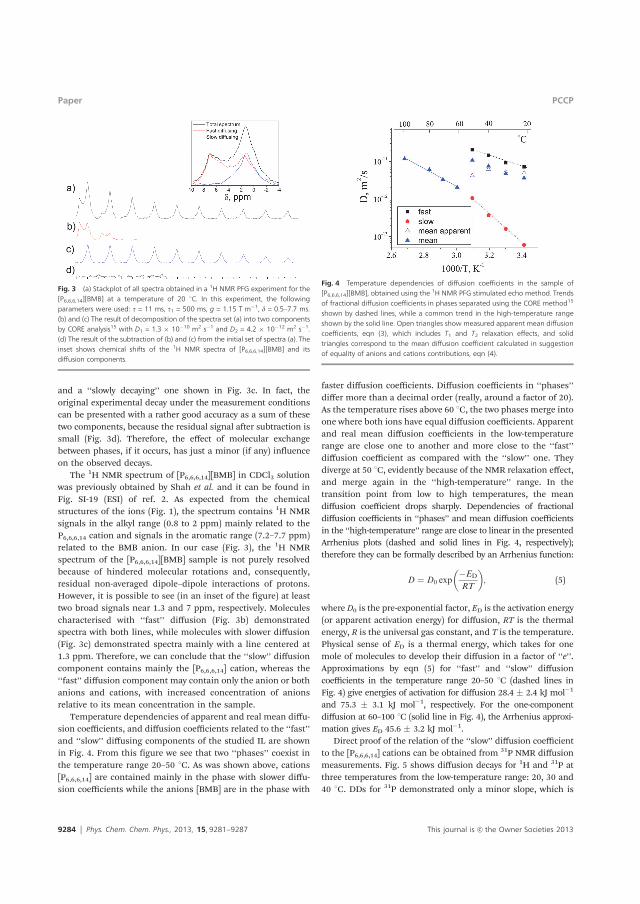
9284 Phys. Chem. Chem. Phys., 2013, 15, 9281--9287 This journal is c the Owner Societies 2013
and a ‘‘slowly decaying’’ one shown in Fig. 3c. In fact, theoriginal experimental decay under the measurement conditionscan be presented with a rather good accuracy as a sum of thesetwo components, because the residual signal after subtraction issmall (Fig. 3d). Therefore, the effect of molecular exchangebetween phases, if it occurs, has just a minor (if any) influenceon the observed decays.
The 1H NMR spectrum of [P6,6,6,14][BMB] in CDCl3 solutionwas previously obtained by Shah et al. and it can be found inFig. SI-19 (ESI) of ref. 2. As expected from the chemicalstructures of the ions (Fig. 1), the spectrum contains 1H NMRsignals in the alkyl range (0.8 to 2 ppm) mainly related to theP6,6,6,14 cation and signals in the aromatic range (7.2–7.7 ppm)related to the BMB anion. In our case (Fig. 3), the 1H NMRspectrum of the [P6,6,6,14][BMB] sample is not purely resolvedbecause of hindered molecular rotations and, consequently,residual non-averaged dipole–dipole interactions of protons.However, it is possible to see (in an inset of the figure) at leasttwo broad signals near 1.3 and 7 ppm, respectively. Moleculescharacterised with ‘‘fast’’ diffusion (Fig. 3b) demonstratedspectra with both lines, while molecules with slower diffusion(Fig. 3c) demonstrated spectra mainly with a line centered at1.3 ppm. Therefore, we can conclude that the ‘‘slow’’ diffusioncomponent contains mainly the [P6,6,6,14] cation, whereas the‘‘fast’’ diffusion component may contain only the anion or bothanions and cations, with increased concentration of anionsrelative to its mean concentration in the sample.
Temperature dependencies of apparent and real mean diffu-sion coefficients, and diffusion coefficients related to the ‘‘fast’’and ‘‘slow’’ diffusing components of the studied IL are shownin Fig. 4. From this figure we see that two ‘‘phases’’ coexist inthe temperature range 20–50 1C. As was shown above, cations[P6,6,6,14] are contained mainly in the phase with slower diffu-sion coefficients while the anions [BMB] are in the phase with
faster diffusion coefficients. Diffusion coefficients in ‘‘phases’’differ more than a decimal order (really, around a factor of 20).As the temperature rises above 60 1C, the two phases merge intoone where both ions have equal diffusion coefficients. Apparentand real mean diffusion coefficients in the low-temperaturerange are close one to another and more close to the ‘‘fast’’diffusion coefficient as compared with the ‘‘slow’’ one. Theydiverge at 50 1C, evidently because of the NMR relaxation effect,and merge again in the ‘‘high-temperature’’ range. In thetransition point from low to high temperatures, the meandiffusion coefficient drops sharply. Dependencies of fractionaldiffusion coefficients in ‘‘phases’’ and mean diffusion coefficientsin the ‘‘high-temperature’’ range are close to linear in the presentedArrhenius plots (dashed and solid lines in Fig. 4, respectively);therefore they can be formally described by an Arrhenius function:
D ¼ D0 exp�ED
RT
� �; (5)
where D0 is the pre-exponential factor, ED is the activation energy(or apparent activation energy) for diffusion, RT is the thermalenergy, R is the universal gas constant, and T is the temperature.Physical sense of ED is a thermal energy, which takes for onemole of molecules to develop their diffusion in a factor of ‘‘e’’.Approximations by eqn (5) for ‘‘fast’’ and ‘‘slow’’ diffusioncoefficients in the temperature range 20–50 1C (dashed lines inFig. 4) give energies of activation for diffusion 28.4 � 2.4 kJ mol�1
and 75.3 � 3.1 kJ mol�1, respectively. For the one-componentdiffusion at 60–100 1C (solid line in Fig. 4), the Arrhenius approxi-mation gives ED 45.6 � 3.2 kJ mol�1.
Direct proof of the relation of the ‘‘slow’’ diffusion coefficientto the [P6,6,6,14] cations can be obtained from 31P NMR diffusionmeasurements. Fig. 5 shows diffusion decays for 1H and 31P atthree temperatures from the low-temperature range: 20, 30 and40 1C. DDs for 31P demonstrated only a minor slope, which is
Fig. 3 (a) Stackplot of all spectra obtained in a 1H NMR PFG experiment for the[P6,6,6,14][BMB] at a temperature of 20 1C. In this experiment, the followingparameters were used: t = 11 ms, t1 = 500 ms, g = 1.15 T m�1, d = 0.5–7.7 ms.(b) and (c) The result of decomposition of the spectra set (a) into two componentsby CORE analysis15 with D1 = 1.3 � 10�10 m2 s�1 and D2 = 4.2 � 10�12 m2 s�1.(d) The result of the subtraction of (b) and (c) from the initial set of spectra (a). Theinset shows chemical shifts of the 1H NMR spectra of [P6,6,6,14][BMB] and itsdiffusion components.
Fig. 4 Temperature dependencies of diffusion coefficients in the sample of[P6,6,6,14][BMB], obtained using the 1H NMR PFG stimulated echo method. Trendsof fractional diffusion coefficients in phases separated using the CORE method15
shown by dashed lines, while a common trend in the high-temperature rangeshown by the solid line. Open triangles show measured apparent mean diffusioncoefficients, eqn (3), which includes T1 and T2 relaxation effects, and solidtriangles correspond to the mean diffusion coefficient calculated in suggestionof equality of anions and cations contributions, eqn (4).
Paper PCCP
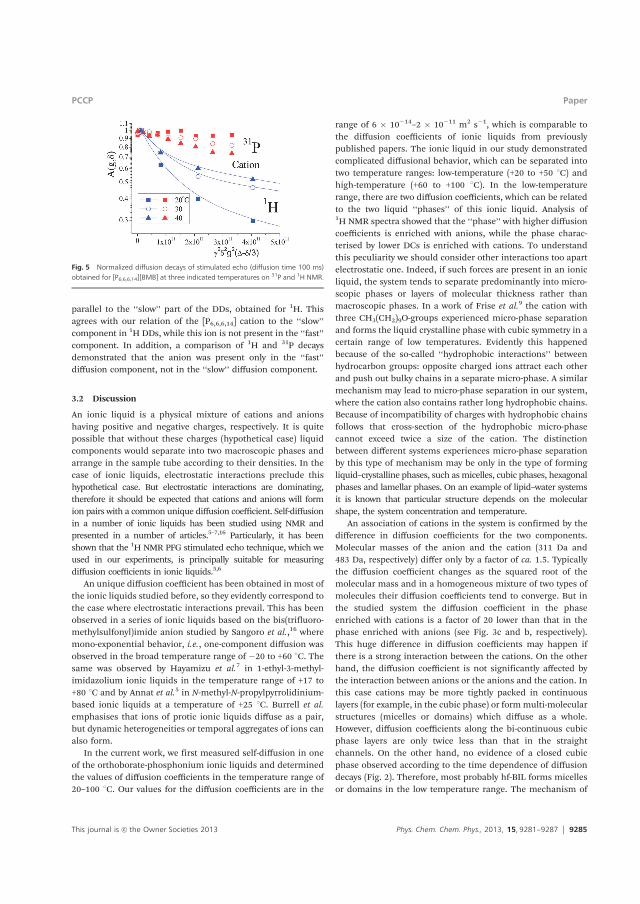
This journal is c the Owner Societies 2013 Phys. Chem. Chem. Phys., 2013, 15, 9281--9287 9285
parallel to the ‘‘slow’’ part of the DDs, obtained for 1H. Thisagrees with our relation of the [P6,6,6,14] cation to the ‘‘slow’’component in 1H DDs, while this ion is not present in the ‘‘fast’’component. In addition, a comparison of 1H and 31P decaysdemonstrated that the anion was present only in the ‘‘fast’’diffusion component, not in the ‘‘slow’’ diffusion component.
3.2 Discussion
An ionic liquid is a physical mixture of cations and anionshaving positive and negative charges, respectively. It is quitepossible that without these charges (hypothetical case) liquidcomponents would separate into two macroscopic phases andarrange in the sample tube according to their densities. In thecase of ionic liquids, electrostatic interactions preclude thishypothetical case. But electrostatic interactions are dominating,therefore it should be expected that cations and anions will formion pairs with a common unique diffusion coefficient. Self-diffusionin a number of ionic liquids has been studied using NMR andpresented in a number of articles.5–7,16 Particularly, it has beenshown that the 1H NMR PFG stimulated echo technique, which weused in our experiments, is principally suitable for measuringdiffusion coefficients in ionic liquids.5,6
An unique diffusion coefficient has been obtained in most ofthe ionic liquids studied before, so they evidently correspond tothe case where electrostatic interactions prevail. This has beenobserved in a series of ionic liquids based on the bis(trifluoro-methylsulfonyl)imide anion studied by Sangoro et al.,16 wheremono-exponential behavior, i.e., one-component diffusion wasobserved in the broad temperature range of �20 to +60 1C. Thesame was observed by Hayamizu et al.7 in 1-ethyl-3-methyl-imidazolium ionic liquids in the temperature range of +17 to+80 1C and by Annat et al.5 in N-methyl-N-propylpyrrolidinium-based ionic liquids at a temperature of +25 1C. Burrell et al.emphasises that ions of protic ionic liquids diffuse as a pair,but dynamic heterogeneities or temporal aggregates of ions canalso form.
In the current work, we first measured self-diffusion in oneof the orthoborate-phosphonium ionic liquids and determinedthe values of diffusion coefficients in the temperature range of20–100 1C. Our values for the diffusion coefficients are in the
range of 6 � 10�14–2 � 10�11 m2 s�1, which is comparable tothe diffusion coefficients of ionic liquids from previouslypublished papers. The ionic liquid in our study demonstratedcomplicated diffusional behavior, which can be separated intotwo temperature ranges: low-temperature (+20 to +50 1C) andhigh-temperature (+60 to +100 1C). In the low-temperaturerange, there are two diffusion coefficients, which can be relatedto the two liquid ‘‘phases’’ of this ionic liquid. Analysis of1H NMR spectra showed that the ‘‘phase’’ with higher diffusioncoefficients is enriched with anions, while the phase charac-terised by lower DCs is enriched with cations. To understandthis peculiarity we should consider other interactions too apartelectrostatic one. Indeed, if such forces are present in an ionicliquid, the system tends to separate predominantly into micro-scopic phases or layers of molecular thickness rather thanmacroscopic phases. In a work of Frise et al.9 the cation withthree CH3(CH2)9O-groups experienced micro-phase separationand forms the liquid crystalline phase with cubic symmetry in acertain range of low temperatures. Evidently this happenedbecause of the so-called ‘‘hydrophobic interactions’’ betweenhydrocarbon groups: opposite charged ions attract each otherand push out bulky chains in a separate micro-phase. A similarmechanism may lead to micro-phase separation in our system,where the cation also contains rather long hydrophobic chains.Because of incompatibility of charges with hydrophobic chainsfollows that cross-section of the hydrophobic micro-phasecannot exceed twice a size of the cation. The distinctionbetween different systems experiences micro-phase separationby this type of mechanism may be only in the type of formingliquid–crystalline phases, such asmicelles, cubic phases, hexagonalphases and lamellar phases. On an example of lipid–water systemsit is known that particular structure depends on the molecularshape, the system concentration and temperature.
An association of cations in the system is confirmed by thedifference in diffusion coefficients for the two components.Molecular masses of the anion and the cation (311 Da and483 Da, respectively) differ only by a factor of ca. 1.5. Typicallythe diffusion coefficient changes as the squared root of themolecular mass and in a homogeneous mixture of two types ofmolecules their diffusion coefficients tend to converge. But inthe studied system the diffusion coefficient in the phaseenriched with cations is a factor of 20 lower than that in thephase enriched with anions (see Fig. 3c and b, respectively).This huge difference in diffusion coefficients may happen ifthere is a strong interaction between the cations. On the otherhand, the diffusion coefficient is not significantly affected bythe interaction between anions or the anions and the cation. Inthis case cations may be more tightly packed in continuouslayers (for example, in the cubic phase) or formmulti-molecularstructures (micelles or domains) which diffuse as a whole.However, diffusion coefficients along the bi-continuous cubicphase layers are only twice less than that in the straightchannels. On the other hand, no evidence of a closed cubicphase observed according to the time dependence of diffusiondecays (Fig. 2). Therefore, most probably hf-BIL forms micellesor domains in the low temperature range. The mechanism of
Fig. 5 Normalized diffusion decays of stimulated echo (diffusion time 100 ms)obtained for [P6,6,6,14][BMB] at three indicated temperatures on 31P and 1H NMR.
PCCP Paper
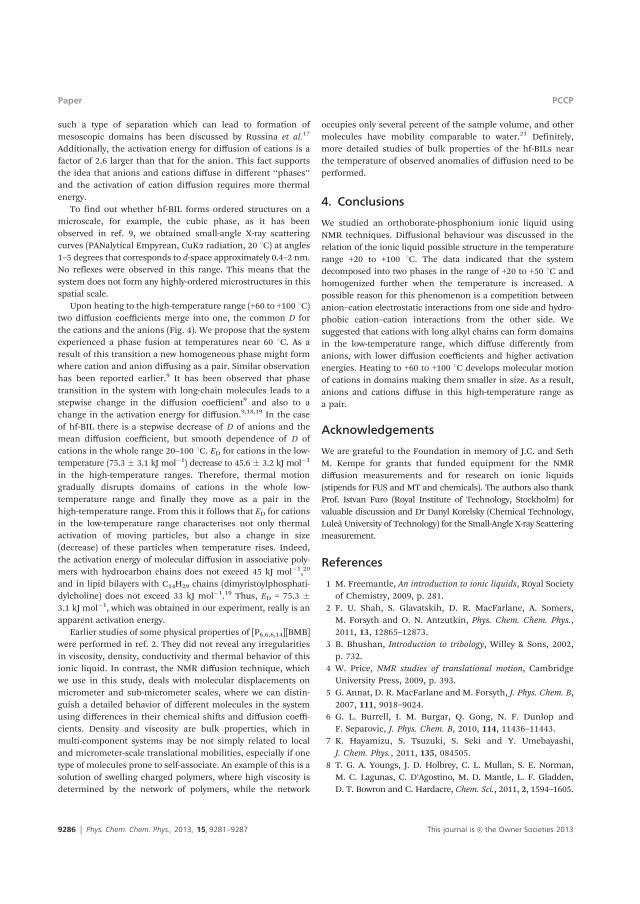
9286 Phys. Chem. Chem. Phys., 2013, 15, 9281--9287 This journal is c the Owner Societies 2013
such a type of separation which can lead to formation ofmesoscopic domains has been discussed by Russina et al.17
Additionally, the activation energy for diffusion of cations is afactor of 2.6 larger than that for the anion. This fact supportsthe idea that anions and cations diffuse in different ‘‘phases’’and the activation of cation diffusion requires more thermalenergy.
To find out whether hf-BIL forms ordered structures on amicroscale, for example, the cubic phase, as it has beenobserved in ref. 9, we obtained small-angle X-ray scatteringcurves (PANalytical Empyrean, CuKa radiation, 20 1C) at angles1–5 degrees that corresponds to d-space approximately 0.4–2 nm.No reflexes were observed in this range. This means that thesystem does not form any highly-ordered microstructures in thisspatial scale.
Upon heating to the high-temperature range (+60 to +100 1C)two diffusion coefficients merge into one, the common D forthe cations and the anions (Fig. 4). We propose that the systemexperienced a phase fusion at temperatures near 60 1C. As aresult of this transition a new homogeneous phase might formwhere cation and anion diffusing as a pair. Similar observationhas been reported earlier.9 It has been observed that phasetransition in the system with long-chain molecules leads to astepwise change in the diffusion coefficient9 and also to achange in the activation energy for diffusion.9,18,19 In the caseof hf-BIL there is a stepwise decrease of D of anions and themean diffusion coefficient, but smooth dependence of D ofcations in the whole range 20–100 1C. ED for cations in the low-temperature (75.3 � 3.1 kJ mol�1) decrease to 45.6 � 3.2 kJ mol�1
in the high-temperature ranges. Therefore, thermal motiongradually disrupts domains of cations in the whole low-temperature range and finally they move as a pair in thehigh-temperature range. From this it follows that ED for cationsin the low-temperature range characterises not only thermalactivation of moving particles, but also a change in size(decrease) of these particles when temperature rises. Indeed,the activation energy of molecular diffusion in associative poly-mers with hydrocarbon chains does not exceed 45 kJ mol�1,20
and in lipid bilayers with C14H29 chains (dimyristoylphosphati-dylcholine) does not exceed 33 kJ mol�1.19 Thus, ED = 75.3 �3.1 kJ mol�1, which was obtained in our experiment, really is anapparent activation energy.
Earlier studies of some physical properties of [P6,6,6,14][BMB]were performed in ref. 2. They did not reveal any irregularitiesin viscosity, density, conductivity and thermal behavior of thisionic liquid. In contrast, the NMR diffusion technique, whichwe use in this study, deals with molecular displacements onmicrometer and sub-micrometer scales, where we can distin-guish a detailed behavior of different molecules in the systemusing differences in their chemical shifts and diffusion coeffi-cients. Density and viscosity are bulk properties, which inmulti-component systems may be not simply related to localand micrometer-scale translational mobilities, especially if onetype of molecules prone to self-associate. An example of this is asolution of swelling charged polymers, where high viscosity isdetermined by the network of polymers, while the network
occupies only several percent of the sample volume, and othermolecules have mobility comparable to water.21 Definitely,more detailed studies of bulk properties of the hf-BILs nearthe temperature of observed anomalies of diffusion need to beperformed.
4. Conclusions
We studied an orthoborate-phosphonium ionic liquid usingNMR techniques. Diffusional behaviour was discussed in therelation of the ionic liquid possible structure in the temperaturerange +20 to +100 1C. The data indicated that the systemdecomposed into two phases in the range of +20 to +50 1C andhomogenized further when the temperature is increased. Apossible reason for this phenomenon is a competition betweenanion–cation electrostatic interactions from one side and hydro-phobic cation–cation interactions from the other side. Wesuggested that cations with long alkyl chains can form domainsin the low-temperature range, which diffuse differently fromanions, with lower diffusion coefficients and higher activationenergies. Heating to +60 to +100 1C develops molecular motionof cations in domains making them smaller in size. As a result,anions and cations diffuse in this high-temperature range asa pair.
Acknowledgements
We are grateful to the Foundation in memory of J.C. and SethM. Kempe for grants that funded equipment for the NMRdiffusion measurements and for research on ionic liquids(stipends for FUS and MT and chemicals). The authors also thankProf. Istvan Furo (Royal Institute of Technology, Stockholm) forvaluable discussion and Dr Danyl Korelsky (Chemical Technology,Luleå University of Technology) for the Small-Angle X-ray Scatteringmeasurement.
References
1 M. Freemantle, An introduction to ionic liquids, Royal Societyof Chemistry, 2009, p. 281.
2 F. U. Shah, S. Glavatskih, D. R. MacFarlane, A. Somers,M. Forsyth and O. N. Antzutkin, Phys. Chem. Chem. Phys.,2011, 13, 12865–12873.
3 B. Bhushan, Introduction to tribology, Willey & Sons, 2002,p. 732.
4 W. Price, NMR studies of translational motion, CambridgeUniversity Press, 2009, p. 393.
5 G. Annat, D. R. MacFarlane and M. Forsyth, J. Phys. Chem. B,2007, 111, 9018–9024.
6 G. L. Burrell, I. M. Burgar, Q. Gong, N. F. Dunlop andF. Separovic, J. Phys. Chem. B, 2010, 114, 11436–11443.
7 K. Hayamizu, S. Tsuzuki, S. Seki and Y. Umebayashi,J. Chem. Phys., 2011, 135, 084505.
8 T. G. A. Youngs, J. D. Holbrey, C. L. Mullan, S. E. Norman,M. C. Lagunas, C. D’Agostino, M. D. Mantle, L. F. Gladden,D. T. Bowron and C. Hardacre, Chem. Sci., 2011, 2, 1594–1605.
Paper PCCP
This journal is c the Owner Societies 2013 Phys. Chem. Chem. Phys., 2013, 15, 9281--9287 9287
9 A. E. Frise, T. Ichikawa, M. Yoshio, H. Ohno,S. V. Dvinskikh, T. Kato and I. Furo, Chem. Commun.,2010, 46, 728–730.
10 K. Hayamizu, S. Tsuzuki, S. Seki and Y. Umebayashi, J. Phys.Chem. B, 2012, 116, 11284–11291.
11 J. E. Tanner, J. Chem. Phys., 1970, 52, 2523–2526.12 J. Karger, H. Pfeiffer and W. Heink, Adv. Magn. Reson., 1988,
12, 1–89.13 S. W. Provencher, Comput. Phys. Commun., 1982, 27, 229–242.14 K. F. Morris and C. S. Johnson, Jr., J. Am. Chem. Soc., 1992,
114, 3139–3141.15 P. Stilbs, K. Paulsen and P. C. Griffiths, J. Phys. Chem., 1996,
100, 8180–8189.
16 J. R. Sangoro, C. Iacob, S. Naumov, R. Valiullin,H. Rexhausen, J. Hunger, R. Buchner, V. Strehmel,J. Karger and F. Kremer, Soft Matter, 2011, 7, 1678–1681.
17 O. Russina, A. Triolo, L. Gontrani and R. Caminiti, J. Phys.Chem. Lett., 2011, 3, 27–33.
18 R. M. Glegg and W. L. C. Vaz, in Progress in Protein-LipidInteractions, Elsevier Science Publishers B.V., New York,1985, p. 173.
19 A. Filippov, G. Oradd and G. Lindblom, Langmuir, 2003,19, 6397.
20 S. Abrahamsen-Alami and P. Stilbs, J. Colloid Interface Sci.,1997, 189, 137.
21 Y. Shapiro, Prog. Polym. Sci., 2011, 36, 1184.
PCCP Paper


Article III

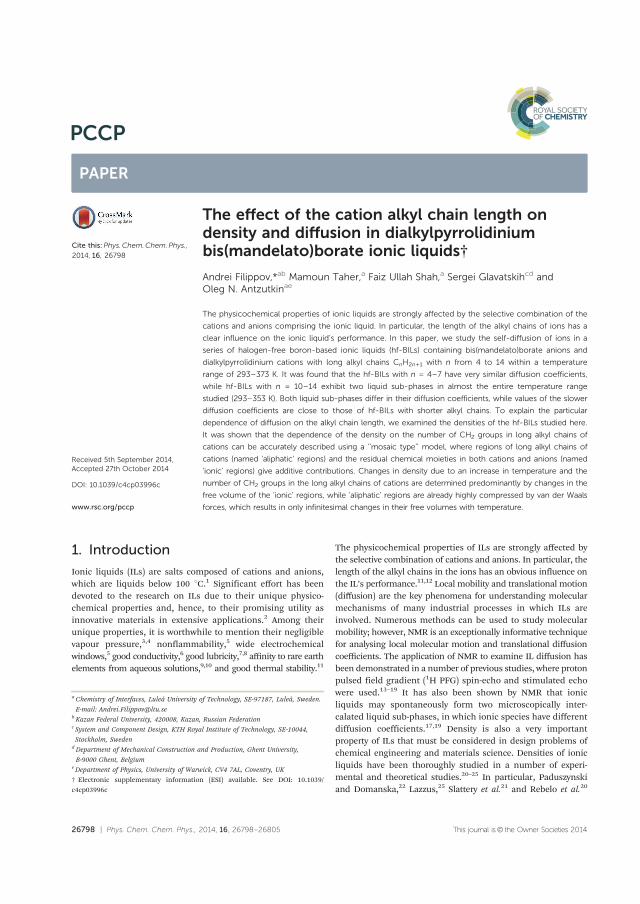
26798 | Phys. Chem. Chem. Phys., 2014, 16, 26798--26805 This journal is© the Owner Societies 2014
Cite this:Phys.Chem.Chem.Phys.,
2014, 16, 26798
The effect of the cation alkyl chain length ondensity and diffusion in dialkylpyrrolidiniumbis(mandelato)borate ionic liquids†
Andrei Filippov,*ab Mamoun Taher,a Faiz Ullah Shah,a Sergei Glavatskihcd andOleg N. Antzutkinae
The physicochemical properties of ionic liquids are strongly affected by the selective combination of the
cations and anions comprising the ionic liquid. In particular, the length of the alkyl chains of ions has a
clear influence on the ionic liquid’s performance. In this paper, we study the self-diffusion of ions in a
series of halogen-free boron-based ionic liquids (hf-BILs) containing bis(mandelato)borate anions and
dialkylpyrrolidinium cations with long alkyl chains CnH2n+1 with n from 4 to 14 within a temperature
range of 293–373 K. It was found that the hf-BILs with n = 4–7 have very similar diffusion coefficients,
while hf-BILs with n = 10–14 exhibit two liquid sub-phases in almost the entire temperature range
studied (293–353 K). Both liquid sub-phases differ in their diffusion coefficients, while values of the slower
diffusion coefficients are close to those of hf-BILs with shorter alkyl chains. To explain the particular
dependence of diffusion on the alkyl chain length, we examined the densities of the hf-BILs studied here.
It was shown that the dependence of the density on the number of CH2 groups in long alkyl chains of
cations can be accurately described using a ‘‘mosaic type’’ model, where regions of long alkyl chains of
cations (named ‘aliphatic’ regions) and the residual chemical moieties in both cations and anions (named
‘ionic’ regions) give additive contributions. Changes in density due to an increase in temperature and the
number of CH2 groups in the long alkyl chains of cations are determined predominantly by changes in the
free volume of the ‘ionic’ regions, while ‘aliphatic’ regions are already highly compressed by van der Waals
forces, which results in only infinitesimal changes in their free volumes with temperature.
1. Introduction
Ionic liquids (ILs) are salts composed of cations and anions,which are liquids below 100 1C.1 Significant effort has beendevoted to the research on ILs due to their unique physico-chemical properties and, hence, to their promising utility asinnovative materials in extensive applications.2 Among theirunique properties, it is worthwhile to mention their negligiblevapour pressure,3,4 nonflammability,5 wide electrochemicalwindows,5 good conductivity,6 good lubricity,7,8 affinity to rare earthelements from aqueous solutions,9,10 and good thermal stability.11
The physicochemical properties of ILs are strongly affected bythe selective combination of cations and anions. In particular, thelength of the alkyl chains in the ions has an obvious influence onthe IL’s performance.11,12 Local mobility and translational motion(diffusion) are the key phenomena for understanding molecularmechanisms of many industrial processes in which ILs areinvolved. Numerous methods can be used to study molecularmobility; however, NMR is an exceptionally informative techniquefor analysing local molecular motion and translational diffusioncoefficients. The application of NMR to examine IL diffusion hasbeen demonstrated in a number of previous studies, where protonpulsed field gradient (1H PFG) spin-echo and stimulated echowere used.13–19 It has also been shown by NMR that ionicliquids may spontaneously form two microscopically inter-calated liquid sub-phases, in which ionic species have differentdiffusion coefficients.17,19 Density is also a very importantproperty of ILs that must be considered in design problems ofchemical engineering and materials science. Densities of ionicliquids have been thoroughly studied in a number of experi-mental and theoretical studies.20–25 In particular, Paduszynskiand Domanska,22 Lazzus,25 Slattery et al.21 and Rebelo et al.20
a Chemistry of Interfaces, Luleå University of Technology, SE-97187, Luleå, Sweden.
E-mail: [email protected] Kazan Federal University, 420008, Kazan, Russian Federationc System and Component Design, KTH Royal Institute of Technology, SE-10044,
Stockholm, Swedend Department of Mechanical Construction and Production, Ghent University,
B-9000 Ghent, Belgiume Department of Physics, University of Warwick, CV4 7AL, Coventry, UK
† Electronic supplementary information (ESI) available. See DOI: 10.1039/c4cp03996c
Received 5th September 2014,Accepted 27th October 2014
DOI: 10.1039/c4cp03996c
www.rsc.org/pccp
PCCP
PAPER
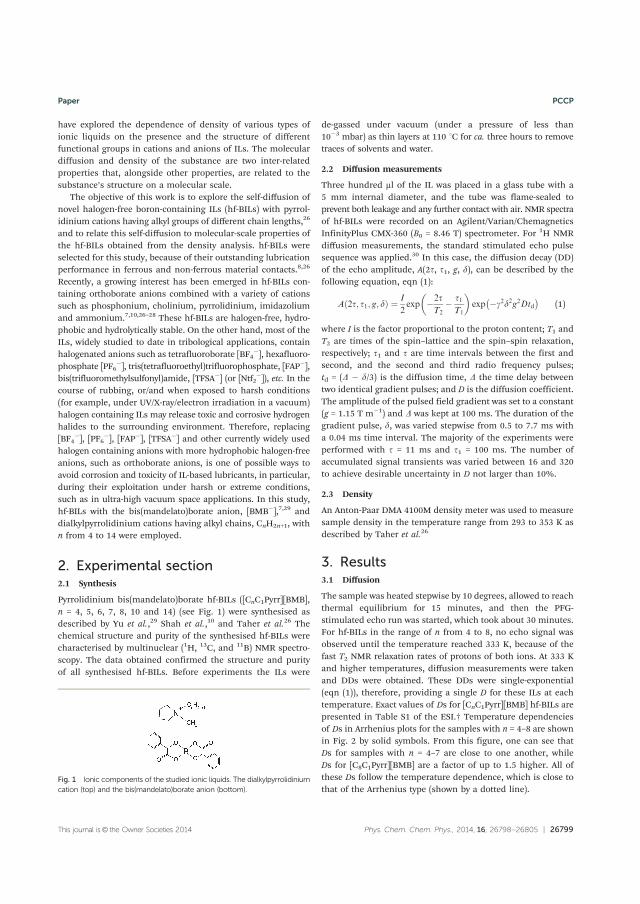
This journal is© the Owner Societies 2014 Phys. Chem. Chem. Phys., 2014, 16, 26798--26805 | 26799
have explored the dependence of density of various types ofionic liquids on the presence and the structure of differentfunctional groups in cations and anions of ILs. The moleculardiffusion and density of the substance are two inter-relatedproperties that, alongside other properties, are related to thesubstance’s structure on a molecular scale.
The objective of this work is to explore the self-diffusion ofnovel halogen-free boron-containing ILs (hf-BILs) with pyrrol-idinium cations having alkyl groups of different chain lengths,26
and to relate this self-diffusion to molecular-scale properties ofthe hf-BILs obtained from the density analysis. hf-BILs wereselected for this study, because of their outstanding lubricationperformance in ferrous and non-ferrous material contacts.8,26
Recently, a growing interest has been emerged in hf-BILs con-taining orthoborate anions combined with a variety of cationssuch as phosphonium, cholinium, pyrrolidinium, imidazoliumand ammonium.7,10,26–28 These hf-BILs are halogen-free, hydro-phobic and hydrolytically stable. On the other hand, most of theILs, widely studied to date in tribological applications, containhalogenated anions such as tetrafluoroborate [BF4
�], hexafluoro-phosphate [PF6
�], tris(tetrafluoroethyl)trifluorophosphate, [FAP�],bis(trifluoromethylsulfonyl)amide, [TFSA�] (or [Ntf2
�]), etc. In thecourse of rubbing, or/and when exposed to harsh conditions(for example, under UV/X-ray/electron irradiation in a vacuum)halogen containing ILs may release toxic and corrosive hydrogenhalides to the surrounding environment. Therefore, replacing[BF4
�], [PF6�], [FAP�], [TFSA�] and other currently widely used
halogen containing anions with more hydrophobic halogen-freeanions, such as orthoborate anions, is one of possible ways toavoid corrosion and toxicity of IL-based lubricants, in particular,during their exploitation under harsh or extreme conditions,such as in ultra-high vacuum space applications. In this study,hf-BILs with the bis(mandelato)borate anion, [BMB�],7,29 anddialkylpyrrolidinium cations having alkyl chains, CnH2n+1, withn from 4 to 14 were employed.
2. Experimental section2.1 Synthesis
Pyrrolidinium bis(mandelato)borate hf-BILs ([CnC1Pyrr][BMB],n = 4, 5, 6, 7, 8, 10 and 14) (see Fig. 1) were synthesised asdescribed by Yu et al.,29 Shah et al.,10 and Taher et al.26 Thechemical structure and purity of the synthesised hf-BILs werecharacterised by multinuclear (1H, 13C, and 11B) NMR spectro-scopy. The data obtained confirmed the structure and purityof all synthesised hf-BILs. Before experiments the ILs were
de-gassed under vacuum (under a pressure of less than10�3 mbar) as thin layers at 110 1C for ca. three hours to removetraces of solvents and water.
2.2 Diffusion measurements
Three hundred ml of the IL was placed in a glass tube with a5 mm internal diameter, and the tube was flame-sealed toprevent both leakage and any further contact with air. NMR spectraof hf-BILs were recorded on an Agilent/Varian/ChemagneticsInfinityPlus CMX-360 (B0 = 8.46 T) spectrometer. For 1H NMRdiffusion measurements, the standard stimulated echo pulsesequence was applied.30 In this case, the diffusion decay (DD)of the echo amplitude, A(2t, t1, g, d), can be described by thefollowing equation, eqn (1):
Að2t; t1; g; dÞ ¼ I
2exp �2t
T2� t1T1
� �exp �g2d2g2Dtd
� �(1)
where I is the factor proportional to the proton content; T1 andT2 are times of the spin–lattice and the spin–spin relaxation,respectively; t1 and t are time intervals between the first andsecond, and the second and third radio frequency pulses;td = (D � d/3) is the diffusion time, D the time delay betweentwo identical gradient pulses; and D is the diffusion coefficient.The amplitude of the pulsed field gradient was set to a constant(g = 1.15 T m�1) and D was kept at 100 ms. The duration of thegradient pulse, d, was varied stepwise from 0.5 to 7.7 ms witha 0.04 ms time interval. The majority of the experiments wereperformed with t = 11 ms and t1 = 100 ms. The number ofaccumulated signal transients was varied between 16 and 320to achieve desirable uncertainty in D not larger than 10%.
2.3 Density
An Anton-Paar DMA 4100M density meter was used to measuresample density in the temperature range from 293 to 353 K asdescribed by Taher et al.26
3. Results3.1 Diffusion
The sample was heated stepwise by 10 degrees, allowed to reachthermal equilibrium for 15 minutes, and then the PFG-stimulated echo run was started, which took about 30 minutes.For hf-BILs in the range of n from 4 to 8, no echo signal wasobserved until the temperature reached 333 K, because of thefast T2 NMR relaxation rates of protons of both ions. At 333 Kand higher temperatures, diffusion measurements were takenand DDs were obtained. These DDs were single-exponential(eqn (1)), therefore, providing a single D for these ILs at eachtemperature. Exact values of Ds for [CnC1Pyrr][BMB] hf-BILs arepresented in Table S1 of the ESI.† Temperature dependenciesof Ds in Arrhenius plots for the samples with n = 4–8 are shownin Fig. 2 by solid symbols. From this figure, one can see thatDs for samples with n = 4–7 are close to one another, whileDs for [C8C1Pyrr][BMB] are a factor of up to 1.5 higher. All ofthese Ds follow the temperature dependence, which is close tothat of the Arrhenius type (shown by a dotted line).
Fig. 1 Ionic components of the studied ionic liquids. The dialkylpyrrolidiniumcation (top) and the bis(mandelato)borate anion (bottom).
Paper PCCP
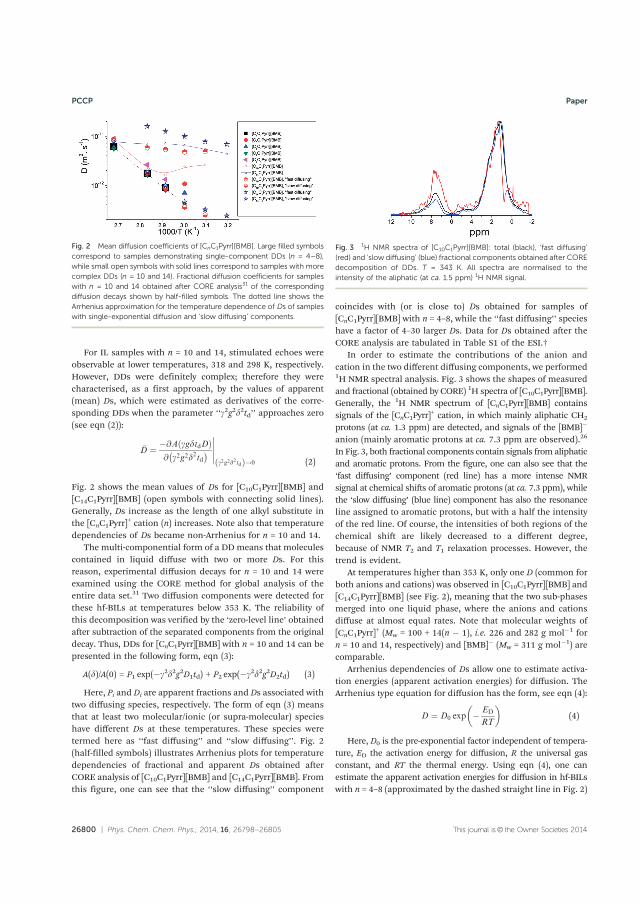
26800 | Phys. Chem. Chem. Phys., 2014, 16, 26798--26805 This journal is© the Owner Societies 2014
For IL samples with n = 10 and 14, stimulated echoes wereobservable at lower temperatures, 318 and 298 K, respectively.However, DDs were definitely complex; therefore they werecharacterised, as a first approach, by the values of apparent(mean) Ds, which were estimated as derivatives of the corre-sponding DDs when the parameter ‘‘g2g2d2td’’ approaches zero(see eqn (2)):
�D ¼ �@A ggdtdDð Þ@ g2g2d2td� �
�����g2g2d2tdð Þ!0 (2)
Fig. 2 shows the mean values of Ds for [C10C1Pyrr][BMB] and[C14C1Pyrr][BMB] (open symbols with connecting solid lines).Generally, Ds increase as the length of one alkyl substitute inthe [CnC1Pyrr]
+ cation (n) increases. Note also that temperaturedependencies of Ds became non-Arrhenius for n = 10 and 14.
The multi-componential form of a DD means that moleculescontained in liquid diffuse with two or more Ds. For thisreason, experimental diffusion decays for n = 10 and 14 wereexamined using the CORE method for global analysis of theentire data set.31 Two diffusion components were detected forthese hf-BILs at temperatures below 353 K. The reliability ofthis decomposition was verified by the ‘zero-level line’ obtainedafter subtraction of the separated components from the originaldecay. Thus, DDs for [CnC1Pyrr][BMB] with n = 10 and 14 can bepresented in the following form, eqn (3):
A(d)/A(0) = P1 exp(�g2d2g2D1td) + P2 exp(�g2d2g2D2td) (3)
Here, Pi and Di are apparent fractions and Ds associated withtwo diffusing species, respectively. The form of eqn (3) meansthat at least two molecular/ionic (or supra-molecular) specieshave different Ds at these temperatures. These species weretermed here as ‘‘fast diffusing’’ and ‘‘slow diffusing’’. Fig. 2(half-filled symbols) illustrates Arrhenius plots for temperaturedependencies of fractional and apparent Ds obtained afterCORE analysis of [C10C1Pyrr][BMB] and [C14C1Pyrr][BMB]. Fromthis figure, one can see that the ‘‘slow diffusing’’ component
coincides with (or is close to) Ds obtained for samples of[CnC1Pyrr][BMB] with n = 4–8, while the ‘‘fast diffusing’’ specieshave a factor of 4–30 larger Ds. Data for Ds obtained after theCORE analysis are tabulated in Table S1 of the ESI.†
In order to estimate the contributions of the anion andcation in the two different diffusing components, we performed1H NMR spectral analysis. Fig. 3 shows the shapes of measuredand fractional (obtained by CORE) 1H spectra of [C10C1Pyrr][BMB].Generally, the 1H NMR spectrum of [CnC1Pyrr][BMB] containssignals of the [CnC1Pyrr]
+ cation, in which mainly aliphatic CH2
protons (at ca. 1.3 ppm) are detected, and signals of the [BMB]�
anion (mainly aromatic protons at ca. 7.3 ppm are observed).26
In Fig. 3, both fractional components contain signals from aliphaticand aromatic protons. From the figure, one can also see that the‘fast diffusing’ component (red line) has a more intense NMRsignal at chemical shifts of aromatic protons (at ca. 7.3 ppm), whilethe ‘slow diffusing’ (blue line) component has also the resonanceline assigned to aromatic protons, but with a half the intensityof the red line. Of course, the intensities of both regions of thechemical shift are likely decreased to a different degree,because of NMR T2 and T1 relaxation processes. However, thetrend is evident.
At temperatures higher than 353 K, only one D (common forboth anions and cations) was observed in [C10C1Pyrr][BMB] and[C14C1Pyrr][BMB] (see Fig. 2), meaning that the two sub-phasesmerged into one liquid phase, where the anions and cationsdiffuse at almost equal rates. Note that molecular weights of[CnC1Pyrr]
+ (Mw = 100 + 14(n � 1), i.e. 226 and 282 g mol�1 forn = 10 and 14, respectively) and [BMB]� (Mw = 311 g mol�1) arecomparable.
Arrhenius dependencies of Ds allow one to estimate activa-tion energies (apparent activation energies) for diffusion. TheArrhenius type equation for diffusion has the form, see eqn (4):
D ¼ D0 exp � ED
RT
� �(4)
Here, D0 is the pre-exponential factor independent of tempera-ture, ED the activation energy for diffusion, R the universal gasconstant, and RT the thermal energy. Using eqn (4), one canestimate the apparent activation energies for diffusion in hf-BILswith n = 4–8 (approximated by the dashed straight line in Fig. 2)
Fig. 2 Mean diffusion coefficients of [CnC1Pyrr][BMB]. Large filled symbolscorrespond to samples demonstrating single-component DDs (n = 4–8),while small open symbols with solid lines correspond to samples with morecomplex DDs (n = 10 and 14). Fractional diffusion coefficients for sampleswith n = 10 and 14 obtained after CORE analysis31 of the correspondingdiffusion decays shown by half-filled symbols. The dotted line shows theArrhenius approximation for the temperature dependence of Ds of sampleswith single-exponential diffusion and ‘slow diffusing’ components.
Fig. 3 1H NMR spectra of [C10C1Pyrr][BMB]: total (black), ‘fast diffusing’(red) and ‘slow diffusing’ (blue) fractional components obtained after COREdecomposition of DDs. T = 343 K. All spectra are normalised to theintensity of the aliphatic (at ca. 1.5 ppm) 1H NMR signal.
PCCP Paper
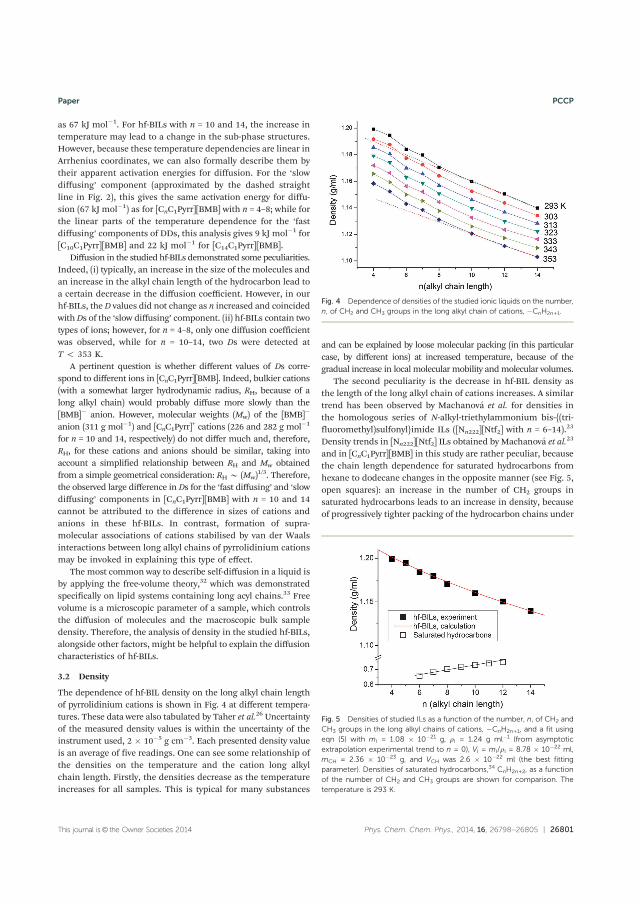
This journal is© the Owner Societies 2014 Phys. Chem. Chem. Phys., 2014, 16, 26798--26805 | 26801
as 67 kJ mol�1. For hf-BILs with n = 10 and 14, the increase intemperature may lead to a change in the sub-phase structures.However, because these temperature dependencies are linear inArrhenius coordinates, we can also formally describe them bytheir apparent activation energies for diffusion. For the ‘slowdiffusing’ component (approximated by the dashed straightline in Fig. 2), this gives the same activation energy for diffu-sion (67 kJ mol�1) as for [CnC1Pyrr][BMB] with n = 4–8; while forthe linear parts of the temperature dependence for the ‘fastdiffusing’ components of DDs, this analysis gives 9 kJ mol�1 for[C10C1Pyrr][BMB] and 22 kJ mol�1 for [C14C1Pyrr][BMB].
Diffusion in the studied hf-BILs demonstrated some peculiarities.Indeed, (i) typically, an increase in the size of the molecules andan increase in the alkyl chain length of the hydrocarbon lead toa certain decrease in the diffusion coefficient. However, in ourhf-BILs, the D values did not change as n increased and coincidedwithDs of the ‘slow diffusing’ component. (ii) hf-BILs contain twotypes of ions; however, for n = 4–8, only one diffusion coefficientwas observed, while for n = 10–14, two Ds were detected atT o 353 K.
A pertinent question is whether different values of Ds corre-spond to different ions in [CnC1Pyrr][BMB]. Indeed, bulkier cations(with a somewhat larger hydrodynamic radius, RH, because of along alkyl chain) would probably diffuse more slowly than the[BMB]� anion. However, molecular weights (Mw) of the [BMB]�
anion (311 g mol�1) and [CnC1Pyrr]+ cations (226 and 282 g mol�1
for n = 10 and 14, respectively) do not differ much and, therefore,RH, for these cations and anions should be similar, taking intoaccount a simplified relationship between RH and Mw obtainedfrom a simple geometrical consideration: RH B (Mw)
1/3. Therefore,the observed large difference in Ds for the ‘fast diffusing’ and ‘slowdiffusing’ components in [CnC1Pyrr][BMB] with n = 10 and 14cannot be attributed to the difference in sizes of cations andanions in these hf-BILs. In contrast, formation of supra-molecular associations of cations stabilised by van der Waalsinteractions between long alkyl chains of pyrrolidinium cationsmay be invoked in explaining this type of effect.
The most common way to describe self-diffusion in a liquid isby applying the free-volume theory,32 which was demonstratedspecifically on lipid systems containing long acyl chains.33 Freevolume is a microscopic parameter of a sample, which controlsthe diffusion of molecules and the macroscopic bulk sampledensity. Therefore, the analysis of density in the studied hf-BILs,alongside other factors, might be helpful to explain the diffusioncharacteristics of hf-BILs.
3.2 Density
The dependence of hf-BIL density on the long alkyl chain lengthof pyrrolidinium cations is shown in Fig. 4 at different tempera-tures. These data were also tabulated by Taher et al.26 Uncertaintyof the measured density values is within the uncertainty of theinstrument used, 2 � 10�5 g cm�3. Each presented density valueis an average of five readings. One can see some relationship ofthe densities on the temperature and the cation long alkylchain length. Firstly, the densities decrease as the temperatureincreases for all samples. This is typical for many substances
and can be explained by loose molecular packing (in this particularcase, by different ions) at increased temperature, because of thegradual increase in local molecular mobility andmolecular volumes.
The second peculiarity is the decrease in hf-BIL density asthe length of the long alkyl chain of cations increases. A similartrend has been observed by Machanova et al. for densities inthe homologous series of N-alkyl-triethylammonium bis-{(tri-fluoromethyl)sulfonyl}imide ILs ([Nn222][Ntf2] with n = 6–14).23
Density trends in [Nn222][Ntf2] ILs obtained by Machanova et al.23
and in [CnC1Pyrr][BMB] in this study are rather peculiar, becausethe chain length dependence for saturated hydrocarbons fromhexane to dodecane changes in the opposite manner (see Fig. 5,open squares): an increase in the number of CH2 groups insaturated hydrocarbons leads to an increase in density, becauseof progressively tighter packing of the hydrocarbon chains under
Fig. 4 Dependence of densities of the studied ionic liquids on the number,n, of CH2 and CH3 groups in the long alkyl chain of cations, �CnH2n+1.
Fig. 5 Densities of studied ILs as a function of the number, n, of CH2 andCH3 groups in the long alkyl chains of cations, �CnH2n+1, and a fit usingeqn (5) with mI = 1.08 � 10�21 g, rI = 1.24 g ml�1 (from asymptoticextrapolation experimental trend to n = 0), VI = mI/rI = 8.78 � 10�22 ml,mCH = 2.36 � 10�23 g, and VCH was 2.6 � 10�22 ml (the best fittingparameter). Densities of saturated hydrocarbons,34 CnH2n+2, as a functionof the number of CH2 and CH3 groups are shown for comparison. Thetemperature is 293 K.
Paper PCCP
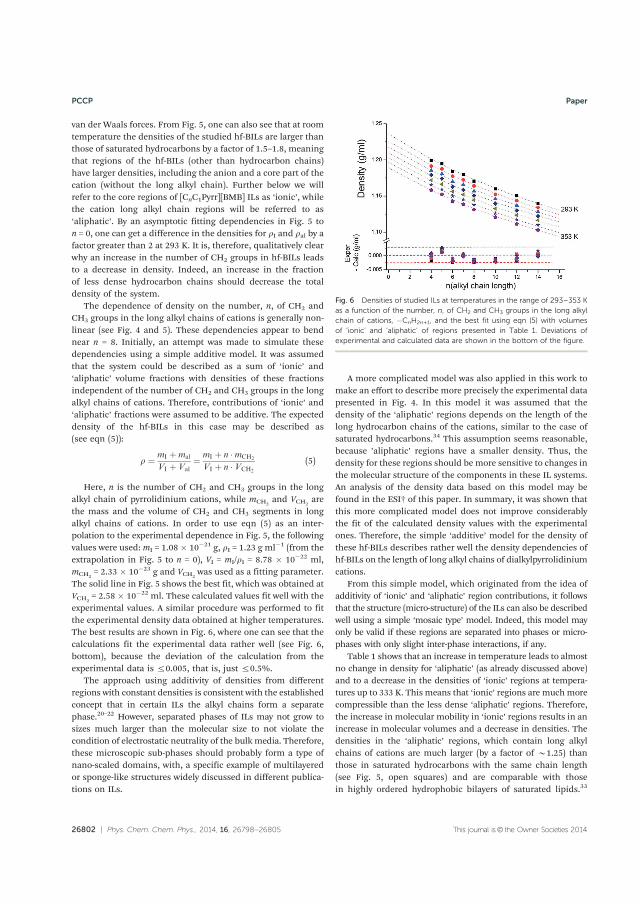
26802 | Phys. Chem. Chem. Phys., 2014, 16, 26798--26805 This journal is© the Owner Societies 2014
van der Waals forces. From Fig. 5, one can also see that at roomtemperature the densities of the studied hf-BILs are larger thanthose of saturated hydrocarbons by a factor of 1.5–1.8, meaningthat regions of the hf-BILs (other than hydrocarbon chains)have larger densities, including the anion and a core part of thecation (without the long alkyl chain). Further below we willrefer to the core regions of [CnC1Pyrr][BMB] ILs as ‘ionic’, whilethe cation long alkyl chain regions will be referred to as‘aliphatic’. By an asymptotic fitting dependencies in Fig. 5 ton = 0, one can get a difference in the densities for rI and ral by afactor greater than 2 at 293 K. It is, therefore, qualitatively clearwhy an increase in the number of CH2 groups in hf-BILs leadsto a decrease in density. Indeed, an increase in the fractionof less dense hydrocarbon chains should decrease the totaldensity of the system.
The dependence of density on the number, n, of CH2 andCH3 groups in the long alkyl chains of cations is generally non-linear (see Fig. 4 and 5). These dependencies appear to bendnear n = 8. Initially, an attempt was made to simulate thesedependencies using a simple additive model. It was assumedthat the system could be described as a sum of ‘ionic’ and‘aliphatic’ volume fractions with densities of these fractionsindependent of the number of CH2 and CH3 groups in the longalkyl chains of cations. Therefore, contributions of ‘ionic’ and‘aliphatic’ fractions were assumed to be additive. The expecteddensity of the hf-BILs in this case may be described as(see eqn (5)):
r ¼ mI þmal
VI þ Val¼ mI þ n �mCH2
VI þ n � VCH2
(5)
Here, n is the number of CH2 and CH3 groups in the longalkyl chain of pyrrolidinium cations, while mCH2
and VCH2are
the mass and the volume of CH2 and CH3 segments in longalkyl chains of cations. In order to use eqn (5) as an inter-polation to the experimental dependence in Fig. 5, the followingvalues were used: mI = 1.08 � 10�21 g, rI = 1.23 g ml�1 (from theextrapolation in Fig. 5 to n = 0), VI = mI/rI = 8.78 � 10�22 ml,mCH2
= 2.33 � 10�23 g and VCH2was used as a fitting parameter.
The solid line in Fig. 5 shows the best fit, which was obtained atVCH2
= 2.58 � 10�22 ml. These calculated values fit well with theexperimental values. A similar procedure was performed to fitthe experimental density data obtained at higher temperatures.The best results are shown in Fig. 6, where one can see that thecalculations fit the experimental data rather well (see Fig. 6,bottom), because the deviation of the calculation from theexperimental data is r0.005, that is, just r0.5%.
The approach using additivity of densities from differentregions with constant densities is consistent with the establishedconcept that in certain ILs the alkyl chains form a separatephase.20–22 However, separated phases of ILs may not grow tosizes much larger than the molecular size to not violate thecondition of electrostatic neutrality of the bulk media. Therefore,these microscopic sub-phases should probably form a type ofnano-scaled domains, with, a specific example of multilayeredor sponge-like structures widely discussed in different publica-tions on ILs.
A more complicated model was also applied in this work tomake an effort to describe more precisely the experimental datapresented in Fig. 4. In this model it was assumed that thedensity of the ‘aliphatic’ regions depends on the length of thelong hydrocarbon chains of the cations, similar to the case ofsaturated hydrocarbons.34 This assumption seems reasonable,because ’aliphatic’ regions have a smaller density. Thus, thedensity for these regions should be more sensitive to changes inthe molecular structure of the components in these IL systems.An analysis of the density data based on this model may befound in the ESI† of this paper. In summary, it was shown thatthis more complicated model does not improve considerablythe fit of the calculated density values with the experimentalones. Therefore, the simple ‘additive’ model for the density ofthese hf-BILs describes rather well the density dependencies ofhf-BILs on the length of long alkyl chains of dialkylpyrrolidiniumcations.
From this simple model, which originated from the idea ofadditivity of ‘ionic’ and ‘aliphatic’ region contributions, it followsthat the structure (micro-structure) of the ILs can also be describedwell using a simple ‘mosaic type’ model. Indeed, this model mayonly be valid if these regions are separated into phases or micro-phases with only slight inter-phase interactions, if any.
Table 1 shows that an increase in temperature leads to almostno change in density for ‘aliphatic’ (as already discussed above)and to a decrease in the densities of ‘ionic’ regions at tempera-tures up to 333 K. This means that ‘ionic’ regions are muchmorecompressible than the less dense ‘aliphatic’ regions. Therefore,the increase in molecular mobility in ‘ionic’ regions results in anincrease in molecular volumes and a decrease in densities. Thedensities in the ‘aliphatic’ regions, which contain long alkylchains of cations are much larger (by a factor of B1.25) thanthose in saturated hydrocarbons with the same chain length(see Fig. 5, open squares) and are comparable with thosein highly ordered hydrophobic bilayers of saturated lipids.33
Fig. 6 Densities of studied ILs at temperatures in the range of 293–353 Kas a function of the number, n, of CH2 and CH3 groups in the long alkylchain of cations, �CnH2n+1, and the best fit using eqn (5) with volumesof ‘ionic’ and ‘aliphatic’ of regions presented in Table 1. Deviations ofexperimental and calculated data are shown in the bottom of the figure.
PCCP Paper
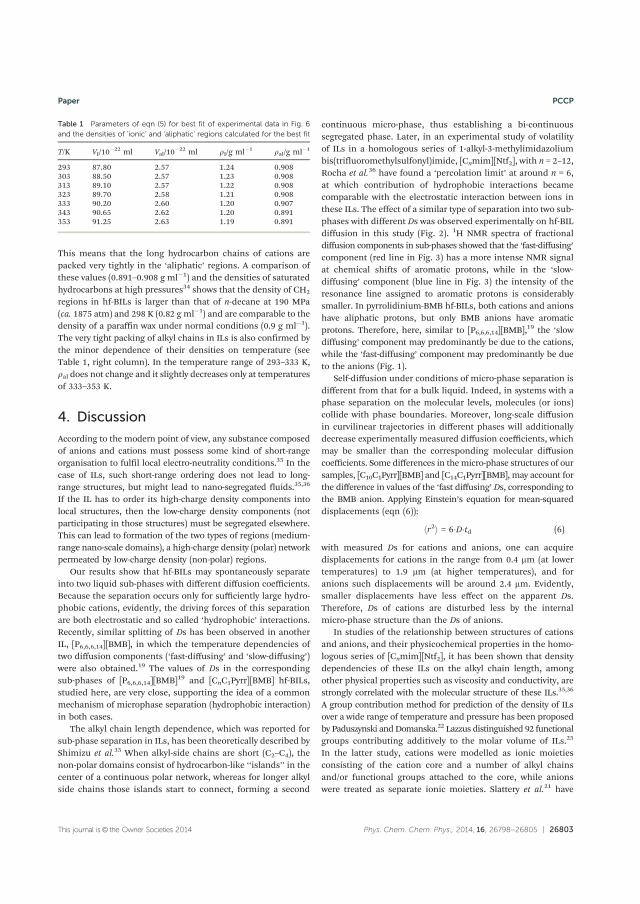
This journal is© the Owner Societies 2014 Phys. Chem. Chem. Phys., 2014, 16, 26798--26805 | 26803
This means that the long hydrocarbon chains of cations arepacked very tightly in the ‘aliphatic’ regions. A comparison ofthese values (0.891–0.908 g ml�1) and the densities of saturatedhydrocarbons at high pressures34 shows that the density of CH2
regions in hf-BILs is larger than that of n-decane at 190 MPa(ca. 1875 atm) and 298 K (0.82 g ml�1) and are comparable to thedensity of a paraffin wax under normal conditions (0.9 g ml�1).The very tight packing of alkyl chains in ILs is also confirmed bythe minor dependence of their densities on temperature (seeTable 1, right column). In the temperature range of 293–333 K,ral does not change and it slightly decreases only at temperaturesof 333–353 K.
4. Discussion
According to the modern point of view, any substance composedof anions and cations must possess some kind of short-rangeorganisation to fulfil local electro-neutrality conditions.35 In thecase of ILs, such short-range ordering does not lead to long-range structures, but might lead to nano-segregated fluids.35,36
If the IL has to order its high-charge density components intolocal structures, then the low-charge density components (notparticipating in those structures) must be segregated elsewhere.This can lead to formation of the two types of regions (medium-range nano-scale domains), a high-charge density (polar) networkpermeated by low-charge density (non-polar) regions.
Our results show that hf-BILs may spontaneously separateinto two liquid sub-phases with different diffusion coefficients.Because the separation occurs only for sufficiently large hydro-phobic cations, evidently, the driving forces of this separationare both electrostatic and so called ‘hydrophobic’ interactions.Recently, similar splitting of Ds has been observed in anotherIL, [P6,6,6,14][BMB], in which the temperature dependencies oftwo diffusion components (‘fast-diffusing’ and ‘slow-diffusing’)were also obtained.19 The values of Ds in the correspondingsub-phases of [P6,6,6,14][BMB]19 and [CnC1Pyrr][BMB] hf-BILs,studied here, are very close, supporting the idea of a commonmechanism of microphase separation (hydrophobic interaction)in both cases.
The alkyl chain length dependence, which was reported forsub-phase separation in ILs, has been theoretically described byShimizu et al.35 When alkyl-side chains are short (C2–C4), thenon-polar domains consist of hydrocarbon-like ‘‘islands’’ in thecenter of a continuous polar network, whereas for longer alkylside chains those islands start to connect, forming a second
continuous micro-phase, thus establishing a bi-continuoussegregated phase. Later, in an experimental study of volatilityof ILs in a homologous series of 1-alkyl-3-methylimidazoliumbis(trifluoromethylsulfonyl)imide, [Cnmim][Ntf2], with n = 2–12,Rocha et al.36 have found a ‘percolation limit’ at around n = 6,at which contribution of hydrophobic interactions becamecomparable with the electrostatic interaction between ions inthese ILs. The effect of a similar type of separation into two sub-phases with different Ds was observed experimentally on hf-BILdiffusion in this study (Fig. 2). 1H NMR spectra of fractionaldiffusion components in sub-phases showed that the ‘fast-diffusing’component (red line in Fig. 3) has a more intense NMR signalat chemical shifts of aromatic protons, while in the ‘slow-diffusing’ component (blue line in Fig. 3) the intensity of theresonance line assigned to aromatic protons is considerablysmaller. In pyrrolidinium-BMB hf-BILs, both cations and anionshave aliphatic protons, but only BMB anions have aromaticprotons. Therefore, here, similar to [P6,6,6,14][BMB],19 the ‘slowdiffusing’ component may predominantly be due to the cations,while the ‘fast-diffusing’ component may predominantly be dueto the anions (Fig. 1).
Self-diffusion under conditions of micro-phase separation isdifferent from that for a bulk liquid. Indeed, in systems with aphase separation on the molecular levels, molecules (or ions)collide with phase boundaries. Moreover, long-scale diffusionin curvilinear trajectories in different phases will additionallydecrease experimentally measured diffusion coefficients, whichmay be smaller than the corresponding molecular diffusioncoefficients. Some differences in themicro-phase structures of oursamples, [C10C1Pyrr][BMB] and [C14C1Pyrr][BMB], may account forthe difference in values of the ‘fast diffusing’ Ds, corresponding tothe BMB anion. Applying Einstein’s equation for mean-squareddisplacements (eqn (6)):
hr2i = 6�D�td (6)
with measured Ds for cations and anions, one can acquiredisplacements for cations in the range from 0.4 mm (at lowertemperatures) to 1.9 mm (at higher temperatures), and foranions such displacements will be around 2.4 mm. Evidently,smaller displacements have less effect on the apparent Ds.Therefore, Ds of cations are disturbed less by the internalmicro-phase structure than the Ds of anions.
In studies of the relationship between structures of cationsand anions, and their physicochemical properties in the homo-logous series of [Cnmim][Ntf2], it has been shown that densitydependencies of these ILs on the alkyl chain length, amongother physical properties such as viscosity and conductivity, arestrongly correlated with the molecular structure of these ILs.35,36
A group contribution method for prediction of the density of ILsover a wide range of temperature and pressure has been proposedby Paduszynski andDomanska.22 Lazzus distinguished 92 functionalgroups contributing additively to the molar volume of ILs.25
In the latter study, cations were modelled as ionic moietiesconsisting of the cation core and a number of alkyl chainsand/or functional groups attached to the core, while anionswere treated as separate ionic moieties. Slattery et al.21 have
Table 1 Parameters of eqn (5) for best fit of experimental data in Fig. 6and the densities of ‘ionic’ and ‘aliphatic’ regions calculated for the best fit
T/K VI/10�22 ml Val/10
�22 ml rI/g ml�1 ral/g ml�1
293 87.80 2.57 1.24 0.908303 88.50 2.57 1.23 0.908313 89.10 2.57 1.22 0.908323 89.70 2.58 1.21 0.908333 90.20 2.60 1.20 0.907343 90.65 2.62 1.20 0.891353 91.25 2.63 1.19 0.891
Paper PCCP
26804 | Phys. Chem. Chem. Phys., 2014, 16, 26798--26805 This journal is© the Owner Societies 2014
suggested that the molar volume Vm of ILs can be considered asthe sum of individual contributions of cations and anions. It hasbeen shown experimentally that Vm increases linearly with thenumber of the CH2 units in the alkyl chain attached to the cation.Following the observation of Rebelo et al.20 the effective molarvolume was assigned to themethylimidazolium core and the CH2
groups. Machanova et al. have studied densities of [Nn222][Ntf2]ILs (with n = 6–14) at the atmospheric pressure as a function ofthe length of one of alkyl chains of the cation, as well astemperature.23 These authors have suggested that the molarvolume of cations varies as a quadratic function of T.23 Therefore,additive density models, which suggested linear and non-linearcontributions of different chemical groups present in ions to themolar volume, are not rare. Our model originates from bothdensity and diffusion dependencies on the alkyl chain length ofthe pyrrolidinium cations. The model is different from all pre-viously reported models, because it suggests that the molarvolume is not a sum of individual contributions from ions, butthe sum of the partial long chain volume of cations (‘aliphatic’regions) and volumes of anions and the residual part, i.e. withoutthe long alkyl chain, of cations (‘ionic’ regions). This approachseems to be reasonable, because long chains of cations may formseparate hydrophobic microscopic liquid sub-phases governed byvan der Waals inter-chain interactions.23,36
One of basic approaches to describe diffusion processes isthe theory of free volume, which was first proposed by Cohenand Turnbull more than 50 years ago.32 This theory considers aparticle performing a random walk, while each elementary stepof this process is limited by the occurrence of a free volume, vf,greater than a critical size, v*, next to the diffusing particle. Theequation for the diffusion coefficient with a free volume can bewritten in the form (see eqn (7)):
D ¼ D� � exp �gv�
vf
� �(7)
where D* is a constant and g is a factor to correct for over-lapping free volumes (0.5–1). The usual approximation for v* isthe van der Waals volume per molecule, which can be estimatedas (eqn (8)):
vf = vav � v* (8)
where vav is the average volume of the molecule. The freevolume is formed near the molecule/ion, therefore, for molecules/ions composed of a number of diverse chemical groups, the totalfree volume is a sum of free volumes neighbouring the particularchemical groups. In our particular case of dialkylpyrrolidiniumcations the following equation can be written (eqn (9)):
vf(cation) = vf(methyl-pyrrolidinium core) + vf(nCH2) (9)
The density analysis of hf-BILs showed (see Table 1) that thedensity of ‘aliphatic’ regions of CH2 groups under normalconditions is extremely high, and comparable to that of saturatedhydrocarbons at extremely high pressures, due to chemicalbonding of the alkyl chains with the methyl-pyrrolidinium cationcore. The exact mechanism, by which the cation cores may‘compress’ the ‘aliphatic’ regions is not yet clear. The primary
process might cause a decrease in the mobility of the alkyl chainsby the bound pyrrolidinium core or, more likely, the pressure dueto electrostatic forces between the cations and anions.35 Notethat the density of a neutral liquid, n-methyl-pyrrolidine, isonly 0.819 g ml�1 at 298 K. Therefore, electrostatic interactionsbetween pyrrolidinium cations and BMB anions contribute con-siderably to the packing of ions in these hf-BILs, so that densitiesof [CnC1Pyrr][BMB] ionic liquids are larger than 1 g ml�1 in thewhole temperature interval and for all ionic liquids in this studyand approaching 1.24 g ml�1 for n = 0.
Considering that the effect of the free volume on regions oflong cation alkyl chains is infinitesimal, eqn (9) turns into thefollowing relation (see eqn (10)):
vf(cation) = vf(methyl-pyrrolidinium core). (10)
It is, therefore, evident why the Ds of the ‘‘slow-diffusing’’component are not influenced by the number of CH2 groups inthe long alkyl chain of cations: n does not influence the freevolume of the dialkylpyrrolidinium cation.
Tight packing of alkyl cation chains may lead to ordering oflong cation chains in the studied hf-BILs in the manner of aliquid crystal. Simulations showed that, when cationic chainsare adequately long, they tend to become parallel to each otherand generate liquid crystal-like layers.37 More experiments areneeded to confirm this idea.
5. Conclusion1H diffusion NMR demonstrated that hf-BILs with the structure[CnC1Pyrr][BMB] are rather complex systems in molecular organi-sation and diffusion. For n = 4–8, in the entire temperature rangeof study, these hf-BILs show single-component diffusion decayswith almost equal diffusion coefficients. For n = 10 and 14, theNMR results demonstrate the presence of two diffusion coeffi-cients, which differ by almost two orders of magnitude andcorrespond to the two liquid sub-phases. The driving forces ofthis separation are both electrostatic interactions between cationsand anions and the hydrophobic interaction between long alkylchains of cations. The dependence of hf-BIL density on thenumber of CH2 groups in the long chain of cations can bedescribed well using a simple additive model, in which ‘ionic’ and‘aliphatic’ regions make additive contributions. The densities in‘aliphatic’ regions are comparable to those of saturated hydro-carbons at extremely high pressures (41850 atm), evidentlybecause of strong intermolecular electrostatic interactions in thesystem. This leads to an infinitesimal free volume of the longalkyl chains of the cations and independence of diffusion (‘‘slow-diffusing’’ component) in the cation-containing phase on thenumber of CH2 groups in the long alkyl chains of the cations.
Acknowledgements
The Knut and Alice Wallenberg Foundation and the SwedishResearch Council are gratefully acknowledged for supporting thiswork. The Foundation in memory of J. C. and Seth M. Kempe is
PCCP Paper
This journal is© the Owner Societies 2014 Phys. Chem. Chem. Phys., 2014, 16, 26798--26805 | 26805
gratefully acknowledged for financial support (grants for NMRequipment at LTU and for chemicals). The linguistics services ofKazan Federal University and ‘‘Scriptia Academic Editing’’ areacknowledged for proof-reading of this manuscript.
References
1 T. Torimoto, T. Tsuda, K. Okazaki and S. Kuwabata,Adv. Mater., 2010, 22, 1196.
2 E. Binetti, A. Panniello, L. Triggiani, R. Tommasi, A. Agostiano,M. L. Curri and M. Striccoli, J. Phys. Chem. B, 2012, 116, 3512.
3 W. Xu, L. M. Wang, R. A. Nieman and C. A. Angell, J. Phys.Chem. B, 2003, 107, 11749.
4 J. P. Paraknowitsch, A. Thomas and M. Antonietti, J. Mater.Chem., 2010, 20, 6746.
5 H. Xiang, B. Yin, H. Wang, H. Lin, X. Ge, S. Xie and C. Chen,Electrochim. Acta, 2010, 55, 5204.
6 H. Tokuda, K. Hayamizu, K. Ishii, M. A. B. H. Susan andM. Watanabe, J. Phys. Chem. B, 2005, 109, 6103.
7 F. U. Shah, S. Glavatskih, D. R. MacFarlane, A. Somers,M. Forsyth and O. N. Antzutkin, Phys. Chem. Chem. Phys.,2011, 13, 12865.
8 F. U. Shah, S. Glavatskih and O. N. Antzutkin, Tribol. Lett.,2013, 51, 281–301.
9 X. Sun, H. Luo and S. Dai, Talanta, 2012, 90, 132.10 F. U. Shah, S. Glavatskih, P. M. Dean, D. R. MacFarlane,
M. Forsyth and O. N. Antzutkin, J. Mater. Chem., 2012, 22,6928–6938.
11 R. Atkin and G. G. Warr, J. Phys. Chem. C, 2007, 111, 5162.12 S. Zhang, X. Li, H. Chen, J. Wang, J. Zhang and M. Zhang,
J. Chem. Eng. Data, 2004, 49, 760.13 G. Annat, D. R. MacFarlane and M. Forsyth, J. Phys. Chem. B,
2007, 111, 9018.14 G. L. Burrell, I. M. Burgar, Q. Gong, N. F. Dunlop and
F. Separovic, J. Phys. Chem. B, 2010, 114, 11436.15 K. Hayamizu, S. Tsuzuki, S. Seki and Y. Umebayashi,
J. Chem. Phys., 2011, 135, 084505.16 T. G. A. Youngs, J. D. Holbrey, C. L. Mullan, S. E. Norman,
M. C. Lagunas, C. D’Agostino, M. D. Mantle, L. F. Gladden,D. T. Bowron and C. Hardacre, Chem. Sci., 2011, 2, 1594.
17 A. E. Frise, T. Ichikawa, M. Yoshio, H. Ohno, S. V. Dvinskikh,T. Kato and I. Furo, Chem. Commun., 2010, 46, 728.
18 K. Hayamizu, S. Tsuzuki, S. Seki and Y. Umebayashi, J. Phys.Chem. B, 2012, 116, 11284.
19 A. Filippov, F. U. Shah, M. Taher, S. Glavatskih andO. N. Antzutkin, Phys. Chem. Chem. Phys., 2013, 15, 9281.
20 L. P. N. Rebelo, J. N. C. Lopes, J. M. S. S. Esperanca,H. J. R. Guedes, J. Lachwa, V. Najdanovic-Visak and Z. P.Visak, Acc. Chem. Res., 2007, 40, 1114.
21 J. Slattery, C. Daguenet, P. Dyson, T. Schubert andI. Krossing, Angew. Chem., Int. Ed., 2007, 46, 5384.
22 K. Paduszynski and U. Domanska, Ind. Eng. Chem. Res.,2012, 51, 591.
23 K. Machanova, A. Boisset, Z. Sedlakova, M. Anouti,M. Bendova and J. Jacquemin, J. Chem. Eng. Data, 2012,57, 2227.
24 P. Kilaru, G. A. Baker and P. Scovazzo, J. Chem. Eng. Data,2007, 52, 2306.
25 J. Lazzus, Chem. Eng. Commun., 2010, 197, 974.26 M. Taher, F. U. Shah, A. Filippov, P. de Baets, S. Glavatskih
and O. N. Antzutkin, RSC Adv., 2014, 4, 30617.27 Y. L. Wang, F. U. Shah, S. Glavatskih, O. N. Antzutkin and
A. Laaksonen, J. Phys. Chem. B, 2014, 118, 8711.28 R. Gusain, R. Singh, K. L. N. Sivakumar and O. P. Khatri,
RSC Adv., 2014, 4, 1293.29 S. Yu, S. Lindeman and C. D. Tran, J. Org. Chem., 2008, 73,
2576–2591.30 E. O. Stejskal and J. Tanner, J. Chem. Phys., 1965, 42, 288.31 P. Stilbs, K. Paulsen and P. C. Griffiths, J. Phys. Chem., 1996,
100, 8180.32 M. Cohen and D. Turnbull, J. Chem. Phys., 1959, 31,
1164.33 A. Filippov, B. Munavirov, G. Grobner and M. Rudakova,
Magn. Reson. Imaging, 2012, 30, 413.34 K. Liu, Y. Wu, M. A. McHugh, H. Baled, R. M. Enick and
B. D. Morreale, J. Supercrit. Fluids, 2010, 55, 701.35 K. Shimizu, M. F. C. Gomes, A. A. H. Padua, L. P. N.
Rebelo and J. N. C. Lopes, J. Mol. Struct., 2010,946, 70.
36 M. A. A. Rocha, C. F. R. A. C. Lima, L. R. Gomes, B. Schroder,J. A. P. Coutinho, I. M. Marrucho, J. M. S. S. Esperanca,L. P. N. Rebelo, K. Shimizu, J. C. Lopes and L. M. N. B.F. Santos, J. Phys. Chem. B, 2011, 115, 10919.
37 Y. Ji, R. Shi, Y. Wang and G. Saielli, J. Phys. Chem. B, 2013,117, 1104.
Paper PCCP

Article IV

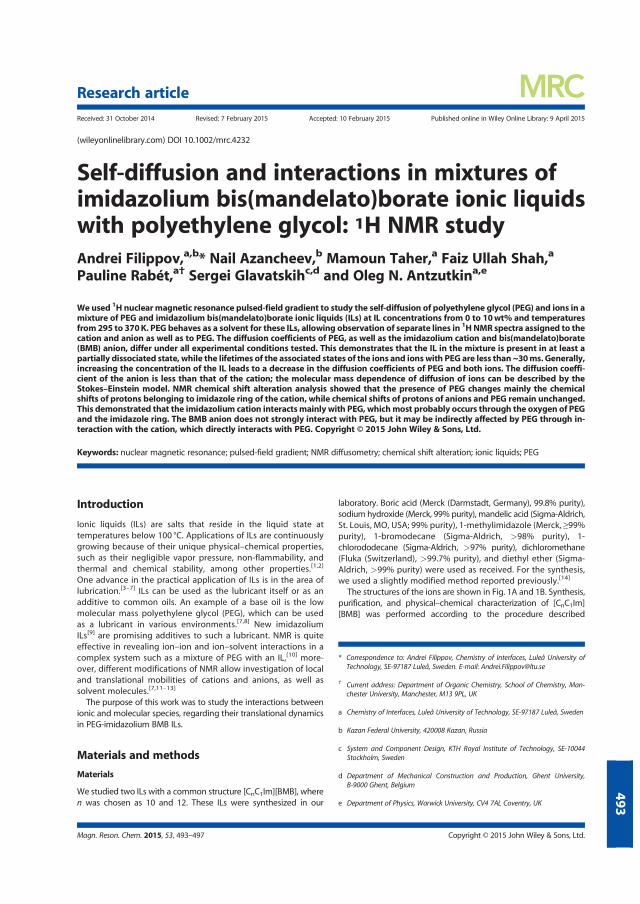
Self-diffusion and interactions in mixtures ofimidazolium bis(mandelato)borate ionic liquidswith polyethylene glycol: 1H NMR studyAndrei Filippov,a,b* Nail Azancheev,b Mamoun Taher,a Faiz Ullah Shah,a
Pauline Rabét,a† Sergei Glavatskihc,d and Oleg N. Antzutkina,e
We used 1H nuclearmagnetic resonance pulsed-field gradient to study the self-diffusion of polyethylene glycol (PEG) and ions in amixture of PEG and imidazolium bis(mandelato)borate ionic liquids (ILs) at IL concentrations from 0 to 10wt% and temperaturesfrom295 to 370K. PEG behaves as a solvent for these ILs, allowing observation of separate lines in 1H NMR spectra assigned to thecation and anion as well as to PEG. The diffusion coefficients of PEG, as well as the imidazolium cation and bis(mandelato)borate(BMB) anion, differ under all experimental conditions tested. This demonstrates that the IL in the mixture is present in at least apartially dissociated state, while the lifetimes of the associated states of the ions and ionswith PEG are less than~30ms. Generally,increasing the concentration of the IL leads to a decrease in the diffusion coefficients of PEG and both ions. The diffusion coeffi-cient of the anion is less than that of the cation; the molecular mass dependence of diffusion of ions can be described by theStokes–Einstein model. NMR chemical shift alteration analysis showed that the presence of PEG changes mainly the chemicalshifts of protons belonging to imidazole ring of the cation, while chemical shifts of protons of anions and PEG remain unchanged.This demonstrated that the imidazolium cation interactsmainlywith PEG, whichmost probably occurs through the oxygen of PEGand the imidazole ring. The BMB anion does not strongly interact with PEG, but it may be indirectly affected by PEG through in-teraction with the cation, which directly interacts with PEG. Copyright © 2015 John Wiley & Sons, Ltd.
Keywords: nuclear magnetic resonance; pulsed-field gradient; NMR diffusometry; chemical shift alteration; ionic liquids; PEG
Introduction
Ionic liquids (ILs) are salts that reside in the liquid state attemperatures below 100 °C. Applications of ILs are continuouslygrowing because of their unique physical–chemical properties,such as their negligible vapor pressure, non-flammability, andthermal and chemical stability, among other properties.[1,2]
One advance in the practical application of ILs is in the area oflubrication.[3–7] ILs can be used as the lubricant itself or as anadditive to common oils. An example of a base oil is the lowmolecular mass polyethylene glycol (PEG), which can be usedas a lubricant in various environments.[7,8] New imidazoliumILs[9] are promising additives to such a lubricant. NMR is quiteeffective in revealing ion–ion and ion–solvent interactions in acomplex system such as a mixture of PEG with an IL,[10] more-over, different modifications of NMR allow investigation of localand translational mobilities of cations and anions, as well assolvent molecules.[7,11–13]
The purpose of this work was to study the interactions betweenionic and molecular species, regarding their translational dynamicsin PEG-imidazolium BMB ILs.
Materials and methods
Materials
We studied two ILs with a common structure [CnC1Im][BMB], wheren was chosen as 10 and 12. These ILs were synthesized in our
laboratory. Boric acid (Merck (Darmstadt, Germany), 99.8% purity),sodium hydroxide (Merck, 99% purity), mandelic acid (Sigma-Aldrich,St. Louis, MO, USA; 99% purity), 1-methylimidazole (Merck, ≥99%purity), 1-bromodecane (Sigma-Aldrich, >98% purity), 1-chlorododecane (Sigma-Aldrich, >97% purity), dichloromethane(Fluka (Switzerland), >99.7% purity), and diethyl ether (Sigma-Aldrich, >99% purity) were used as received. For the synthesis,we used a slightly modified method reported previously.[14]
The structures of the ions are shown in Fig. 1A and 1B. Synthesis,purification, and physical–chemical characterization of [CnC1Im][BMB] was performed according to the procedure described
* Correspondence to: Andrei Filippov, Chemistry of Interfaces, Luleå University ofTechnology, SE-97187 Luleå, Sweden. E-mail: [email protected]
† Current address: Department of Organic Chemistry, School of Chemistry, Man-chester University, Manchester, M13 9PL, UK
a Chemistry of Interfaces, Luleå University of Technology, SE-97187 Luleå, Sweden
b Kazan Federal University, 420008 Kazan, Russia
c System and Component Design, KTH Royal Institute of Technology, SE-10044Stockholm, Sweden
d Department of Mechanical Construction and Production, Ghent University,B-9000 Ghent, Belgium
e Department of Physics, Warwick University, CV4 7AL Coventry, UK
Magn. Reson. Chem. 2015, 53, 493–497 Copyright © 2015 John Wiley & Sons, Ltd.
Research article
Received: 31 October 2014 Revised: 7 February 2015 Accepted: 10 February 2015 Published online in Wiley Online Library: 9 April 2015
(wileyonlinelibrary.com) DOI 10.1002/mrc.4232
493
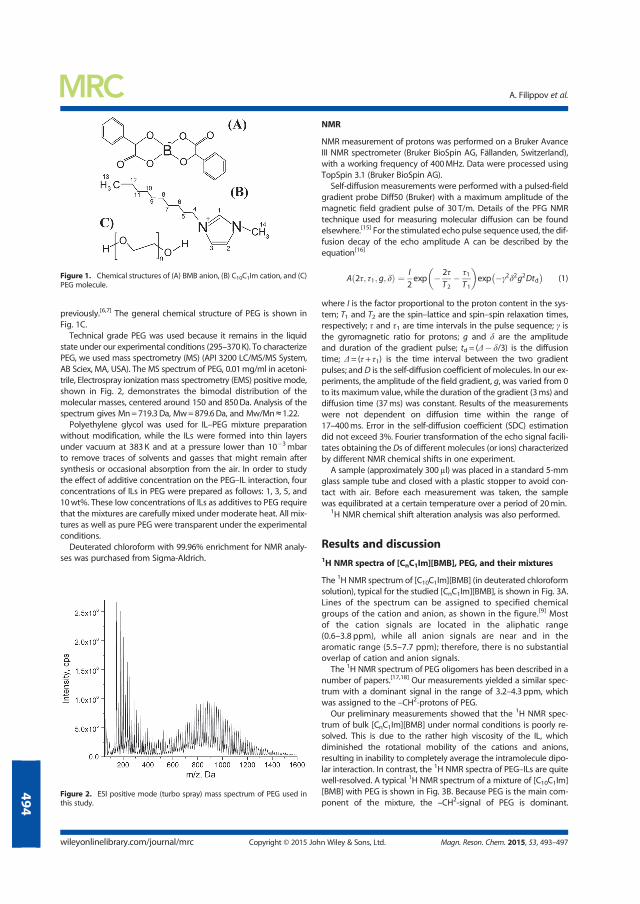
previously.[6,7] The general chemical structure of PEG is shown inFig. 1C.Technical grade PEG was used because it remains in the liquid
state under our experimental conditions (295–370K). To characterizePEG, we used mass spectrometry (MS) (API 3200 LC/MS/MS System,AB Sciex, MA, USA). The MS spectrum of PEG, 0.01mg/ml in acetoni-trile, Electrospray ionizationmass spectrometry (EMS) positive mode,shown in Fig. 2, demonstrates the bimodal distribution of themolecular masses, centered around 150 and 850Da. Analysis of thespectrum gives Mn=719.3Da, Mw=879.6Da, and Mw/Mn≈1.22.Polyethylene glycol was used for IL–PEG mixture preparation
without modification, while the ILs were formed into thin layersunder vacuum at 383K and at a pressure lower than 10�3mbarto remove traces of solvents and gasses that might remain aftersynthesis or occasional absorption from the air. In order to studythe effect of additive concentration on the PEG–IL interaction, fourconcentrations of ILs in PEG were prepared as follows: 1, 3, 5, and10wt%. These low concentrations of ILs as additives to PEG requirethat the mixtures are carefully mixed under moderate heat. All mix-tures as well as pure PEG were transparent under the experimentalconditions.Deuterated chloroform with 99.96% enrichment for NMR analy-
ses was purchased from Sigma-Aldrich.
NMR
NMR measurement of protons was performed on a Bruker AvanceIII NMR spectrometer (Bruker BioSpin AG, Fällanden, Switzerland),with a working frequency of 400MHz. Data were processed usingTopSpin 3.1 (Bruker BioSpin AG).
Self-diffusion measurements were performed with a pulsed-fieldgradient probe Diff50 (Bruker) with a maximum amplitude of themagnetic field gradient pulse of 30 T/m. Details of the PFG NMRtechnique used for measuring molecular diffusion can be foundelsewhere.[15] For the stimulated echo pulse sequence used, the dif-fusion decay of the echo amplitude A can be described by theequation[16]
A 2τ; τ1; g; δð Þ ¼ I
2exp � 2τ
T2� τ1T1
� �exp �γ2δ2g2Dtd
� �(1)
where I is the factor proportional to the proton content in the sys-tem; Т1 and Т2 are the spin–lattice and spin–spin relaxation times,respectively; τ and τ1 are time intervals in the pulse sequence; γ isthe gyromagnetic ratio for protons; g and δ are the amplitudeand duration of the gradient pulse; td = (Δ� δ/3) is the diffusiontime; Δ= (τ + τ1) is the time interval between the two gradientpulses; and D is the self-diffusion coefficient of molecules. In our ex-periments, the amplitude of the field gradient, g, was varied from 0to its maximum value, while the duration of the gradient (3ms) anddiffusion time (37ms) was constant. Results of the measurementswere not dependent on diffusion time within the range of17–400ms. Error in the self-diffusion coefficient (SDC) estimationdid not exceed 3%. Fourier transformation of the echo signal facili-tates obtaining the Ds of different molecules (or ions) characterizedby different NMR chemical shifts in one experiment.
A sample (approximately 300μl) was placed in a standard 5-mmglass sample tube and closed with a plastic stopper to avoid con-tact with air. Before each measurement was taken, the samplewas equilibrated at a certain temperature over a period of 20min.
1H NMR chemical shift alteration analysis was also performed.
Results and discussion1H NMR spectra of [CnC1Im][BMB], PEG, and their mixtures
The 1H NMR spectrum of [C10C1Im][BMB] (in deuterated chloroformsolution), typical for the studied [CnC1Im][BMB], is shown in Fig. 3A.Lines of the spectrum can be assigned to specified chemicalgroups of the cation and anion, as shown in the figure.[9] Mostof the cation signals are located in the aliphatic range(0.6–3.8 ppm), while all anion signals are near and in thearomatic range (5.5–7.7 ppm); therefore, there is no substantialoverlap of cation and anion signals.
The 1H NMR spectrum of PEG oligomers has been described in anumber of papers.[17,18] Our measurements yielded a similar spec-trum with a dominant signal in the range of 3.2–4.3 ppm, whichwas assigned to the –CH2-protons of PEG.
Our preliminary measurements showed that the 1H NMR spec-trum of bulk [CnC1Im][BMB] under normal conditions is poorly re-solved. This is due to the rather high viscosity of the IL, whichdiminished the rotational mobility of the cations and anions,resulting in inability to completely average the intramolecule dipo-lar interaction. In contrast, the 1H NMR spectra of PEG–ILs are quitewell-resolved. A typical 1H NMR spectrum of a mixture of [C10C1Im][BMB] with PEG is shown in Fig. 3B. Because PEG is the main com-ponent of the mixture, the –CH2-signal of PEG is dominant.
Figure 1. Chemical structures of (A) BMB anion, (B) C10C1Im cation, and (C)PEG molecule.
Figure 2. ESI positive mode (turbo spray) mass spectrum of PEG used inthis study.
A. Filippov et al.
wileyonlinelibrary.com/journal/mrc Copyright © 2015 John Wiley & Sons, Ltd. Magn. Reson. Chem. 2015, 53, 493–497
494
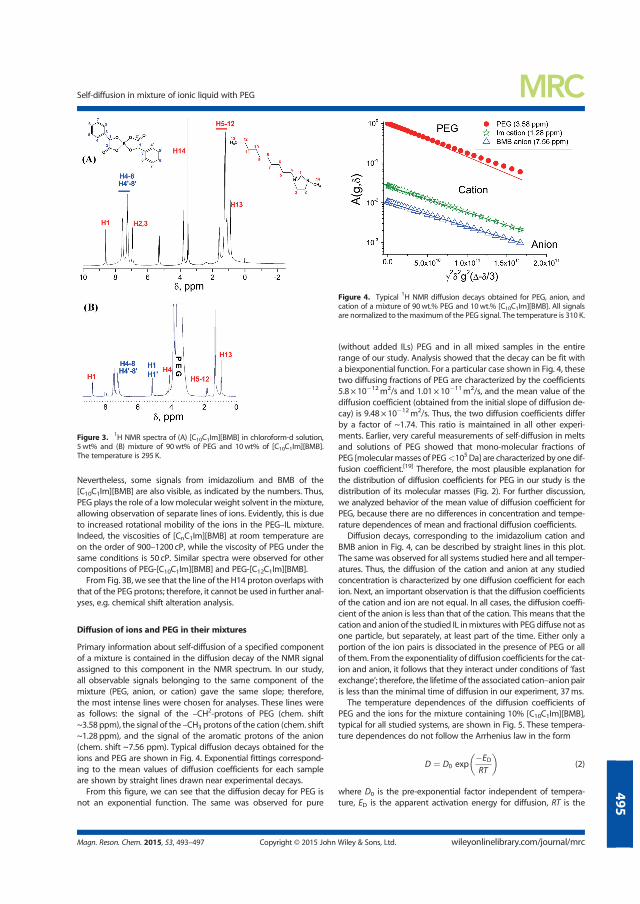
Nevertheless, some signals from imidazolium and BMB of the[C10C1Im][BMB] are also visible, as indicated by the numbers. Thus,PEG plays the role of a lowmolecular weight solvent in themixture,allowing observation of separate lines of ions. Evidently, this is dueto increased rotational mobility of the ions in the PEG–IL mixture.Indeed, the viscosities of [CnC1Im][BMB] at room temperature areon the order of 900–1200 cP, while the viscosity of PEG under thesame conditions is 50 cP. Similar spectra were observed for othercompositions of PEG-[C10C1Im][BMB] and PEG-[C12C1Im][BMB].
From Fig. 3B, we see that the line of the H14 proton overlaps withthat of the PEG protons; therefore, it cannot be used in further anal-yses, e.g. chemical shift alteration analysis.
Diffusion of ions and PEG in their mixtures
Primary information about self-diffusion of a specified componentof a mixture is contained in the diffusion decay of the NMR signalassigned to this component in the NMR spectrum. In our study,all observable signals belonging to the same component of themixture (PEG, anion, or cation) gave the same slope; therefore,the most intense lines were chosen for analyses. These lines wereas follows: the signal of the –CH2-protons of PEG (chem. shift~3.58 ppm), the signal of the –CH3 protons of the cation (chem. shift~1.28 ppm), and the signal of the aromatic protons of the anion(chem. shift ~7.56 ppm). Typical diffusion decays obtained for theions and PEG are shown in Fig. 4. Exponential fittings correspond-ing to the mean values of diffusion coefficients for each sampleare shown by straight lines drawn near experimental decays.
From this figure, we can see that the diffusion decay for PEG isnot an exponential function. The same was observed for pure
(without added ILs) PEG and in all mixed samples in the entirerange of our study. Analysis showed that the decay can be fit witha biexponential function. For a particular case shown in Fig. 4, thesetwo diffusing fractions of PEG are characterized by the coefficients5.8 × 10�12m2/s and 1.01× 10�11m2/s, and the mean value of thediffusion coefficient (obtained from the initial slope of diffusion de-cay) is 9.48× 10�12m2/s. Thus, the two diffusion coefficients differby a factor of ~1.74. This ratio is maintained in all other experi-ments. Earlier, very careful measurements of self-diffusion in meltsand solutions of PEG showed that mono-molecular fractions ofPEG [molecularmasses of PEG<105Da] are characterized by one dif-fusion coefficient.[19] Therefore, the most plausible explanation forthe distribution of diffusion coefficients for PEG in our study is thedistribution of its molecular masses (Fig. 2). For further discussion,we analyzed behavior of the mean value of diffusion coefficient forPEG, because there are no differences in concentration and tempe-rature dependences of mean and fractional diffusion coefficients.
Diffusion decays, corresponding to the imidazolium cation andBMB anion in Fig. 4, can be described by straight lines in this plot.The same was observed for all systems studied here and all temper-atures. Thus, the diffusion of the cation and anion at any studiedconcentration is characterized by one diffusion coefficient for eachion. Next, an important observation is that the diffusion coefficientsof the cation and ion are not equal. In all cases, the diffusion coeffi-cient of the anion is less than that of the cation. This means that thecation and anion of the studied IL inmixtureswith PEG diffuse not asone particle, but separately, at least part of the time. Either only aportion of the ion pairs is dissociated in the presence of PEG or allof them. From the exponentiality of diffusion coefficients for the cat-ion and anion, it follows that they interact under conditions of ‘fastexchange’; therefore, the lifetime of the associated cation–anionpairis less than the minimal time of diffusion in our experiment, 37ms.
The temperature dependences of the diffusion coefficients ofPEG and the ions for the mixture containing 10% [C10C1Im][BMB],typical for all studied systems, are shown in Fig. 5. These tempera-ture dependences do not follow the Arrhenius law in the form
D ¼ D0 exp�EDRT
� �(2)
where D0 is the pre-exponential factor independent of tempera-ture, ED is the apparent activation energy for diffusion, RT is the
Figure 3. 1H NMR spectra of (A) [C10C1Im][BMB] in chloroform-d solution,5wt% and (B) mixture of 90wt% of PEG and 10wt% of [C10C1Im][BMB].The temperature is 295 K.
Figure 4. Typical 1H NMR diffusion decays obtained for PEG, anion, andcation of a mixture of 90wt.% PEG and 10wt.% [C10C1Im][BMB]. All signalsare normalized to the maximumof the PEG signal. The temperature is 310 K.
Self-diffusion in mixture of ionic liquid with PEG
Magn. Reson. Chem. 2015, 53, 493–497 Copyright © 2015 John Wiley & Sons, Ltd. wileyonlinelibrary.com/journal/mrc
495
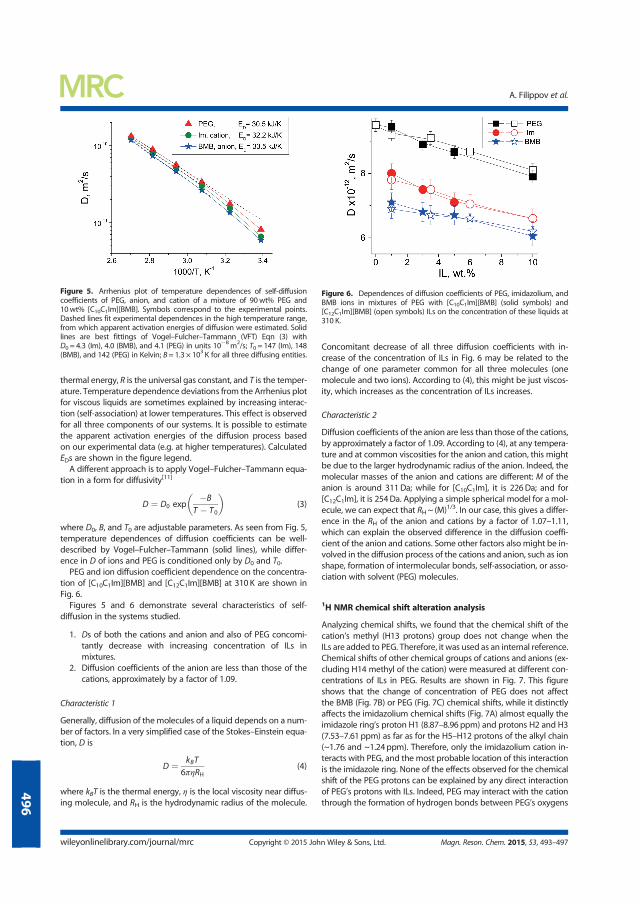
thermal energy, R is the universal gas constant, and T is the temper-ature. Temperature dependence deviations from the Arrhenius plotfor viscous liquids are sometimes explained by increasing interac-tion (self-association) at lower temperatures. This effect is observedfor all three components of our systems. It is possible to estimatethe apparent activation energies of the diffusion process basedon our experimental data (e.g. at higher temperatures). CalculatedEDs are shown in the figure legend.A different approach is to apply Vogel–Fulcher–Tammann equa-
tion in a form for diffusivity[11]
D ¼ D0 exp�B
T � T0
� �(3)
where D0, B, and T0 are adjustable parameters. As seen from Fig. 5,temperature dependences of diffusion coefficients can be well-described by Vogel–Fulcher–Tammann (solid lines), while differ-ence in D of ions and PEG is conditioned only by D0 and T0.PEG and ion diffusion coefficient dependence on the concentra-
tion of [C10C1Im][BMB] and [C12C1Im][BMB] at 310 K are shown inFig. 6.Figures 5 and 6 demonstrate several characteristics of self-
diffusion in the systems studied.
1. Ds of both the cations and anion and also of PEG concomi-tantly decrease with increasing concentration of ILs inmixtures.
2. Diffusion coefficients of the anion are less than those of thecations, approximately by a factor of 1.09.
Characteristic 1
Generally, diffusion of the molecules of a liquid depends on a num-ber of factors. In a very simplified case of the Stokes–Einstein equa-tion, D is
D ¼ kBT
6πηRH(4)
where kBT is the thermal energy, η is the local viscosity near diffus-ing molecule, and RH is the hydrodynamic radius of the molecule.
Concomitant decrease of all three diffusion coefficients with in-crease of the concentration of ILs in Fig. 6 may be related to thechange of one parameter common for all three molecules (onemolecule and two ions). According to (4), this might be just viscos-ity, which increases as the concentration of ILs increases.
Characteristic 2
Diffusion coefficients of the anion are less than those of the cations,by approximately a factor of 1.09. According to (4), at any tempera-ture and at common viscosities for the anion and cation, this mightbe due to the larger hydrodynamic radius of the anion. Indeed, themolecular masses of the anion and cations are different: M of theanion is around 311Da; while for [C10C1Im], it is 226Da; and for[C12C1Im], it is 254Da. Applying a simple spherical model for a mol-ecule, we can expect that RH~ (M)1/3. In our case, this gives a differ-ence in the RH of the anion and cations by a factor of 1.07–1.11,which can explain the observed difference in the diffusion coeffi-cient of the anion and cations. Some other factors also might be in-volved in the diffusion process of the cations and anion, such as ionshape, formation of intermolecular bonds, self-association, or asso-ciation with solvent (PEG) molecules.
1H NMR chemical shift alteration analysis
Analyzing chemical shifts, we found that the chemical shift of thecation’s methyl (H13 protons) group does not change when theILs are added to PEG. Therefore, it was used as an internal reference.Chemical shifts of other chemical groups of cations and anions (ex-cluding H14 methyl of the cation) were measured at different con-centrations of ILs in PEG. Results are shown in Fig. 7. This figureshows that the change of concentration of PEG does not affectthe BMB (Fig. 7B) or PEG (Fig. 7C) chemical shifts, while it distinctlyaffects the imidazolium chemical shifts (Fig. 7A) almost equally theimidazole ring’s proton H1 (8.87–8.96 ppm) and protons H2 and H3(7.53–7.61 ppm) as far as for the H5–H12 protons of the alkyl chain(~1.76 and ~1.24ppm). Therefore, only the imidazolium cation in-teracts with PEG, and the most probable location of this interactionis the imidazole ring. None of the effects observed for the chemicalshift of the PEG protons can be explained by any direct interactionof PEG’s protons with ILs. Indeed, PEG may interact with the cationthrough the formation of hydrogen bonds between PEG’s oxygens
Figure 5. Arrhenius plot of temperature dependences of self-diffusioncoefficients of PEG, anion, and cation of a mixture of 90wt% PEG and10wt% [C10C1Im][BMB]. Symbols correspond to the experimental points.Dashed lines fit experimental dependences in the high temperature range,from which apparent activation energies of diffusion were estimated. Solidlines are best fittings of Vogel–Fulcher–Tammann (VFT) Eqn (3) withD0 = 4.3 (Im), 4.0 (BMB), and 4.1 (PEG) in units 10�8m2/s; T0 = 147 (Im), 148(BMB), and 142 (PEG) in Kelvin; B= 1.3 × 10³ K for all three diffusing entities.
Figure 6. Dependences of diffusion coefficients of PEG, imidazolium, andBMB ions in mixtures of PEG with [C10C1Im][BMB] (solid symbols) and[C12C1Im][BMB] (open symbols) ILs on the concentration of these liquids at310 K.
A. Filippov et al.
wileyonlinelibrary.com/journal/mrc Copyright © 2015 John Wiley & Sons, Ltd. Magn. Reson. Chem. 2015, 53, 493–497
496
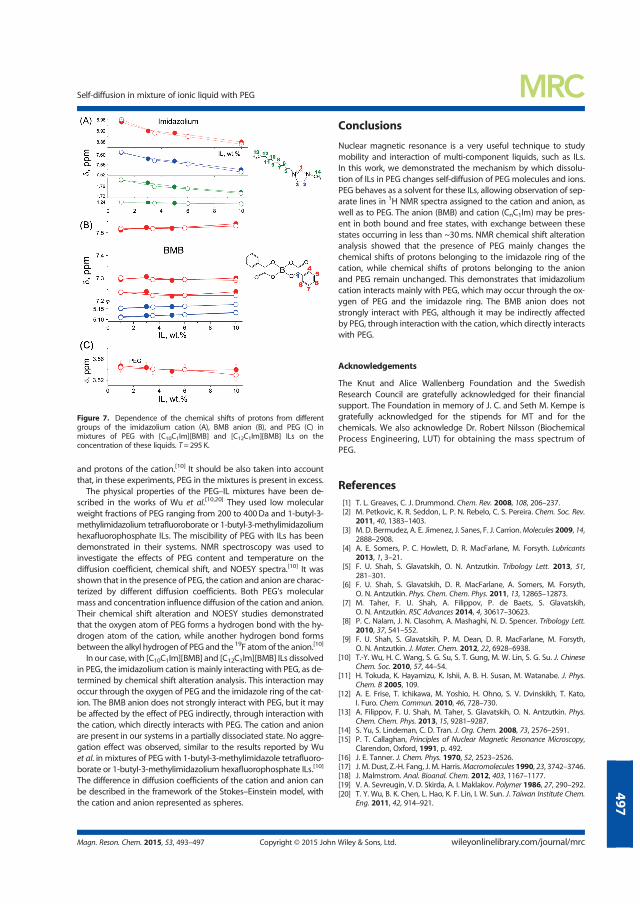
and protons of the cation.[10] It should be also taken into accountthat, in these experiments, PEG in the mixtures is present in excess.
The physical properties of the PEG–IL mixtures have been de-scribed in the works of Wu et al.[10,20] They used low molecularweight fractions of PEG ranging from 200 to 400Da and 1-butyl-3-methylimidazolium tetrafluoroborate or 1-butyl-3-methylimidazoliumhexafluorophosphate ILs. The miscibility of PEG with ILs has beendemonstrated in their systems. NMR spectroscopy was used toinvestigate the effects of PEG content and temperature on thediffusion coefficient, chemical shift, and NOESY spectra.[10] It wasshown that in the presence of PEG, the cation and anion are charac-terized by different diffusion coefficients. Both PEG’s molecularmass and concentration influence diffusion of the cation and anion.Their chemical shift alteration and NOESY studies demonstratedthat the oxygen atom of PEG forms a hydrogen bond with the hy-drogen atom of the cation, while another hydrogen bond formsbetween the alkyl hydrogen of PEG and the 19F atomof the anion.[10]
In our case, with [C10C1Im][BMB] and [C12C1Im][BMB] ILs dissolvedin PEG, the imidazolium cation is mainly interacting with PEG, as de-termined by chemical shift alteration analysis. This interaction mayoccur through the oxygen of PEG and the imidazole ring of the cat-ion. The BMB anion does not strongly interact with PEG, but it maybe affected by the effect of PEG indirectly, through interaction withthe cation, which directly interacts with PEG. The cation and anionare present in our systems in a partially dissociated state. No aggre-gation effect was observed, similar to the results reported by Wuet al. in mixtures of PEG with 1-butyl-3-methylimidazole tetrafluoro-borate or 1-butyl-3-methylimidazolium hexafluorophosphate ILs.[10]
The difference in diffusion coefficients of the cation and anion canbe described in the framework of the Stokes–Einstein model, withthe cation and anion represented as spheres.
Conclusions
Nuclear magnetic resonance is a very useful technique to studymobility and interaction of multi-component liquids, such as ILs.In this work, we demonstrated the mechanism by which dissolu-tion of ILs in PEG changes self-diffusion of PEG molecules and ions.PEG behaves as a solvent for these ILs, allowing observation of sep-arate lines in 1H NMR spectra assigned to the cation and anion, aswell as to PEG. The anion (BMB) and cation (CnC1Im) may be pres-ent in both bound and free states, with exchange between thesestates occurring in less than ~30ms. NMR chemical shift alterationanalysis showed that the presence of PEG mainly changes thechemical shifts of protons belonging to the imidazole ring of thecation, while chemical shifts of protons belonging to the anionand PEG remain unchanged. This demonstrates that imidazoliumcation interacts mainly with PEG, which may occur through the ox-ygen of PEG and the imidazole ring. The BMB anion does notstrongly interact with PEG, although it may be indirectly affectedby PEG, through interaction with the cation, which directly interactswith PEG.
Acknowledgements
The Knut and Alice Wallenberg Foundation and the SwedishResearch Council are gratefully acknowledged for their financialsupport. The Foundation in memory of J. C. and Seth M. Kempe isgratefully acknowledged for the stipends for MT and for thechemicals. We also acknowledge Dr. Robert Nilsson (BiochemicalProcess Engineering, LUT) for obtaining the mass spectrum ofPEG.
References[1] T. L. Greaves, C. J. Drummond. Chem. Rev. 2008, 108, 206–237.[2] M. Petkovic, K. R. Seddon, L. P. N. Rebelo, C. S. Pereira. Chem. Soc. Rev.
2011, 40, 1383–1403.[3] M. D. Bermudez, A. E. Jimenez, J. Sanes, F. J. Carrion.Molecules 2009, 14,
2888–2908.[4] A. E. Somers, P. C. Howlett, D. R. MacFarlane, M. Forsyth. Lubricants
2013, 1, 3–21.[5] F. U. Shah, S. Glavatskih, O. N. Antzutkin. Tribology Lett. 2013, 51,
281–301.[6] F. U. Shah, S. Glavatskih, D. R. MacFarlane, A. Somers, M. Forsyth,
O. N. Antzutkin. Phys. Chem. Chem. Phys. 2011, 13, 12865–12873.[7] M. Taher, F. U. Shah, A. Filippov, P. de Baets, S. Glavatskih,
O. N. Antzutkin. RSC Advances 2014, 4, 30617–30623.[8] P. C. Nalam, J. N. Clasohm, A. Mashaghi, N. D. Spencer. Tribology Lett.
2010, 37, 541–552.[9] F. U. Shah, S. Glavatskih, P. M. Dean, D. R. MacFarlane, M. Forsyth,
O. N. Antzutkin. J. Mater. Chem. 2012, 22, 6928–6938.[10] T.-Y. Wu, H. C. Wang, S. G. Su, S. T. Gung, M. W. Lin, S. G. Su. J. Chinese
Chem. Soc. 2010, 57, 44–54.[11] H. Tokuda, K. Hayamizu, K. Ishii, A. B. H. Susan, M. Watanabe. J. Phys.
Chem. B 2005, 109.[12] A. E. Frise, T. Ichikawa, M. Yoshio, H. Ohno, S. V. Dvinskikh, T. Kato,
I. Furo. Chem. Commun. 2010, 46, 728–730.[13] A. Filippov, F. U. Shah, M. Taher, S. Glavatskih, O. N. Antzutkin. Phys.
Chem. Chem. Phys. 2013, 15, 9281–9287.[14] S. Yu, S. Lindeman, C. D. Tran. J. Org. Chem. 2008, 73, 2576–2591.[15] P. T. Callaghan, Principles of Nuclear Magnetic Resonance Microscopy,
Clarendon, Oxford, 1991, p. 492.[16] J. E. Tanner. J. Chem. Phys. 1970, 52, 2523–2526.[17] J. M. Dust, Z.-H. Fang, J. M. Harris.Macromolecules 1990, 23, 3742–3746.[18] J. Malmstrom. Anal. Bioanal. Chem. 2012, 403, 1167–1177.[19] V. A. Sevreugin, V. D. Skirda, A. I. Maklakov. Polymer 1986, 27, 290–292.[20] T. Y. Wu, B. K. Chen, L. Hao, K. F. Lin, I. W. Sun. J. Taiwan Institute Chem.
Eng. 2011, 42, 914–921.
Figure 7. Dependence of the chemical shifts of protons from differentgroups of the imidazolium cation (A), BMB anion (B), and PEG (C) inmixtures of PEG with [C10C1Im][BMB] and [C12C1Im][BMB] ILs on theconcentration of these liquids. T= 295 K.
Self-diffusion in mixture of ionic liquid with PEG
Magn. Reson. Chem. 2015, 53, 493–497 Copyright © 2015 John Wiley & Sons, Ltd. wileyonlinelibrary.com/journal/mrc
497


Article V

1
Diffusion of Cation in Halogen-free Phosphonium Ionic
Liquids Confined between Parallel Glass Plates
Andrei Filippov1,2*, Faiz Ullah Shah1, Sergei Glavatskih3,4, Mark W.
Rutland5,6 and Oleg N. Antzutkin1
1Chemistry of Interfaces, Luleå University of Technology, SE-91187 Luleå, Sweden2Institute of Physics, Kazan Federal University, 420008 Kazan, Russia3System and Component Design, KTH Royal Institute of Technology, SE-10044
Stockholm, Sweden4Department of Mechanical Construction and Production, Ghent University,
B-9000 Ghent, Belgium5Surface and Corrosion Science, KTH Royal Institute of Technology, SE-10044
Stockholm, Sweden6SP Technical Research Institute of Sweden, Chemistry Materials and Surfaces, Box
5607, SE-114 86 Stockholm, Sweden
*Corresponding author: E-mail: [email protected]
Tel: +46(0)73-6782225
Keywords: Nuclear Magnetic Resonance; Pulsed-Field Gradient; NMR
Diffusometry; Restricted Diffusion; Diffusion Anisotropy; Phase
Decomposition
ABSTRACT: The self-diffusion of cation in three ionic liquids containing
a phosphonium [P6,6,6,14]+ cation and orthoborate anions:
bis(mandelato)borate ([BMB]-), bis(salicilato)borate ([BScB]-) or
2
bis(oxalato)borate ([BOB]-) was studied by 1H NMR pulsed field gradient
techniques with the samples confined between cleaned (polar) and
silanized (nonpolar) glass plates in the temperature range near 303 –
333 K. Diffusion coefficients along the plates (D ), as well as bulk
diffusion coefficients (D0), were obtained by direct measurements, while
diffusion coefficients normal to the plates (D ) were obtained by fitting of
model of restricted diffusion to experimental diffusion decays. Diffusion
of [P6,6,6,14]+ in bulk as well as slopes of their temperature dependences,
are different for different ILs, that may be related with different cation-
cation, cation-anion interaction and with different microstructures of these
ILs in the bulk formed in the result of these interactions. We showed, that
the effect of confinement on the diffusivity of ionic liquids can be
observed for specified ILs and in specified temperature ranges, in
micrometer-scale range. D accelerates near the nonpolar, while
decelerated near polar surface. Anisotropy of diffusion, which is expressed
as a ratio of D /D , is higher at lower temperatures. The most probable
explanation of the observed anisotropy of diffusion is a partial
rearrangement of the microstructure, typical for the ionic liquids in bulk, to
a more layered structure in the two-dimensional space between the glass
plates.
3
IntroductionIonic liquids (ILs) are chemical compounds that form typically from organic
cations and organic or inorganic anions.1,2 They are defined as a special type of
salts with a melting point at temperatures below 100oC and possess exceptional
physical-chemical properties, such as negligible vapor pressure, non-
flammability, and thermal and chemical stability. Hence, their usage in science
and industry is continuously expanding. Newly synthesized, halogen-free,
boron-based ionic liquids (hf-BILs) composed of chelated orthoborate anions
and phosphonium cations have hydrolytic stability, low melting points and
outstanding wear and friction-reducing properties.3 Bulk physical properties,
such as diffusion, demonstrated signs of micro-phase separation.4 However,
most relevant processes with ILs take place at the liquid/surface interface,
where the properties of the IL can be significantly different from those of the
IL in bulk. For example, the existence of thin 0.6 – 0.8 nm ordered layers were
inferred by X-ray diffraction in imidazolium-based ILs.5 Recently, Bovio et
al.6 and Spencer and co-workers7 obtained AFM microscopy evidence of the
formation of extended solid-like layers in [Bmim][NTf2]6 and in 1-hexyl-3-
methyl-imidazolium ethylsulfate7 near the liquid/solid interface on mica and
amorphous silica. The physical properties of phosphonium ILs near the surface
and in restricted geometry have not yet been studied.
The purpose of this work was to study diffusion of a series of ionic liquids
containing a phosphonium cation and three different orthoborate anions, which
have demonstrated promising properties for use as lubrication additives.
Nuclear magnetic resonance was used, which is an effective method to study
the diffusion of molecules in complex chemical substances.4,8,9
4
Experimental Part
Materials. Each of the three studied ionic liquids contain a phosphonium
cation [P6,6,6,14]+ and one of three orthoborate anions: bis(mandelato)borate
([BMB]-), bis(salicilato)borate ([BScB]) or bis(oxalato)borate ([BOB]-).
Structures of the IL ions are shown in Figure 1. The ILs were synthesized in
the Chemistry of Interfaces research group, Luleå University of Technology
and characterized and described in an article by Shah et al.3
All samples were transparent viscous liquids over the entire range of
temperatures studied: 303 - 333 K. Before performing the experiments, each
sample was degassed under vacuum (pressure less than 10-3 mbar, temperature
333 K) for 50 hours. The chemical composition of each sample (content of IL
and impurities) was checked by liquid 1H NMR and is presented in a paper by
Shah et al.3
Nuclear Magnetic Resonance. 1H NMR diffusion measurements of ILs were
performed on a Chemagnetics InfinityPlus CMX-360 spectrometer with a
working frequency of 359.9 MHz. A NMR goniometer probe was used, which
enables macroscopically-aligned layers to be oriented with the plate’s normal
at different angles with respect to the main magnetic field. In this series of
experiments, samples with ILs were contained within thin plates prepared from
cleaned or silanized glass. Thin glass plates (5 14 x 0.1 mm) Thermo
Scientific Menzel Gläser, Menzel GmbH, Braunschweig, Germany) were
stacked and placed in a square, cross-sectioned tube (see Figure S1 of the ESI).
The spaces between plates were estimated first by mechanical measurements
and then adjusted as fitting parameters from diffusion measurements in the
5
direction normal to the glass plates. The spaces were filled with ILs. In the
experiment, normal to the plates was oriented either along or normal to the
pulsed field gradient, therefore we measured diffusion normal or along the
glass plates, respectively.
Cleaning and silanization protocols are presented in the electronic
supplementary information (ESI) section. Contact angle measurements were
performed at the studied surfaces to examine their polarity (described in the
ESI). They showed that the cleaned glass surface had a contact angle near 0°
and the silanized glass sample between 91° and 96°. Therefore, cleaned and
silanized glasses will be referred further as polar and nonpolar once,
respectively. Preparation of samples (filling with ILs) was performed just after
cleaning or silanization procedure.
Details of the pulsed field gradient (PFG) NMR technique used for measuring
molecular diffusion can be found elsewhere.10 The primary information for the
diffusion is contained in the diffusion decay (DD) of the NMR stimulated echo
amplitude (A). For the stimulated echo pulse sequence used, the diffusion
decay of A in the case of a simple non-associating molecular liquid can be
described by the following equation:11
2 2 211
2 1
2(2 , , , ) exp exp2 dIA g g Dt
T T,
(1)
where I is the factor proportional to the proton content in the system; 1 and 2
are spin-lattice and spin-spin relaxation times, respectively; and 1 are time
intervals in the pulse sequence; is the gyromagnetic ratio for a used nucleus;
g and are the amplitude and duration of the gradient pulse; td = ( - /3) is the
6
diffusion time; = ( + 1) is the time interval between the two gradient
pulses; and D is the self-diffusion coefficient.
It has been shown in our earlier studies of [P6,6,6,14][BMB]4 and
[P6,6,6,14][BScB]21 that cation and anion have different diffusion coefficients.
This leads to additional complication of forms of integrated (cation + anion)
DDs even in bulk, without presence of any restrictions. Alongside with this,
signal from anion in the presence of restrictions is quite noisy that creates
difficulty for analysis of the anion diffusion.21 Besides, [P6,6,6,14][BOB] has no
protons in the [BOB]- anion. Therefore, in this study we measured and
analyzed only signals from [P6,6,6,14]+ cation.
Results and DiscussionsMean diffusion coefficients of [P6,6,6,14]+ cation in bulk ILs and along the glass
plates are presented in Tables S1 and S2 of ESI, column 2 and 3, respectively.
Diffusion measurements of [P6,6,6,14]+ cation in the ILs in the direction normal
to the glass plates were performed in the range of diffusion time from 111 to
1011 ms. The measurements demonstrated complicated forms of decays
dependent on diffusion time, as expected for diffusion of liquid molecules in
restricted geometry.12,13 The results obtained at = 511 ms were the most
informative because they yielded larger dynamic ranges of DDs with smaller
signal-to-noise levels, shown in Figure 2.
Figure 2 demonstrates rather complicated non-exponential forms of decays in
these ionic liquids in particular at high temperatures. All ILs exhibit
monotonous decays as a function of applied pulsed field gradient at all
temperatures. Despite of the signal belongs to [P6,6,6,14]+ cation in all ILs,
decays are different. There is also a difference between the results obtained for
7
cases of polar and nonpolar glass plates (solid and open circles in Figure 2),
which will be analyzed in the following discussion.
The main reason for the non-exponentiality of the DDs presented in Figure 2 is
evidently the presence of the glass plates, which obstruct the diffusion of the
ions, i.e. we have to analyze this phenomenon in the context of a “restricted”
diffusion in an anisotropic media. There are a number of simulations and
expressions describing the diffusion of molecules for simple non-associated
liquids between flat planes in their normal direction when the interaction of
molecules with the plane surface is characterized only by elastic collisions.12-14
It should be noted that flat plates are convenient for NMR studies because they
do not induce background gradients being oriented along or normal to the main
magnetic field due to difference of magnetic susceptibilities between the
substance of plates and the liquid.20 We attempted to use an equation proposed
by Linse and Söderman, the validity of which has been confirmed by computer
simulation: 13
12
022
22
22
expcos11
4cos12),,(
n
n
dDn
dgndg
dgdg
dggA(2)
where d is the separation between planes (which was adjusted as a fitting
parameter) and D0 is the bulk diffusion coefficient. For calculations of series in
Eq. (2), Microsoft Excel 2003 was used with the Tools-Options-Calculation
and the Tab “Iteration” check box. The number of iterations was varied up to
1000. The results from the “restricted” diffusion of the studied ILs, using Eq.
(2), are shown in Figures S2 and S3 of ESI. As seen from the figure, the model
of restricted diffusion between planes describes the experimental results quite
8
well for both, polar and nonpolar surfaces. Therefore, the values of D , used
for this approximation, can be used as diffusion coefficients of the [P6,6,6,14]+ in
the direction normal to the glass plates. Values of D are shown in Tables S1
and S2, column 4, while the whole set of values for D0, D and D is shown
in Figure 3 as an Arrhenius plot.
First of all, the figure demonstrates difference in values of Ds, as well as slopes
of their temperature dependences, corresponding to [P6,6,6,14]+ in bulk (solid
lines). This phenomenon may be related with different cation-cation, cation-
anion interaction and, probably, with different microstructure of these ILs in
the bulk formed in the result of these interactions. Following to this
consideration, the most strongly bound (structured) IL is [P6,6,6,14][BMB],
while [P6,6,6,14][BOB] suggested to have weaker interactions between ions.
Concerning systems with polar glass plates, presence of surface doesn’t
effect on D (solid circles), but decreases D (open circles).
For systems with polar glass plates D (solid stars) also shows bulk values for
[P6,6,6,14][BMB] and [P6,6,6,14][BScB], but for [P6,6,6,14][BOB] it is higher by a
factor ~1.7. The most interesting observation is that D is larger than D and
their difference is larger at lower temperatures. The difference between D and
D means there is anisotropy of diffusion of the ILs between the glass plates.
Near polar surface the diffusion of ions is slower along the plates than in
normal direction, while near nonpolar surface the effect is opposite. Anisotropy
of diffusion in our cases can be characterized by the ratio D /D (values
presented in Tables S1 and S2, column 5). For the case of polar surface the
9
strongest diffusion anisotropy is observed in [P6,6,6,14][BMB] and in
[P6,6,6,14][BOB], while it is less in [P6,6,6,14][BScB]. However for nonpolar
surface the strongest diffusion anisotropy is observed in [P6,6,6,14][BMB] and in
[P6,6,6,14][BScB], while it is less in [P6,6,6,14][BOB].
Numerous studies have suggested formation of “solid-like” layers, a structure
that IL ions may form on solid surfaces and in confined geometries.6,7,15
Literature data are rather diverse and depend on the surface and the IL used.
Translational dynamics of ionic liquids confined in pores may demonstrate
rather high mobility of ILs.15 Other side, NMR diffusion data for
[BMIM][BF4] confined in porous silica (pore size diameter of ~12 and 15 nm)
showed no decrease in ionic mobility.16 From neutron scattering data, it has
been concluded that confinement may enhance, rather than suppress,
diffusivity of a certain fraction of the cations. Studies by Chathoth et al. show
that diffusivity of the [BMIM] cation in the center of nonpolar pores of carbon
(pore diameter ~ 8.8 ± 2.1 nm) is faster than that in bulk.17,18 On the other
hand, [HMIM][PF6] demonstrated a more than 10-fold decrease in diffusivity
due to being confined in silica nanopores with a diameter of 7.5 ± 0.7 nm.19
Most published results have been obtained using nanoporous systems, while
our studied systems relate to macropores according to their interplanar distance
of 5 14 μm. However, we showed in this work, probably, to the best of our
knowledge, for the first time, that the effect of confinement on the diffusivity
of ionic liquids can be observed for specified ILs and in specified temperature
ranges, even in micrometer-scale range.
The effect of silanization of a surface on the diffusion of ILs has been studied
on [HMIM][PF6] confined in silica nanopores19 and has been shown to prevent
formation of hydrogen bonds with the surface, which leads to an increase in
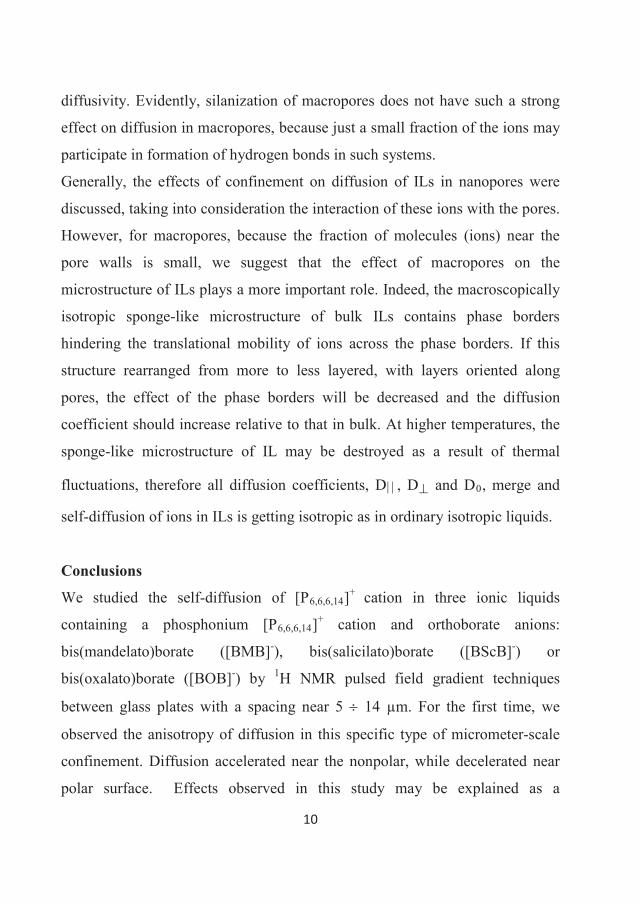
10
diffusivity. Evidently, silanization of macropores does not have such a strong
effect on diffusion in macropores, because just a small fraction of the ions may
participate in formation of hydrogen bonds in such systems.
Generally, the effects of confinement on diffusion of ILs in nanopores were
discussed, taking into consideration the interaction of these ions with the pores.
However, for macropores, because the fraction of molecules (ions) near the
pore walls is small, we suggest that the effect of macropores on the
microstructure of ILs plays a more important role. Indeed, the macroscopically
isotropic sponge-like microstructure of bulk ILs contains phase borders
hindering the translational mobility of ions across the phase borders. If this
structure rearranged from more to less layered, with layers oriented along
pores, the effect of the phase borders will be decreased and the diffusion
coefficient should increase relative to that in bulk. At higher temperatures, the
sponge-like microstructure of IL may be destroyed as a result of thermal
fluctuations, therefore all diffusion coefficients, D , D and D0, merge and
self-diffusion of ions in ILs is getting isotropic as in ordinary isotropic liquids.
Conclusions
We studied the self-diffusion of [P6,6,6,14]+ cation in three ionic liquids
containing a phosphonium [P6,6,6,14]+ cation and orthoborate anions:
bis(mandelato)borate ([BMB]-), bis(salicilato)borate ([BScB]-) or
bis(oxalato)borate ([BOB]-) by 1H NMR pulsed field gradient techniques
between glass plates with a spacing near 5 14 μm. For the first time, we
observed the anisotropy of diffusion in this specific type of micrometer-scale
confinement. Diffusion accelerated near the nonpolar, while decelerated near
polar surface. Effects observed in this study may be explained as a
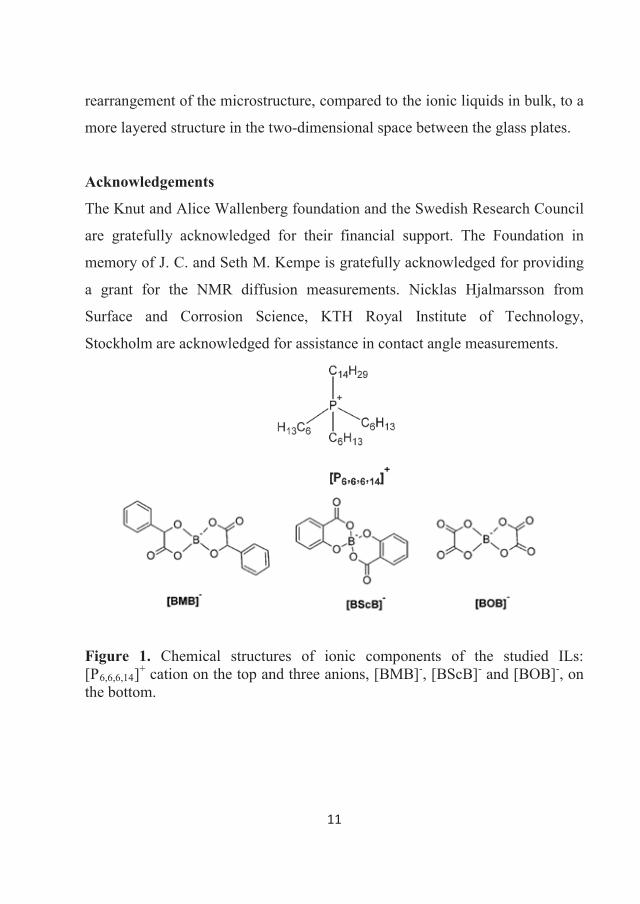
11
rearrangement of the microstructure, compared to the ionic liquids in bulk, to a
more layered structure in the two-dimensional space between the glass plates.
Acknowledgements
The Knut and Alice Wallenberg foundation and the Swedish Research Council
are gratefully acknowledged for their financial support. The Foundation in
memory of J. C. and Seth M. Kempe is gratefully acknowledged for providing
a grant for the NMR diffusion measurements. Nicklas Hjalmarsson from
Surface and Corrosion Science, KTH Royal Institute of Technology,
Stockholm are acknowledged for assistance in contact angle measurements.
Figure 1. Chemical structures of ionic components of the studied ILs: [P6,6,6,14]+ cation on the top and three anions, [BMB]-, [BScB]- and [BOB]-, onthe bottom.
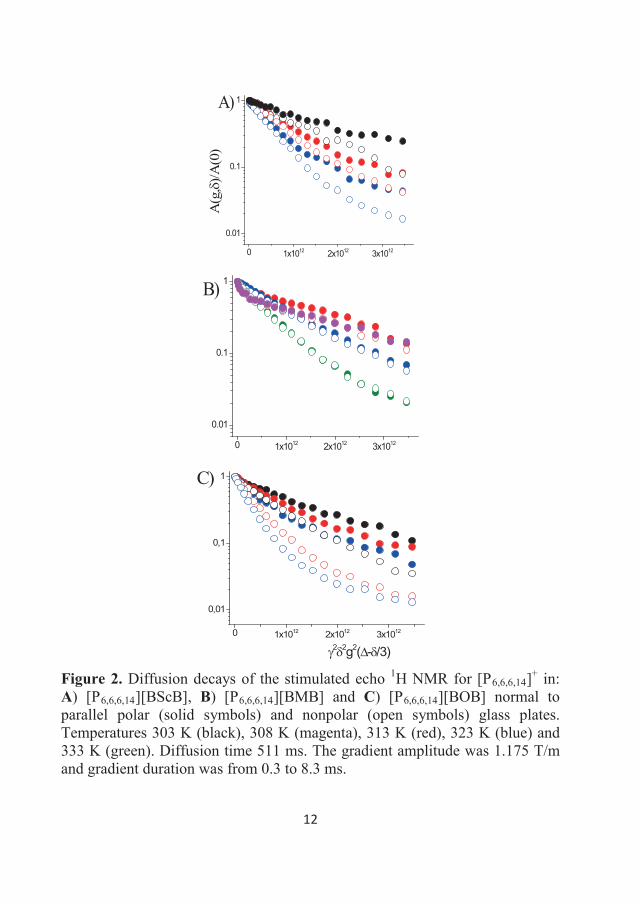
12
0 1x10¹² 2x10¹² 3x10¹²
0.01
0.1
1A)
A(g
,)/A
(0)
0 1x10¹² 2x10¹² 3x10¹²
0.01
0.1
1B)
0 1x10¹² 2x10¹² 3x10¹²
0,01
0,1
1C)
2 2g2( - /3)
Figure 2. Diffusion decays of the stimulated echo 1H NMR for [P6,6,6,14]+ in: A) [P6,6,6,14][BScB], B) [P6,6,6,14][BMB] and C) [P6,6,6,14][BOB] normal to parallel polar (solid symbols) and nonpolar (open symbols) glass plates. Temperatures 303 K (black), 308 K (magenta), 313 K (red), 323 K (blue) and 333 K (green). Diffusion time 511 ms. The gradient amplitude was 1.175 T/m and gradient duration was from 0.3 to 8.3 ms.
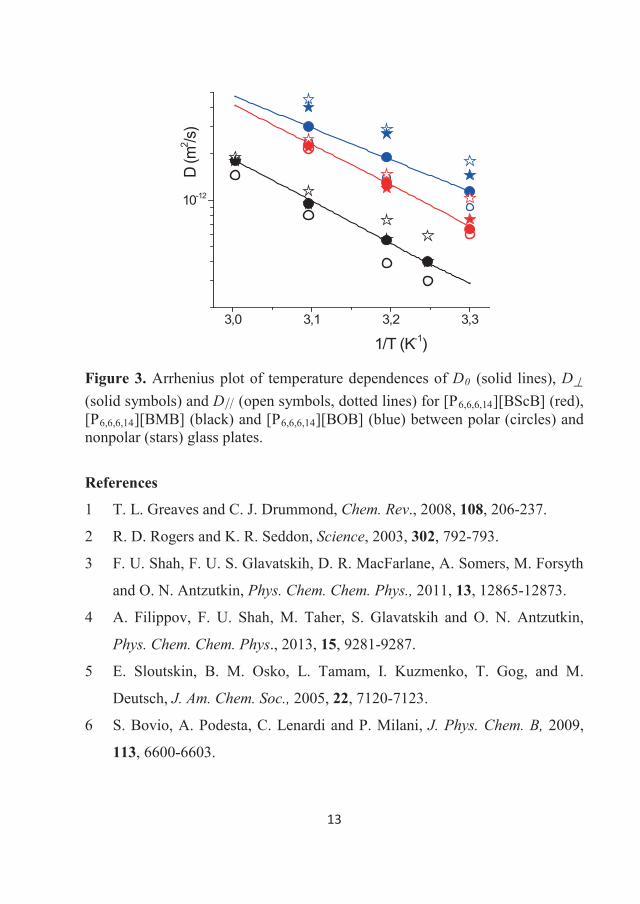
13
3,0 3,1 3,2 3,3
10-12D
(m2 /s
)
1/T (K-1)
Figure 3. Arrhenius plot of temperature dependences of D0 (solid lines), D(solid symbols) and D (open symbols, dotted lines) for [P6,6,6,14][BScB] (red), [P6,6,6,14][BMB] (black) and [P6,6,6,14][BOB] (blue) between polar (circles) and nonpolar (stars) glass plates.
References
1 T. L. Greaves and C. J. Drummond, Chem. Rev., 2008, 108, 206-237.
2 R. D. Rogers and K. R. Seddon, Science, 2003, 302, 792-793.
3 F. U. Shah, F. U. S. Glavatskih, D. R. MacFarlane, A. Somers, M. Forsyth
and O. N. Antzutkin, Phys. Chem. Chem. Phys., 2011, 13, 12865-12873.
4 A. Filippov, F. U. Shah, M. Taher, S. Glavatskih and O. N. Antzutkin,
Phys. Chem. Chem. Phys., 2013, 15, 9281-9287.
5 E. Sloutskin, B. M. Osko, L. Tamam, I. Kuzmenko, T. Gog, and M.
Deutsch, J. Am. Chem. Soc., 2005, 22, 7120-7123.
6 S. Bovio, A. Podesta, C. Lenardi and P. Milani, J. Phys. Chem. B, 2009,
113, 6600-6603.
14
7 L. A. Jurado, H. Kim, A. Arcifa, A. Rossi, C. Leal and N. D. Spencer,
Phys. Chem. Chem. Phys., 2015, 17, 13613-13624.
8 H. Li, In: Structures and interactions of ionic liquids; S. Zhang, J. Wang,
Q. Zhao and Q. Zhou, (Eds.), Springer, Book Series: Structure and
Bonding, 2014, 151, 175-193.
9 A. E. Frise, T. Ichikawa, M. Yoshio, H. Ohno, S. V. Dvinskikh, T. Kato
and I. Furo, Chem. Commun., 2010, 46, 728-730.
10 P. T. Callaghan, Principles of Nuclear Magnetic Resonance Microscopy.
Clarendon, Oxford, 1991.
11 J. E. Tanner, J. Chem. Phys., 1970, 52, 2523-2526.
12 B. Balinov, B. Jönsson, P. Linse and O. Söderman, J. Magn. Reson. A,
1993, 104, 17-25.
13 P. Linse and O. Söderman, J. Magn. Reson. A, 1995, 116, 77-86.
14 C. H. Neuman, J. Chem. Phys., 1974, 60, 4508-4511.
15 M. P. Singh, R. K. Singh and S. Chandra, Progr. Mater. Sci., 2014, 64, 73-
120.
16 T. Echelmeyer, H. W. Meyer and L. V. Wullen, Chem. Mater., 2009, 21,
2280-2285.
17 S. M. Chathoth, E. Mamontov, S. Dai, X. Wang, P. F. Fulvio and D. J.
Wesolowski, Europhys. Lett., 2012, 97, 66004.
18 S. M. Chathoth, E. Mamontov, P. F. Fulvio, X. Wang, G. A. Baker, S. Dai
and D. J. Wesolowski, Europhys. Lett., 2013, 102, 16004.
19 C. Iacob, J. R. Sangoro, P. Papadopoulus, T. Schubert, S. Naumov, R.
Valiullin, J. Kärger, F. Kremer, Phys. Chem. Chem. Phys., 2010, 12,
13798-13803.
15
20 Glassel, J. A.; Lee, K. H. On the interpretation of water nuclear magnetic
resonance relaxation times in heterogeneous systems. J. Amer. Chem. Soc.,
1974, 96, 970-978.
21 A. Filippov, N. Azancheev, F. U. Shah, S. Glavatskih, and
Oleg N. Antzutkin Self-Diffusion of Phosphonium Bis(Salicylato)Borate
Ionic Liquid in Pores of Vycor Porous Glass: A 1H NMR study. Phys.
Chem. Chem. Phys., 2015, submitted.
16
Electronic Supplementary Information
Diffusion of Cation in Halogen-free Phosphonium Ionic
Liquids Confined between Parallel Glass Plates
Andrei Filippov1,2*, Faiz Ullah Shah1, Sergei Glavatskih3,4, Mark W.
Rutland5,6 and Oleg N. Antzutkin1
1Chemistry of Interfaces, Luleå University of Technology, SE-91187 Luleå, Sweden2Institute of Physics, Kazan Federal University, 420008 Kazan, Russia3System and Component Design, KTH Royal Institute of Technology, SE-10044
Stockholm, Sweden4Department of Mechanical Construction and Production, Ghent University,
B-9000 Ghent, Belgium5Surface and Corrosion Science, KTH Royal Institute of Technology, SE-10044
Stockholm, Sweden6SP Technical Research Institute of Sweden, Chemistry Materials and Surfaces, Box
5607, SE-114 86 Stockholm, Sweden
*Corresponding author: E-mail: [email protected]
Tel: +46 (0) 736782225
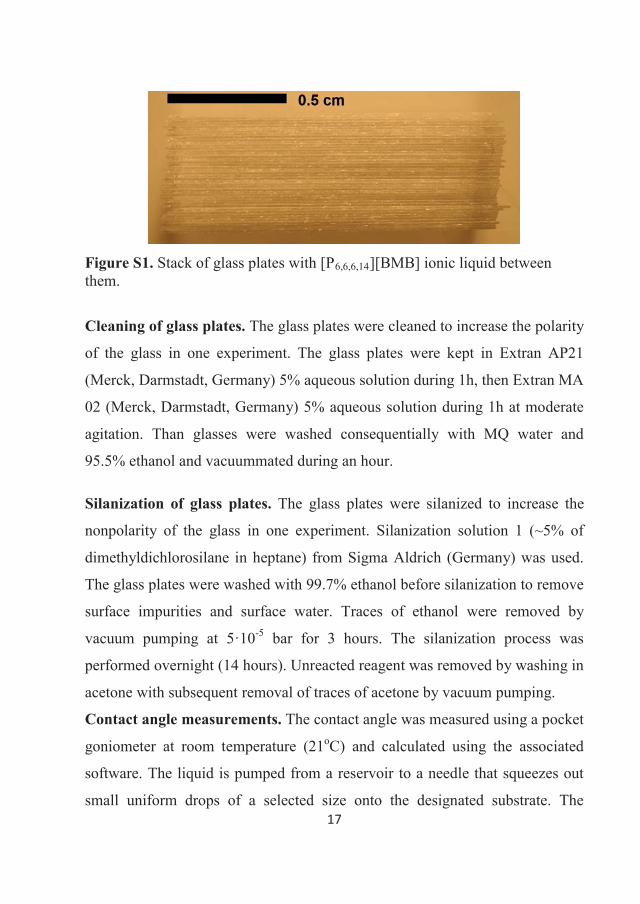
17
Figure S1. Stack of glass plates with [P6,6,6,14][BMB] ionic liquid between them.
Cleaning of glass plates. The glass plates were cleaned to increase the polarity
of the glass in one experiment. The glass plates were kept in Extran AP21
(Merck, Darmstadt, Germany) 5% aqueous solution during 1h, then Extran MA
02 (Merck, Darmstadt, Germany) 5% aqueous solution during 1h at moderate
agitation. Than glasses were washed consequentially with MQ water and
95.5% ethanol and vacuummated during an hour.
Silanization of glass plates. The glass plates were silanized to increase the
nonpolarity of the glass in one experiment. Silanization solution 1 (~5% of
dimethyldichlorosilane in heptane) from Sigma Aldrich (Germany) was used.
The glass plates were washed with 99.7% ethanol before silanization to remove
surface impurities and surface water. Traces of ethanol were removed by
vacuum pumping at 5·10-5 bar for 3 hours. The silanization process was
performed overnight (14 hours). Unreacted reagent was removed by washing in
acetone with subsequent removal of traces of acetone by vacuum pumping.
Contact angle measurements. The contact angle was measured using a pocket
goniometer at room temperature (21oC) and calculated using the associated
software. The liquid is pumped from a reservoir to a needle that squeezes out
small uniform drops of a selected size onto the designated substrate. The
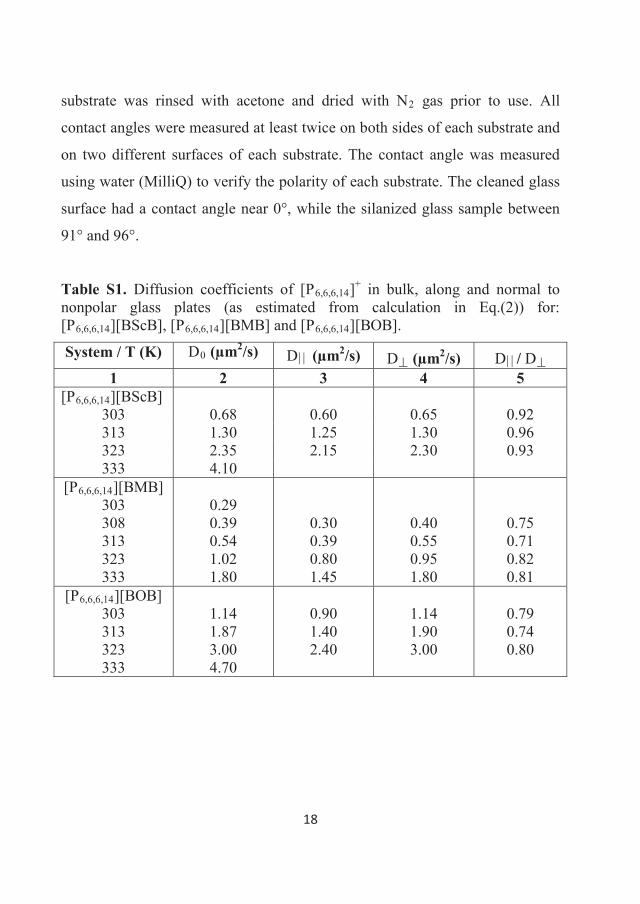
18
substrate was rinsed with acetone and dried with N2 gas prior to use. All
contact angles were measured at least twice on both sides of each substrate and
on two different surfaces of each substrate. The contact angle was measured
using water (MilliQ) to verify the polarity of each substrate. The cleaned glass
surface had a contact angle near 0°, while the silanized glass sample between
91° and 96°.
Table S1. Diffusion coefficients of [P6,6,6,14]+ in bulk, along and normal to nonpolar glass plates (as estimated from calculation in Eq.(2)) for: [P6,6,6,14][BScB], [P6,6,6,14][BMB] and [P6,6,6,14][BOB].
System / T (K) D0 (μm2/s) D (μm2/s) D (μm2/s) D / D1 2 3 4 5
[P6,6,6,14][BScB]303 0.68 0.60 0.65 0.92313 1.30 1.25 1.30 0.96323 2.35 2.15 2.30 0.93333 4.10
[P6,6,6,14][BMB]303308313323333
0.290.390.541.021.80
0.300.390.801.45
0.400.550.951.80
0.750.710.820.81
[P6,6,6,14][BOB]303313323333
1.141.873.004.70
0.901.402.40
1.141.903.00
0.790.740.80
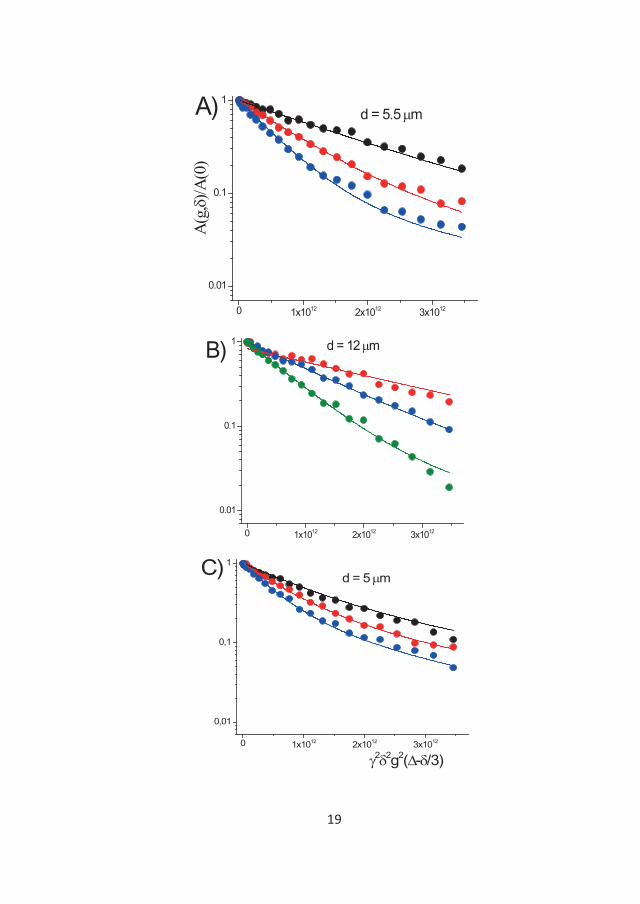
19
0 1x10¹² 2x10¹² 3x10¹²
0.01
0.1
1
A(g
,)/A
(0)
d = 5.5 mA)
0 1x10¹² 2x10¹² 3x10¹²
0.01
0.1
1B) d = 12 m
0 1x10¹² 2x10¹² 3x10¹²
0,01
0,1
1
2 2g2( - /3)
d = 5 mC)
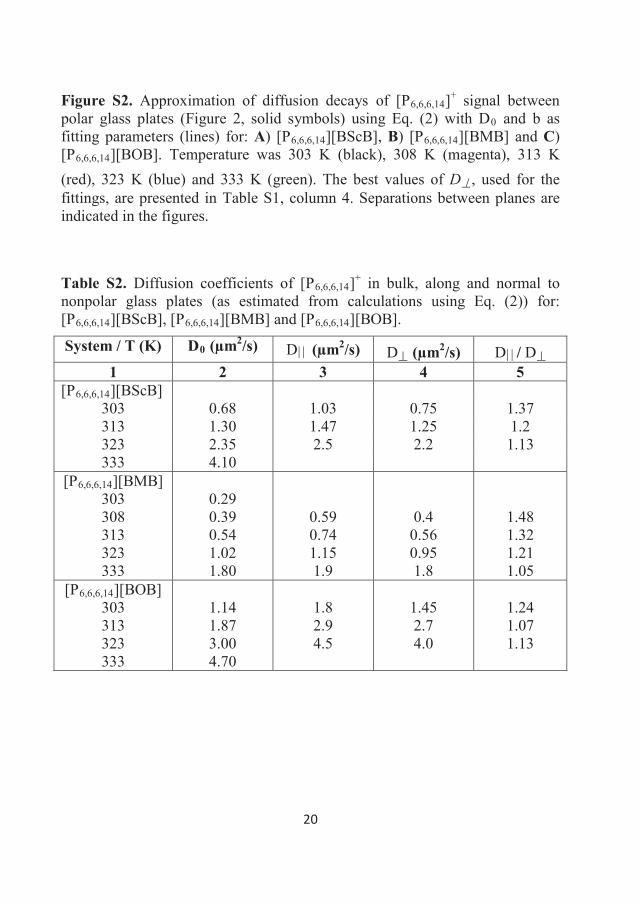
20
Figure S2. Approximation of diffusion decays of [P6,6,6,14]+ signal between polar glass plates (Figure 2, solid symbols) using Eq. (2) with D0 and b as fitting parameters (lines) for: A) [P6,6,6,14][BScB], B) [P6,6,6,14][BMB] and C)[P6,6,6,14][BOB]. Temperature was 303 K (black), 308 K (magenta), 313 K (red), 323 K (blue) and 333 K (green). The best values of D , used for the fittings, are presented in Table S1, column 4. Separations between planes are indicated in the figures.
Table S2. Diffusion coefficients of [P6,6,6,14]+ in bulk, along and normal to nonpolar glass plates (as estimated from calculations using Eq. (2)) for: [P6,6,6,14][BScB], [P6,6,6,14][BMB] and [P6,6,6,14][BOB].
System / T (K) D0 (μm2/s) D (μm2/s) D (μm2/s) D / D1 2 3 4 5
[P6,6,6,14][BScB]303 0.68 1.03 0.75 1.37313 1.30 1.47 1.25 1.2323 2.35 2.5 2.2 1.13333 4.10
[P6,6,6,14][BMB]303308313323333
0.290.390.541.021.80
0.590.741.151.9
0.40.560.951.8
1.481.321.211.05
[P6,6,6,14][BOB]303313323333
1.141.873.004.70
1.82.94.5
1.452.74.0
1.241.071.13
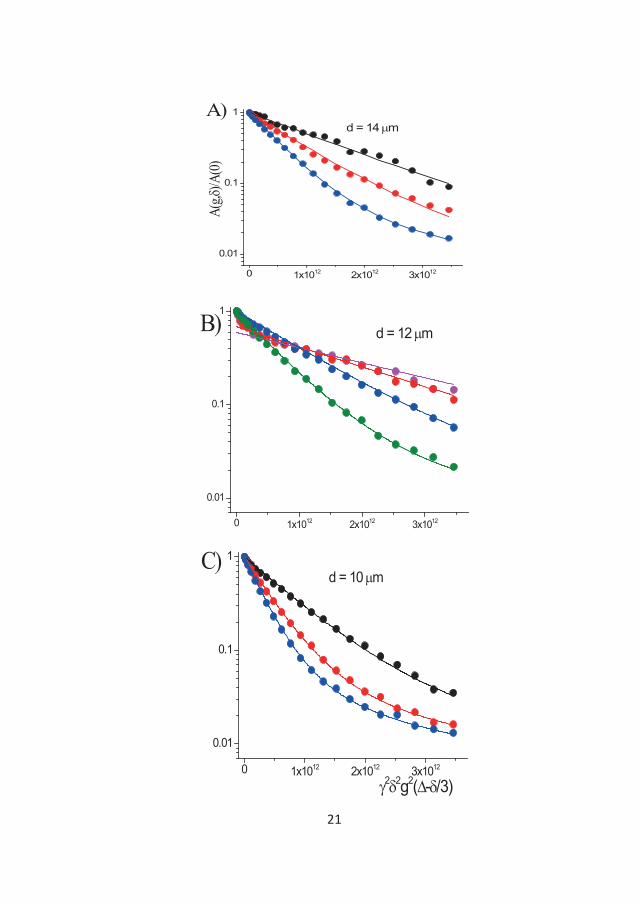
21
0 1x10¹² 2x10¹² 3x10¹²
0.01
0.1
1A)
A(g,
)/A(0)
d = 14 m
0 1x10¹² 2x10¹² 3x10¹²
0.01
0.1
1B) d = 12 m
0 1x10¹² 2x10¹² 3x10¹²
0.01
0.1
1C)
2 2g2( - /3)
d = 10 m
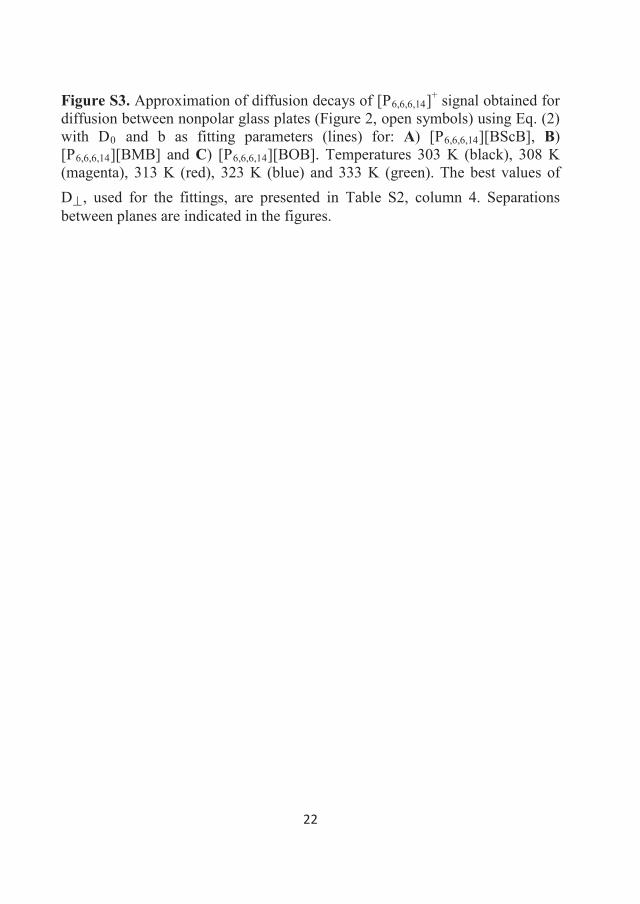
22
Figure S3. Approximation of diffusion decays of [P6,6,6,14]+ signal obtained for diffusion between nonpolar glass plates (Figure 2, open symbols) using Eq. (2) with D0 and b as fitting parameters (lines) for: A) [P6,6,6,14][BScB], B)[P6,6,6,14][BMB] and C) [P6,6,6,14][BOB]. Temperatures 303 K (black), 308 K (magenta), 313 K (red), 323 K (blue) and 333 K (green). The best values of D , used for the fittings, are presented in Table S2, column 4. Separations between planes are indicated in the figures.

Article VI

1
Self-Diffusion of Phosphonium Bis(Salicylato)Borate
Ionic Liquid in Pores of Vycor Porous Glass
Andrei Filippov,a,* Nail Azancheev,b Faiz Ullah Shah,a Sergei Glavatskih,c,d
and Oleg N. Antzutkina
aChemistry of Interfaces, Luleå University of Technology, SE-97187 Luleå, SwedenbKazan Federal University, 420008 Kazan, RussiacSystem and Component Design, KTH Royal Institute of Technology, SE-10044
Stockholm, SwedendDepartment of Mechanical Construction and Production, Ghent University,
B-9000 Ghent, Belgium
*Corresponding author: E-mail: [email protected]
Tel: +46 (0)736782225
Keywords: nuclear magnetic resonance, pulsed-field gradient, NMR
diffusometry, restricted diffusion, confined liquid, translational mobility
Abstract1H NMR pulsed field gradient was used to study self-diffusion of a
phosphonium bis(salicylato)borate ionic liquid ([P6,6,6,14][BScB]) in the
pores of Vycor porous glass at 296 K. Confinement in pores increases
diffusion coefficients of ions enormously, by almost a factor of 35.
However, a part of [P6,6,6,14][BScB] ions demonstrated apparent diffusion
coefficients much lower than their mean values, which may be conditioned
by partially restricted diffusion of ions in regions bounded by pore necks
2
(micropores) and empty voids. Heating of the ionic liquid / Vycor system
at 330 K led to a change of diffusivity of ions because of their
redistribution in pores. The size of the bounded regions is of the order of 1
μm, as it was estimated from the dependence of ions diffusivity on the
diffusion time.
1. IntroductionIonic liquids (ILs) are compounds composed of organic cations and organic or
inorganic anions. They possess unique physical-chemical properties such as
negligible vapor pressure, non-flammability, and a high thermal and chemical
stability. Hence, they are one of the attractive materials for use in modern
industry. Recently synthesised halogen-free, boron-based ionic liquids (hf-
BILs) composed of chelated orthoborate anions and phosphonium cations are
hydrophobic and have a high hydrolytic stability, low melting points and
outstanding wear and friction-reducing properties [1]. Bulk physical properties
of some of these ILs, such as diffusion, demonstrated indications of micro-
phase separation [2]. However, the properties of ILs at the liquid/surface
interface and in pores can be significantly different from those in bulk.
Previously, a few groups reported on solid-like layers, which ions of ILs may
form on solid surfaces and in confined spaces [3-5]. Experiments probing
translational dynamics of ILs confined in pores demonstrated an elevated
mobility of different classes of ILs [5-9]. However, the physical properties of
phosphonium-orthoborate ILs near surfaces and in restricted spaces have not
yet been studied; nevertheless they might be important to understand the
lubrication performance of these ILs as well as properties of the porous
material.
3
The purpose of this work was to study the bulk and confined self-diffusion of
one of a series of ionic liquids that contains phosphonium cations [P6,6,6,14]+
and the bis(salicylato)borate anion, [BScB]- and to demonstrate properties of
the [P6,6,6,14][BScB] ionic liquid as a promising neat lubricant or as an additive
to lubricants. For studies of the confined self-diffusion of this IL a model
mesoporous material, Vycor porous glass, was employed and the samples were
probed using 1H pulse-field-gradient (PFG) nuclear magnetic resonance
(NMR) spectroscopy, an effective method to study the molecular diffusion of
complex chemical substances [2,10,11].
2. Materials and methods2.1. Materials
The studied ionic liquid contains trihexyltetradecylphosphonium cations,
[P6,6,6,14]+, and bis(salicylato)borate anions, [BScB]-. Molecular structures of
the ions are shown in Fig. 1. [P6,6,6,14][BScB] was synthesised in the Chemistry
of Interfaces of Luleå University of Technology and characterised and
described previously by Shah et al.1 [P6,6,6,14][BScB] is a transparent viscous
liquid. Before introducing the IL into pores, it was degassed under vacuum
(pressure less than 10-3 mbar and temperature 333 K) for 50 hours. The
chemical composition of the IL sample (content of IL and impurities) was
checked by liquid 1H, 13C and 11B NMR and reported by Shah et al. [1].
Vycor 7930 porous glass was purchased from Advanced Glass & Ceramics (St.
James, NC) [12,13]. Vycor has the form of a cylinder with a length of 15 mm
and a diameter of 4 mm. It is characterised mainly by a 40-Å pore size, 28%
volume open porosity and the internal surface area of ca 250 m2g-1. Before use,
the glass was cleaned by heating in a 30% hydrogen peroxide aqueous solution
4
at 373 K for 48 h. Afterwards, it was washed with distilled water and dried
under vacuum. Activation of the glass was performed at 473 K for 1 h. The
glass cylinder was then cooled and placed in a bath with [P6,6,6,14][BScB] under
vacuum, then atmospheric pressure was applied for two weeks at 294 K. After
that, the sample was removed from the bath, wiped with filter paper and placed
in a glass sample tube.
The sample was weighed and calculations taking into account the density of
bulk [P6,6,6,14][BScB] (1 g cm-3 at 293 K) showed that approximately 70% of
the pores (~ 21% of the sample volume) were filled. We have estimated a
filling factor of the same Vycor cylinder for water (H2O) using bulk water
density (0.997 g cm-3 at 293 K) and observed that 100% of pores (~ a factor of
29 of the Vycor cylinder volume) were filled. Taking this into account, the
apparent value for the volume filling factor of 70% of IL in Vycor may reveal
that: (i) density of [P6,6,6,14][BScB] in pores is smaller to that in the bulk; (ii)
[P6,6,6,14][BScB] occupies only a part of pores; (iii) both (i) and (ii) situations
may occur. In the case (ii) empty voids, which are not filled with the IL, may
exist in the porous space.
Just after preparation, the sample was studied by NMR at 296 K, and then
heated at 330 K for 3 h to homogenize the distribution of the IL inside the
pores and studied again by NMR at 296 K.
2.2. Nuclear Magnetic Resonance
NMR measurements were performed on a Bruker Avance III (Bruker BioSpin
AG, Fällanden, Switzerland) NMR spectrometer. The working frequency for 1H was 400.27 MHz and 128.328 MHz for 11B. Data were processed using
Bruker Topspin 3.1 software. NMR self-diffusion measurements were
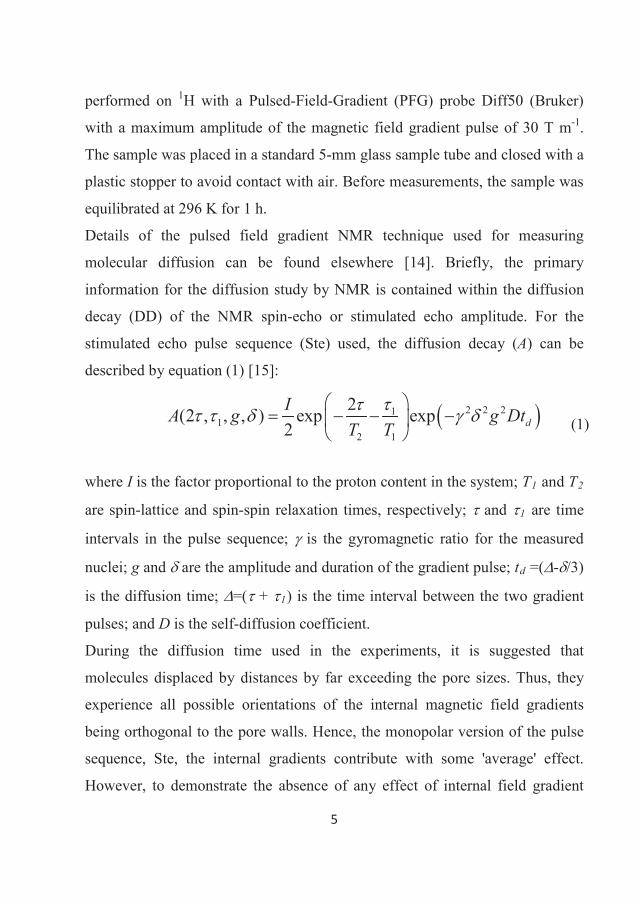
5
performed on 1H with a Pulsed-Field-Gradient (PFG) probe Diff50 (Bruker)
with a maximum amplitude of the magnetic field gradient pulse of 30 T m-1.
The sample was placed in a standard 5-mm glass sample tube and closed with a
plastic stopper to avoid contact with air. Before measurements, the sample was
equilibrated at 296 K for 1 h.
Details of the pulsed field gradient NMR technique used for measuring
molecular diffusion can be found elsewhere [14]. Briefly, the primary
information for the diffusion study by NMR is contained within the diffusion
decay (DD) of the NMR spin-echo or stimulated echo amplitude. For the
stimulated echo pulse sequence (Ste) used, the diffusion decay (A) can be
described by equation (1) [15]:
2 2 211
2 1
2(2 , , , ) exp exp2 dIA g g Dt
T T (1)
where I is the factor proportional to the proton content in the system; 1 and 2
are spin-lattice and spin-spin relaxation times, respectively; and 1 are time
intervals in the pulse sequence; is the gyromagnetic ratio for the measured
nuclei; g and are the amplitude and duration of the gradient pulse; td =( - /3)
is the diffusion time; =( + 1) is the time interval between the two gradient
pulses; and D is the self-diffusion coefficient.
During the diffusion time used in the experiments, it is suggested that
molecules displaced by distances by far exceeding the pore sizes. Thus, they
experience all possible orientations of the internal magnetic field gradients
being orthogonal to the pore walls. Hence, the monopolar version of the pulse
sequence, Ste, the internal gradients contribute with some 'average' effect.
However, to demonstrate the absence of any effect of internal field gradient
6
directly, a 13-interval stimulated echo sequence with bipolar gradient pulses
[16] (Bp2) modified by including a longitudinal Eddy-current-delay [17] was
also used. The latter pulse sequence removes cross-terms arising from the
applied pulsed gradients, g and g0, which are significant even if g0 values are
small. In our measurements, was 2 ms, was 5 ms (Ste) or 7.24 ms (Bp2), td
was set in the range of 17-600 ms, and the amplitude of g was varied from 0 to
5 T m-1.
3. Results and Discussion
3.1. 1H and 11B NMR spectra in bulk and confined [P6,6,6,14][BScB]
Fig. 2A and 2B show 1H NMR spectra of [P6,6,6,14][BScB] in bulk and confined
in pores of Vycor, respectively. 1H chemical shifts for this IL have been
reported by Shah et al.[1] The range of 0.8 – 2.0 ppm corresponds to alkyl
chains of the cation [P6,6,6,14]+, while the aromatic range of 6.5 – 8.2 ppm
corresponds to the anion [BScB]- [1]. Resolution of the spectra is much poorer
for the IL confined in pores (Fig. 2B), which can be a result of slowing down
of the rotational mobility of the ions in the pores, resulting in an insufficient
averaging of the proton dipolar interactions. Nevertheless, signals from both
the cation and anion still can be readily distinguished in the 1H spectrum.
Therefore, the spectral lines can be used to measure selectively diffusion
decays corresponding to the cations or anions in the pores. Heating at 330 K
for 3 h does not change the form of the NMR spectra for the IL in pores (solid
and dashed lines in Fig. 2B). 11B NMR spectra were also obtained for the
sample before and after heating at 330 K for 3 h (see Fig. 2C) that revealed a
broad resonance line at ca 3.5 ppm i.e. the same shift as for the
7
bulk [P6,6,6,14][BScB] [1]. A significant line broadening in 11B NMR spectrum
of [P6,6,6,14][BScB] in pores is probably for the same reasons as broadening of
resonance lines in 1H NMR spectra (Fig. 2B). Interestingly, confinement of
[P6,6,6,14][BScB] in pores does not change the 11B chemical shift of the IL. It is
known that 11B NMR chemical shift for orthoborate anions is very sensitive to
the chemical structure of the anion [1]. For example, the boron site in the
bis(mandelato)borate anion has a 11B chemical shift of ~ 10.8 ppm, for the
bis(oxalato)borate anion it is ~ 7.3 ppm, for bis(malonato)borate it is ~ 3.4 ppm
and for the [BScB]- anion it is ~ 3.5 ppm. The same value of the 11B chemical
shift of [BScB]- inside Vycor pores suggests the chemical stability of the anion
and its rather weak interaction with the surface sites of the Vycor glass. Even
after heating at 330 K for 3 h no change in 11B chemical shift and no any
additional resonance lines, which could correspond to decomposition products
of the [BScB]- anion, were observed.
3.2. Diffusion of [P6,6,6,14][BScB] in bulk
Diffusion decays (DDs) for different 1H NMR resonance lines of the bulk
[P6,6,6,14][BScB] in 1H PFG NMR experiments are all single-component decays
for both the cation and anion, but the slopes of the decays are different (Fig. 3).
The diffusion coefficient of the [BScB]- anion estimated from these DDs is
16% larger than that of the [P6,6,6,14]+ cation, which means that the cation and
anion diffuse separately, at least to some extent.
8
3.3. Experimental results of diffusion of [P6,6,6,14][BScB] in pores of Vycor
Before heating at 330 K
Diffusion decays for both types of ions of [P6,6,6,14][BScB] in pores strongly
depend on the diffusion time. Fig. 4A, 4B and 4C show DDs at diffusion times
of 17, 170 and 300 ms, respectively. In these figures, one can see that the DDs
of [P6,6,6,14][BScB] in pores have rather complicated forms. The analysis
showed that each of the decays (for the cation and the anion) is close to a two-
exponential decay. The analysis of the diffusion coefficients of the components
was mostly straightforward for DDs obtained at a shorter diffusion time, 17 ms,
(Fig. 4A, Table S1 in ESI). Diffusion coefficients (Ds) corresponding to the
“faster” diffusion components for cations and anions are roughly a factor of 35-
40 larger than those of the “slower” diffusion components, the latter are similar
to Ds of cations and anions, respectively, in the bulk IL (compare with data in
Fig. 3). Ds of the “faster” components are approximately a factor of 35 higher
than those of corresponding slower components. Mean values of Ds calculated
from the initial slopes of DDs for cation and anion (dotted lines) are both close-12 m2/s. Signals from the [BScB]- anion is noisier than that of [P6,6,6,14]+
cation because of the accelerated T2 relaxation for more rigid structure of the
anion. As the diffusion time (and 1) increases, the signals from both anion and
cation decay because of T1 relaxation processes. Therefore signals from the
ionic liquid became noisier, particularly in the case of [BScB]- anion. An
increase in the diffusion time to 170 ms and further to 300 ms leads to “faster”
diffusion component of anion disappears at these experimental conditions (see
Fig. 4B and 4C) due to NMR T1 relaxation weighting. Mean Ds of the cation
do not change at these experimental conditions but the apparent fraction of the
“slower” component decreases, as shown in Fig. S1 in the ESI. Diffusion
9
decays obtained using the stimulated echo pulse sequence with bipolar
gradients (Fig. S1 of ESI) show essentially no a significant effect of the bipolar
gradient on the observed diffusion coefficients of the cation.
After heating at 330 K for 3 h
After heating the samples at 330 K for 3 h, there was also no difference in the
results of the stimulated spin echo with mono-polar and bipolar pulsed field
gradient compared to data obtained for the unheated samples. An example
demonstrating that is shown in Fig. S2 of the ESI. However, after heating the
sample, diffusion decays changed significantly (Fig. S3 of ESI). DDs also
changed with an increase in diffusion time as shown in Fig. 5. For the diffusion
time of 17 ms (Fig. 5A), DDs can only roughly be described as sums of two
components (Table S1 in ESI) and the values of slower diffusion coefficients
increase relative to the sample before heating (Fig. 4A); diffusion coefficients
of slow-diffusing components increase by ca 10 fold as compared to a
unheated sample described above. For the 300-ms diffusion time (Fig. 5B), the
apparent fraction of the “slowly” diffusing component assigned to the cation
decreases (from 0.32 to 0.25), while the DD for the anion demonstrates
almost single-component diffusion. Finally, for the 600-ms diffusion time (Fig.
5C), DDs for both the cation and anion appear nearly identical to those of
single-component diffusion. A comparison of DDs for the cation [P6,6,6,14]+ is
also shown in Fig. S4 of the ESI.
The DDs for the cation and anion change, while mean values of Ds of both ions-12 m2/s) are almost independent of the diffusion time in the entire range of
diffusion times studied. Such behavior is typical for the process of exchange
10
between states with different Ds if the lifetimes of molecules in these states are
in the time-scale of the diffusion measurements [10,11].
All diffusion coefficients obtained by two-exponential approximations are
summarized in Figure 6 and in the Table S1 in ESI.
3.4. Diffusion of [BScB]- and [P6,6,6,14]+ ions in pores of Vycor
Porous Vycor glass is suggested as a typical mesoporous material. The pore
space of Vycor is formed by a process of spinodal decomposition of a boron-
rich phase, which is then chemically etched out. This results in a random,
interconnected pore space [12,13,16]. Mean pore diameter is 4 nm. Besides
pore diameter, another parameter that characterises the pores is the chord
length. Chords are defined by the intersection of lines with the two-phase
interfaces [18]. In Vycor the mean chord length was estimated as ~15 nm [19].
Thus, pores in Vycor are longer than the pore diameter. Vycor may also
contain micropores [20-22]. Open-ended cylindrical capillaries do not describe
very well the shape of Vycor pores [21,22]. SAXS showed that two or more
geometries contribute to the Vycor pore structure [21]. Adsorption-desorption
isotherms has reveled that the pore channels consist of alternating enlargements
(voids) and constructions (necks) [22]. A rich range of phenomena that can
occur when a fluid is adsorbed into a porous medium has been illustrated [21-
22]. Because of the randomness of the porous material and the presence of very
small pores, neither the adsorption process, nor the desorption process is
uniform, as might be expected for an ideal porous material.
One observation of our study is that the heating does not have an effect on
both, the chemical shifts and broadening of the 1H and 1B NMR spectra,
therefore no cation and anion decomposition occurs. But, diffusion is different
11
for the sample before and after its heating at 330 K for 3 h. Evidently, the
higher mobility of ions at 330 K allows them to redistribute in the porous space
of Vycor in a more energetically favorable way, to reach equilibrium and DDs
represent peculiarities of distribution of the IL in pores of Vycor. Indeed, the
pore space of the porous Vycor glass is continuous [24], therefore pores may
be saturated with a fluid if pressure is applied. However restricted connectivity
of the pore space of Vycor cylinder can be expected due to the presence of the
pore necks (micropores). At 294 K thermal energy is not enough to overcome
this barrier (necks) that might be one of the reasons why the pores saturated
with a fluid cannot reach the equilibrium. However, heating to 330 K gives the
ions an extra energy to overcome this barrier. The second possible reason is
that the Vycor filled with a liquid may contain small, randomly distributed
empty voids with an average radius of ~50 Å, consistent with possible areas
where the pores intersect [16] that agree with less than 100% filling of the
pores with the IL. Ultra-small angle neutron scattering showed that all the
micropores of the Vycor glass are interconnected [16], but diffusion through
them, as well as presence of empty voids, may also retard the equilibration
process. Heating of the sample increases diffusivity of ions and lead to a
redistribution of empty voids.
It is known that diffusion of hydrocarbons in partially filled Vycor pores
decreases, but at saturation Ds increase and tends to the bulk value of the
diffusion coefficient, D0 [25,26]. This occurs because Vycor is highly porous,
while the pores are highly interconnected and form a 3D fractal network, thus
the fractal process of self-diffusion in the pores is averaged in the time-scale of
NMR PFG measurements. Concerning the [P6,6,6,14][BScB] ion, if only elastic
collisions with the pore wall are considered, confinement in the Vycor (almost
12
up to saturation) should not significantly decrease the diffusivity of the IL
relative to bulk values. However, diffusion of both ions in pores is enormously
(a factor of 35-40) larger than that in the bulk (Fig. 4 and 5). Moreover,
whereas diffusion of ions in bulk [P6,6,6,14][BScB] showed that the cation and
anion diffuse with an unique D each, in pores they demonstrated two-
component behavior. An increased diffusion of ILs in pores as well as two-
component diffusion has been observed by Chathoth et al., for N,N,N´,N´-
tetramethylguanidinium bis(perfluoroethylsulfonyl)imide
([H2NC(dma)2][BETI]) confined in ordered mesoporous carbon (diameter ~
8.8 ± 2.1 nm) [7,8]. Chathoth et al. have suggested that the “fast diffusion
coefficient” for [H2NC(dma)2][BETI] in pores might be the result of structural
changes of the IL within the pores: IL is forming a layered structure near the
pore wall [8]. However, the authors did not find any reasonable explanation for
the “slow diffusion coefficient” [8]. Rachocki et al. [27] indirectly, by means
of fast field-cycling 1H nuclear magnetic resonance (NMR) relaxometry
method, studied translational diffusion of cations in gel polymer electrolyte
based on ethoxylated bisphenol dimethacrylate and 1-butyl-3-
methylimidazolium tetrafluoroborate IL. It has been found that the diffusion
coefficient of cation is a factor of 2-3 higher than that of cations in pure IL. We
observe experimentally an enormous increase of diffusion in pores. We suggest
that rearrangement of an IL microstructure, proper to bulk, in a some different
structure is the most probable mechanism for the appearance of the “fast
diffusion coefficients” of [P6,6,6,14][BScB] in pores of Vycor.
We also observed “slow diffusion coefficients” for [P6,6,6,14][BScB], which are
a factor of 10 - 40 smaller that the “fast diffusion coefficients” (Fig. 4 and 5).
Diffusion-time dependences of DDs show the typical effects of exchange -
13
maintenance of the mean diffusion coefficient estimated from the initial slope
of the diffusion decay (Figures 4 and 5 for cation, and Figures 4A and 5 for
anion) and a decrease in the apparent fraction of the “slow-diffusion”
component. Based on this consideration, we can suggest that the fraction of
[P6,6,6,14][BScB] represented by the “slow diffusion coefficient” is confined in
certain volumes (“partially isolated volumes”) inside Vycor pores that are
separated by micropores of the Vycor and/or by empty voids. The pores with
smaller or comparable sizes as that of [P6,6,6,14]+ and [BScB]- ions may hinder
diffusion of the ions. Pore size distributions for Vycor have been earlier
obtained by three different techniques: nitrogen adsorption, mercury intrusion
and small-angle scattering as reported by Gille et al. [19], by SAXS in the
paper by Mitropoulis [21], and by adsorption-desorption technique in the
reported work by Cimino et al. [22]. All distributions demonstrated an essential
fraction of pores with diameters less than 1 nm. Our estimation, based on the
chemical structure, reveals approximate sizes of [P6,6,6,14]+ as 3.5 3.5 25.6 Å
and [BScB]- as 3.8 4.1 12.1 Å that are comparable with the size of small
pores of Vycor. Thus, cations and anions moving together can be effectively
hindered in small pores.
In the case of low-molecular-weight liquids confined in pores, the presence of
empty voids may enhance diffusion, because of faster diffusion of molecules in
the gas phase [28], although this is not the case with [P6,6,6,14][BScB], which
has negligible volatility under normal conditions [1]. “Partially isolated
volumes” of [P6,6,6,14][BScB] are demonstrated by the apparent slow diffusion
coefficient of the IL, because of partial restriction of the IL inside these
isolated volumes. From the diffusion time dependences (Fig. 4 and 5), it can be
concluded that the “partially isolated volumes” of [P6,6,6,14][BScB] exchange
14
by ions through the network of pores in different regimes of the exchange of
molecules (ions) [11]. Those are determined by ratios between the lifetime of a
molecule (ion) in a state characterised by “fast” or “slow” diffusion
coefficients and the diffusion time (td) of the NMR diffusion experiment. For
[P6,6,6,14]+ in the sample before heating and in the range of diffusion time from
17 to 300 ms, there is a “slow exchange” regime where DD maintains its
complex form in the entire range of td. For [BScB]-, the “fast diffusion
coefficient” is observed only at 17 ms, but disappears at longer diffusion times,
most probably because of the short T1 NMR relaxation of [BScB]- protons due
to absorption in the micropores. The “slow diffusion coefficient” of the anion
is comparable with that of the cation in the whole range of 17 - 170 ms (Fig.
4A and 4B) and corresponds to diffusion in “partially isolated volumes” of
pores. Thus, the anion also diffuses in pores in the “slow exchange” regime.
After heating at 330 K, redistribution of the IL leads to a change of the
diffusion regime. Now the DD for [P6,6,6,14]+ and [BScB]- continuously changes
from two-exponential (Fig. 5A) to single-exponential (Fig. 5 B and 5C), so the
cation and anion diffuse in pores between different volumes in the
“intermediate exchange” regime. Therefore, redistribution of the IL as a result
of heating facilitates exchange conditions for the cation and for the anion.
The time scale of averaging of diffusion is evident from the experimental DDs,
but we can also estimate spatial scales of “partially isolated volumes”, which
are characterised by slow diffusion using Einstein’s relation for the mean-
squared displacement:
5.05.02 )2()( ds tDr (2)
For the cation in the sample before heating (Ds ~4.2·10-13 m2/s, maximal td =
300 ms), displacement in these volumes is less than 0.5 μm. No averaging
15
occurs at this scale. After the heating Ds is ~ 1.7·10-12 m2/s at averaging td ~
300 ms, therefore displacement, which is effective for averaging of diffusion in
these volumes, is approximately 1 μm.
Confinement in pores of Vycor may provide at least two types of effects for
ions: (i) interaction of ions with silica surfaces, and (ii) confinement of the IL
in cylinders with diameters of nearly 40 Å. For the hydrophobic [P6,6,6,14]+ ion,
the interaction with a hydrophilic silica surface may be a short-range and
attractive interaction. Otherwise, the [BScB]- anion with its oxygen groups has
a structure that resembles the catechol molecule [29,30]. Catechol strongly
adheres on silica surfaces by making hydrogen bonds with a hydroxyl and a
phenylene ring contributing to its adhesion [30]. These bonds are reversible
[29], therefore they may fluctuate and adhesion may not stop the diffusion
process. The difference between catechol and [BScB]- is that catechol is a flat
molecule, while [BScB]- is bulky, therefore, the former’s energy of interaction
as well as lifetime of bonding with silica surfaces should be lower. The silica
surface interaction of the anion is suggested to be stronger than that of the
cation, which may explain the decrease in the anion signal in connected thin
pores, “partially isolated volumes”, for a sample before heating (Fig. 4B, 4C).
Some ILs are prone to forming microstructures as a result of microphase
separation in a certain range of temperatures due to competition of electrostatic
and “hydrophobic” interactions [31-34], that has been confirmed by NMR
diffusion measurements [35]. We suggest that confinement of an IL in pores,
resulting in introducing additional interactions of ions with pores and
restricting microphase volumes, may lead to a modification or complete
destruction of the microphase structure present in the bulk IL.
16
4. Conclusions1H NMR pulsed field gradient technique was applied to study self-
diffusion of a phosphonium bis(salicylato)borate ionic liquid
([P6,6,6,14][BScB]) in the pores of Vycor porous glass at 296 K.
Confinement in pores enormously increases the diffusion coefficients of
ions, by almost a factor of 35, however, some fraction of the ionic liquid
demonstrated apparent diffusion coefficients by a factor of 10 – 40 lower
than its mean value. We explained appearance of this fraction by a
presence of “partially isolated volumes” containing [P6,6,6,14][BScB] in the
pores of Vycor, which is in a so-called “slow exchange” regime with the
rest of IL. Barriers separating “partially isolated volumes” from other part
of pores with IL may be due to micropores and/or empty voids in Vycor
glass. Heating of the IL / Vycor system at 330 K led to redistribution of
[P6,6,6,14][BScB] such that a “slow exchange” regime of diffusion is
changed to an “intermediate exchange” regime. The size of “partially
isolated volumes”, as estimated from the dependence of ion diffusivity on
the diffusion time, is on the order of 1 μm. This study gives an additional
proof of the existence of a bulk microstructure of phosphonium
orthoborate ionic liquids and modification of this structure near the surface
and in confinement that may influence the lubrication properties of these
ionic liquids and their use in other applications.
Acknowledgements
The Knut and Alice Wallenberg foundation and the Swedish Research Council
are gratefully acknowledged for their financial support. The Foundation in
17
memory of J. C. and Seth M. Kempe is gratefully acknowledged for providing
a grant for the NMR diffusion measurements. NMR measurements were partly
carried out on the equipment of the Federal Centre of Collective Facilities
of Kazan Federal University.
References [1] F.U. Shah, S. Glavatskih, D.R. MacFarlane, A. Somers, M. Forsyth, O.N.
Antzutkin, Phys. Chem. Chem. Phys. 13 (2011) 12865-12873.
[2] A. Filippov, F.U. Shah, M. Taher, S. Glavatskih, O.N. Antzutkin, Phys.
Chem. Chem. Phys. 15 (2013) 9281-9287.
[3] S. Bovio, A. Podesta, C. Lenardi, P. Milani, J. Phys. Chem. B 113 (2009)
6600-6603.
[4] L.A. Jurado, H. Kim, A. Arcifa, A. Rossi, C. Leal, N.D. Spencer, Phys.
Chem. Chem. Phys. 17 (2015) 13613-13624.
[5] M.P. Singh, R.K. Singh, S. Chandra, Progr. Mater. Sci. 64 (2014) 73-120.
[6] T. Echelmeyer, H.W. Meyer, L.V. Wullen, Chem. Mater. 21 (2009) 2280-
2285.
[7] S.M. Chathoth, E. Mamontov, S. Dai, X. Wang, P.F. Fulvio,
D.J..Wesolowski, Europhys. Lett. 97 (2012) 66004.
[8] S.M. Chathoth, E. Mamontov, P.F. Fulvio, X. Wang, G.A. Baker, S. Dai,
D.J..Wesolowski Europhys. Lett. 102 (2013) 16004.
[9] C. Iacob, J.R. Sangoro, P. Papadopoulus, T. Schubert, S. Naumov, R.
Valiullin, J. Kärger, F. Kremer, Phys. Chem. Chem. Phys. 12 (2010)
13798-13803.
[10] V. Skirda, A. Filippov, A. Sagidullin, A. Mutina, R. Archipov, G.
Pimenov, Fluid Transport in Nanoporous Materials. Book series: NATO
18
Science Series II-Mathematics Physics and Chemistry 219 (2006) 255-
278.
[11] J. Kärger, H. Pfeifer, W. Heink, Principles and Application of Self-
diffusion Measurements by Nuclear Magnetic Resonance, New York:
Academic Press. 12 (1988) 1-89.
[12] P. Levitz, G. Ehret, S.K. Sinha, J.M. Drake, J. Chem. Phys. 95 (1991)
6151-6161.
[13] Corning Glass Works, O. E. M. Sales Service, Box 5000, Corning, NY
14830.
[14] P.T. Callaghan, Principles of Nuclear Magnetic Resonance Microscopy.
Oxford: Clarendon, 1991, p. 492.
[15] J.E. Tanner, J. Chem. Phys. 52 (1970) 2523-2526.
[16] R.M. Cotts, M.J.R. Hoch, T. Sun, J.T. Markert, J. Magn. Reson. 83 (1989)
252 – 256.
[17] S.J. Gibbs, C.S. Johnson Jr., J. Magn. Reson. 93 (1991) 395 – 402.
[18] B. Lu, S. Torquato, J. Chem. Phys. 98 (1993) 6472-6482.
[19] W. Gille, D. Enke, F. Janowski, J. Porous Mater. 9 (2002) 221-230.
[20] M.H. Kim, C.J. Glinka, Micropor. Mesopor. Mater. 91 (2006) 305-311.
[21] A.C. Mitropoulos, J. Colloid Interface Sci. 336 (2009) 679-690.
[22]R. Cimino, K.A. Cychosz, M. Tommers, A.V. Neimark, Colloids and
Surfaces A: Physicochem. Eng. Aspects 437 (2013) 76-89.
[23] J. H. Page, J. Liu, B. Abeles, E. Herbolzheimer, H.W. Deckman, D.A.
Weitz, Phys. Rev. E 52 (1995) 2763-2777.
[24] D.P. Bentz, E.J. Garboczi, D.A. Quenard Model. Simul. Mater. Sci. Eng.
6(1998) 211-236.
19
[25] D. Kondrashova, M. Dvoyashkin, R. Valiullin, New J. Phys. 13(2011)
015008.
[26] M. Dvoyashkin, A. Khokhlov, S. Naumov, R. Valiullin, Micropor.
Mesopor. Mater. 125(2009) 58-62.
[27] A. Rachocki, E. Andrzejewska, A. Dembna, J. Tritt-Goc, Europ. Polym. J.
71(2015) 210-220.
[28] N.K. Dvoyashkin, A.I. Maklakov, Colloid J. 58(1996) 561-565.
[29] S.A. Mian, L.M. Yang, L.C. Saha, E. Ahmed, M. Ajmal, E. Ganz
Langmuir 30(2014) 6906-6914.
[30] S.A. Mian, L.M. Yang, L.C. Saha, J. Jang, L. Wang, X. Gao, S..Nagase, J.
Phys. Chem. 114(2010) 20793-20800.
[31] T.L. Greaves, C.J. Drummond, Chem. Rev. 108(2008) 206-237.
[32] G.L. Burrell, I.M. Burgar, Q. Gong, N.F. Dunlop, F. Separovic, J. Phys.
Chem. B. 114(2010) 11436-11443.
[33] O. Russina, A. Triolo, L. Gontrani, R. Caminiti, Phys. Chem. Lett.
3(2011) 27-33.
[34] K. Shimizu, M.F.C. Gomes, A.A.H. Padua, L.P.N. Rebelo, J.N.C. Lopes,
J. Mol. Str. 946(2010) 70-76.
[35] A.E. Frise, T. Ichikawa, M. Yoshio, H. Ohno, S.V. Dvinskikh, T. Kato, I.
Furo, Chem. Commun. 46(2010) 728-730.
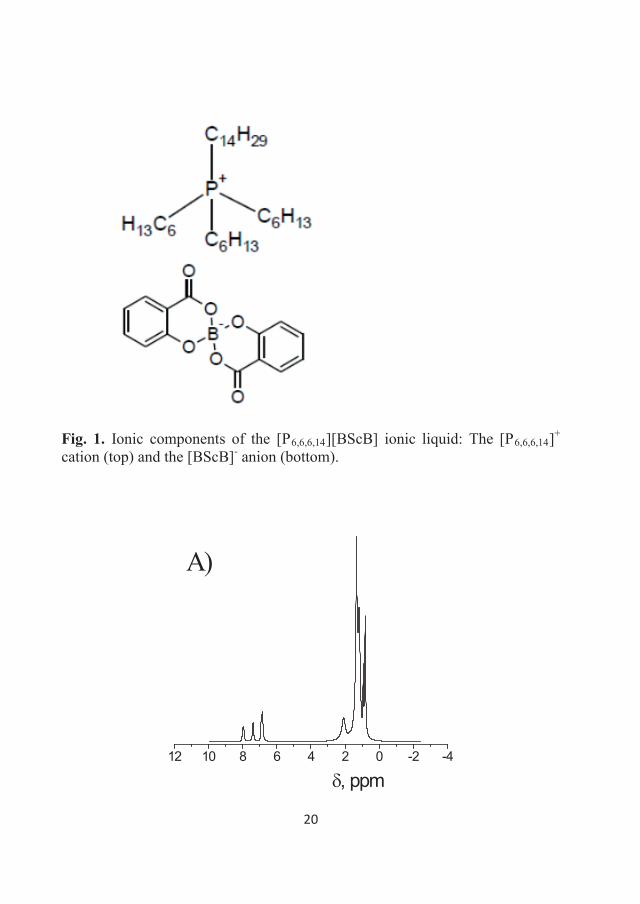
20
Fig. 1. Ionic components of the [P6,6,6,14][BScB] ionic liquid: The [P6,6,6,14]+
cation (top) and the [BScB]- anion (bottom).
12 10 8 6 4 2 0 -2 -4
, ppm
A)
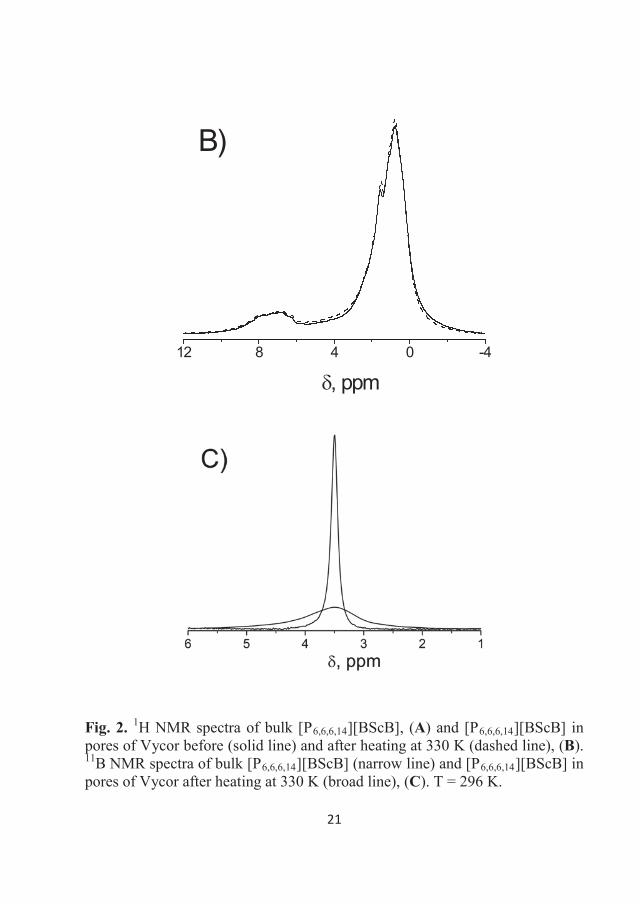
21
12 8 4 0 -4
, ppm
B)
Fig. 2. 1H NMR spectra of bulk [P6,6,6,14][BScB], (A) and [P6,6,6,14][BScB] in pores of Vycor before (solid line) and after heating at 330 K (dashed line), (B).11B NMR spectra of bulk [P6,6,6,14][BScB] (narrow line) and [P6,6,6,14][BScB] in pores of Vycor after heating at 330 K (broad line), (C). T = 296 K.
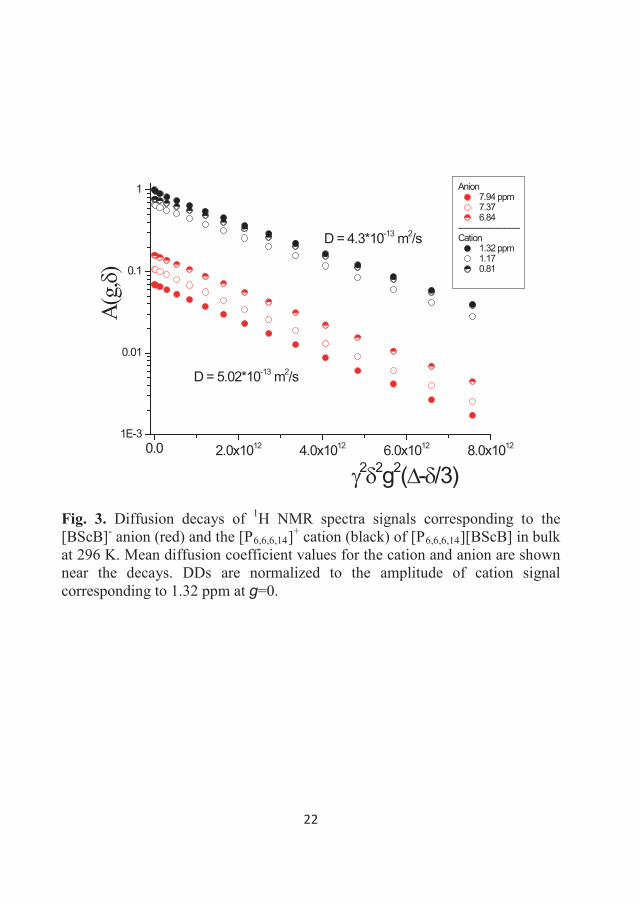
22
0.0 2.0x10¹² 4.0x10¹² 6.0x10¹² 8.0x10121E-3
0.01
0.1
1
A(g,
)
2 2g2( - /3)
D = 5.02*10-13 m2/s
Anion 7.94 ppm 7.37 6.84
-----------------------Cation
1.32 ppm 1.17 0.81
D = 4.3*10-13 m2/s
Fig. 3. Diffusion decays of 1H NMR spectra signals corresponding to the[BScB]- anion (red) and the [P6,6,6,14]+ cation (black) of [P6,6,6,14][BScB] in bulk at 296 K. Mean diffusion coefficient values for the cation and anion are shown near the decays. DDs are normalized to the amplitude of cation signal corresponding to 1.32 ppm at g=0.
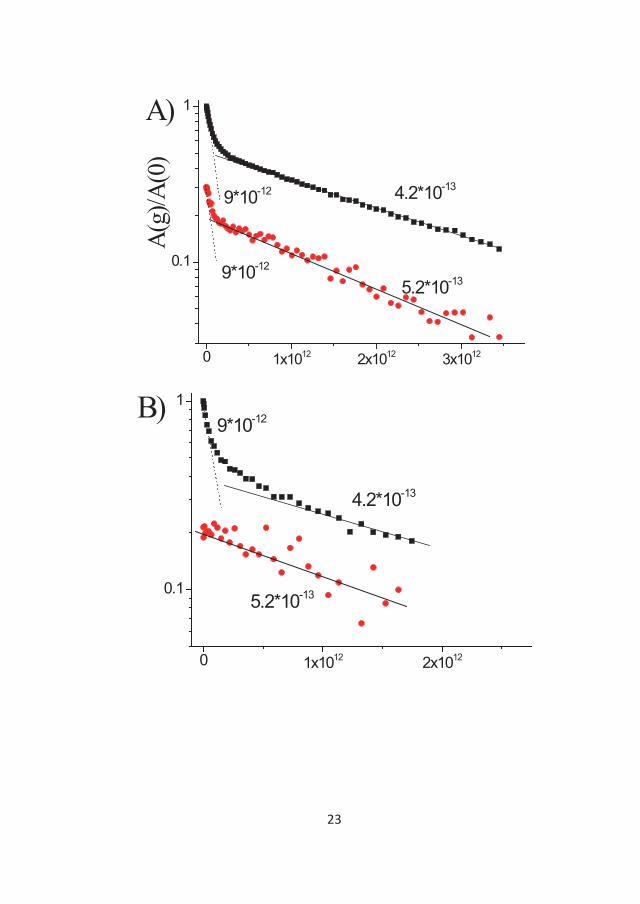
23
0 1x10¹² 2x10¹² 3x10¹²
0.1
1
9*10-12
4.2*10-13
5.2*10-13
9*10-12
A)A(
g)/A
(0)
0 1x10¹² 2x10¹²
0.1
1
4.2*10-13
B)9*10-12
5.2*10-13
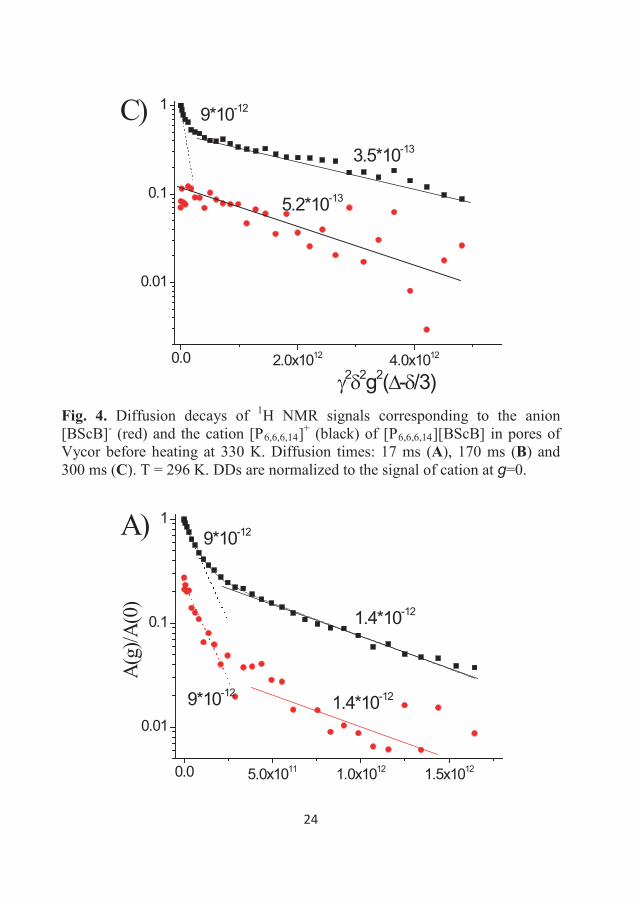
24
0.0 2.0x10¹² 4.0x10¹²
0.01
0.1
1 9*10-12
5.2*10-13
C)
2 2g2( - /3)
3.5*10-13
Fig. 4. Diffusion decays of 1H NMR signals corresponding to the anion [BScB]- (red) and the cation [P6,6,6,14]+ (black) of [P6,6,6,14][BScB] in pores of Vycor before heating at 330 K. Diffusion times: 17 ms (A), 170 ms (B) and 300 ms (C). T = 296 K. DDs are normalized to the signal of cation at g=0.
0.0 5.0x10¹¹ 1.0x10¹² 1.5x10¹²
0.01
0.1
1
1.4*10-12
1.4*10-12
9*10-12
9*10-12A)
A(g)
/A(0
)
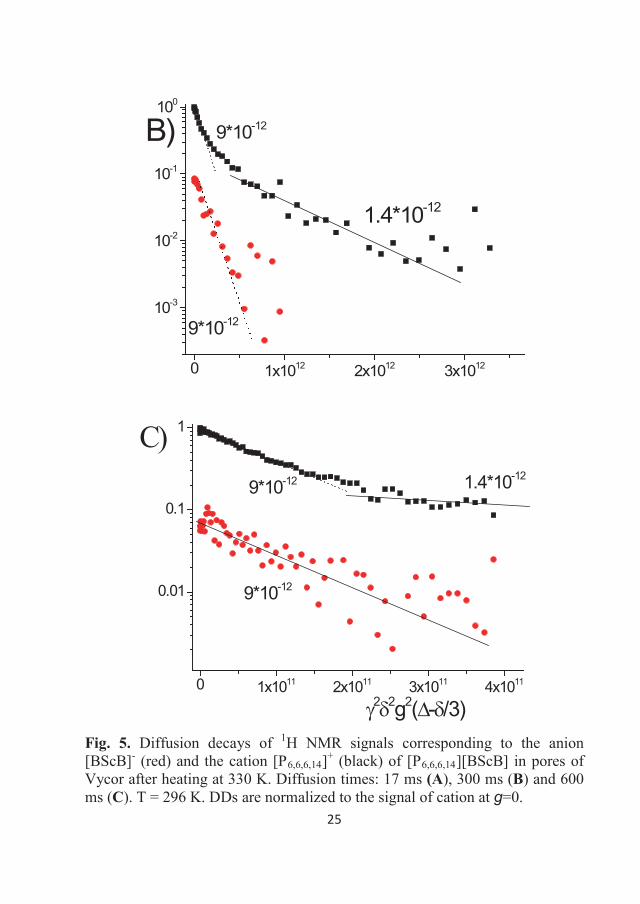
25
0 1x10¹² 2x10¹² 3x10¹²
10-3
10-2
10-1
100
1.4*10-12
9*10-12B)
9*10-12
0 1x10¹¹ 2x10¹¹ 3x10¹¹ 4x10¹¹
0.01
0.1
1
1.4*10-129*10-12
9*10-12
C)
2 2g2( - /3)Fig. 5. Diffusion decays of 1H NMR signals corresponding to the anion [BScB]- (red) and the cation [P6,6,6,14]+ (black) of [P6,6,6,14][BScB] in pores of Vycor after heating at 330 K. Diffusion times: 17 ms (A), 300 ms (B) and 600 ms (C). T = 296 K. DDs are normalized to the signal of cation at g=0.
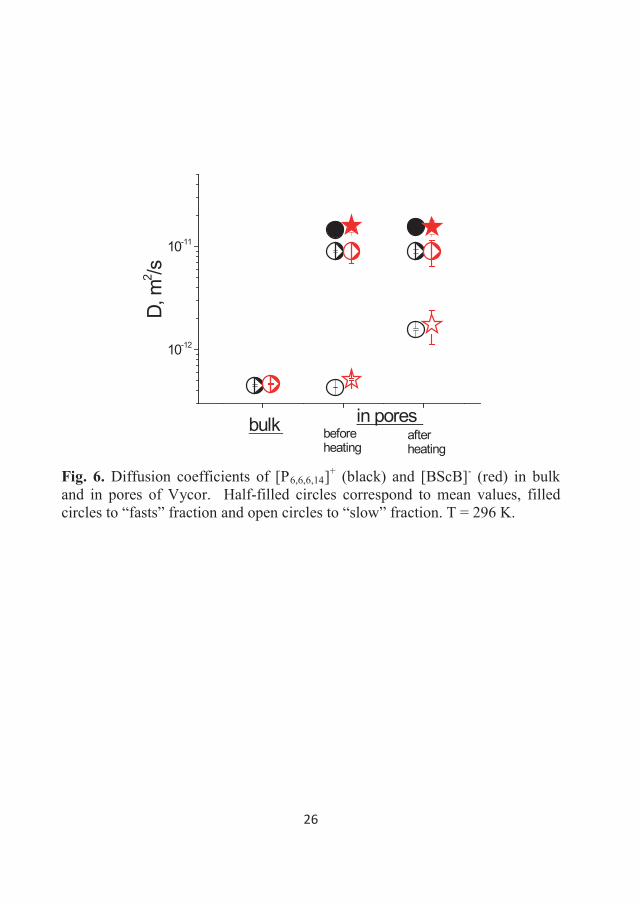
26
10-12
10-11
in poresafterheating
beforeheating
bulk
D, m
2 /s
Fig. 6. Diffusion coefficients of [P6,6,6,14]+ (black) and [BScB]- (red) in bulk and in pores of Vycor. Half-filled circles correspond to mean values, filled circles to “fasts” fraction and open circles to “slow” fraction. T = 296 K.

27
Electronic Supplementary Information
Self-Diffusion of Phosphonium Bis(Salicylato)Borate Ionic Liquid in Pores
of Vycor Porous Glass
Andrei Filippov,a,* Nail Azancheev,b Faiz U. Shah,a Sergei Glavatskih,c,d and
Oleg N. Antzutkina
aChemistry of Interfaces, Luleå University of Technology, SE-97187 Luleå,
SwedenbKazan Federal University, 420008 Kazan, RussiacSystem and Component Design, KTH Royal Institute of Technology, SE-10044
Stockholm, SwedendDepartment of Mechanical Construction and Production, Ghent University,
B-9000 Ghent, Belgium
*Corresponding author: E-mail: [email protected]
Tel: +46 (0)736782225
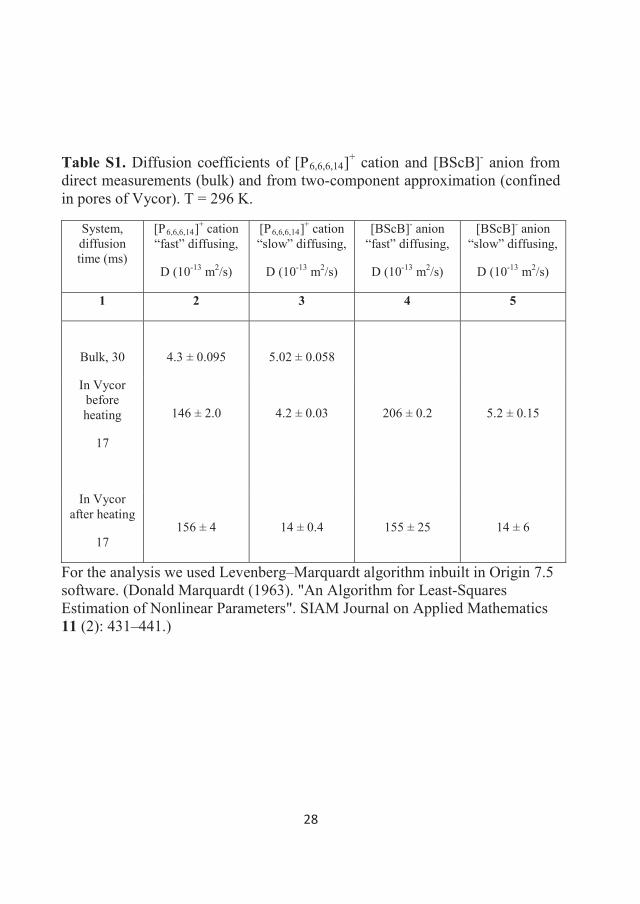
28
Table S1. Diffusion coefficients of [P6,6,6,14]+ cation and [BScB]- anion from direct measurements (bulk) and from two-component approximation (confined in pores of Vycor). T = 296 K.
System, diffusion time (ms)
[P6,6,6,14]+ cation “fast” diffusing,
D (10-13 m2/s)
[P6,6,6,14]+ cation “slow” diffusing,
D (10-13 m2/s)
[BScB]- anion “fast” diffusing,
D (10-13 m2/s)
[BScB]- anion “slow” diffusing,
D (10-13 m2/s)
1 2 3 4 5
Bulk, 30 4.3 ± 0.095 5.02 ± 0.058
In Vycor before heating
17
146 ± 2.0 4.2 ± 0.03 206 ± 0.2 5.2 ± 0.15
In Vycor after heating
17156 ± 4 14 ± 0.4 155 ± 25 14 ± 6
For the analysis we used Levenberg–Marquardt algorithm inbuilt in Origin 7.5 software. (Donald Marquardt (1963). "An Algorithm for Least-Squares Estimation of Nonlinear Parameters". SIAM Journal on Applied Mathematics 11 (2): 431–441.)
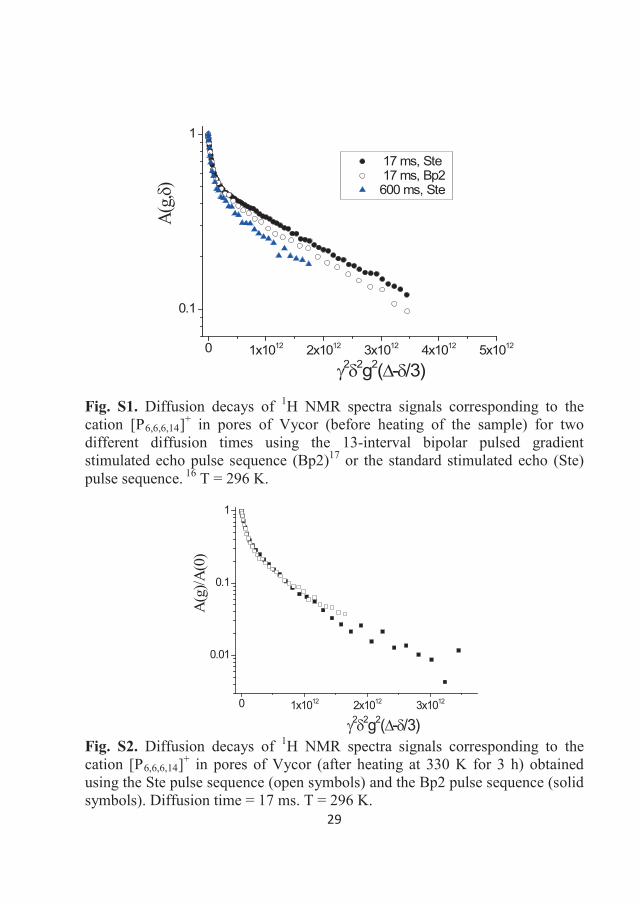
29
0 1x10¹² 2x10¹² 3x10¹² 4x10¹² 5x10¹²
0.1
1
A(g,
)
2 2g2( - /3)
17 ms, Ste 17 ms, Bp2 600 ms, Ste
Fig. S1. Diffusion decays of 1H NMR spectra signals corresponding to the cation [P6,6,6,14]+ in pores of Vycor (before heating of the sample) for two different diffusion times using the 13-interval bipolar pulsed gradient stimulated echo pulse sequence (Bp2)17 or the standard stimulated echo (Ste) pulse sequence. 16 T = 296 K.
0 1x10¹² 2x10¹² 3x10¹²
0.01
0.1
1
A(g
)/A(0
)
2 2g2( - /3)Fig. S2. Diffusion decays of 1H NMR spectra signals corresponding to the cation [P6,6,6,14]+ in pores of Vycor (after heating at 330 K for 3 h) obtained using the Ste pulse sequence (open symbols) and the Bp2 pulse sequence (solid symbols). Diffusion time = 17 ms. T = 296 K.
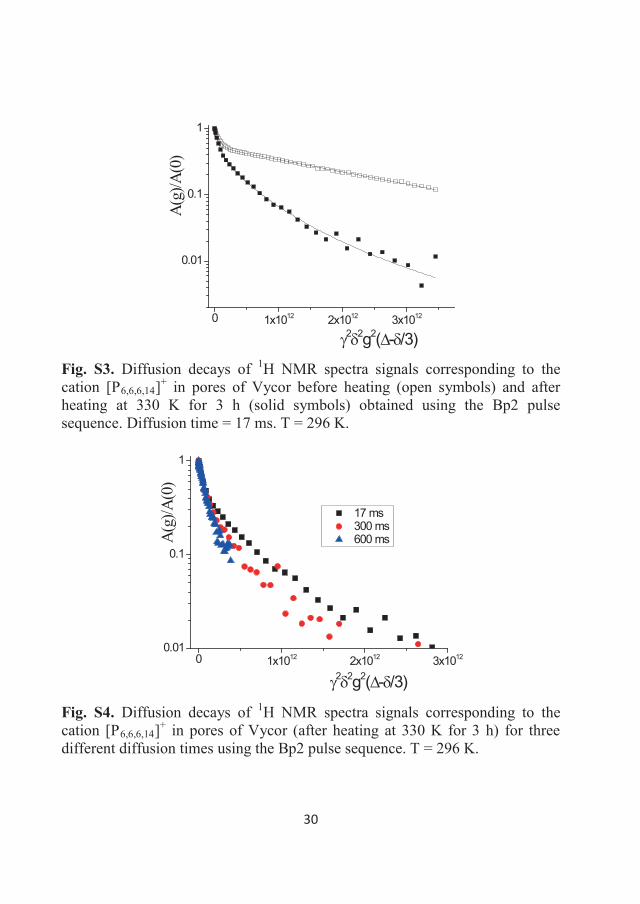
30
0 1x10¹² 2x10¹² 3x10¹²
0.01
0.1
1
A(g)
/A(0
)
2 2g2( - /3)
Fig. S3. Diffusion decays of 1H NMR spectra signals corresponding to the cation [P6,6,6,14]+ in pores of Vycor before heating (open symbols) and after heating at 330 K for 3 h (solid symbols) obtained using the Bp2 pulse sequence. Diffusion time = 17 ms. T = 296 K.
0 1x10¹² 2x10¹² 3x10120.01
0.1
1
A(g)
/A(0
)
2 2g2( - /3)
17 ms 300 ms 600 ms
Fig. S4. Diffusion decays of 1H NMR spectra signals corresponding to the cation [P6,6,6,14]+ in pores of Vycor (after heating at 330 K for 3 h) for three different diffusion times using the Bp2 pulse sequence. T = 296 K.


