Self-excitation analyses of vocal chord under breathing flow and frequency change by muscle activation
T. Tsuta1, T. Iwamoto1, T. Shimizu2 & D. Egusa2 1Department of Clinical Engineering, Faculty of Health Science, Hiroshima International University, Japan 2Graduate School of Mechanical Engineering System, Hiroshima University, Japan
Abstract
This paper presents some analyses and experiments on vocalizing mechanics in the vocal chord due to the breathing flow, and their wide range of frequency change by varying the interior muscle activations. Three-dimensional dynamic responses of the hyperelastic and finite deformation body of the vocal chord and the interior muscles have been analysed at first and the exclusive FEM system has been developed. The eigen frequencies and vibration characteristics of the vocal chord are analysed by varying the activation level of the interior muscles. The Helmholtz equation of the breathing flow under transient state has been analysed to obtain the pressure pulsation characteristics behind the vocal chord during vocalizing of the source voice. Combining both approaches stated above, the mechanism of the self-exciting vibration of the vocal chord has been studied in detail using the route-locus approach. It is also found in the analysis and experiments that the frequency of the self-exciting vibration can be widely varied with the activation level of the interior muscle of the vocal chord, giving rise to a variety of frequency levels of the source voice.
1 Introduction
It is important to clarify theoretically the human’s vocalizing mechanics in the larynx-vocal tract system, in order to develop the artificial system for a
Fluid Structure Interaction and Moving Boundary Problems IV 321
doi:10.2495/FSI070301
disordered person, automatic translation system and so on. Past approaches mainly concerns with respect to the signal processing after pronunciation, and it is not easy to apply them due to personal pronunciations with the enormous types of different pronunciation patterns. However once such vocalizing mechanics of living human has been clarified in theoretically and applied to advanced artificial larynx system in successfully, their contribution to people with disordered pronunciation, could be remarkable in the field of assistive technology in medical engineering. Theoretical approach on vocalizing mechanics in vocal chord had been done not so many in comparison with experimental works for living human. Ishizuka-Flanagan solved the problem using the model with 2DOF and two mass systems, orthogonal to the breathing flow. Kagawa et al solved the vocal chord vibration using the 2D finite element approach. However it does not include the influences of vocal muscle activation and relative motion of some cartilage. Since the pressure pulsation of breathing flow and eigenfrequency characteristics of vocal chord are coupled to generate the self-excitation vibration characteristics of vocal chord, and that the self-exciting frequency vary with the stiffness change in vocal chord, which is activated by the interior and/or exterior muscle activations. In this paper, three-dimensional finite element approach for analysing eigen-frequency and dynamic response of muscle and hyperelastic finite-deformation soft tissue have been developed at first (Figure 1). Combined it with the Lighthill equation of 3D potential-flow of breathing flow from lung to the vocal-chord, a total system to solve the self-exciting vibration of vocal chord has been developed, and it is applied to solve wide varieties of the frequency of self-exciting vibration of the vocal-chord, which vary with the activation of the interior muscles of the vocal-chord. It is demonstrated, through comparisons with calculation and measurement results of the vocal-chord vibrations and the pulsating flow, at the mouth outlet part in vocalizing of a living human, 22 years old, that the simulation results, obtained by the above method, can be satisfactorily applied to solve this kind of problems.
322 Fluid Structure Interaction and Moving Boundary Problems IV
2 Analysis of muscle-ligament system
2.1 Active and passive constitutive modeling of muscle
Based on the Hill type 3 element system (Figure 2(a)), the vocal muscle element(C.E.) contract actively due to the neuro stimulation β2 with the amount l0(β2) under the isotropic contraction as in Figure 2(e). However, when the external force ef is loaded to the system, a part of the free contraction, is constrained with the amount of ∆l(β2), so as to generate the counter force
CEf (β2), and the free contraction reduces from l0(β2) to l(β2) That is, the free contraction l0(β2) is shared partially for generating the force CEf (β2)and the other for generating the required motion l(β2) in force-motion and activation space. By neglecting the series element (S.E.) in Figure 2(a) for simplicity, the active and passive constitutive law of muscle has been formulated, based on the Hatze’s constitutive law for single muscle cell, shown in equations (1) and (2), for the m-th muscle shown in Figure 2(b). Based on Green strain Eij and Kirchhoff stress Sij, the multi-axial active constitutive model can be derived from the evolutional model of Hatze(1) and can be written by equations (3) and (4).
0 ( ) ( ) ( )CEF F B F E G vβ= (1)
0
( ) exp[ ( , )] ( 1,2)( ) ( ) /( )
k kB a b B E kG v G a b v b aβ β= =
= + + − (2)
1 2 3
0
( ) exp[ ( )]sin[ ( )]( ) , ( ) ( )
( , , , ){ }am aij m ij mj oi
F E c c R E V ER E E V E E c
S D E E E E E
µ µ
β δ
= += − = +
= −
(3)
0 0 0 0( , , , ) ( ) ( , ) ) , )amD E E E S B F E E G E Eβ β= (4)
where oF is the maximum contraction force under isometric condition, and ( ), ( )B F Eβ and ( )G V are functions expressing activation rate, contraction force
~ deformation, and force-velocity relations, respectively. The functions ( )B β and ( )F E are schematically expressed as in Figure 3(d) and 3(e),
respectively, and ( )G V is given by Hill [4]. The other notations, ,k ka b ,.are experimental constants. The suffix m means m-th muscle shown in Figure 2(b), and 0iE is the free contraction strain equivalent to l0(β2) in Figure 2(e). In the next place, the passive stress p
ijS can be determined from strain energy function ( ) 1/ 2 exp[ ( )]P
i m m ijW J C Q E= as in Equation (5) where iJ is the i-th invariant of the strain tensor and P T
Fluid Structure Interaction and Moving Boundary Problems IV 323
where mC is the material constant. The combined stress mijS can be obtained
from equations. (3) and (5) as in equation (6), i.e.
{ }3{ } { } [ ]{ } [ ]{ }ij
Iam pm a pij ij m ij mj oj m ij ES S D E E D E hδ ∂
∂+ = − + + (6)
[ ] [ ] [ ][ ]L T mij ijS L S L= or { } [ ]{ }L m
ij ijS T S= (7)’(7)
βi+1
β1
t
B(β)
0
c
l
mn
f
f CE
S ijaf
ε0am
fP
f c
β1
β1
(β)
β2β2
β3β3
zm xmym
m
muscle
ligament
z
yx
cartilage
0/T0
T/T0
0.2
0.2 0.020.040.060.080.1
0.40.60.81.0
0.4 0.6 0.8 1.0
∆l(β2)l(β2)l0(β2)
CTR-MCNT-M
C.E. S.E.P.E.
fefcβi
m
(a) Hill's 3-el. model
(b)
(c) velocity force curve(d) activation dynamics curves
(e) force-displacement curves
Figure 2: The stimulation and contraction deformation characteristics of the muscle.
where I3 is the 3rd-invariant of the deformation tensor and expressed by I3 = 1+2J1+4J2+8J3 and h is the Langrange parameter for expressing the incompressibility of the muscle. The stress in equation (6), expressed in the muscle coordinate shown in Figure 2(b), can be rewritten in the local coordinate system using coordinate transformation matrices [L] or [T], as in equation (7)’ or (7).
2.2 Incremental stiffness equation for muscle-ligament system
The incremental form of stress and strain in muscle can be written by neglecting the notation L as
324 Fluid Structure Interaction and Moving Boundary Problems IV
12
i i k k k kij
j i i j i j
u u u u u uE
X X X X X X ∂∆ ∂∆ ∂ ∂∆ ∂∆ ∂ ∆ = + + + ∂ ∂ ∂ ∂ ∂ ∂
(9)
1
10 0 0
1
3
{ } {( )
( )} [ ]{ }
({ } { }) [ ]{ }
{ }
a an n n nm m m
ij ij ij ij ijij ij
n n a n nmi m mi m m ij mi m
pn n n p nij ij ij ij
ij
ij
D D DS E E E E
E E
E E D E E
D E E E D EE
Ih
E
ββ
δ δ δ
−
−
−
∂ ∂ ∂ ∆ = ∆ + ∆ + ∆ +∆ ∂ ∂ ∂ − + ∆ + ∆ − ∆
∂+ ∆ + ∆ + ∆
∂ ∂
+ ∆∂
(10)
where iu is the displacement, iX the coordinate before deformation. Then, the incremental virtual work equation can be written by neglecting the notation n, as
3 3
0 0 0 0
{ } ({ } { }) { }{ }
{ } { } { } { }
T a a p pv ij ij ij ij ij v
T Tv i i i v i i i
E S S S S dv h I I dv
u T T ds u F F dv
δ δ
δ δ
∫ ∆ +∆ + +∆ + ∫ ∆ +∆
= ∫ ∆ +∆ + ∫ ∆ +∆ (11)
where oT0 and iF0 are body force and surface force. Using equations (10) and (7), the incremental stiffness equation of an element can be rewritten in the form
ˆˆ ˆ[ ] { } { } { } { }La
uK p p R p
h∆
= ∆ + ∆ + = ∆ ∆ (12)
where 1
1 1
ˆ ˆ0 0ˆ[ ]10 1 0
ˆ ˆ[ ] [ ] [ ] [ ] [ ] 00 0
T TL T ev
vev
T nik
v
T D T T DB B BBK dvD I
B T S T B dv
−
− −
∆= ∫
+ ∫
1 1 1
10
[ ] [ ] [ ],ˆ{ } [ ][ ] [ ][ ]{ }
n an pnik ik ik
T T a na v T m
S S S
p B B T D T E dv
− − −
−
= +
∆ = ∫ ∆ ∆
0 0
,
{ } [ ] { } [ ] { }
T a pT T
T Ts i v i
D D D
p N T ds N F dv
∆ = ∆ + ∆
∆ = ∫ ∆ + ∫ ∆ (13)
and R is the residual force up to the step, 1,n N− the shape function, [ ]B and ˆ[ ]B being given in [2]. The other notations are given by
Fluid Structure Interaction and Moving Boundary Problems IV 325
4 2
11 1
2 3 4
31 2
, , ,
, , ,
, ,
aa a p p a mT i T i
i i
a aa a a am m
ij ij kij ij
pp p pm
ij ij evij ij
DD D D D D
D DD E D E D D
E E
D ID E D D D
E E
ββ= =
∂∆ = ∆ ∆ = ∆ ∆ = ∆
∂
∂ ∂∆ = ∆ ∆ = ∆ ∆ =
∂ ∂
∂ ∂∆ = ∆ ∆ = =
∂ ∂
∑ ∑
(14)
By assembling element stiffness equation (12) for whole elements, and transforming them by global coordinate system, we obtain the governing stiffness equation of whole muscles. It should be noted that in equation (12), the load vector{ }aP∆ is the force induced by the pull back of muscle free contraction, and it is especially important to obtain the exact stress in muscle.
3 Dynamic equation of motion for vocal soft, tissue
3.1 Constitutive equation of vocal soft, tissue
The coordinate system is defined as shown in Figure 3, and x–y plane is defined to be the spreading direction and z to be the thickness direction. The Green strain ijE and kirchhoff stress ijS can be expressed by
326 Fluid Structure Interaction and Moving Boundary Problems IV
where iu (i = 1, 2, 3 which is replaced to be x, y, z) is the displacement, iX and ix the coordinate system before and after deformation, oρ and ρ the densities
and mnσ the true stress respectively. Then the constitutive equation can be written by
{ } [ ] { }
( exp[ ( , )]) { }
klij ij ij
A B m ij ij
S D E
D cD G E Eµ
= ⋅
= + ⋅ (17)
where 2 2 2
11 22 33
2 2 212 23 31
11 22 22 33 33 11
( , )
2 2 2
m ij a b c
d e f
g h i
G E E E E
E E E
E E E E E E
µ µ µ µ
µ µ µ
µ µ µ
= + +
+ + +
+ + +
0 0 00 0 00 0 0
0 0 0 0 00 0 0 0 00 0 0 0 0
a g i
g b h
i h cA
d
e
f
D
α α αα α αα α α
αα
α
=
(18)
0 0 00 0 00 0 0
0 0 0 0 00 0 0 0 00 0 0 0 0
a g i
g b h
i h cB
d
e
f
D
µ µ µµ µ µµ µ µ
µµ
µ
=
In the above, α, ,M and C are material constants.
3.2 Incremental form of the equation
The green strain on the n-th step nijE∆ can be expressed by
1 11{ . .2
n n n njn i k k k k
ijj i i j i j
uu u u u uE
X X X X X X
− −∂∆∂∆ ∂∆ ∂∆ ∂∆ ∂∆∆ = + + +
∂ ∂ ∂ ∂ ∂ ∂ (19)
or in matrix form as
ˆ{ } [ ] [ ][ ]{ }jij
k
uE B B B u
X∂∆
∆ = = ∆ ∆
(20)
where iu is the nodal displacement, N the shape function of the FEM, and ˆ,B B the strain-nodal displacement matrices, respectively.
Fluid Structure Interaction and Moving Boundary Problems IV 327
The incremental form of the constitutive model is given by 1{ } [ ]{ }n n n
ij he ijS D E−∆ = ∆ (21) where
11
11
1
[ ] . .exp[ ( , )]
exp[ ( , )]. { }
nhe A B m ij n
Tm ij nn
B klkl n
D D c D G E
G Ec D E
E
µ
µ
−−
−−
−
= +
∂ + ∂
(22)
3.3 Discretized dynamic equation of motion
Dynamic virtual work equation of motion of vocal chord can be expressed by
dvuFdsuTSdvuu ii
vii
sEijvioiv ij δ∫+δ∫=∫+ρδ∫ δ00 (23)
where oisT the surface traction, oF the body force, and δ the virtual value,
respectively. From equation (15), we have the equation in matrix form where ]~[B is the Green strain-nodal displacement matrix. Then the equation (23) can be rewritten in matrix form as
[ ]{ } [ ]{ } [ ]{ } { }M u C u K u P∆ + ∆ + ∆ = ∆ (24) where
0ˆ[ ] [ ] [ ] , [ ] [ ] [ ][ ]
[ ] [ ] , { } [ ] [ ]{ } [ ]{ }
T T klv e v ij e
Ts
M N N dv K B D B dv
C K P N N p ds G p
ρ
η
= ∑∫ = ∑∫
= = ∑∫ = (25)
4 Lighthill equation for pulsating flow behind the vocal chord
Combined with the conservative laws of mass and momentum, the Lighthill equation for the pulsating flow from the lung for vocalizing can be written by
222
2 2
1 ijaa
i jo
Tpp
x xc t∂∂
∇ − =∂ ∂∂
where ij i jT pu u= , 2 ( )o o op p c p p− = − (26)
The right hand side of equation (26) is the sound source term, and Tij is the Lighthill’s stress tensor for turbulent flow. The suffix “o” denotes the steady flow quantities, and pa = p-po is the pulsating pressure component, co the sound velocity and iu the flow velocity respectively. The boundary conditions of flow at the boundary faΓ shown in Figure 4 can be expressed by
328 Fluid Structure Interaction and Moving Boundary Problems IV
where n is the outward normal vector of the boundary. Multiplying the weighting function Φ to equations (26) and (27), the weighted residual equation in weak form can be expressed by
22
1a fa
aV a a a a
a
pp p Q dv p u dS
ncφ φΓ
∂ ∇ − − = − ∂ ∫ ∫ (28)
where jiij uuTQ ∂∂∂= /2 is the sound source term and is assumed to be invariant. Using the shape functions to be
a aj ajj
p N p= ∑ , aj jj
Q N Q= ∑ , ai aii
N pφ = ∑ (29)
ua.. e em
Q
acoustic space V
element
sound
Driving wall Γfa
source
Figure 4: Acoustical space model.
and based on the Gauss divergence theorem, the equation (28) can be written in discretized form as
( ),
({ } [ ] { } { } [ ] { } )
{ } { }
T Ta e e a e a e e a e
e
Ta e a e
e
p H p p G p
p F
+
=
∑
∑ (30)
where
( )aj aj ajai ai aiaij e
N N NN N NH dV
x x y y z z∂ ∂ ∂∂ ∂ ∂
= ∫ + +∂ ∂ ∂ ∂ ∂ ∂
2
1aij e ai aj
a
G N N dVc
= ∫
and , "ai a a ai ai aj je eF p u N dS N N Q dV= −∫ ∫
from which the governing equation for whole system can be written as follows by adding the damping term to be proportional to [Ha] matrix (where α the proportional constant),
[Ga]{[ ]{ } [ ]{ } [ ]{ } { }Ga pa Ha pa Ha pa Faα+ + = (31)
Fluid Structure Interaction and Moving Boundary Problems IV 329
In case of the transient problem, the equation (31) is further discretized with respect to time, we can solve it incrementally, using the Newmark- β method. In case of steady problem, substituting the expression tj
aa epp ω= ~ into equation (31), we can solve it for the amplitude vector { ap~ } as
2
2
[ ][ ] [ ] [ ][ ][ ] [ ] [ ]
R R
J J
pa FaHa Ga Hapa FaHa Ha Ga
ω ωαωα ω
− −=
− (32)
where suffixes R and J means real and imaginary terms respectively.
5 Self excitation vocalization analysis
During a cycle, a vocal chord under closed state is subjected to the pressure rise due to the breathing flow from the lung and when it reaches to a critical level, the lip open and the pressure is released, yielding to the next lip-closure. The self-exciting vibration is occurred if this cycle of iteration coincides with the eigen-frequencies of the vocal chord and that it is driven under steady amplitude vibration condition. Three dimensional finite element system for solving dynamic response of arbitrary hyperelastic and finite deformation solid applicable to vocal chord has been developed at first. The computer system to solve the Helmholtz equation has been developed in order to calculate the pressure pulsation in breathing flow behind the vocal chord. Based on the above, the combined system for solving coupled dynamic response of vocal chord and for solving pulsating pressure in breathing flow has been developed. The configuration of a vocal chord of a living human, 22 years old, including the surrounded ligaments and the interior and exterior muscles is obtained by MRI measurement and discretized into finite elements. A static stress analysis of the vocal chord has been done at first to get the stiffness of the vocal chord under interior muscle activation, and a series of eigen frequency analysis has been carried out under various muscle activation. The governing dynamic equations of motions for both the vocal chord and the breathing flow are solved in coupled form as follows
for vocal chord0
for breathing flow0
a a a l
Mv Cv Ku G p
v u
M q K p L F v
q p
ν
+ + = ∆
− = + + =
− =
(33)
where v and u are nodal velocity and displacement vectors, p the nodal pressure vector, M, C, K, and G are the mass matrix, the damping matrix, stiffness matrix, and the coefficient matrix of the pulsating pressure, Ma, and Ka
330 Fluid Structure Interaction and Moving Boundary Problems IV
the mass matrix and stiffness matrix of flow, and La and Fl the motion vector coefficients matrices of the vocal chord respectively. The complex eigen frequency of the governing equations can be solved using equation (33) by the root locus approach. When the state variables of the vocal chord are assumed to be expressed by
, , ,t t t tv Ve u Ue q Qe p Peλ λ λ λ= = = = (34)
where ( )R ijλ λ λ= + is the complex eigen value, then substituting equations (34) into equations (33), we obtain
0 0 0 00 0 0 0 0 0
0 0 0 00 0 0 0 0 0
M V C K G VI U I U
La Ma Q Fl Ka QI P I P
λ
− = − − −
(35)
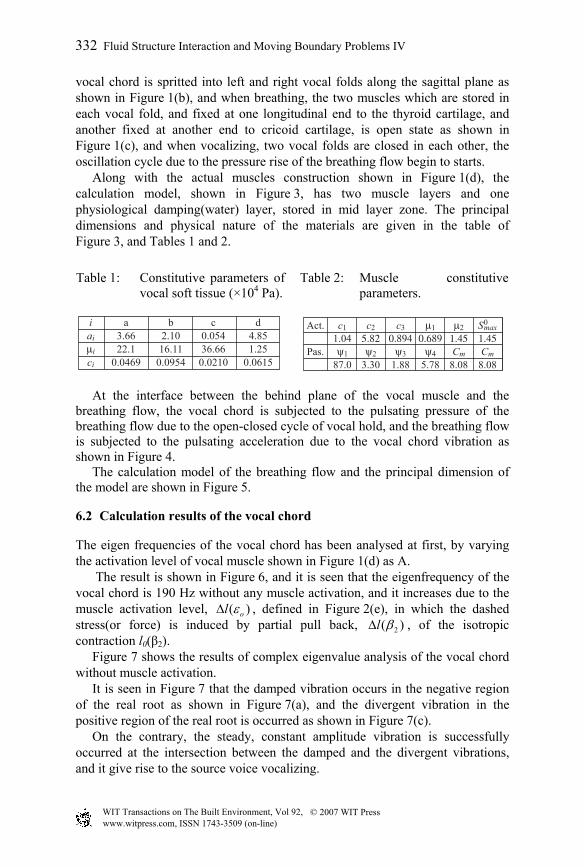
Once the complex eigen frequencies are obtained from equation (35), the vocalizing condition can be determined as the intersection of both the damped vibration region with 0Rλ < and the divergent vibration region with 0Rλ > as shown in Figure 6.
6 Applications to the actual system and experiments
6.1 The calculation models
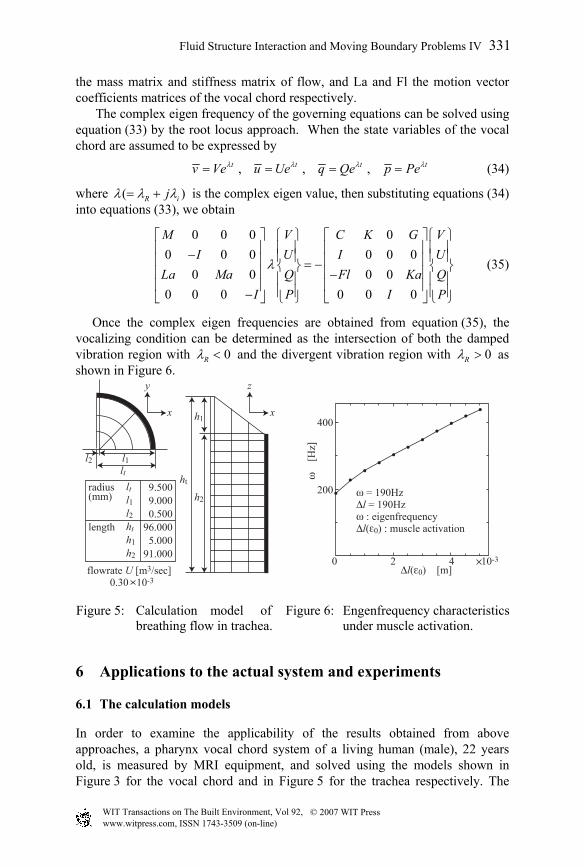
In order to examine the applicability of the results obtained from above approaches, a pharynx vocal chord system of a living human (male), 22 years old, is measured by MRI equipment, and solved using the models shown in Figure 3 for the vocal chord and in Figure 5 for the trachea respectively. The
under muscle activation. Figure 5: Calculation model of Figure 6: Engenfrequency characteristics
Fluid Structure Interaction and Moving Boundary Problems IV 331
vocal chord is spritted into left and right vocal folds along the sagittal plane as shown in Figure 1(b), and when breathing, the two muscles which are stored in each vocal fold, and fixed at one longitudinal end to the thyroid cartilage, and another fixed at another end to cricoid cartilage, is open state as shown in Figure 1(c), and when vocalizing, two vocal folds are closed in each other, the oscillation cycle due to the pressure rise of the breathing flow begin to starts. Along with the actual muscles construction shown in Figure 1(d), the calculation model, shown in Figure 3, has two muscle layers and one physiological damping(water) layer, stored in mid layer zone. The principal dimensions and physical nature of the materials are given in the table of Figure 3, and Tables 1 and 2.
Table 1: Constitutive parameters of vocal soft tissue (×104 Pa).
Table 2: Muscle constitutive parameters.
iaiµici
a3.6622.1
0.0469
b2.1016.11
0.0954
c0.05436.660.0210
d4.851.25
0.0615
Act.
Pas.
c11.04ψ1
87.0
c25.82ψ2
3.30
c30.894
ψ31.88
µ10.689
ψ45.78
µ21.45Cm
8.08
S0max
1.45Cm
8.08 At the interface between the behind plane of the vocal muscle and the breathing flow, the vocal chord is subjected to the pulsating pressure of the breathing flow due to the open-closed cycle of vocal hold, and the breathing flow is subjected to the pulsating acceleration due to the vocal chord vibration as shown in Figure 4. The calculation model of the breathing flow and the principal dimension of the model are shown in Figure 5.
6.2 Calculation results of the vocal chord
The eigen frequencies of the vocal chord has been analysed at first, by varying the activation level of vocal muscle shown in Figure 1(d) as A. The result is shown in Figure 6, and it is seen that the eigenfrequency of the vocal chord is 190 Hz without any muscle activation, and it increases due to the muscle activation level, ( )ol ε∆ , defined in Figure 2(e), in which the dashed stress(or force) is induced by partial pull back, 2( )l β∆ , of the isotropic contraction l0(β2). Figure 7 shows the results of complex eigenvalue analysis of the vocal chord without muscle activation. It is seen in Figure 7 that the damped vibration occurs in the negative region of the real root as shown in Figure 7(a), and the divergent vibration in the positive region of the real root is occurred as shown in Figure 7(c). On the contrary, the steady, constant amplitude vibration is successfully occurred at the intersection between the damped and the divergent vibrations, and it give rise to the source voice vocalizing.
332 Fluid Structure Interaction and Moving Boundary Problems IV
The eigenfrequencies of (a) through (c) cases coincides each other with the value of 190 Hz which is the same as in Figure 6.
z
[m
]
t [sec]
10-3 10-3 10-3
z
[m
]
0 0-0.1
0 0
20.1
0.2
0.02
z
[m
]
t [sec]0.02 0.040.04
t [sec]0
-2
0
2
4
6
0.02 0.04
z : amplitudeuz1uz2
uy1uy2uz1uz2
uy1uy2uz1uz2
uy1uy2
100
200
300
real root λR [10-3]imag
inat
y ro
ot λ
1[H
z]
ε0 = 0
50mmAq20mmAq
500mmAq
(a) damped vibration (b) steady vibration (c) divergent vibration (d) result of route-locus approach Figure 7: Damped, divergent and steady vibrations characteristics by route
locus approach (ε0 = 0).
6.3 Coupled analysis of the vocal chord vibration and breathing flow dynamics
Finally the coupled analysis of both the vocal chord vibration and the breathing flow dynamics has been carried out, and the result is shown in Figure 8(a) to (c), in which Figure 8(a) show the time history of the vibration amplitude at the starting and Figure 8(b) shows the cooperation characteristics of the pressure pulsation in flow dynamics and vibration amplitude. During the vocal-hold opening, the pressure in pulsating flow reduces, and the vibration amplitude reaches to the maximum value. Once the vocal-hold closes due to the reduction of vibration amplitude, the pressure in the breathing flow increase to the maximum value, yielding to the vibration amplitude increases. When this cycle of iteration continue in steady state, and that it coincides with the eigenfrequency of the vocal chord, it results to the source voice vocalizing, which can be applied to generates vowels or consonants at the connected resonant box of the mouth cavity-tongue motion. Figure 8(c) shows the results of the route locus approach both for the case without vocal muscle activation and for the case with the vocal muscle activation with ε0 = 0.3, which is estimated to generate the one-octave higher frequency of the source voice. It is successfully appeared in the calculation results.
6.4 Measurements of the source voice vocalizing
Two types of measurements for the source voice vocalizing of a 22-year old living human have been done, i.e. One is vibration measurements at the Laryngeal Prominence, using the acceleration pick up and another is the measurements of vocalizing flow at the mouth-outlet part using microphone, followed by FFT analyses. Each measurement has two cases, that is, one is for vocalizing the standard [a] and another for vocalizing of [a’] which has one octave higher than that of standard.
334 Fluid Structure Interaction and Moving Boundary Problems IV
Both results are shown in Figure 9(a) through (c). Figure 9(a) shows the measurement equipments for the vibration at the Laryngeal Prominence. Figure 9(b-1) shows the results of the frequency-response characteristics of the vibration for vocalizing [a] without muscle activation, and Figure 9(b-2) shows the similar results for vocalizing [a’] with muscle activation of ε0 = 0.3, respectively. Figure 9(c-1) shows the results of the frequency-response characteristics of the sound pressure measurements for [a] and Figure 9(c-2) for [a’] respectively. It is seen from these figures as follows. (1) The results, obtained from the vibration measurements, and from the sound
pressure measurements, coincide well in each other. (2) The exciting frequency of standard source voice [a] coincides well with
those of the calculated as shown in Figure 6 and Figure 8(c) without muscle activation.
(3) The exciting frequency of one-octave higher than standard [a’] coincides well with those of the calculated as shown in the same figures.
(4) By comparisons with those obtained from both the calculated and the measured for one-octave higher exciting frequency. It is clarified that the exciting frequency for [a’] vocalization can be obtained from the vocal muscle activation of the pull back contents of 20% of the muscle length.
7 Concluding remarks
The results are summarized as follows. (1) The three-dimensional finite element system for the dynamic response
analysis of muscle and hyperelastic finite deformation soft tissue has been developed.
(2) Combined it with the finite element system of flow dynamics of the Lighthill equation, the coupled dynamics of the vocal chord vibration and breathing flow dynamics has been successfully solved by varying the vocal muscle activation.
(3) Complex eigenfrequency analysis of the vocal chord has successfully revealed the characteristics of the presence of the damped vibration, the divergent vibration and the steady amplitude vibration, and it is verified that the steady amplitude vibration can create the source voice vocalizing.
(4) It is also demonstrated that the various frequencies of the source voice vocalizing can be obtained by varying the vocal muscle activation.
(5) The exciting frequency, measured at Laryngeal Prominence, for the source voice vibration, and the exciting frequency of the acoustical vibration, measured at mouth outlet part are coincides well in each other, and that they coincides well with those obtained from calculated results.
(6) It is also verified that the exciting frequency of the one octave higher source voice vocalizing [a’], which is obtained from measurements, can be attained by vocal muscle activation of 20% pull back of the free activation contraction, based on the numerical calculation results.
Fluid Structure Interaction and Moving Boundary Problems IV 335
References
[1] Ishizaka, J. Flanagan (1978). Self exciting vibration model in source voice vocalizing of vocal chord, J. of the Acoustical Society of Japan.
[2] Kagawa (1989). Sound and Vibration Engineering using the Finite Element Method, Baifukan.
[3] Tsuta, T., Wang, C., and Yamane, K. (1992). Compute Simulation of Facial Mechanics(1st) Finite Element Method of Hyper elastic Finite Deformation Solid, Trans, JSME.
[4] Tsuta, T., Li, M., Iwamoto, T., and Kaneko, O. (1997). Muscle Continuum Mechanics and FEM Simulation on Facial Mechanics of Muscle-Soft Tissue System. Engineering Research Report of Hiroshima Univ. Vol.46.
[5] Tsuta, T., and Iwamoto, T. (2001). Vowel Vocalizing Analyses of Mouth Lavity-Tongue Muscle System Using Frequency Optimization Approach of Source Voice Pulsating Flow, Proc. APCOM’01.
[7] Iijima, Miki, N and Nagai, N. (1991). Mechanical Influences of Nonlinear Viscoelastic Flow in Vocal Chord Surface, IEICE J75-A11.
[8] Tsuta, T., Iwamoto, T. and Fujimura, T. (1999). Continuum Mechanics of Facial Muscles and Creep-Relaxation Remodeling Analysis of Muscle-Skin System. CMBBE. Vol.4.