Vol. 7, No. 5 / May 2008 / JOURNAL OF OPTICAL NETWORKING 467
Self-protected long-reach 10 Gbits/sEPONs based on a ring
architecture
João Santos,1,* João Pedro,1,2 Paulo Monteiro,1,3 and João Pires2
1Nokia Siemens Networks Portugal, S. A., Communication Technology and OperationsOrganization, Research, Technology, and Platforms, Network Technology, Network
Access and Bitways, Photonic Networks,Rua Irmãos Siemens 1, 2720-093 Amadora, Portugal
2Instituto de Telecomunicações, Instituto Superior Técnico, Avenida Rovisco Pais,1049-001 Lisboa, Portugal
3Instituto de Telecomunicações–Pólo de Aveiro, Universidade de Aveiro,3810-193 Aveiro, Portugal
1. IntroductionSignificant and ever-increasing bandwidth demand from end users is pushing world-wide network operators to improve their network infrastructures [1–3] in order tomitigate the capacity bottleneck [4] present in current access networks. One of thesolutions proposed to overcome this limitation is to extend the optical fiber closer tothe customer household. Passive optical networks (PONs) [4] are seen as an attractivesolution to increase the fiber penetration deeper into the subscriber loop, while ensur-ing a cost-effective optical access structure. PONs use a completely passive opticalfiber plant, typically based on a tree topology to connect the head-end node, called theoptical line terminal (OLT), with several end nodes, designated as optical networkunits (ONUs). The feeder fiber, originated in the OLT, is split into several branches,using bidirectional optical passive splitters–combiners (PSCs). The downstream andupstream channels are separated in the wavelength domain using wavelength divi-sion multiplexing (WDM) with the 1480–1500 nm band reserved for downstream andthe 1260–1360 nm band dedicated for upstream.
Nowadays, there are several PON standards available in the market. The Interna-tional Telecommunication Union Telecommunication Standardization Sector (ITU-T)offers two recommendations for this specific network: the broadband PON (BPON) [5]and the gigabit PON (GPON) [6]. The other PON standard is the Ethernet PON(EPON) [7] provided by IEEE. From all those standards, EPON is potentially theleast expensive solution because it is based on the simple, widespread, and low-costEthernet technology. The EPON standard specifies a fixed bidirectional line rate of1.25 Gbits/s, which is reduced to 1 Gbit/s due to line coding, a splitting ratio varyingfrom 16 to 32 ONUs, and a maximum physical reach of 20 km. The data rate ceilingof 1 Gbit/s can pose a serious restriction to service providers, since the advent of
Vol. 7, No. 5 / May 2008 / JOURNAL OF OPTICAL NETWORKING 468
bandwidth-intensive services, such as IP high-definition television (HDTV) andon-line gaming, is pushing for higher access data rates. For this reason, standardiza-tion activities are currently under way at IEEE [8], in order to upgrade the EPONbandwidth to accommodate 10 Gbits/s data rates (10G EPON), and the equipment isexpected to reach the market in 2009. An additional effort that is also being pursuedis to develop appropriated solutions to increase the splitting ratio well beyond 32ONUs and extend the maximum reach of traditional EPON technologies to distancesover 100 km. These developments can make the way for the emergence of long-reach10G EPONs and establish the foundations for the merging of access and metro net-works into a unified architecture. This convergence is envisioned as a natural trend toreduce capital and operational costs, since it provides considerable savings in manyareas, such as real estate, telecommunication equipment, and power consumption.However, these benefits come with some expenses. First, the network can no longer betotally passive and requires optical amplification to compensate for the additionallosses. Second, in long-reach 10G EPONs strict service availability requirements areexpected, which will probability require the incorporation into the network design ofenhanced restoration and protection mechanisms. To address some of these concernsan alternative structure, called super-PON [9–11], was introduced in the mid-1990s. Itused optical amplifiers (OAs) to increase the available power budget. The super-PONwas based on a tree-and-branch topology with a maximum reach of 100 km, supported�2048 ONUs, and had a line data rate of 311 Mbits/s and 2.5 Gbits/s for upstreamand downstream, respectively. Although this super-PON structure provided largercoverage areas and high splitting ratios when compared with typical PONs, it alsoexhibited some serious drawbacks. On one hand, the network topology used has someweaknesses in dealing with highly survivable designs [12]. On the other hand theexcessive accumulation of amplified spontaneous emission (ASE) noise in theupstream channel caused by the noise funneling in the amplified splitter node [9] canlead to a significant degradation of the upstream signal. Furthermore, the bit rateassigned to each of the 2048 ONUs would be too small to appear as a serious and com-petitive alternative to current access solutions.
To successfully cope with the technological and economic challenges introduced bythe super-PON and the traditional EPONs, we have proposed an architecture for aself-protected long-reach 10G EPON network [13] that intends to overcome some ofthe weaknesses of both networks. This architecture is designed with the goal ofachieving a high level of survivability and relies on a ring-shaped feeder for intercon-necting several 10G EPONs to a single OLT unit. To enable large coverage areas andhigh splitting ratios this long-reach network requires the use of optical amplificationto compensate the additional power losses. The amplification, jointly with other func-tionalities such as protection switching and signal monitoring, is provided by theremote nodes (RNs) that connect each EPON (from the distribution section) to thering (feeder section).
The use of a ring network as the feeder structure in a PON has been proposed byother authors and serves, for example, as the basis of the SUCCESS architecture [14].This architecture can dramatically increase the throughput of PONs, at the cost ofusing very expensive technology such as tunable lasers and semiconductor-optical-amplifier- (SOA-) based ONUs and requiring complex medium access control (MAC)protocols and scheduling algorithms. Our network approach leads to a more modestthroughput and requires the use of optical amplification in the feeder network. How-ever, it has the advantages of supporting a higher number of ONUs, covering a largerarea, and being more cost-effective, because in what concerns the MAC algorithmsand the ONU structure it relies on solutions compliant with the EPON standard. Fur-thermore, our work puts much more emphasis on the topic of survivability, proposing,namely, a new protection mechanism to deal with failures in the feeder section.
This paper describes the structure and evaluates the feasibility of a survivablelong-reach 10G EPON architecture based on an amplified ring-shaped feeder for inter-connecting several EPONs to a single OLT. The scenario considered assumes that theOLT capacity is shared by four 10G EPONs (with 20 km and 32 ONUs each) equallydistributed along a ring that spans up to 100 km in perimeter. The network perfor-mance is evaluated using computer simulations at both physical and logical layerstaking into account both the service and protection operational states. In the physicallayer, the most prominent impairments are identified and accounted for to properly
Vol. 7, No. 5 / May 2008 / JOURNAL OF OPTICAL NETWORKING 469
characterize the amplifier gains necessary to guarantee a given bit error performancefor both the downstream and upstream flows. In the logical layer, the MAC manage-ment of the upstream channel is attested to by comparing two well-known dynamicbandwidth allocation (DBA) algorithms: a traditional one [known as interleaved poll-ing adaptive cycle time (IPACT) [15]] and a modified version of IPACT with traffic-prediction features [16].
The paper is organized as follows. Section 2 contains a detailed description of thelong-reach 10G EPON architecture and the protection mechanism used in the ring-shaped feeder. In Section 3, the impact of physical impairments is studied and therequirement put on the optical amplifiers is assessed. Section 4 evaluates the MAClayer management of the network upstream channel performed by two different DBAalgorithms, considering both the service and the protection states of the network.Finally, in Section 5, some conclusions are drawn regarding the most important fea-tures discussed in this paper.
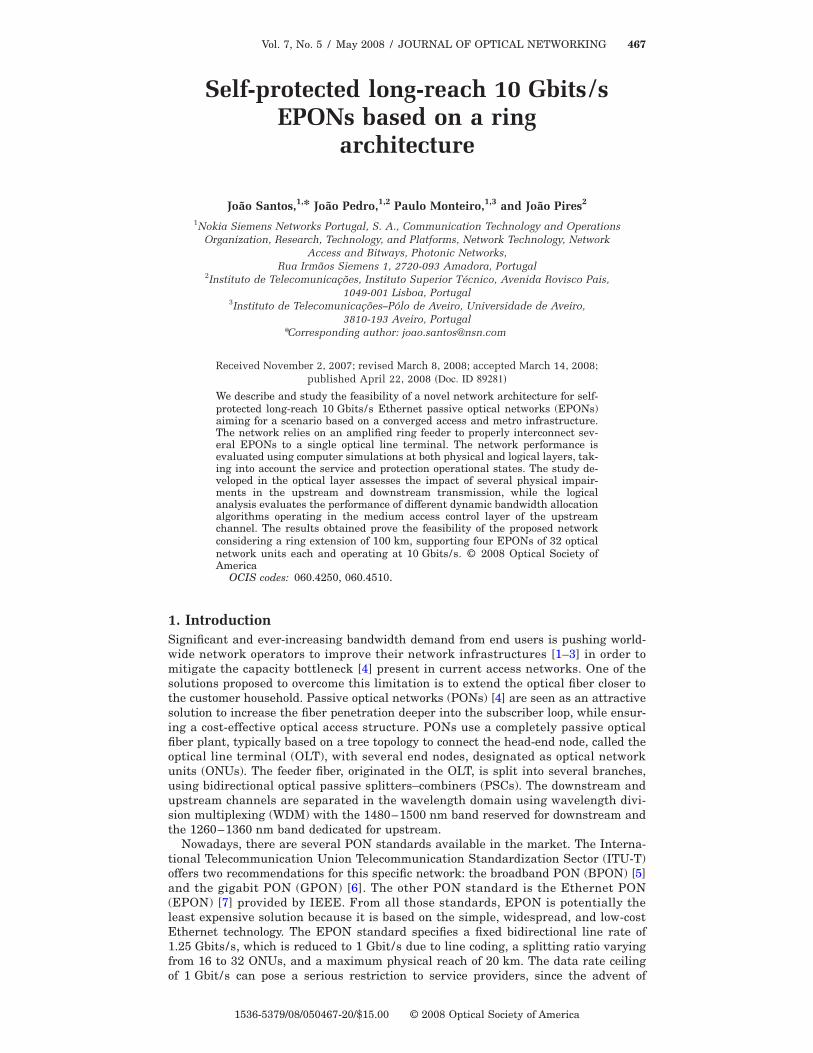
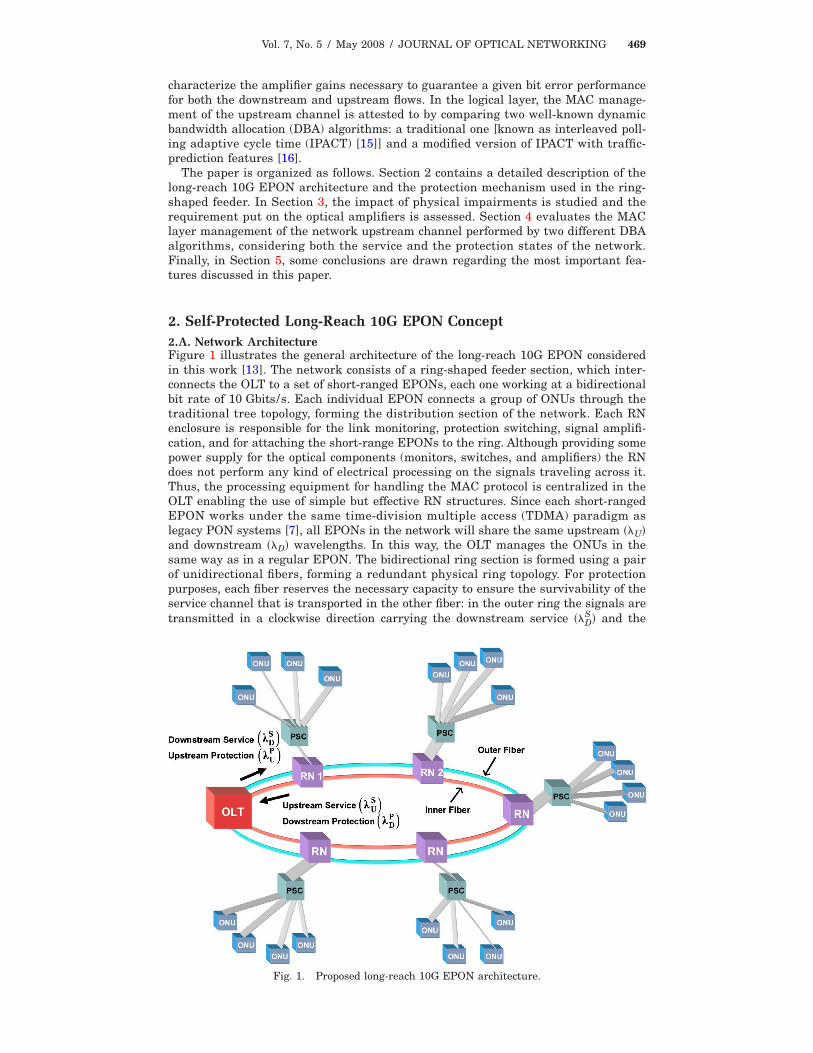
2. Self-Protected Long-Reach 10G EPON Concept2.A. Network ArchitectureFigure 1 illustrates the general architecture of the long-reach 10G EPON consideredin this work [13]. The network consists of a ring-shaped feeder section, which inter-connects the OLT to a set of short-ranged EPONs, each one working at a bidirectionalbit rate of 10 Gbits/s. Each individual EPON connects a group of ONUs through thetraditional tree topology, forming the distribution section of the network. Each RNenclosure is responsible for the link monitoring, protection switching, signal amplifi-cation, and for attaching the short-range EPONs to the ring. Although providing somepower supply for the optical components (monitors, switches, and amplifiers) the RNdoes not perform any kind of electrical processing on the signals traveling across it.Thus, the processing equipment for handling the MAC protocol is centralized in theOLT enabling the use of simple but effective RN structures. Since each short-rangedEPON works under the same time-division multiple access (TDMA) paradigm aslegacy PON systems [7], all EPONs in the network will share the same upstream ��U�and downstream ��D� wavelengths. In this way, the OLT manages the ONUs in thesame way as in a regular EPON. The bidirectional ring section is formed using a pairof unidirectional fibers, forming a redundant physical ring topology. For protectionpurposes, each fiber reserves the necessary capacity to ensure the survivability of theservice channel that is transported in the other fiber: in the outer ring the signals aretransmitted in a clockwise direction carrying the downstream service ��D
Vol. 7, No. 5 / May 2008 / JOURNAL OF OPTICAL NETWORKING 470
upstream protection ��UP � wavelengths, while the inner ring operates in the opposite
direction supporting the upstream service ��US � and the downstream protection ��D
P�wavelengths. To facilitate the provisioning and management of the optical transmit-ters and receivers in the OLT, as well as in the ONUs, it is assumed that �U
P =�US =�U
and �DP =�D
S =�D. Therefore, the redundancy in the ring feeder is enabled by providingboth wavelengths in each fiber and using a proper switching mechanism in the RNsthat restores the network whenever a failure is detected.
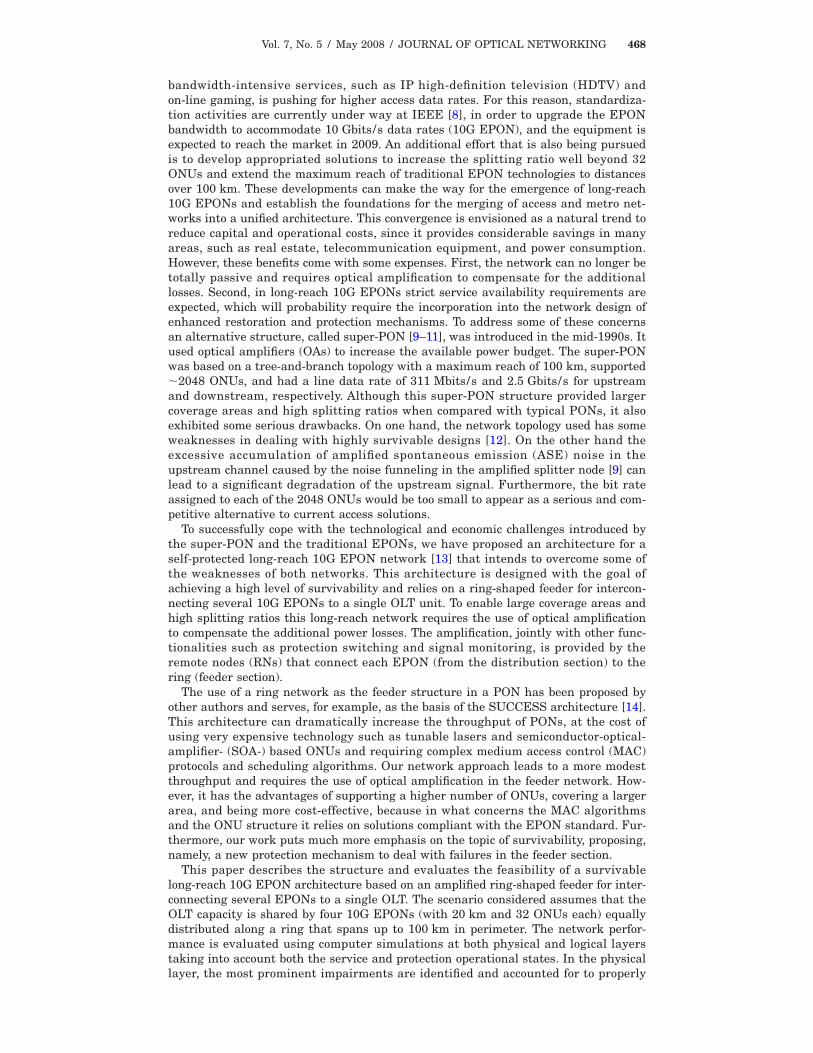
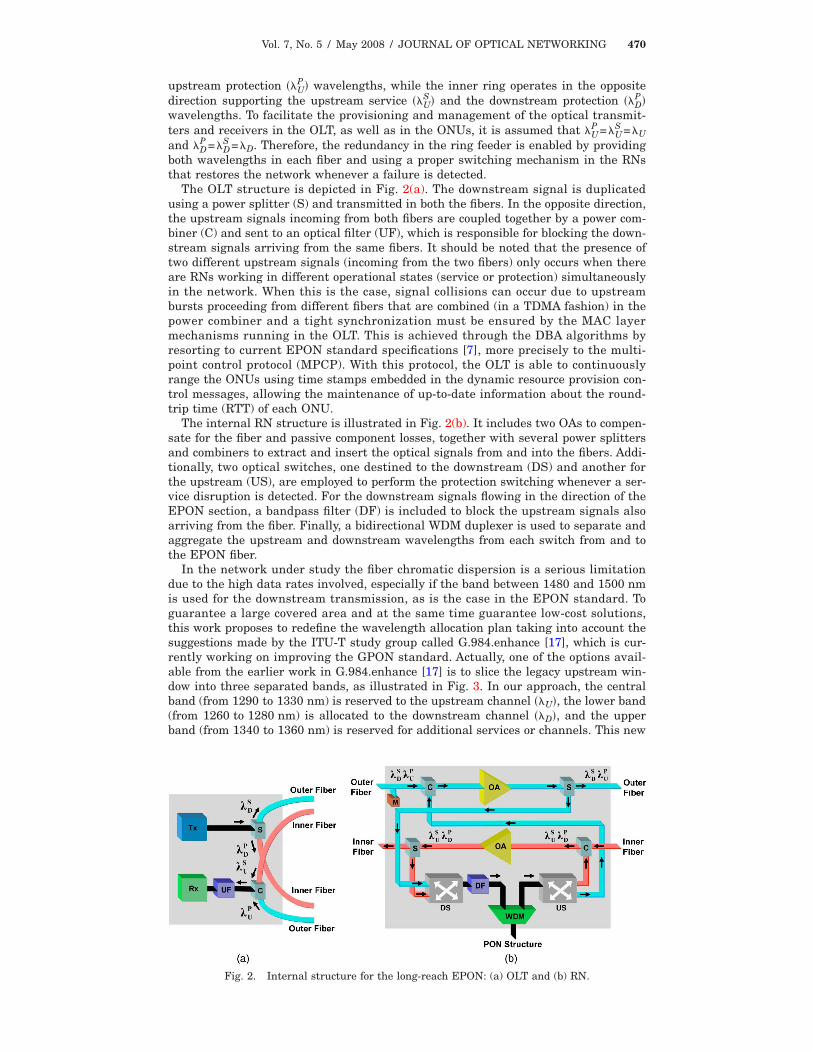
The OLT structure is depicted in Fig. 2(a). The downstream signal is duplicatedusing a power splitter (S) and transmitted in both the fibers. In the opposite direction,the upstream signals incoming from both fibers are coupled together by a power com-biner (C) and sent to an optical filter (UF), which is responsible for blocking the down-stream signals arriving from the same fibers. It should be noted that the presence oftwo different upstream signals (incoming from the two fibers) only occurs when thereare RNs working in different operational states (service or protection) simultaneouslyin the network. When this is the case, signal collisions can occur due to upstreambursts proceeding from different fibers that are combined (in a TDMA fashion) in thepower combiner and a tight synchronization must be ensured by the MAC layermechanisms running in the OLT. This is achieved through the DBA algorithms byresorting to current EPON standard specifications [7], more precisely to the multi-point control protocol (MPCP). With this protocol, the OLT is able to continuouslyrange the ONUs using time stamps embedded in the dynamic resource provision con-trol messages, allowing the maintenance of up-to-date information about the round-trip time (RTT) of each ONU.
The internal RN structure is illustrated in Fig. 2(b). It includes two OAs to compen-sate for the fiber and passive component losses, together with several power splittersand combiners to extract and insert the optical signals from and into the fibers. Addi-tionally, two optical switches, one destined to the downstream (DS) and another forthe upstream (US), are employed to perform the protection switching whenever a ser-vice disruption is detected. For the downstream signals flowing in the direction of theEPON section, a bandpass filter (DF) is included to block the upstream signals alsoarriving from the fiber. Finally, a bidirectional WDM duplexer is used to separate andaggregate the upstream and downstream wavelengths from each switch from and tothe EPON fiber.
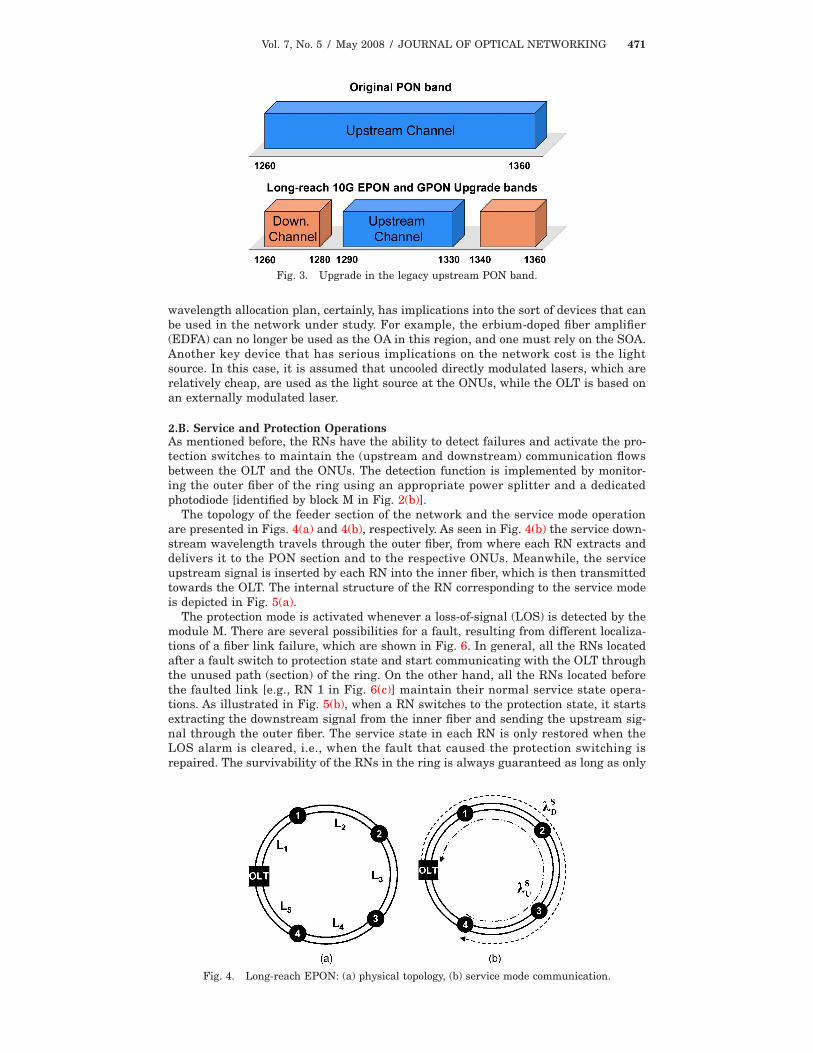
In the network under study the fiber chromatic dispersion is a serious limitationdue to the high data rates involved, especially if the band between 1480 and 1500 nmis used for the downstream transmission, as is the case in the EPON standard. Toguarantee a large covered area and at the same time guarantee low-cost solutions,this work proposes to redefine the wavelength allocation plan taking into account thesuggestions made by the ITU-T study group called G.984.enhance [17], which is cur-rently working on improving the GPON standard. Actually, one of the options avail-able from the earlier work in G.984.enhance [17] is to slice the legacy upstream win-dow into three separated bands, as illustrated in Fig. 3. In our approach, the centralband (from 1290 to 1330 nm) is reserved to the upstream channel ��U�, the lower band(from 1260 to 1280 nm) is allocated to the downstream channel ��D�, and the upperband (from 1340 to 1360 nm) is reserved for additional services or channels. This new
Fig. 2. Internal structure for the long-reach EPON: (a) OLT and (b) RN.
Vol. 7, No. 5 / May 2008 / JOURNAL OF OPTICAL NETWORKING 471
wavelength allocation plan, certainly, has implications into the sort of devices that canbe used in the network under study. For example, the erbium-doped fiber amplifier(EDFA) can no longer be used as the OA in this region, and one must rely on the SOA.Another key device that has serious implications on the network cost is the lightsource. In this case, it is assumed that uncooled directly modulated lasers, which arerelatively cheap, are used as the light source at the ONUs, while the OLT is based onan externally modulated laser.
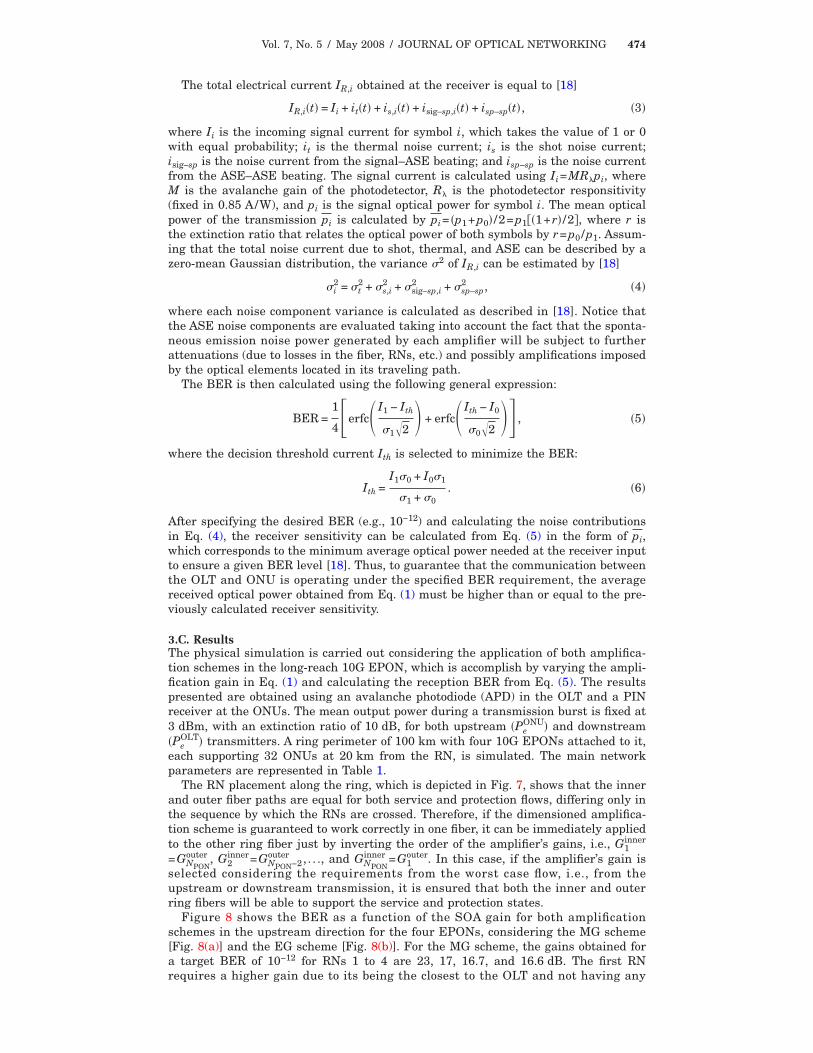
2.B. Service and Protection OperationsAs mentioned before, the RNs have the ability to detect failures and activate the pro-tection switches to maintain the (upstream and downstream) communication flowsbetween the OLT and the ONUs. The detection function is implemented by monitor-ing the outer fiber of the ring using an appropriate power splitter and a dedicatedphotodiode [identified by block M in Fig. 2(b)].
The topology of the feeder section of the network and the service mode operationare presented in Figs. 4(a) and 4(b), respectively. As seen in Fig. 4(b) the service down-stream wavelength travels through the outer fiber, from where each RN extracts anddelivers it to the PON section and to the respective ONUs. Meanwhile, the serviceupstream signal is inserted by each RN into the inner fiber, which is then transmittedtowards the OLT. The internal structure of the RN corresponding to the service modeis depicted in Fig. 5(a).
The protection mode is activated whenever a loss-of-signal (LOS) is detected by themodule M. There are several possibilities for a fault, resulting from different localiza-tions of a fiber link failure, which are shown in Fig. 6. In general, all the RNs locatedafter a fault switch to protection state and start communicating with the OLT throughthe unused path (section) of the ring. On the other hand, all the RNs located beforethe faulted link [e.g., RN 1 in Fig. 6(c)] maintain their normal service state opera-tions. As illustrated in Fig. 5(b), when a RN switches to the protection state, it startsextracting the downstream signal from the inner fiber and sending the upstream sig-nal through the outer fiber. The service state in each RN is only restored when theLOS alarm is cleared, i.e., when the fault that caused the protection switching isrepaired. The survivability of the RNs in the ring is always guaranteed as long as only
Vol. 7, No. 5 / May 2008 / JOURNAL OF OPTICAL NETWORKING 472
one link fault occurs at a given time. If two failures occur simultaneously, in two dif-ferent ring links, all the RNs that are located in the middle of the failures will losetheir connection to the OLT.
With the protection scheme described, the RNs run and control their service andprotection states in an autonomous way, since their reaction is only dependent on thecondition of the local LOS alarm. Therefore, the switching procedures in the proposedarchitecture are accomplished without resorting to any control signaling with theOLT.
3. Physical Layer AssessmentTo study the feasibility of the proposed network, the impact of physical layer impair-ments was evaluated by computer simulation. The developed model takes into accountimpairments such as RN insertion losses, splitter losses, fiber attenuation and disper-sion, as well as ASE noise generated by the SOAs, and allows us to obtain the biterror rate (BER), for both the upstream and downstream signals. Although both direc-tions use the same data rate �10 Gbits/s�, the upstream direction has additional diffi-culties. First, for cost reasons, the high-power light sources used in the downstreamdirection cannot be justified in the ONU equipment. Second, due to the shape of thenetwork topology the upstream signals are more affected by the ASE noise than theirdownstream counterparts. These facts imply that the amplifier gains required to
Fig. 6. Possible fiber fault locations and long-reach EPON communication flows.
Fig. 5. RN behavior in (a) service and (b) protection states.
Vol. 7, No. 5 / May 2008 / JOURNAL OF OPTICAL NETWORKING 473
achieve a given performance in each direction are expected to be different. To studythis behavior, the BER is evaluated as a function of the gain G of the amplifiers posi-tioned along the ring using two strategies:
(1) Equal gain (EG).With this strategy the gain is the same for all the amplifiersplaced along the ring.
(2) Minimum gain (MG). With this amplification scheme the gain of the amplifierin the ith RN is settled in the minimum value that guarantees the accomplishment ofa given targeted BER at the receiver for the EPON connected to that RN.
3.A. Physical Impairments and CharacteristicsUsing as a reference the network structure depicted in Fig. 1, the average opticalpower received at the OLT �Pr,w
OLT� for the wth EPON, in the upstream, can be writtenas
Pr,wOLT = Pe
ONU − LPON − �k=1
w
LRN,k + �k=1
w
Gk − �k=1
w
Lk − LOLT − DU�LT�,
w = 1,2, . . . ,NPON, �1�
where PeONU denotes the average optical transmission power of a given ONU, LPON is
the power loss in the EPON section, LRN is the loss in the RN, Lk is the loss in the kthring link between two RNs as shown in Fig. 4(a), LOLT is the loss inside the OLT, andDU�LT� is the chromatic dispersion penalty originated in the optical fiber (of lengthLT). For the downstream, the average power received at the ONU Pr,w
ONU is calculatedusing Eq. (1), but with the optical power Pe
ONU replaced with the average transmissionpower of the OLT Pe
OLT. The upstream dispersion penalty DU�LT� from Eq. (1) isobtained by accounting for the chirp-based dispersion [18] in the fiber. In the down-stream, the dispersion penalty is negligible due to the use in the OLT of an externallymodulated light source transmitting in a wavelength band where the chromatic dis-persion is quite low. The fiber dispersion values are calculated using the typical G.652fiber dispersion model with a zero dispersion wavelength at 1310 nm and a dispersionslope of 0.093 ps/nm2 km [19].
The referred losses [see Figs. 2(a) and 2(b)] are given by
where LPSC�1:2� is the power loss verified in a PSC of two entrance–output ports, Lfilteris the optical filter insertion loss, Lcon is the loss in a connector, mRN is the fiber lengthbetween two RNs, � is the attenuation coefficient of the optical fiber, Lsplice is the lossper fiber splice, Lswitch is the switch power loss, Lcoupler is the loss in the WDMduplexer, mODN is the optical distribution network (ODN) fiber length, andLPSC�1:NONU� is the loss in the EPON PSC. The power loss in a 1:M PSC is obtained by10 log10�M�+0.5 log2�M�. To simplify the analysis, it is assumed that the RNs areequally distributed in the ring; i.e., the ring fiber links between RNs mRN are identi-cal and equal to dring/ �NPON+1�, where dring corresponds to the ring perimeter.
Since the SOAs are used as in-line amplifiers, we assume that they will be operat-ing in the linear regime where nonlinear effects are not expected to interfere with thesignal, and so these effects are neglected in our analysis. Furthermore, it is also con-sidered that the amplifiers have a flat gain in both downstream and upstream bands.
3.B. Noise Contributions and BER EstimationThis subsection provides a brief description of the procedure used to estimate theBER, taking into account several noise sources. These sources include the shot andthermal noise generated in the photodetector and electrical circuitry, respectively, aswell as the ASE noise originated from the OAs.
Vol. 7, No. 5 / May 2008 / JOURNAL OF OPTICAL NETWORKING 474
The total electrical current IR,i obtained at the receiver is equal to [18]
where Ii is the incoming signal current for symbol i, which takes the value of 1 or 0with equal probability; it is the thermal noise current; is is the shot noise current;isig–sp is the noise current from the signal–ASE beating; and isp–sp is the noise currentfrom the ASE–ASE beating. The signal current is calculated using Ii=MR�pi, whereM is the avalanche gain of the photodetector, R� is the photodetector responsitivity(fixed in 0.85 A/W), and pi is the signal optical power for symbol i. The mean opticalpower of the transmission pi is calculated by pi= �p1+p0� /2=p1��1+r� /2�, where r isthe extinction ratio that relates the optical power of both symbols by r=p0 /p1. Assum-ing that the total noise current due to shot, thermal, and ASE can be described by azero-mean Gaussian distribution, the variance �2 of IR,i can be estimated by [18]
�i2 = �t
2 + �s,i2 + �sig–sp,i
2 + �sp–sp2 , �4�
where each noise component variance is calculated as described in [18]. Notice thatthe ASE noise components are evaluated taking into account the fact that the sponta-neous emission noise power generated by each amplifier will be subject to furtherattenuations (due to losses in the fiber, RNs, etc.) and possibly amplifications imposedby the optical elements located in its traveling path.
The BER is then calculated using the following general expression:
BER =1
4�erfc� I1 − Ith
�12 + erfc� Ith − I0
�02� , �5�
where the decision threshold current Ith is selected to minimize the BER:
Ith =I1�0 + I0�1
�1 + �0. �6�
After specifying the desired BER (e.g., 10−12) and calculating the noise contributionsin Eq. (4), the receiver sensitivity can be calculated from Eq. (5) in the form of pi,which corresponds to the minimum average optical power needed at the receiver inputto ensure a given BER level [18]. Thus, to guarantee that the communication betweenthe OLT and ONU is operating under the specified BER requirement, the averagereceived optical power obtained from Eq. (1) must be higher than or equal to the pre-viously calculated receiver sensitivity.
3.C. ResultsThe physical simulation is carried out considering the application of both amplifica-tion schemes in the long-reach 10G EPON, which is accomplish by varying the ampli-fication gain in Eq. (1) and calculating the reception BER from Eq. (5). The resultspresented are obtained using an avalanche photodiode (APD) in the OLT and a PINreceiver at the ONUs. The mean output power during a transmission burst is fixed at3 dBm, with an extinction ratio of 10 dB, for both upstream �Pe
ONU� and downstream�Pe
OLT� transmitters. A ring perimeter of 100 km with four 10G EPONs attached to it,each supporting 32 ONUs at 20 km from the RN, is simulated. The main networkparameters are represented in Table 1.
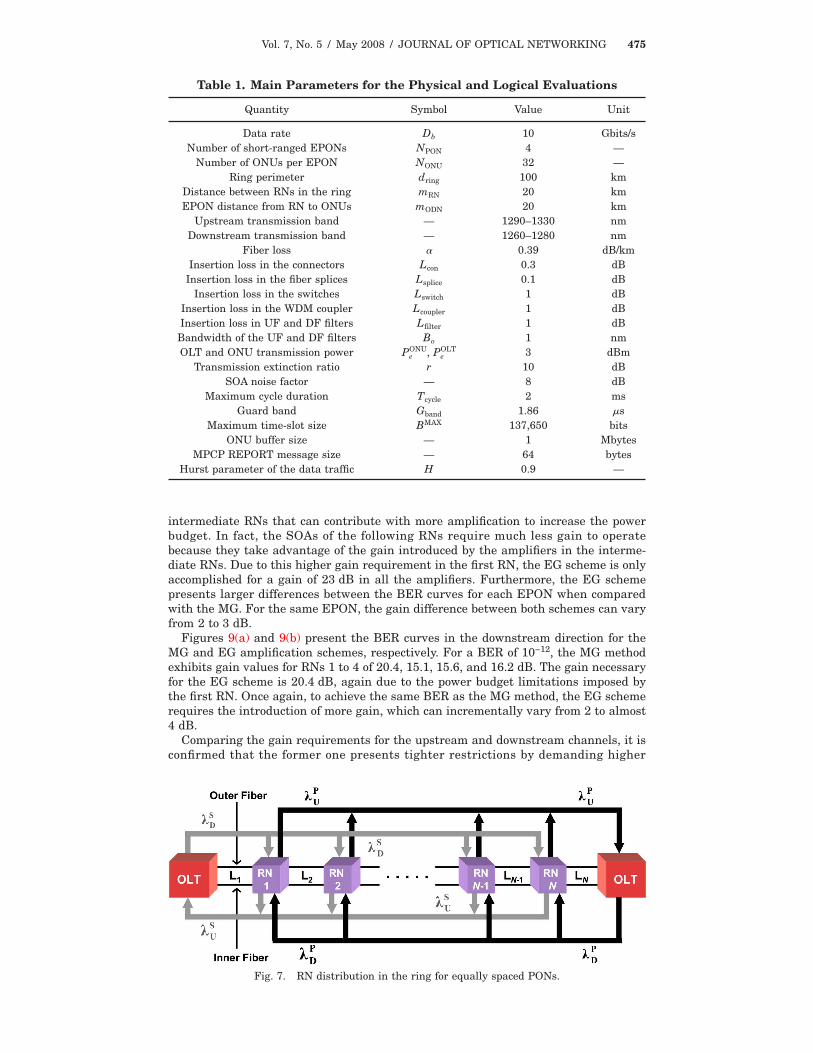
The RN placement along the ring, which is depicted in Fig. 7, shows that the innerand outer fiber paths are equal for both service and protection flows, differing only inthe sequence by which the RNs are crossed. Therefore, if the dimensioned amplifica-tion scheme is guaranteed to work correctly in one fiber, it can be immediately appliedto the other ring fiber just by inverting the order of the amplifier’s gains, i.e., G1
inner
=GNPON
outer , G2inner=GNPON−2
outer , . . ., and GNPON
inner =G1outer. In this case, if the amplifier’s gain is
selected considering the requirements from the worst case flow, i.e., from theupstream or downstream transmission, it is ensured that both the inner and outerring fibers will be able to support the service and protection states.
Figure 8 shows the BER as a function of the SOA gain for both amplificationschemes in the upstream direction for the four EPONs, considering the MG scheme[Fig. 8(a)] and the EG scheme [Fig. 8(b)]. For the MG scheme, the gains obtained fora target BER of 10−12 for RNs 1 to 4 are 23, 17, 16.7, and 16.6 dB. The first RNrequires a higher gain due to its being the closest to the OLT and not having any
Vol. 7, No. 5 / May 2008 / JOURNAL OF OPTICAL NETWORKING 475
intermediate RNs that can contribute with more amplification to increase the powerbudget. In fact, the SOAs of the following RNs require much less gain to operatebecause they take advantage of the gain introduced by the amplifiers in the interme-diate RNs. Due to this higher gain requirement in the first RN, the EG scheme is onlyaccomplished for a gain of 23 dB in all the amplifiers. Furthermore, the EG schemepresents larger differences between the BER curves for each EPON when comparedwith the MG. For the same EPON, the gain difference between both schemes can varyfrom 2 to 3 dB.
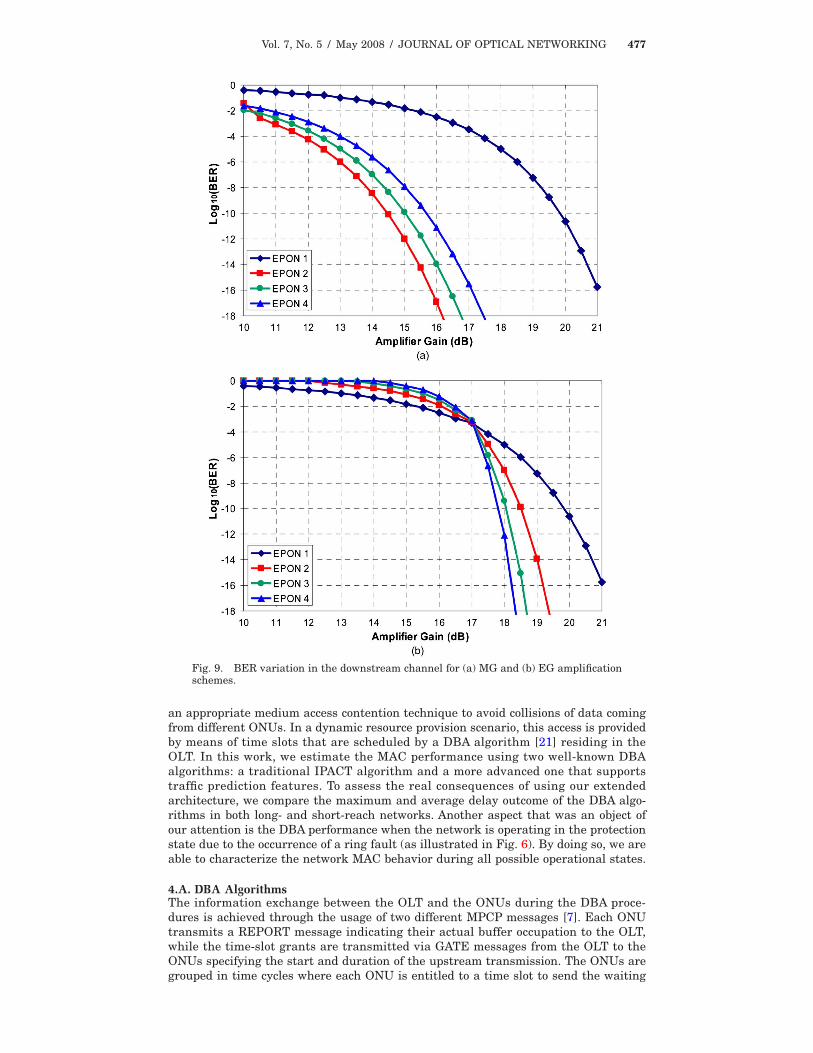
Figures 9(a) and 9(b) present the BER curves in the downstream direction for theMG and EG amplification schemes, respectively. For a BER of 10−12, the MG methodexhibits gain values for RNs 1 to 4 of 20.4, 15.1, 15.6, and 16.2 dB. The gain necessaryfor the EG scheme is 20.4 dB, again due to the power budget limitations imposed bythe first RN. Once again, to achieve the same BER as the MG method, the EG schemerequires the introduction of more gain, which can incrementally vary from 2 to almost4 dB.
Comparing the gain requirements for the upstream and downstream channels, it isconfirmed that the former one presents tighter restrictions by demanding higher
Table 1. Main Parameters for the Physical and Logical Evaluations
Quantity Symbol Value Unit
Data rate Db 10 Gbits/sNumber of short-ranged EPONs NPON 4 —
Number of ONUs per EPON NONU 32 —Ring perimeter dring 100 km
Distance between RNs in the ring mRN 20 kmEPON distance from RN to ONUs mODN 20 km
Upstream transmission band — 1290–1330 nmDownstream transmission band — 1260–1280 nm
Fiber loss � 0.39 dB/kmInsertion loss in the connectors Lcon 0.3 dB
Insertion loss in the fiber splices Lsplice 0.1 dBInsertion loss in the switches Lswitch 1 dB
Insertion loss in the WDM coupler Lcoupler 1 dBInsertion loss in UF and DF filters Lfilter 1 dB
Bandwidth of the UF and DF filters Bo 1 nmOLT and ONU transmission power Pe
ONU, PeOLT 3 dBm
Transmission extinction ratio r 10 dBSOA noise factor — 8 dB
Maximum cycle duration Tcycle 2 msGuard band Gband 1.86 �s
MPCP REPORT message size — 64 bytesHurst parameter of the data traffic H 0.9 —
Fig. 7. RN distribution in the ring for equally spaced PONs.
Vol. 7, No. 5 / May 2008 / JOURNAL OF OPTICAL NETWORKING 476
amplification gains to achieve the same transmission performance between the OLTand the ONUs. This is caused by the excessive ASE noise accumulation that degradesthe ONU sensitivity requiring more gain to guarantee the targeted BER and also bythe presence of a higher dispersion penalty due to the use of uncooled directly modu-lated light sources in the ONUs. Since the referred impairments tend to be moreharmful when the fiber distance and the number of RNs increases, the long-reach 10GEPON planning must give special attention to the ONUs located far away from theOLT. In summary, both MG and EG amplification schemes ensure the communicationperformance at the desired BER, but only the first one is able to minimize the gainvalues in the amplifiers. The overall results show that an acceptable performance�BER�10−12� is obtained if SOAs with a gain of �23 dB are available, which is clearlywithin the range of current technology [20].
4. MAC Layer SimulationThe MAC performance of the long-reach 10G EPON architecture is evaluated hereusing the DBA algorithms that are more commonly applied in standard (short-reach)EPON. In these networks, the upstream wavelength is shared by all the ONUs, using
Fig. 8. BER variation in the upstream channel for (a) MG and (b) EG amplificationschemes.
Vol. 7, No. 5 / May 2008 / JOURNAL OF OPTICAL NETWORKING 477
an appropriate medium access contention technique to avoid collisions of data comingfrom different ONUs. In a dynamic resource provision scenario, this access is providedby means of time slots that are scheduled by a DBA algorithm [21] residing in theOLT. In this work, we estimate the MAC performance using two well-known DBAalgorithms: a traditional IPACT algorithm and a more advanced one that supportstraffic prediction features. To assess the real consequences of using our extendedarchitecture, we compare the maximum and average delay outcome of the DBA algo-rithms in both long- and short-reach networks. Another aspect that was an object ofour attention is the DBA performance when the network is operating in the protectionstate due to the occurrence of a ring fault (as illustrated in Fig. 6). By doing so, we areable to characterize the network MAC behavior during all possible operational states.
4.A. DBA AlgorithmsThe information exchange between the OLT and the ONUs during the DBA proce-dures is achieved through the usage of two different MPCP messages [7]. Each ONUtransmits a REPORT message indicating their actual buffer occupation to the OLT,while the time-slot grants are transmitted via GATE messages from the OLT to theONUs specifying the start and duration of the upstream transmission. The ONUs aregrouped in time cycles where each ONU is entitled to a time slot to send the waiting
Fig. 9. BER variation in the downstream channel for (a) MG and (b) EG amplificationschemes.
Vol. 7, No. 5 / May 2008 / JOURNAL OF OPTICAL NETWORKING 478
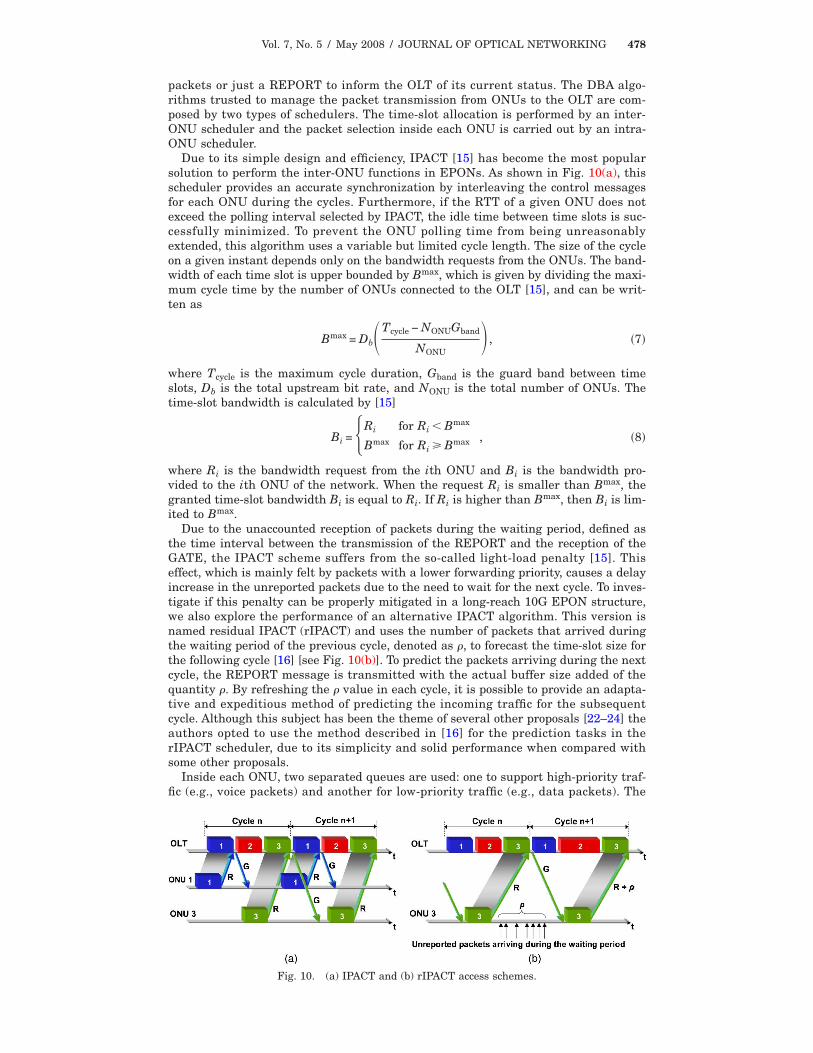
packets or just a REPORT to inform the OLT of its current status. The DBA algo-rithms trusted to manage the packet transmission from ONUs to the OLT are com-posed by two types of schedulers. The time-slot allocation is performed by an inter-ONU scheduler and the packet selection inside each ONU is carried out by an intra-ONU scheduler.
Due to its simple design and efficiency, IPACT [15] has become the most popularsolution to perform the inter-ONU functions in EPONs. As shown in Fig. 10(a), thisscheduler provides an accurate synchronization by interleaving the control messagesfor each ONU during the cycles. Furthermore, if the RTT of a given ONU does notexceed the polling interval selected by IPACT, the idle time between time slots is suc-cessfully minimized. To prevent the ONU polling time from being unreasonablyextended, this algorithm uses a variable but limited cycle length. The size of the cycleon a given instant depends only on the bandwidth requests from the ONUs. The band-width of each time slot is upper bounded by Bmax, which is given by dividing the maxi-mum cycle time by the number of ONUs connected to the OLT [15], and can be writ-ten as
Bmax = Db�Tcycle − NONUGband
NONU , �7�
where Tcycle is the maximum cycle duration, Gband is the guard band between timeslots, Db is the total upstream bit rate, and NONU is the total number of ONUs. Thetime-slot bandwidth is calculated by [15]
Bi = �Ri for Ri � Bmax
Bmax for Ri � Bmax , �8�
where Ri is the bandwidth request from the ith ONU and Bi is the bandwidth pro-vided to the ith ONU of the network. When the request Ri is smaller than Bmax, thegranted time-slot bandwidth Bi is equal to Ri. If Ri is higher than Bmax, then Bi is lim-ited to Bmax.
Due to the unaccounted reception of packets during the waiting period, defined asthe time interval between the transmission of the REPORT and the reception of theGATE, the IPACT scheme suffers from the so-called light-load penalty [15]. Thiseffect, which is mainly felt by packets with a lower forwarding priority, causes a delayincrease in the unreported packets due to the need to wait for the next cycle. To inves-tigate if this penalty can be properly mitigated in a long-reach 10G EPON structure,we also explore the performance of an alternative IPACT algorithm. This version isnamed residual IPACT (rIPACT) and uses the number of packets that arrived duringthe waiting period of the previous cycle, denoted as �, to forecast the time-slot size forthe following cycle [16] [see Fig. 10(b)]. To predict the packets arriving during the nextcycle, the REPORT message is transmitted with the actual buffer size added of thequantity �. By refreshing the � value in each cycle, it is possible to provide an adapta-tive and expeditious method of predicting the incoming traffic for the subsequentcycle. Although this subject has been the theme of several other proposals [22–24] theauthors opted to use the method described in [16] for the prediction tasks in therIPACT scheduler, due to its simplicity and solid performance when compared withsome other proposals.
Inside each ONU, two separated queues are used: one to support high-priority traf-fic (e.g., voice packets) and another for low-priority traffic (e.g., data packets). The
Fig. 10. (a) IPACT and (b) rIPACT access schemes.
Vol. 7, No. 5 / May 2008 / JOURNAL OF OPTICAL NETWORKING 479
purpose of the intra-ONU scheduler is to establish (inside each ONU) a quality of ser-vice (QoS) distinction between the high- and low-priority waiting queues by choosingwhich packets should be first dispatched inside the available upstream time slot. Thisis an important feature if we want to evaluate the performance of the DBA algorithmsin a long-range 10G EPON environment while considering the fulfillment of QoSrequirements [16,25]. The intra-ONU disciplines evaluated are the following:
• Priority queuing (PQ). This algorithm [25] only allows the transmission of anydata packets if the voice queue is empty. By applying this strict priority method,reported data packets shall be delayed if any voice packets arrive during the waitingperiod.
• Deficit round robin (DRR). This algorithm [26] provides a weighted and fair sharebetween the waiting queues at the ONU. To service the queues, it uses round-robinservicing with a QoS assigned to each queue. The only difference from a traditionalround robin is that if a queue was not able to send a packet in the previous roundbecause its packet size was too large, the remainder (deficit) of the previous quantumis added to the quantum for the next round. Thus, deficits are kept track of, i.e.,queues that were shortchanged in a round are compensated in the next round.
In the DRR scheduler, the voice and data queues are applied a quantum of 900 and100 bits, respectively. These values ensure a higher dispatch priority for the voicepackets in the ONUs.
4.B. ResultsThe performance of the DBA algorithms is assessed by simulating the management ofthe long-reach 10G EPON upstream channel operating in the service and protectionstates. The outcome of the service state is also compared with the performanceobtained in a short-range 10G EPON. The ring perimeter of the long-range architec-ture is maintained in 100 km and each of the 4 RNs supports an EPON of 20 km with32 ONUs, resulting in a total of 128 ONUs. In the short-range EPON the 128 ONUsare placed at a distance of 20 km from the OLT using a tree-and-branch topology.Compliant with the EPON standard, the 64 byte REPORT message and the queuepackets sent in each time slot are encapsulated in an Ethernet frame [7]. This meansthat they must include an 8 byte preamble and be separated by a 12 byte interframegap (IFG) from each other. Additionally, the total available bit rate is 10 Gbits/s andthe cycle size is fixed in 2 ms with guard bands of 1.86 �s (which is preserved fromthe 1G EPON standard).
It is assumed that each ONU receives traffic with the same mean bit rate Db,isource,
whereas the high- and the low-priority queues receive packets with a bit rate ofDb,i
source/2. Thus, the total network load can be calculated by
� = �i
NONU �Db,isource
Db � NONU�Db,i
source
Db .
The arrival times of the voice packets are generated using a Poisson distribution,while the data traffic is generated using a M\G\ model [27] where the packetarrival follows a Poisson pattern and the service time duration is obtained through aPareto distribution, with a Hurst parameter of 0.9. By doing so, we obtain a data pat-tern with both self-similarity and long-range dependence characteristics [28] actuallypresent in most of the internet traffic (e.g., http, mail, file sharing, etc.). For bothqueues, a trimodal distribution is applied to the packets transmitted in the Ethernetframe. This distribution is characterized by the fact that 60% of the packets are46 bytes large, 25% have a size of 576 bytes, and 15% have 1500 bytes [29]. The sizeof the data and voice buffers in the ONUs is fixed to 1 Mbyte.
The mean delay suffered by voice and data packets in the service state is presentedin Figs. 11(a) and 11(b), respectively. As expected, due to the high-priority expeditionimposed by intra-ONU schedulers, the mean voice packet delay is maintained small(below 3 ms) even for heavy network loads. On the other hand, when the network loadstarts to consume all the capacity available, the data packets are progressivelydelayed (over 0.1 s for a completely loaded network). Comparing both intra-ONU solu-tions, one can observe that PQ achieves lower voice delays due to the strict queue pri-oritization while DRR achieves a slightly better data delay at the cost of a worst voicedelay because of the inherent queue multiplexing strategy. Additionally, it is also pos-sible to recognize that the rIPACT algorithm is able to reduce both voice and data
Vol. 7, No. 5 / May 2008 / JOURNAL OF OPTICAL NETWORKING 480
delays when compared with the IPACT, provided that the network load does notexceed a value of 0.6. The results clearly show that when the network is not fullyloaded, rIPACT behavior, which as we have seen is based on the anticipation of thepackets arriving on the waiting period, is beneficial to the network performance.When all network resources are in use, the maximum cycle length is generallyachieved and the rIPACT improvement is negligible since the maximum time slot isalways limited by Eq. (7).
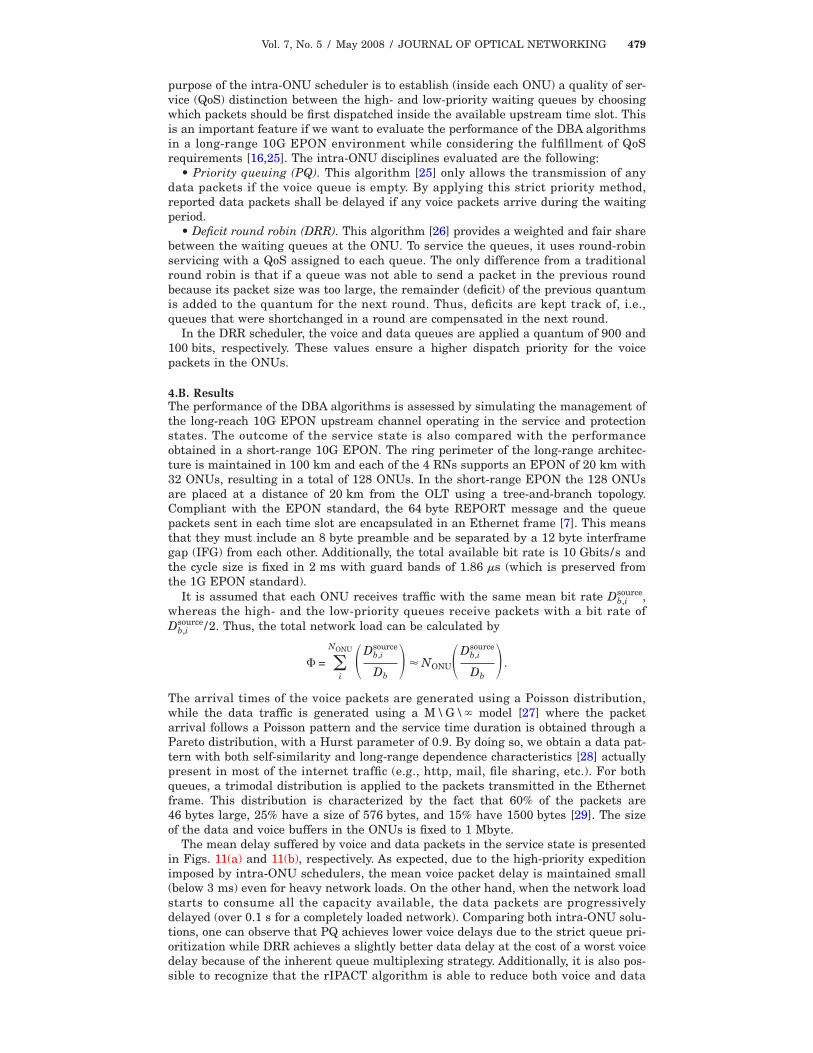
The maximum packet delay for voice and data packets is also depicted in Figs. 12(a)and 12(b), respectively. Although the peak delay values are higher, the evolution ten-dency of the curves is similar to the one obtained for the mean delay. The voice delayreaches a maximum of 20 ms and the data delay can go up to 0.6 s. To evaluate theperformance degradation imposed by the extended architecture in relation to ashorter network, Fig. 13 indicates the additional peak packet delay introduced by thelong-range 10G EPON in comparison with a common short-ranged version. In termsof voice packets [see Fig. 13(a)], we can visualize a growth of the peak delay under2.5 ms, while the data packets [in Fig. 13(b)] can suffer a delay increase of almost13 ms. However, the most significant delay degradation mainly occurs in the presenceof very low network loads, meaning that the long-reach EPON performance is veryclose to the one that the short-range version can achieve.
The mean bit rate provided to each ONU is presented in Fig. 14(a). Although theoutcome of both DRR and PQ is almost identical, the rIPACT algorithm makes use oflonger cycle lengths (due to larger time slots), which will increase the mean bit rateused per ONU. This additional bandwidth (derived from adding � to the customREPORT content) provides an expedited upstream transmission of the unreportedpackets and reduces the packet delay for both voice and data queues. Moreover, amaximum bit rate of almost 74 Mbits/s is achieved for the 128 ONUs sharing the10 Gbits/s upstream link. The time-slot occupation efficiency, depicted in Fig. 14(b), isanother important measure to evaluate the DBA performance. Since Ethernet framescannot be fragmented to fit into an upstream time slot, it may occur that some spaceis left unoccupied in certain given cycles. In terms of inter-ONU schedulers, IPACT
Fig. 12. Maximum delay for (a) voice and (b) data packets.
Fig. 11. Mean delay for (a) voice and (b) data packets.
Vol. 7, No. 5 / May 2008 / JOURNAL OF OPTICAL NETWORKING 481
achieves a higher efficiency mainly due to the fact that the time slot is assigned con-sidering a REPORT message that informs the OLT of the real quantity of traffic wait-ing in the ONU buffers. That is not the case with rIPACT, since the attempt to predictthe number of packets might not always be close to the amount of traffic actuallyarriving. In fact, by relying on statistical information from the subsequent cycle,rIPACT lacks some determinism, causing a waste of the granted bandwidth. Nonethe-less, this decrease in the efficiency is mainly present in light network loads where, infact, there is still plenty of available bandwidth. For the intra-ONU schedulers, theresults are very close although DRR achieves a better performance in light loads byavoiding the use of a strict priority queue policy. In general, the maximum time-slotefficiency obtained is restricted to 98.2%.
Fig. 13. Maximum delay increase in the long-range 10G EPON in comparison with theshort-range 10G EPON for (a) voice and (b) data packets.
Fig. 14. Mean (a) bit rate and (b) time-slot occupation efficiency.
Vol. 7, No. 5 / May 2008 / JOURNAL OF OPTICAL NETWORKING 482
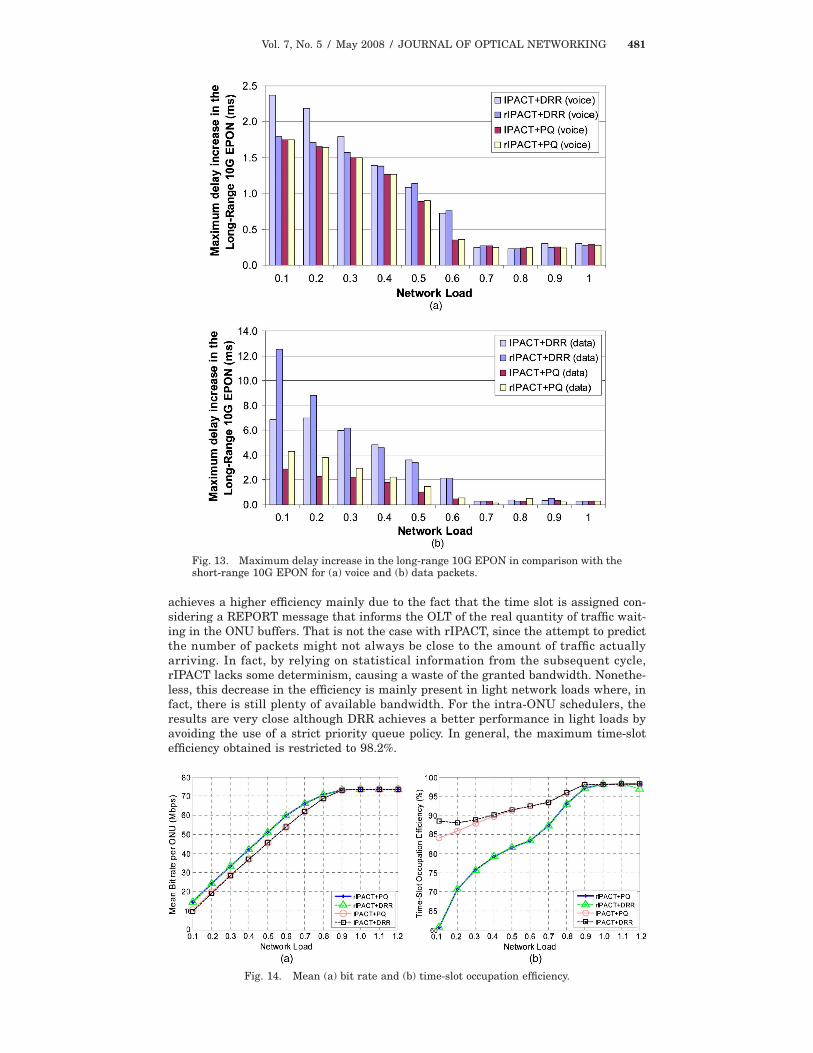
4.C. Protection State ImplicationsWhen the protection state is activated in the long-reach 10G EPON, some (or all) RNswill have to switch the ring fiber from which they are collecting–sending thedownstream–upstream signal, as we have seen in Section 2. As depicted in Fig. 15,the IPACT algorithm capability to efficiently use the upstream channel bandwidthdepends on the RTT duration. If the RTT expands further beyond the time-slot end ofthe precedent ONU in the next cycle, it will insert an idle time not being used inupstream data transmission, thus creating a capacity waste. To assess the impact inthe network performance when the protection mode is triggered, the DBA algorithmsare again simulated considering the occurrence of all the possible faults in the ring,which are described in Fig. 6.
Theoretically, it is possible to use the long-reach EPON characteristics to determinethe limitations that will affect the performance of the DBA algorithm due to the RTTduration. By knowing the location of the RNs in the ring and assuming that all 128ONUs are active and consuming the same bandwidth resources at the same time, it ispossible to estimate the mean RTT using
RTT =2
c/kd̄ =
2
c/k��i
NONUdi
NONU , �9�
where d̄ is referred to as the mean fiber distance between the OLT and ONUs in thenetwork, di is the fiber distance separating the OLT and the ith ONU, c is the lightspeed in the vacuum �3108 m/s�, and k is the propagation constant in the fiber(�1.5 for single-mode fiber). Table 2 presents the mean RTT and the respectiveimprovement obtained in the protection states when compared to the service state.The values presented were calculated considering the protection cases depicted in Fig.6 and by recalling that each ring link �L1 , . . . ,L6� is 20 km long.
A fault occurring in link L1 or L5 (which has a mean RTT identical to the servicestate) leads to the highest mean distance, because the optical signals need to travelthrough the whole ring, with the exception of the last link, to provide the communica-tion between the OLT and all ONUs. When a failure takes place in the other links themean distance tends to diminish and as a consequence the mean RTT also diminishes.Notice that the mean distance to the OLT for a failure in link L2 is the same as for L4,as illustrated in Fig. 6. Table 2 compares the mean RTT values of the protection statein relation to the service state in order to provide some background to compare thetheoretical and the simulated results. As seen, the mean RTT for a fault occurring in
Fig. 15. RTT limitation in the long-reach 10G EPON.
Table 2. Mean RTT for Different Link Failures
Fault Locationd̄
(km)RTT(ms)
RTT Reduction toService State
(%)
Links L1 and L5 (service) 70 0.70 —Links L2 and L4 55 0.55 27.3
Link L3 50 0.50 40.0
Vol. 7, No. 5 / May 2008 / JOURNAL OF OPTICAL NETWORKING 483
link L1 or L5 is the same for the protection state and for the service state, while theother faults lead to a mean RTT improvement for the protection state in comparisonwith the service state. The approximation of the mean RTT given by Eq. (9) assumesthat all ONUs are transmitting the same amount of upstream traffic. In reality, sincethe traffic sources are generated with self-similar properties, this assumption mightnot be the most accurate but still provides an approximate indication of the behaviortrends.
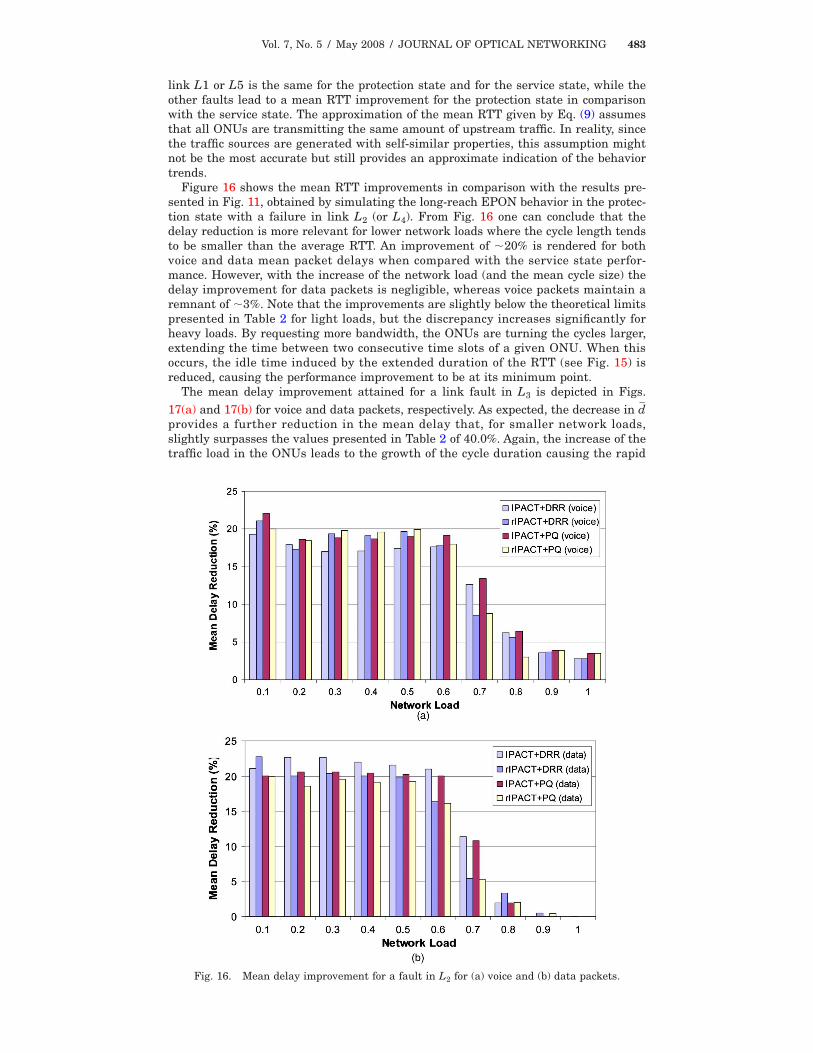
Figure 16 shows the mean RTT improvements in comparison with the results pre-sented in Fig. 11, obtained by simulating the long-reach EPON behavior in the protec-tion state with a failure in link L2 (or L4). From Fig. 16 one can conclude that thedelay reduction is more relevant for lower network loads where the cycle length tendsto be smaller than the average RTT. An improvement of �20% is rendered for bothvoice and data mean packet delays when compared with the service state perfor-mance. However, with the increase of the network load (and the mean cycle size) thedelay improvement for data packets is negligible, whereas voice packets maintain aremnant of �3%. Note that the improvements are slightly below the theoretical limitspresented in Table 2 for light loads, but the discrepancy increases significantly forheavy loads. By requesting more bandwidth, the ONUs are turning the cycles larger,extending the time between two consecutive time slots of a given ONU. When thisoccurs, the idle time induced by the extended duration of the RTT (see Fig. 15) isreduced, causing the performance improvement to be at its minimum point.
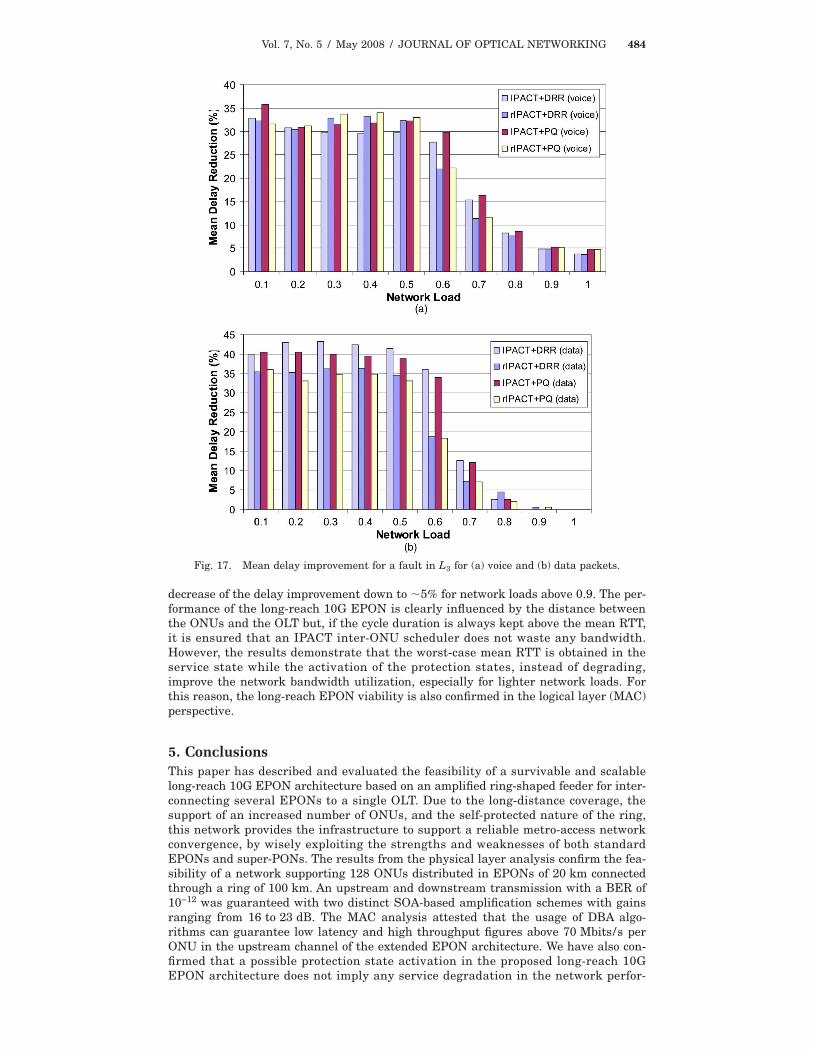
The mean delay improvement attained for a link fault in L3 is depicted in Figs.17(a) and 17(b) for voice and data packets, respectively. As expected, the decrease in d̄provides a further reduction in the mean delay that, for smaller network loads,slightly surpasses the values presented in Table 2 of 40.0%. Again, the increase of thetraffic load in the ONUs leads to the growth of the cycle duration causing the rapid
Fig. 16. Mean delay improvement for a fault in L for (a) voice and (b) data packets.
2
Vol. 7, No. 5 / May 2008 / JOURNAL OF OPTICAL NETWORKING 484
decrease of the delay improvement down to �5% for network loads above 0.9. The per-formance of the long-reach 10G EPON is clearly influenced by the distance betweenthe ONUs and the OLT but, if the cycle duration is always kept above the mean RTT,it is ensured that an IPACT inter-ONU scheduler does not waste any bandwidth.However, the results demonstrate that the worst-case mean RTT is obtained in theservice state while the activation of the protection states, instead of degrading,improve the network bandwidth utilization, especially for lighter network loads. Forthis reason, the long-reach EPON viability is also confirmed in the logical layer (MAC)perspective.
5. ConclusionsThis paper has described and evaluated the feasibility of a survivable and scalablelong-reach 10G EPON architecture based on an amplified ring-shaped feeder for inter-connecting several EPONs to a single OLT. Due to the long-distance coverage, thesupport of an increased number of ONUs, and the self-protected nature of the ring,this network provides the infrastructure to support a reliable metro-access networkconvergence, by wisely exploiting the strengths and weaknesses of both standardEPONs and super-PONs. The results from the physical layer analysis confirm the fea-sibility of a network supporting 128 ONUs distributed in EPONs of 20 km connectedthrough a ring of 100 km. An upstream and downstream transmission with a BER of10−12 was guaranteed with two distinct SOA-based amplification schemes with gainsranging from 16 to 23 dB. The MAC analysis attested that the usage of DBA algo-rithms can guarantee low latency and high throughput figures above 70 Mbits/s perONU in the upstream channel of the extended EPON architecture. We have also con-firmed that a possible protection state activation in the proposed long-reach 10GEPON architecture does not imply any service degradation in the network perfor-
Fig. 17. Mean delay improvement for a fault in L3 for (a) voice and (b) data packets.
Vol. 7, No. 5 / May 2008 / JOURNAL OF OPTICAL NETWORKING 485
mance. Actually, when the network is operating in certain protection states, even sta-tistical benefits in the throughput can be obtained for certain loads and ONU locationscenarios, leading to a mean packet delay improvement of �40% in comparison withthe service state.
AcknowledgmentThis work was supported by Nokia Siemens Networks Portugal, S. A., and by theFundação para a Ciênc ia e a Tecno log ia (FCT) under research grantSFRH/BDE/15652/2007 and was partially funded by the Agência de Inovação (AdI)within the framework of the Next Generation Passive Optical Networks (NGPON)project.
References and Links1. K. Kikushima, H. Yoshinaga, and S. Aoyagi, “Recent FTTH systems and services of NTT in
Japan,” presented at the 8th International Conference on Transparent Optical Networks,Nottingham, UK, June 18–22, 2006.
2. M. Abrams, P. C. Decker, Y. Fujimoto, V. O’Byrne, and D. Piehler, “FTTP deployments in theUnited States and Japan—equipment choices and service provider imperatives,” J.Lightwave Technol. 23, 236–246 (2005).
3. S. Gianordoli, M. Rasztovits-Wiech, A. Stadler, and R. Grabenhorst, “Next generationPON,” in e&i Elektrotechnik und Informationstechnik (Springer Wien, 2006), Vol. 123, pp.78–82.
4. G. Kramer and G. Pesavento, “Ethernet passive optical network (EPON): building anext-generation optical access network,” IEEE Commun. Mag. 40(2), 66–73 (2002).
5. Recommendation G.983.1, “Broadband optical access systems based on passive opticalnetworks” (ITU-T, 2002).
7. IEEE 802.3ah Working Group, “Ethernet in the first mile standard” (IEEE, 2004).8. IEEE 802.3, “Call for interest: 10 Gbps PHY for EPON” (IEEE, 2006), http://
www.ieee802.org/3/cfi/0306_1/cfi_0306_1.pdf.9. D. Mestdagh and C. Martin, “The super-PON concept and its technical challenges,” in
Proceedings of the International IFIP-IEEE Conference on Broadband Communications(IEEE, 1996), pp. 333–344.
10. I. Van de Voorde, C. M. Martin, I. Vandewege, and X. Z. Oiu, “The superPON demonstrator:an exploration of possible evolution paths for optical access networks,” IEEE Commun.Mag. 38(2), 74–82 (2000).
11. A. J. Phillips, J. M. Senior, R. Mercinelli, M. Valvo, P. J. Vetter, C. M. Martin, M. O. VanDeventer, P. Vaes, and X. Z. Qiu, “Redundancy strategies for a high splitting opticallyamplified passive optical network,” J. Lightwave Technol. 19, 137–149 (2001).
12. A. J. Phillips, J. M. Senior, P. J. Vetter, M. O. van Deventer, M. Valvo, and R. Mercinelli,“Reliability of superPON systems,” in IEE Conference on Telecommunications (1998), pp.219–223.
13. J. Santos, J. Pedro, P. Monteiro, and J. Pires, “Long-reach 10 Gbps Ethernet passive opticalnetwork based on a protected ring architecture,” in Optical Fiber CommunicationConference and Exposition and the National Fiber Optics Engineers Conference, OSATechnical Digest (CD) (Optical Society of America, 2008), paper OTuI2.
14. F.-T. An, K. S. Kim, D. Gutierrez, S. Yam, E. Hu, K. Shrikhande, and L. G. Kazovsky,“SUCCESS: a next-generation hybrid WDM/TDM optical access network architecture,” J.Lightwave Technol. 22, 2557–2569 (2004).
15. G. Kramer, B. Mukherjee, and G. Pesavento, “Interleaved polling with adaptive cycle time(IPACT): a dynamic bandwidth distribution scheme in an optical access network,” PhotonicNetwork Commun. 4, 89–107 (2002).
16. C. Assi, Y. Ye, S. Dixit, and M. A. Ali, “Dynamic bandwidth allocation for quality-of-serviceover Ethernet PONs,” IEEE J. Sel. Areas Commun. 21, 1467–1477 (2003).
17. IEEE 802.3, “Status of ITU 984.enhance,” F. Effenberger, Huawei Technologies (IEEE,2007), www.ieee802.org/3/av/public/2007_05/3av_0705_effenberger_3.pdf.
18. G. P. Agrawal, Fiber-Optic Communication Systems (Wiley, 1992).19. Recommendation G.652, “Characteristics of a single-mode optical fibre and cable” (ITU-T,
2005).20. D. Nesset, T. Kelly, S. Appathurai, and R. Davey, “High gain semiconductor optical
amplifiers for extended reach GPON systems,” in Proceedings of the European Conferenceand Exhibition on Optical Communication (2007), paper PD 3.5.
21. M. P. McGarry, M. Maier, and M. Reisslein, “Ethernet PONs: a survey of dynamicbandwidth allocation (DBA) algorithms,” IEEE Commun. Mag. 42(8), S8–S15 (2004).
22. H.-J. Byun, J.-M. Nho, and J.-T. Lim, “Dynamic bandwidth allocation algorithm in Ethernetpassive optical networks,” Electron. Lett. 39, 1001–1002 (2003).
23. Y. Luo and N. Ansari, “Bandwidth allocation for multiservice access on EPONs,” IEEECommun. Mag. 43(2), S16–S21 (2005).
24. S. Yin, Y. Luo, N. Ansari, and T. Wang, “Bandwidth allocation over EPONs: a controllability
Vol. 7, No. 5 / May 2008 / JOURNAL OF OPTICAL NETWORKING 486
perspective,” in Proceedings of Global Telecommunications Conference (2006), paperNXG02-3.
25. G. Kramer, B. Mukherjee, S. Dixit, Y. Ye, and R. Hirth, “Supporting differentiated classes ofservice in Ethernet passive optical networks,” J. Opt. Netw. 1, 280–298 (2002).
26. M. Shreedhar and G. Varghese, “Efficient fair queuing using deficit round robin,” inProceedings of ACM SIGCOMM (ACM, 1995), pp. 231–242.
27. M. Krunz and A. Makowski, “Modelling video traffic using M/G/ input processes: acompromise between Markovian and LRD models,” IEEE J. Sel. Areas Commun. 16,733–748 (1998).
28. W. Willinger, M. S. Taqqu, R. Sherman, and D. V. Wilson, “Self-similarity through high-variability: statistical analysis of Ethernet LAN traffic at the source level,” IEEE/ACMTrans. Netw. 5, 71–86 (1997).
29. K. Claffy, G. Miller, and K. Thompson, “The nature of the beast: recent trafficmeasurements from an Internet backbone,” in Proceedings of INET (1998).