40
Self Service Business Intelligence Keith Burns Data Architect ISV Team, DPE Microsoft Ltd
| Date post: | 01-Jan-2016 |
| Category: |
Documents |
| Upload: | brenda-parks |
| View: | 216 times |
| Download: | 0 times |
Self Service Business Intelligence
Keith BurnsData ArchitectISV Team, DPEMicrosoft Ltd

Session Abstract
The challenge of providing decision makers with meaningful information dates back to the dawn of the computing age. On the one hand the raw data is understood and controlled by the IT department and on the other the business user know what it needs. There are several tools in Office and SQL Server 2008 to facilitate this, so the first part of this session, will show what can be achieved today form reporting to data mining. Microsoft’s have also launched project Gemini which is designed to provide much richer capabilities in this area. The idea is that an Information Worker will be able to get at the data they need by using the office tools they understand to turn this (data) into the information they need. Gemini is still in the early phases of development, so the second part of the session will of necessity be an overview and early look at how it will work and how it fits in with the existing tools.

Agenda
09.45 – 11:00 BI Overview
Reporting Services (Report Builder 2.0)
09.00 - 09.45 Registration
11.00 - 11.15 Break
11.15 - 12.30 DM (cont ... Cloud based DM)
BI Futures (Project Gemini)
12:30 Close
SQL Server 2008 Data Mining & the Excel 2007 DM addin

Today’s BI Reality For Most Organizations
DifficultTo Use
Fragmented
Inflexible
Departmental
Costly
“Foreign” tools inhibit adoption and use
Functionality split across multiple tools
Rigid and unable to change with the business
Narrowly deployed without a complete view
Too costly for broad deployment
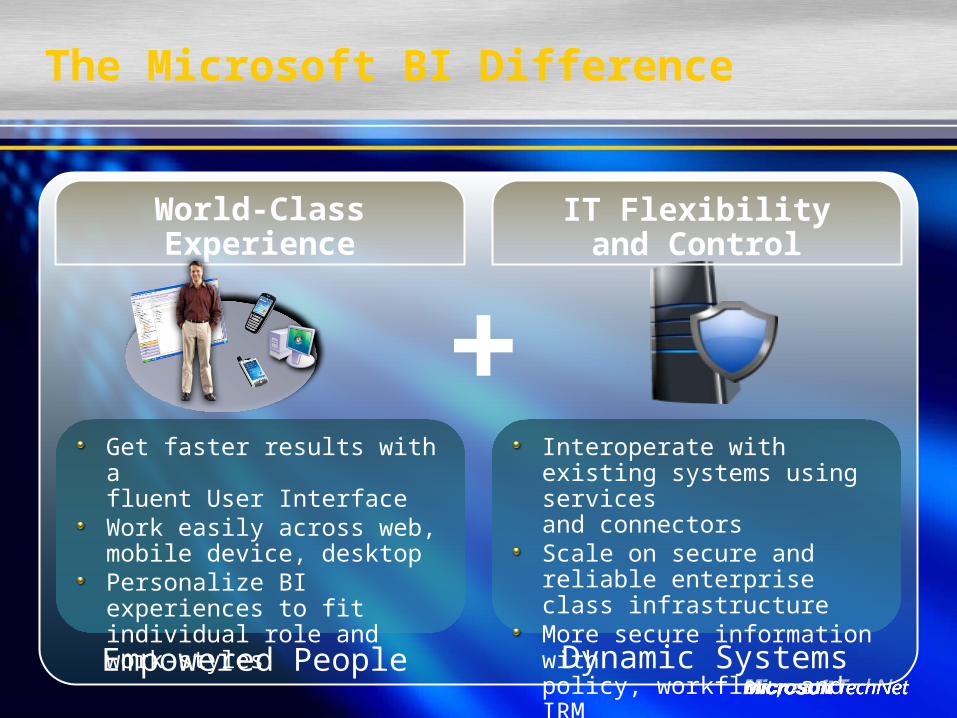
The Microsoft BI Difference
IT Flexibilityand Control
+World-ClassExperience
Empowered People Dynamic Systems
Get faster results with afluent User InterfaceWork easily across web,mobile device, desktopPersonalize BI experiences to fit individual role and work-styles
Interoperate with existing systems using servicesand connectorsScale on secure and reliable enterprise class infrastructureMore secure information withpolicy, workflow, and IRM

AgilityPersonal BI
AccountabilityTeam BI
AlignmentCorporate BI
Delivering The Right BI Tool ForEvery Role In The Organization
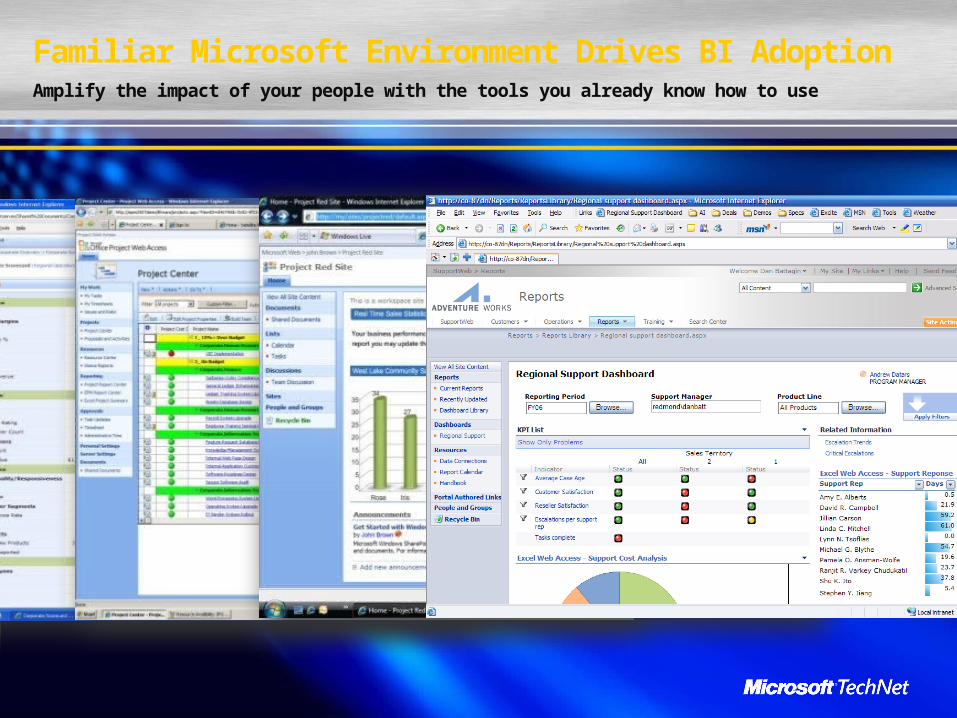
Familiar Microsoft Environment Drives BI Adoption
Amplify the impact of your people with the tools you already know how to use

8
PerformancePoint Server RoadmapPerformance Management is enabled through SharePoint
Analytics
Monitoring
H1 CY10
Planning
Mid CY09
PPSService Pack 3 Supported 10 yrs
SharePoint “14” PerformancePoint
Services
Analytics
Monitoring

END USER TOOLS & PERFORMANCE MANAGEMENT APPS
ExcelPerformancePoint
Server
BI PLATFORM
SQL Server Reporting Services
SQL Server Analysis Services
SQL Server DBMS
SQL Server Integration Services
SharePoint Server
DELIVERY
Reports Dashboards Excel Workbooks
AnalyticViews Scorecards Plans
Integrated End-to-End BI Offering
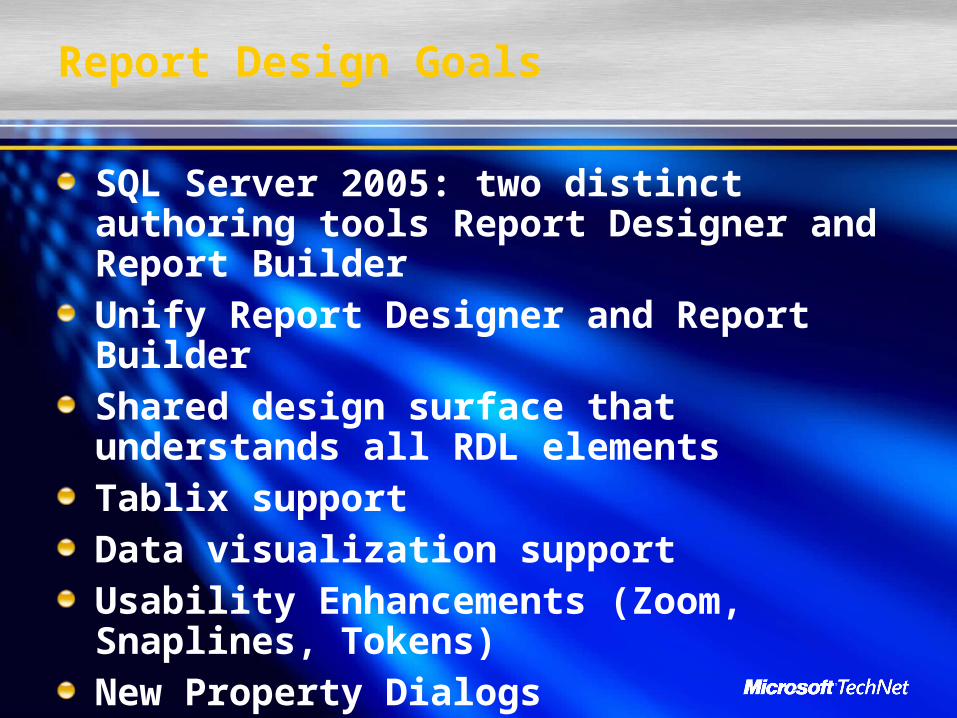
SQL Server 2005: two distinct authoring tools Report Designer and Report BuilderUnify Report Designer and Report BuilderShared design surface that understands all RDL elementsTablix supportData visualization supportUsability Enhancements (Zoom, Snaplines, Tokens)New Property Dialogs
Report Design Goals

Basic Authoring using Report Builder 2.0
Demo

2001 2002 Total
1,115 1,331 2,446
152 642 794
11,156 13,312 24,468
1,523 6,421 7,944
13,946 21,706 35,653
Retail Acme
Nadir, Inc.
Wholesale ABC Corp.
XYZ, Ltd.
Grand Total
Customer
Retail
Acme
Nadir, Inc.
Wholesale
ABC Corp.
XYZ, Ltd.
Grand Total
Growth
19%
322%
19%
322%
56%
Tabl ixe + Matr

Tablix = Best of Both Worlds ++
Matrix plus:Multiple parallel row/column members at each levelEach member may be dynamic or staticOptional omission of member headers
Table plus:Dynamic, nested column groupsMultiple parallel row groupsStatic rowsOptional spanning row headers
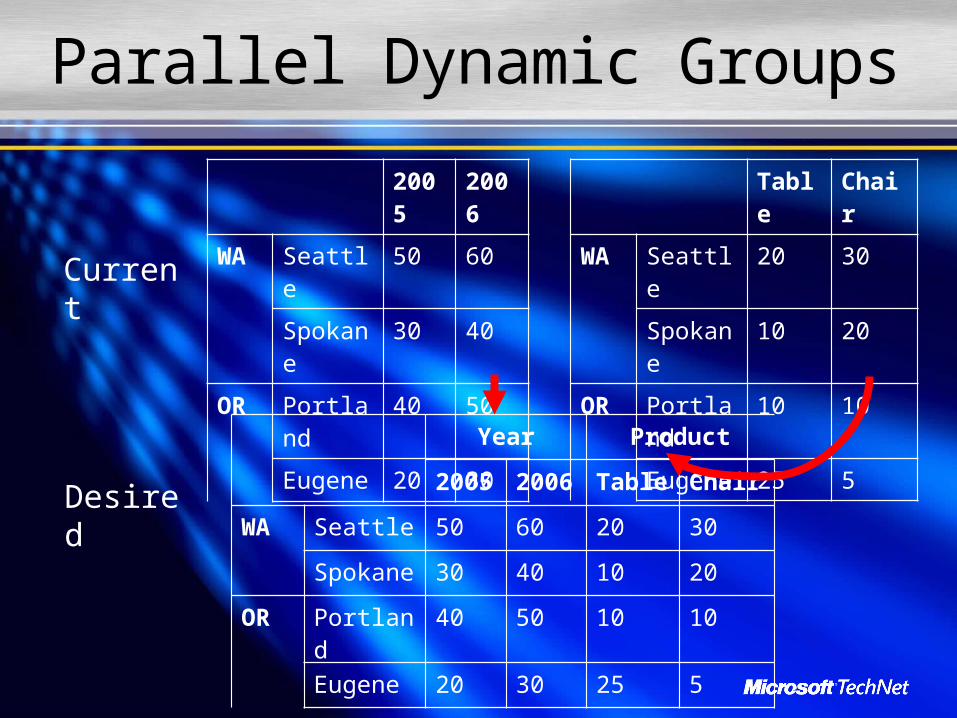
Table Chair
WA Seattle 20 30
Spokane 10 20
OR Portland 10 10
Eugene 25 5
2005 2006
WA Seattle 50 60
Spokane 30 40
OR Portland 40 50
Eugene 20 30
Current
Desired
Year Product
2005 2006 Table Chair
WA Seattle 50 60 20 30
Spokane 30 40 10 20
OR Portland 40 50 10 10
Eugene 20 30 25 5
Parallel Dynamic Groups
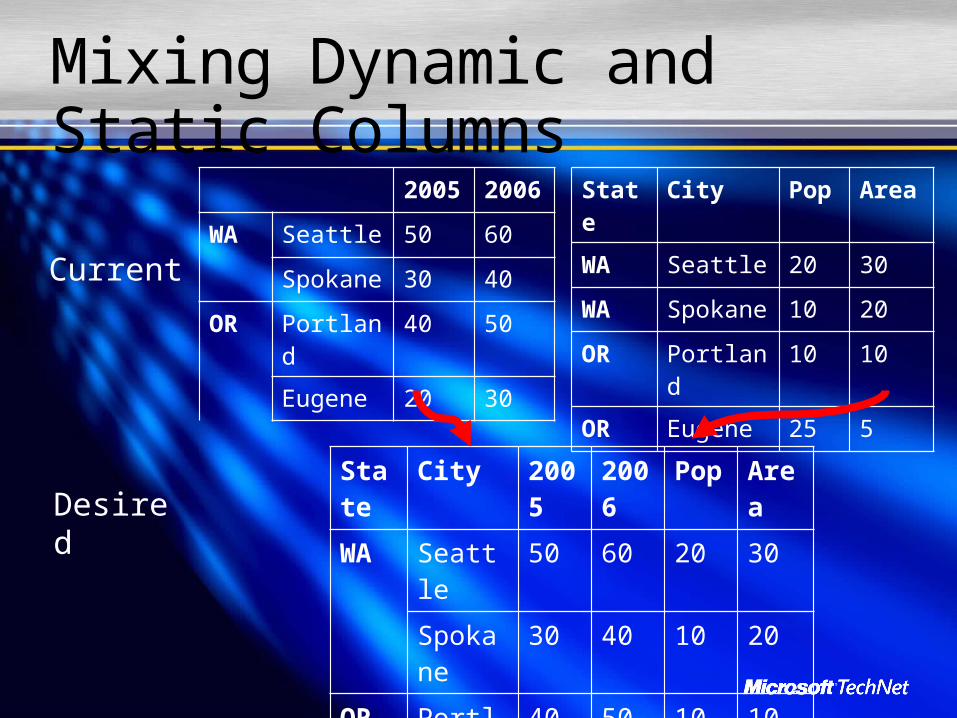
State City Pop Area
WA Seattle 20 30
WA Spokane 10 20
OR Portland 10 10
OR Eugene 25 5
State City 2005 2006 Pop Area
WA Seattle 50 60 20 30
Spokane
30 40 10 20
OR Portland 40 50 10 10
Eugene 20 30 25 5
2005 2006
WA Seattle 50 60
Spokane 30 40
OR Portland 40 50
Eugene 20 30
Current
Desired
Mixing Dynamic and Static Columns

2005 2006
West Total 140 180
Washington Total 80 100
Seattle 50 60
Spokane 30 40
Oregon Total 60 80
Portland 40 50
Eugene 20 30
East Total 200 220
2005 2006
West 140 180Washington 80 100
Seattle 50 60Spokane 30 40
Oregon 60 80Portland 40 50Eugene 20 30
East 200 220
Current Desired
...
...
Hierarchical Rows with Dynamic Headers
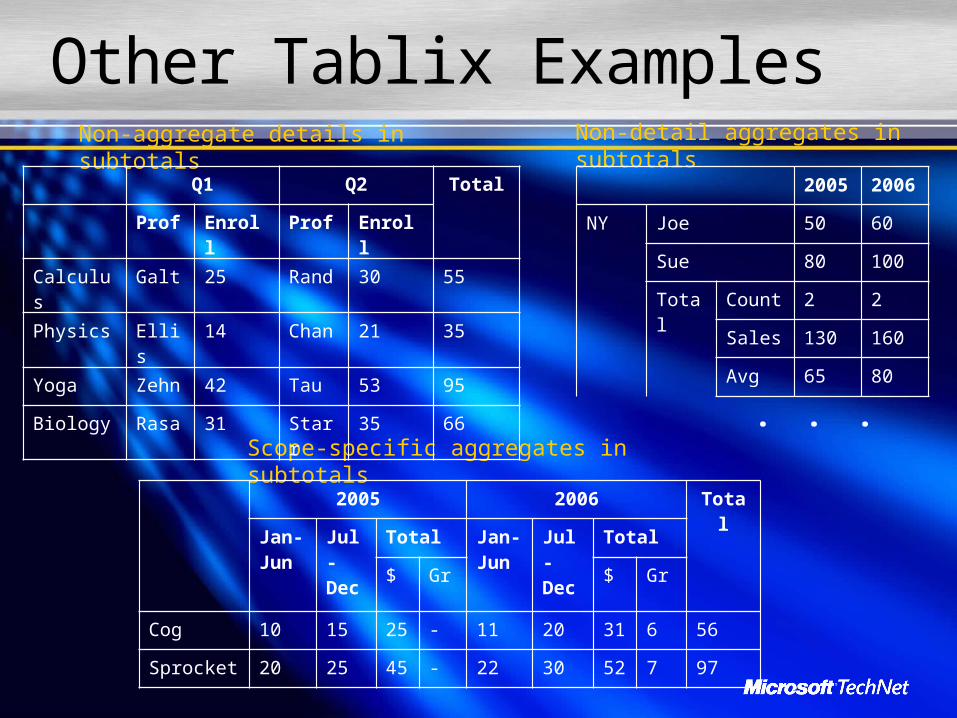
Non-aggregate details in subtotals Non-detail aggregates in subtotals
Scope-specific aggregates in subtotals
Q1 Q2 Total
Prof Enroll Prof Enroll
Calculus Galt 25 Rand 30 55
Physics Ellis 14 Chan 21 35
Yoga Zehn 42 Tau 53 95
Biology Rasa 31 Starr 35 66
2005 2006
NY Joe 50 60
Sue 80 100
Total Count 2 2
Sales 130 160
Avg 65 80
...
2005 2006 Total
Jan-Jun
Jul-Dec
Total Jan-Jun
Jul-Dec
Total
$ Gr $ Gr
Cog 10 15 25 - 11 20 31 6 56
Sprocket 20 25 45 - 22 30 52 7 97
Other Tablix Examples

Tablix
Demo

Data Visualization Improvements
Additional Chart TypesStock, Funnel, Range, Boxplot, Funnel, Pyramid, Pie (Call Out)
Additional Chart FunctionalityMultiple Chart Areas (+ Custom Positioning), Titles and LegendsCalculated SeriesScale BreakSecondary Axis
GaugeLinear and Radial

Chart Examples
Scale Breaks
Frame Effects
Drawing Styles

Chart Examples

Chart Examples
Multiple Chart Areas
Calculated Series
Strip lines
Multiple Legends

Introducing Gauge
Gauge is a new data region in SQL Server Reporting Services 20082 Main Gauge Types
Radial and Linear
ScenariosTypically bound to a single or a few data points (value, target, goal, etc.)Perfect for Analysis Services KPIsStand-alone or embedded in a tablix (bullet graph)
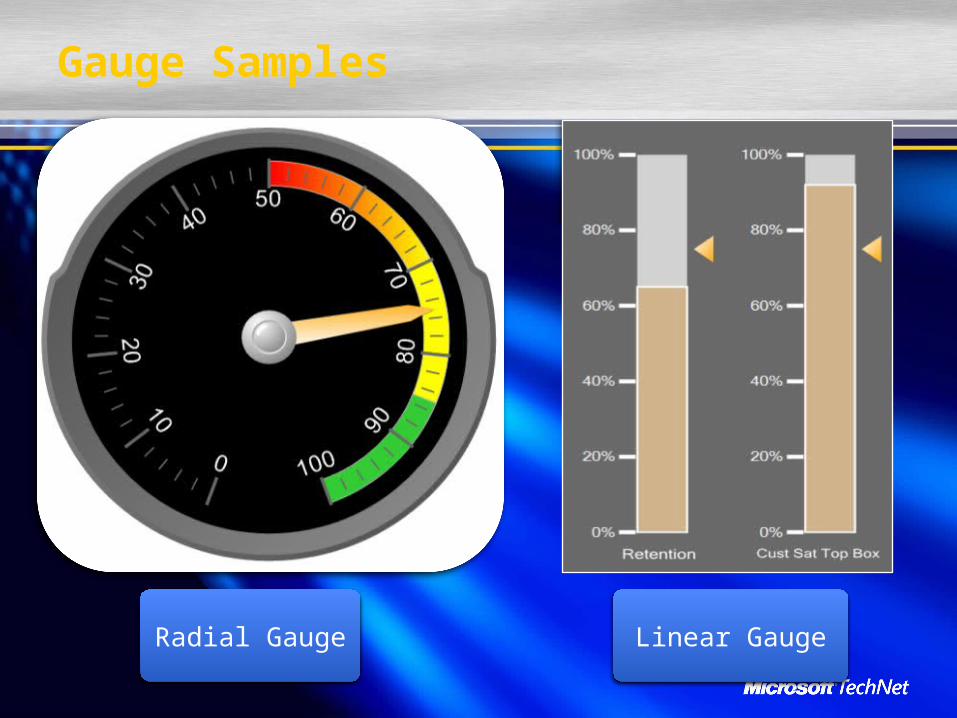
Gauge Samples
Radial Gauge Linear Gauge

Chart and Gauge
Demo

Richly Formatted Text
Mixed formatting in textboxesMail-merge functionality with expression placeholdersParagraphs
Numbered/bulleted listsParagraph alignment
HTML tag-based formattingSupport for complex international scriptsWord DOC export

Report Builder 2.0 will replace Report Builder 1.0 (2005) long termReport Builder support for report models will continue and be enhanced moving forwardReport model technology will continue and be enhanced moving forwardPost-SQL Server 2008: Report Builder 2.0 will encompass all functionality in Report Builder 1.0
Report Builder 2.0 Positioning

Report Designer
ReportBuilder
2.0
Report Builder 1.0
Full RDL SupportShared Layout Surface
Shared Dialogs
Report Models
Office 12 Look & Feel
VS Integration
Integrated Query and LayoutFull Report Model Support
Clickthrough ReportsLimited RDL Support
Feature Comparison

Deployment Summary
Usage Scenario Support Statement
RS 2005 RDL, RS 2000 RDL
• Can publish directly to 2008 Server using Report Manager or SOAP API
• 2005 RDL will be preserved (not upgraded)
Report Designer (2000)
Not supported - cannot deploy reports to a 2008 server
Report Builder 1.0 (in 2005 and 2008)
• Authors 2005 RDLs• Can deploy reports to a 2008 Server
Report Designer (2005)
• Authors 2005 RDLs• Can deploy reports to 2008 Server
Report Designer (2008)
• Will upgrade 2000 and 2005 RDLs to 2008• Authors 2008 RDLs• Deploy to 2008 server only
Report Builder 2.0 (Stand alone)
• Will upgrade 2000 and 2005 RDLs to 2008• Authors 2008 RDLs• Deploy to 2008 server only
VS 2005 Viewer and VS 2008 Viewer
• Can view 2008 server report• 2008 RDLs are not supported in local mode
VS 2005 and VS 2008 RDLC Designer
• Authors SQL 2005 RDLs• Does not support 2008 RDLs

Summary
Author your own reports with Report Builder 2.0Report structures possible with tablixData visualization in SSRS 2008Authoring tools functional comparison

Predictive Analysis withSQL Server 2008
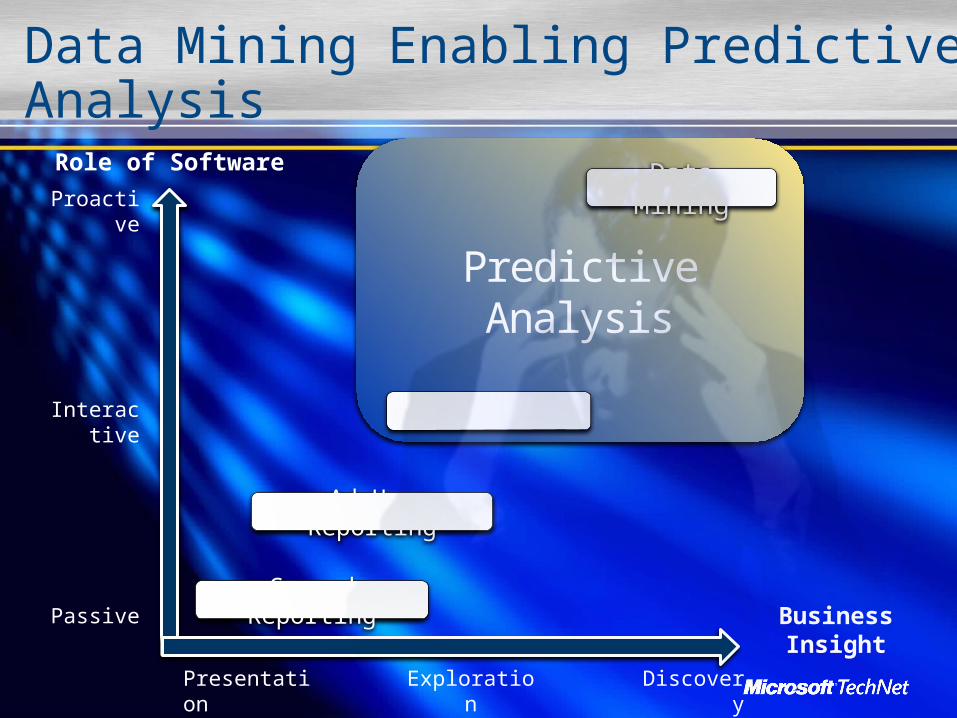
Predictive Analysis
Presentation Exploration Discovery
Passive
Interactive
Proactive
Role of Software
Business Insight
Canned Reporting
Ad-Hoc Reporting
OLAP
Data Mining
Data Mining Enabling Predictive Analysis
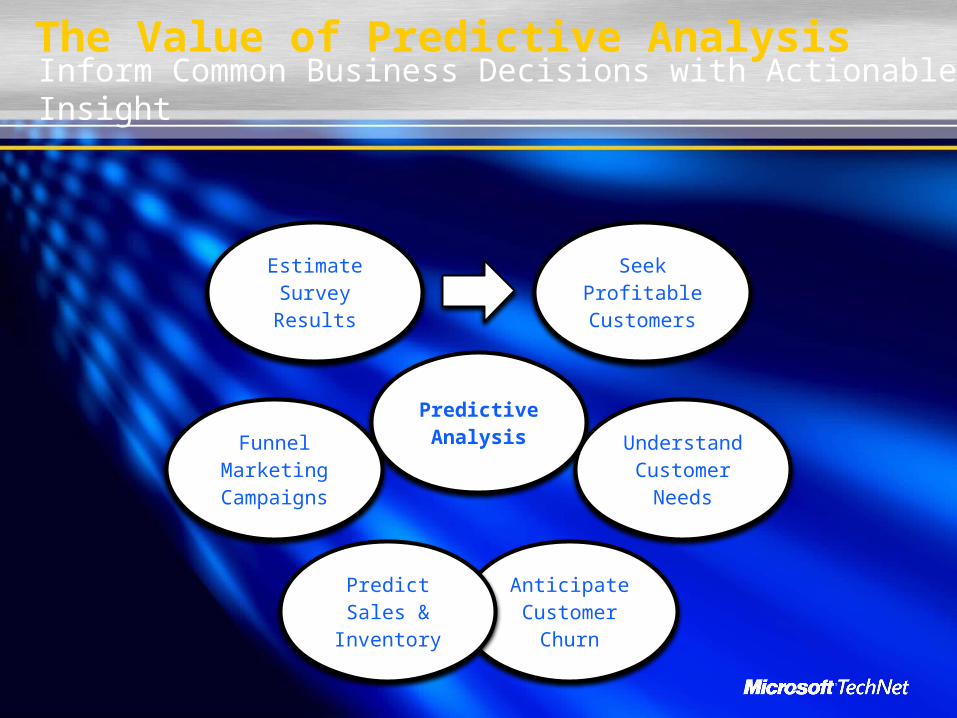
The Value of Predictive Analysis
Predictive Analysis
Seek Profitable Customers
Understand Customer
Needs
Anticipate Customer
Churn
Predict Sales & Inventory
Funnel Marketing Campaigns
Estimate Survey Results
Inform Common Business Decisions with Actionable Insight
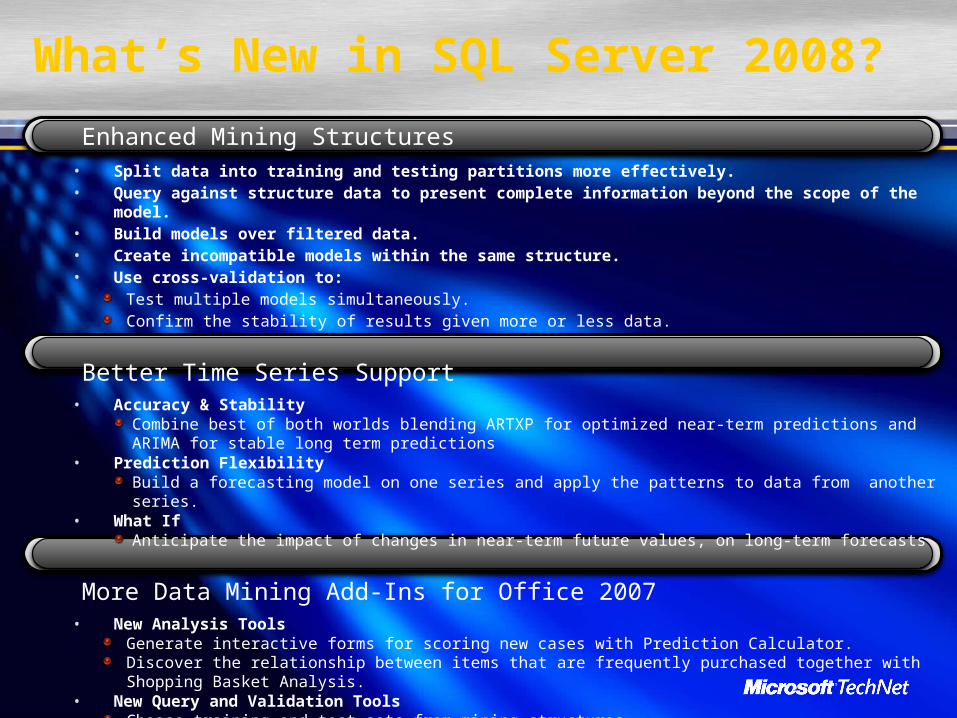
What’s New in SQL Server 2008? Enhanced Mining Structures
• Split data into training and testing partitions more effectively.• Query against structure data to present complete information beyond the scope of the model.• Build models over filtered data.• Create incompatible models within the same structure.• Use cross-validation to:
Test multiple models simultaneously.Confirm the stability of results given more or less data.
Better Time Series Support• Accuracy & Stability
Combine best of both worlds blending ARTXP for optimized near-term predictions and ARIMA for stable long term predictions
• Prediction FlexibilityBuild a forecasting model on one series and apply the patterns to data from another series.
• What IfAnticipate the impact of changes in near-term future values, on long-term forecasts
More Data Mining Add-Ins for Office 2007• New Analysis Tools
Generate interactive forms for scoring new cases with Prediction Calculator.Discover the relationship between items that are frequently purchased together with Shopping Basket Analysis.
• New Query and Validation ToolsChoose training and test sets from mining structures.Render richly formatted cross validation and accuracy reports in Excel.Leverage model documentation for reference and collaboration.

Algorithm Description
Decision Trees Calculates the odds of an outcome based on values in a training set
Association Rules Helps identify relationships between various elements
Naïve Bayes Clearly shows the differences in a particular variable for various data elements
Sequence Clustering Groups or clusters data based on a sequence of previous events
Time Series Analyzes and forecasts time-based data, combining the power of ARIMA for long-term prediction and the power of ARTXP (developed by Microsoft Research) for short-term prediction. Together optimizing prediction accuracy
Neural Nets Seeks to uncover non-intuitive relationships in data
Text Mining Support Analyzes unstructured text data. Support for text mining via the Term Extraction and Term Lookup transformations in SSIS.
Linear Regression Determines the relationship between columns in order to predict an outcome
Logistic Regression Determines the relationship between columns in order to evaluate the probability that a column will contain a specific state
Clustering Identified groups of data records with similar characteristics
Data Mining Algorithms

DIG for Insight at Your Desktop
Define Data
Identify Task
Get Results
“What Microsoft has done is to make data mining available on the desktop to everyone” - David Norris, Associate Analyst, Bloor Research
Data Mining Add-In for Microsoft Office 2007

Data Mining Add-In for Office 2007
Data PreparationExplore, clean, and set up your data for data mining
Data ModelingBuild patterns and trends from data to make predictions
Accuracy and ValidationTest and validate your model
Model Usage & ManagementBrowse, modify, and manage existing mining models that are stored on an instance of Analysis Services
DocumentationTrace your actions as Data Mining Extensions (DMX) statements or as Analysis Services Scripting Language (ASSL).
Full Development Life Cycle within Excel

Excel 2007 Data mining extensions
Demo

Create reports that include prediction
Build reports by using data mining queries as your data source
Access visual prediction Query Builder directly within Report Designer
Generate parameter-driven reports based on predictive probability
For example, present high-risk customersProbability to churn is over 65%
Native Reporting IntegrationIntegrated Predictive Analysis

© 2004 Microsoft Corporation. All rights reserved.This presentation is for informational purposes only. Microsoft makes no warranties, express or implied, in this summary.


