1 SEMI-AUTOMATED CLASSIFICATION OF ZOOPLANKTON BY THE ZOOSCAN SYSTEM: A NETWORK APPROACH. Stemmann, Lars 1 , Ohman, Mark 2 , Picheral, Marc 3 , Gasparini 1 , Stéphane, Pesant 4 , Stéphane, Gorsky, Gabriel 3 1 University Pierre et Marie Curie, FRANCE; [email protected]2 Scripps Institution of Oceanography, UNITED STATES; 3 CNRS-LOV, FRANCE; 4 MARUM, GERMANY; 5 CNRS-LOV, FRANCE ABSTRACT TEXT Using zooplankton data for ecological or modelling studies in global analysis requires homogeneous datasets. The ZooScan (www.zooscan.com) is a laboratory instrument that, in conjunction with free ZooProcess and Plankton Identifier softwares, forms an integrated analysis system for acquisition and classification of digital zooplankton images from preserved zooplankton samples. Digitized objects are detected, enumerated, measured, and classified. A semi- automatic approach is presented here where automated classification of images is followed by manual validation, which allows rapid and accurate classification of zooplankton and abiotic objects. The ZooScan system also provides an efficient mean to reconstruct plankton size spectra from taxonomically well-characterized zooplankton samples. In addition, it permits digital archiving of images in databases accessible to the scientific community and standardization of images from different ZooScans, allowing the construction of combined Learning sets and implementation of comparative studies. The analysis is non-destructive so the samples can be used for other purposes. Laboratory operation with aqueous samples is safe. Cooperative, networked activities over broad geographic scales can be enhanced by database management using, for example, the PANGAEA® data warehouse. The classification method proposed here allows a relatively detailed taxonomic characterization of zooplankton samples and provides a practical compromise between the fully automatic but less accurate and the accurate but time consuming manual classification of zooplankton for ecologically oriented studies or monitoring programs at regional and global scales through networks of users. INTRODUCTION Long-term plankton records are valuable for documenting ecosystem variability and for helping to understand the responses of planktonic communities to natural and human- induced environmental change. Time scale of population response gives good tracking of forcings at interannual or longer time scales. Comparative time series analysis allows understanding fluctuations in time and space on a global or regional basis and may provide opportunities for adaptive management of resources. Comparison of longterm series is the goal of Scientific Committee on Oceanic Research (SCOR) Working Group (WG) 125 activities. More than 60 time series were identified worldwide (http://wg125.net/ ) but the intercomparison is uneasy because of the wide range of acquisition methods and sample treatments used. Recent advances in image processing and pattern recognition of plankton have made it possible to automatically or semi- automatically identify and quantify coarse faunistical compositions. If large changes (e.g. regime shifts, biogeographical changes) in the productivity of the system occur, it is important to recognize them early and send out warnings to fishery and resource managers. The importance of this approach was recognized by SCOR who assigned the task to assess the state of Automatic Visual Plankton Identification to the Working Group 130 (http://www.scor- wg130.net ). HARDWARE The ZooScan is composed of two main waterproof elements that allow safe and easy processing of liquid samples [2]. The base contains a high resolution imaging device and a drainage channel is used for sample recovery (Fig. 1A). The top cover generates even illumination, and houses an optical density reference cell. It lifts upward to allow sample manipulation and the base is hinged to facilitate safe recovery of the sample. Although the ZooScan permits higher scanning resolution than 2400 dpi, the optical pathway through two successive interfaces (air to water, water to glass) presently limits the working resolution to this value. With a pixel resolution of 10.6 µm, the ZooScan is well suited for organisms larger than 200 µm. The ZooScan/Zooprocess system is easy to use for the technical staff, students and scientists. The possibility to calibrate the different ZooScan units and produce
Transcript
1
SEMI-AUTOMATED CLASSIFICATION OF ZOOPLANKTON BY THE ZOOSCAN
2 Scripps Institution of Oceanography, UNITED STATES;
3 CNRS-LOV, FRANCE;
4 MARUM, GERMANY;
5 CNRS-LOV, FRANCE ABSTRACT TEXT Using zooplankton data for ecological or modelling studies in global analysis requires homogeneous datasets. The ZooScan (www.zooscan.com) is a laboratory instrument that, in conjunction with free ZooProcess and Plankton Identifier softwares, forms an integrated analysis system for acquisition and classification of digital zooplankton images from preserved zooplankton samples. Digitized objects are detected, enumerated, measured, and classified. A semi-automatic approach is presented here where automated classification of images is followed by manual validation, which allows rapid and accurate classification of zooplankton and abiotic objects. The ZooScan system also provides an efficient mean to reconstruct plankton size spectra from taxonomically well-characterized zooplankton samples. In addition, it permits digital archiving of images in databases accessible to the scientific community and standardization of images from different ZooScans, allowing the construction of combined Learning sets and implementation of comparative studies. The analysis is non-destructive so the samples can be used for other purposes. Laboratory operation with aqueous samples is safe. Cooperative, networked activities over broad geographic scales can be enhanced by database management using, for example, the PANGAEA® data warehouse. The classification method proposed here allows a relatively detailed taxonomic characterization of zooplankton samples and provides a practical compromise between the fully automatic but less accurate and the accurate but time consuming manual classification of zooplankton for ecologically oriented studies or monitoring programs at regional and global scales through networks of users. INTRODUCTION Long-term plankton records are valuable for documenting ecosystem variability and for helping to understand the responses of planktonic communities to natural and human-induced environmental change. Time scale of population response gives good tracking of forcings at interannual or
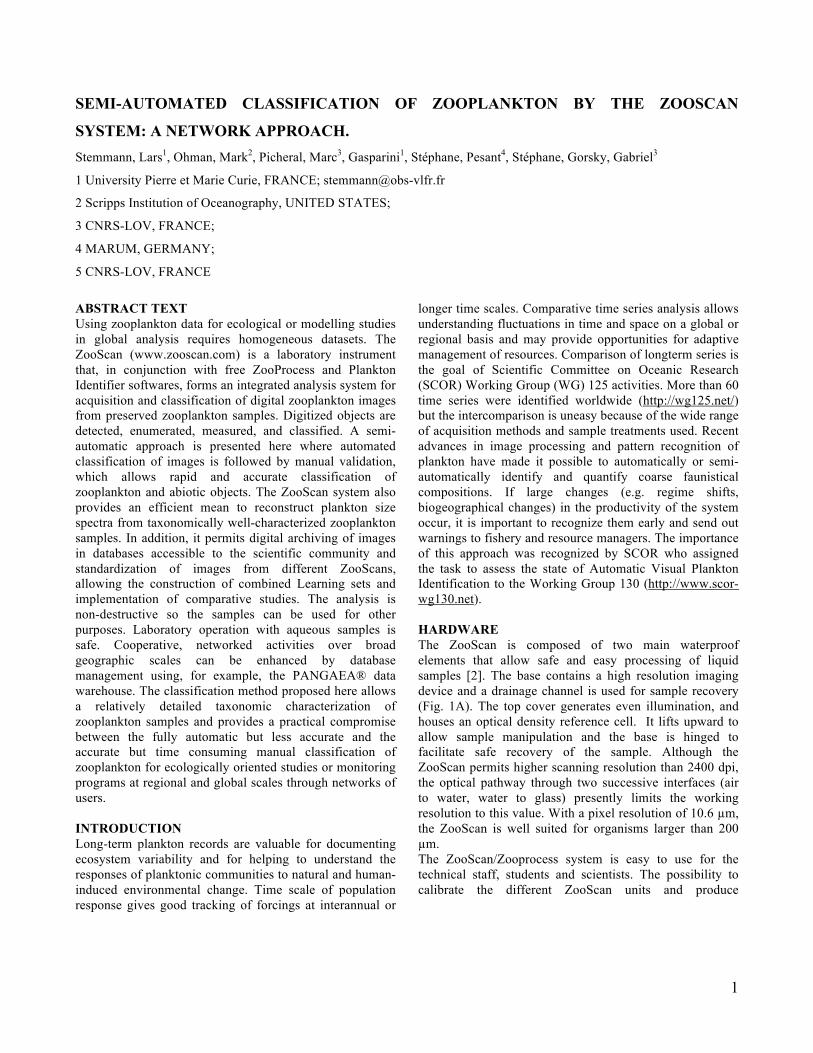
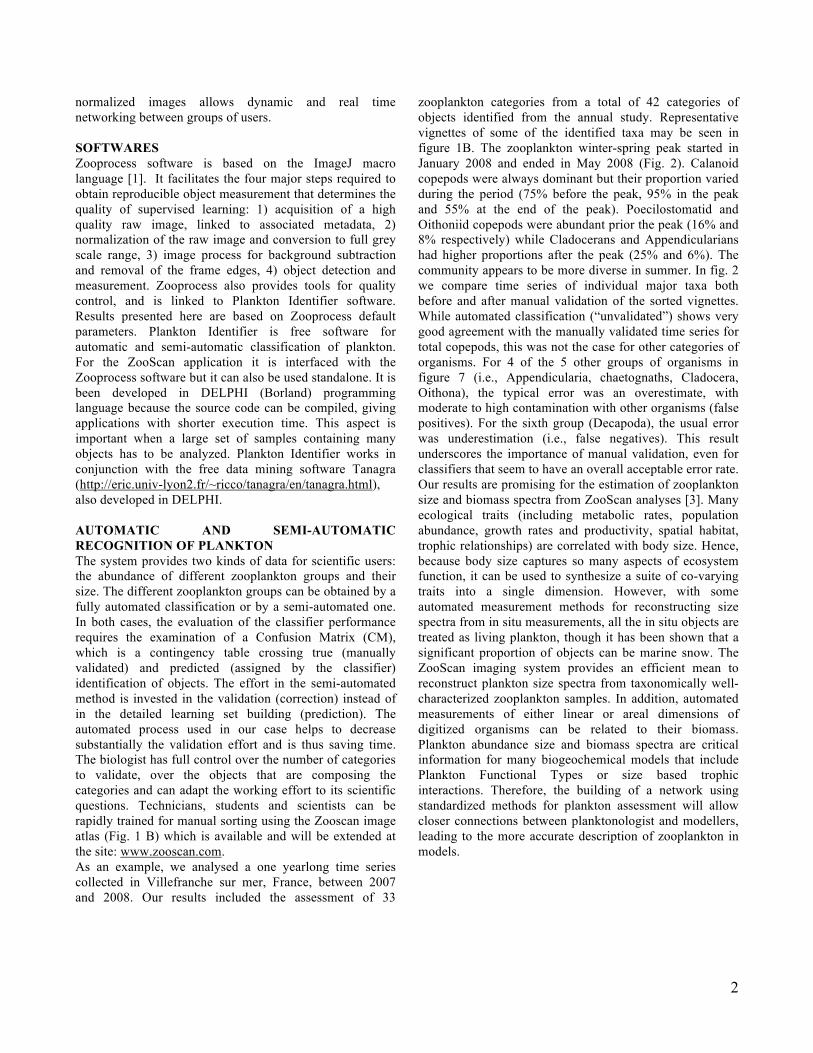
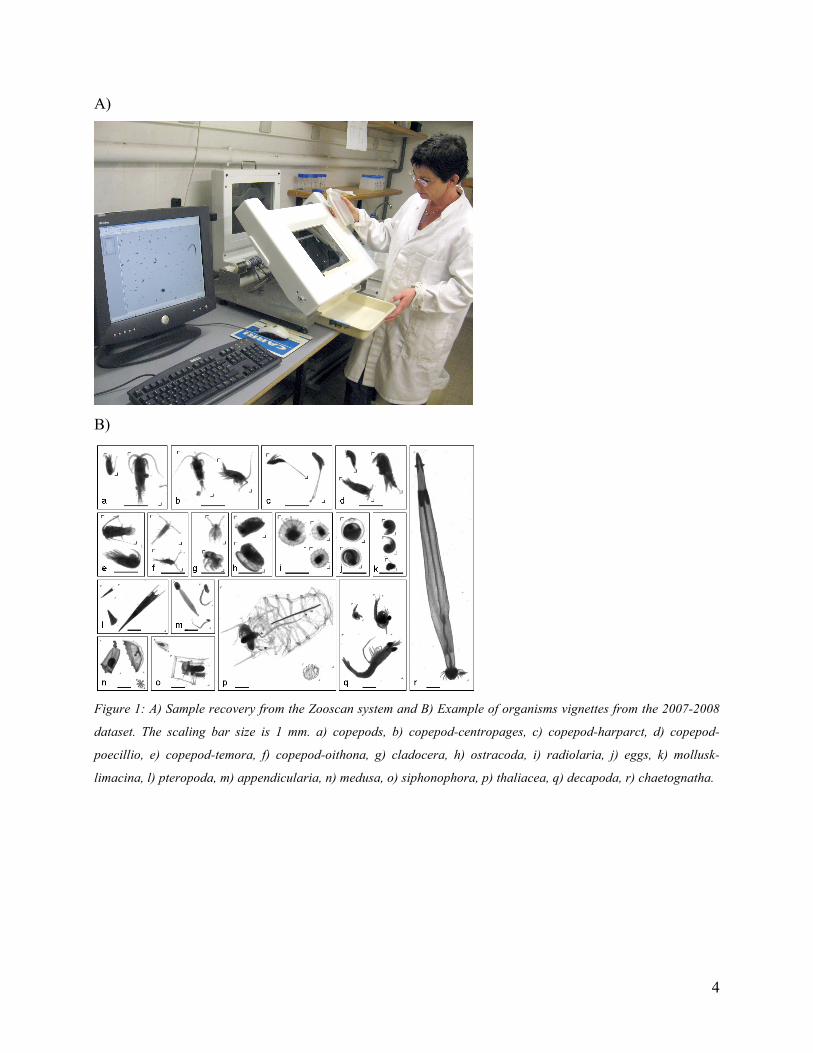
longer time scales. Comparative time series analysis allows understanding fluctuations in time and space on a global or regional basis and may provide opportunities for adaptive management of resources. Comparison of longterm series is the goal of Scientific Committee on Oceanic Research (SCOR) Working Group (WG) 125 activities. More than 60 time series were identified worldwide (http://wg125.net/) but the intercomparison is uneasy because of the wide range of acquisition methods and sample treatments used. Recent advances in image processing and pattern recognition of plankton have made it possible to automatically or semi-automatically identify and quantify coarse faunistical compositions. If large changes (e.g. regime shifts, biogeographical changes) in the productivity of the system occur, it is important to recognize them early and send out warnings to fishery and resource managers. The importance of this approach was recognized by SCOR who assigned the task to assess the state of Automatic Visual Plankton Identification to the Working Group 130 (http://www.scor-wg130.net). HARDWARE The ZooScan is composed of two main waterproof elements that allow safe and easy processing of liquid samples [2]. The base contains a high resolution imaging device and a drainage channel is used for sample recovery (Fig. 1A). The top cover generates even illumination, and houses an optical density reference cell. It lifts upward to allow sample manipulation and the base is hinged to facilitate safe recovery of the sample. Although the ZooScan permits higher scanning resolution than 2400 dpi, the optical pathway through two successive interfaces (air to water, water to glass) presently limits the working resolution to this value. With a pixel resolution of 10.6 µm, the ZooScan is well suited for organisms larger than 200 µm. The ZooScan/Zooprocess system is easy to use for the technical staff, students and scientists. The possibility to calibrate the different ZooScan units and produce
2
normalized images allows dynamic and real time networking between groups of users. SOFTWARES Zooprocess software is based on the ImageJ macro language [1]. It facilitates the four major steps required to obtain reproducible object measurement that determines the quality of supervised learning: 1) acquisition of a high quality raw image, linked to associated metadata, 2) normalization of the raw image and conversion to full grey scale range, 3) image process for background subtraction and removal of the frame edges, 4) object detection and measurement. Zooprocess also provides tools for quality control, and is linked to Plankton Identifier software. Results presented here are based on Zooprocess default parameters. Plankton Identifier is free software for automatic and semi-automatic classification of plankton. For the ZooScan application it is interfaced with the Zooprocess software but it can also be used standalone. It is been developed in DELPHI (Borland) programming language because the source code can be compiled, giving applications with shorter execution time. This aspect is important when a large set of samples containing many objects has to be analyzed. Plankton Identifier works in conjunction with the free data mining software Tanagra (http://eric.univ-lyon2.fr/~ricco/tanagra/en/tanagra.html), also developed in DELPHI. AUTOMATIC AND SEMI-AUTOMATIC RECOGNITION OF PLANKTON The system provides two kinds of data for scientific users: the abundance of different zooplankton groups and their size. The different zooplankton groups can be obtained by a fully automated classification or by a semi-automated one. In both cases, the evaluation of the classifier performance requires the examination of a Confusion Matrix (CM), which is a contingency table crossing true (manually validated) and predicted (assigned by the classifier) identification of objects. The effort in the semi-automated method is invested in the validation (correction) instead of in the detailed learning set building (prediction). The automated process used in our case helps to decrease substantially the validation effort and is thus saving time. The biologist has full control over the number of categories to validate, over the objects that are composing the categories and can adapt the working effort to its scientific questions. Technicians, students and scientists can be rapidly trained for manual sorting using the Zooscan image atlas (Fig. 1 B) which is available and will be extended at the site: www.zooscan.com. As an example, we analysed a one yearlong time series collected in Villefranche sur mer, France, between 2007 and 2008. Our results included the assessment of 33
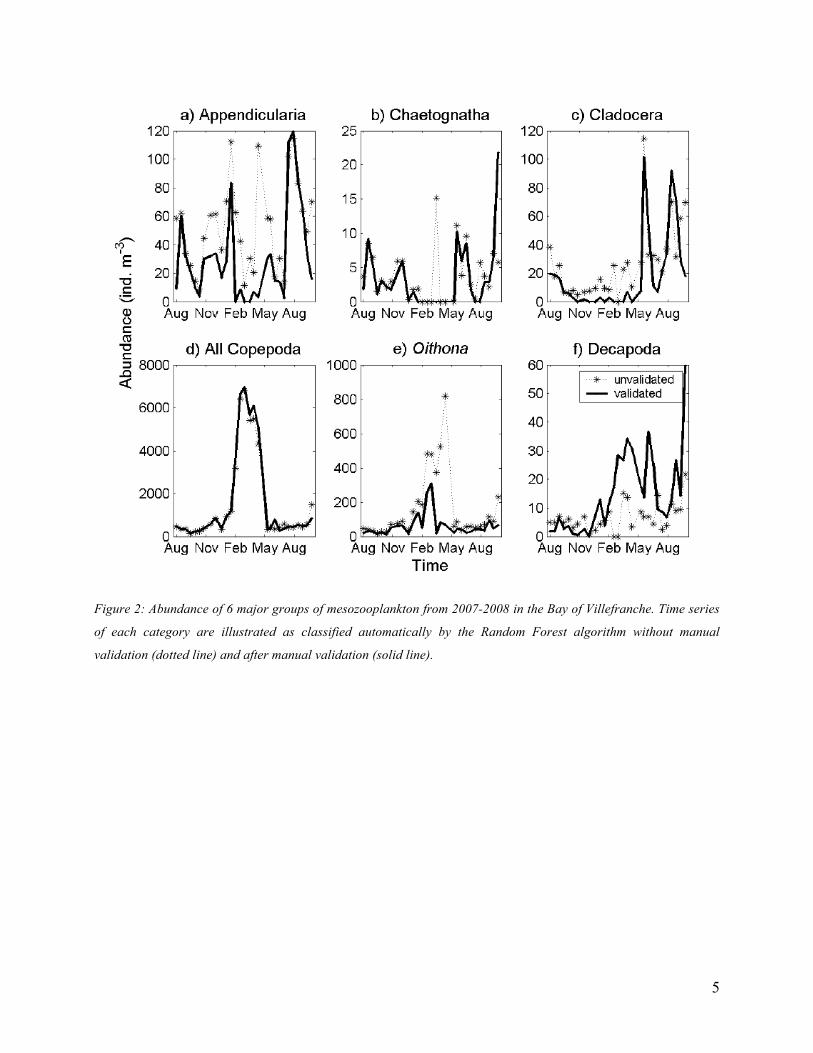
zooplankton categories from a total of 42 categories of objects identified from the annual study. Representative vignettes of some of the identified taxa may be seen in figure 1B. The zooplankton winter-spring peak started in January 2008 and ended in May 2008 (Fig. 2). Calanoid copepods were always dominant but their proportion varied during the period (75% before the peak, 95% in the peak and 55% at the end of the peak). Poecilostomatid and Oithoniid copepods were abundant prior the peak (16% and 8% respectively) while Cladocerans and Appendicularians had higher proportions after the peak (25% and 6%). The community appears to be more diverse in summer. In fig. 2 we compare time series of individual major taxa both before and after manual validation of the sorted vignettes. While automated classification (“unvalidated”) shows very good agreement with the manually validated time series for total copepods, this was not the case for other categories of organisms. For 4 of the 5 other groups of organisms in figure 7 (i.e., Appendicularia, chaetognaths, Cladocera, Oithona), the typical error was an overestimate, with moderate to high contamination with other organisms (false positives). For the sixth group (Decapoda), the usual error was underestimation (i.e., false negatives). This result underscores the importance of manual validation, even for classifiers that seem to have an overall acceptable error rate. Our results are promising for the estimation of zooplankton size and biomass spectra from ZooScan analyses [3]. Many ecological traits (including metabolic rates, population abundance, growth rates and productivity, spatial habitat, trophic relationships) are correlated with body size. Hence, because body size captures so many aspects of ecosystem function, it can be used to synthesize a suite of co-varying traits into a single dimension. However, with some automated measurement methods for reconstructing size spectra from in situ measurements, all the in situ objects are treated as living plankton, though it has been shown that a significant proportion of objects can be marine snow. The ZooScan imaging system provides an efficient mean to reconstruct plankton size spectra from taxonomically well-characterized zooplankton samples. In addition, automated measurements of either linear or areal dimensions of digitized organisms can be related to their biomass. Plankton abundance size and biomass spectra are critical information for many biogeochemical models that include Plankton Functional Types or size based trophic interactions. Therefore, the building of a network using standardized methods for plankton assessment will allow closer connections between planktonologist and modellers, leading to the more accurate description of zooplankton in models.
3
DATA MANAGEMENT Safeguarding ZooScan data and metadata and sharing them in a network requires that these be published in digital libraries such as National and/or World Data Centres (NODCs and/or WDCs) that have the capacity to archive and distribute images and their associated metadata. NODCs such as US-NODC in the USA, SISMER in France, and BODC in the UK are designated by the International Oceanographic Data Exchange programme (IODE) of UNESCO Intergovernmental Oceanographic Commission (IOC), while World Data Centers (WDCs) such as WDC-MARE in Europe, WDC-Oceanography in the U.S.A., Russia, China and Japan are designated by the International Council for Science (ICSU). Part of the data from the annual time series of zooplankton from the Bay of Villefranche-sur-mer, which is presented in the previous section, has been safeguarded at the WDC-MARE and available online by the PANGAEA information system (http://doi.pangaea.de/10.1594/PANGAEA.724540). Access to raw images, log files and data files is password protected, whereas low resolution images, and key variables such as abundances and biovolumes of copepods and total plankton are publicly available. With respect to ZooScan data, it is essential that different instruments are inter-
calibrated and that software configurations are known. In the frameworks of the SESAME EU integrated project and the CIESM’s Zooplankton Indicator program the ZooScan approach is used to build a standardized Mediterranean image bank and a zooplankton experts’ network that we hope will grow beyond the Mediterranean in the near future.
BIBLIOGRAPHY 1. Abramoff, M.D., Magelhaes, P.J. and Ram, S. J.
(2004) Image Processing with ImageJ.Biophotonics Internat., 11, 36-42.
2. Gorsky, G., Ohman, M.D., Cawood, A., Gasparini,S., Picheral, M., Prejger, F., Romagnan, J.-B., Stemmann,L. Digital zooplankton image analysis using the ZooScan integrated analysis system (Journal of Plankton Research accepted)
3. Pieter Vandromme, Lars Stemmann, Carmen Garcia-Comas, Marc Picheral, Steven Colbert, Léo Berline, Jean-Marc Guarini, Jonathan Rault, Éric Benoît and Gaby Gorsky. Zooplankton Size Spectra. Part I: from Data to Models. (Journal of Plankton Research accepted)
4
A)
B)
Figure 1: A) Sample recovery from the Zooscan system and B) Example of organisms vignettes from the 2007-2008
dataset. The scaling bar size is 1 mm. a) copepods, b) copepod-centropages, c) copepod-harparct, d) copepod-