61
Semi-automatic data transfer from Revit to BSim - A rapid and consistent modeling for indoor simulations - Master Thesis Bogdan Alexandru Murariu Aalborg University Building Energy Design

Semi-automatic data transfer fromRevit to BSim
- A rapid and consistent modeling for indoor simulations -
Master Thesis
Bogdan Alexandru Murariu
Aalborg UniversityBuilding Energy Design

Copyright c© Aalborg University 2018
This report it is written and edited using ShareLatex. The software used in the project areRevit, Dynamo, Excel and BSim. Figures and diagrams are created using online diagramcreator LucidChart.
Civil EngineeringAalborg University
Thomas Manns Vej 23http://www.aau.dk
Title:Semi-automatic data transfer from Revitto BSim
Theme:Scientific Theme
Project Period:Fall Semester 2018
Project Group:
Participant(s):Bogdan Alexandru Murariu
Supervisor(s):Rasmus Lund JensenKjeld SvidtTorben Østergård
Copies: 1
Page Numbers: 51
Date of Completion:January 10, 2019
Abstract:
The work on this project is basedon the semi-automatic approach de-veloped by MOE A/S and AAU tocombine Revit with Danish Be18 soft-ware. The project is focused on thechallenges of performing building en-ergy simulations in the design phasewhile using BSim program. The re-port analyses the current practice inthe industry with insights from com-pany MOE and personal experience.With focus only on the geometry in-puts, the BSim structure is described,and with use of Dynamo and Excelthe semi-automation of the modellingis attempted. Dynamo scripts are de-signed to fulfill the task of extractingthe required data from Revit and ex-port to Excel spreadsheet. In Excel var-ious methods are tested to export theinformation in BSim. The final goalis to successfully select spaces in Re-vit and export the geometry informa-tion via Dynamo script to Excel fromwhere it can be exported to BSim, andreconstruct the model.
The content of this report is freely available, but publication (with reference) may only be pursued due to
agreement with the author.


Contents
List of Figures vii
Preface ix
1 Introduction 11.1 Current Practice . . . . . . . . . . . . . . . . . . . . . . . . . . . . . . . 31.2 Problem Formulation . . . . . . . . . . . . . . . . . . . . . . . . . . . . 3
2 BSim 52.1 BSim Structure . . . . . . . . . . . . . . . . . . . . . . . . . . . . . . . . 52.2 Requirements for model geometry . . . . . . . . . . . . . . . . . . . . 8
2.2.1 Geometry hierarchy . . . . . . . . . . . . . . . . . . . . . . . . 9
3 Methodology 113.1 Observing the Situation . . . . . . . . . . . . . . . . . . . . . . . . . . 133.2 Planning the Intervention . . . . . . . . . . . . . . . . . . . . . . . . . 143.3 Prediction of Result . . . . . . . . . . . . . . . . . . . . . . . . . . . . . 163.4 Intervene . . . . . . . . . . . . . . . . . . . . . . . . . . . . . . . . . . . 163.5 Observe Results . . . . . . . . . . . . . . . . . . . . . . . . . . . . . . . 17
4 Dynamo 194.1 Script Design . . . . . . . . . . . . . . . . . . . . . . . . . . . . . . . . 204.2 Data extraction strategies . . . . . . . . . . . . . . . . . . . . . . . . . 22
5 Excel to BSim 275.1 Using the XSD schema . . . . . . . . . . . . . . . . . . . . . . . . . . . 275.2 Visual Basic for Applications . . . . . . . . . . . . . . . . . . . . . . . 28
5.2.1 Using VBA coding with model measurements . . . . . . . . . 285.2.2 Using VBA coding with model coordinates . . . . . . . . . . . 30
6 Conclusion 33
v

vi Contents
Bibliography 35
A BSim 37
B Dynamo 43
C Excel 49

List of Figures
1.1 Communication process . . . . . . . . . . . . . . . . . . . . . . . . . . 21.2 Process overview . . . . . . . . . . . . . . . . . . . . . . . . . . . . . . 21.3 Manual process of creating a BSim Model . . . . . . . . . . . . . . . 3
2.1 SimView user interface . . . . . . . . . . . . . . . . . . . . . . . . . . 62.2 BSim parent-child relationship . . . . . . . . . . . . . . . . . . . . . . 92.3 Visual representation of the main elements that define a Cell (space)
in BSim . . . . . . . . . . . . . . . . . . . . . . . . . . . . . . . . . . . 10
3.1 Kemmis and McTaggart Action Research Spiral (2000) . . . . . . . . 123.2 Action Research Cycle . . . . . . . . . . . . . . . . . . . . . . . . . . . 133.3 Levels of automation formed from the combination of human and
computer performance across four task stages. From Designing forSituation Awareness: An Approach to Human-Centered Design (2nded., p. 185), by M. R. Endsley and D. J. Jones, 2012, Boca Raton, FL:CRC Press. Copyright 2012 by Taylor and Francis Group . . . . . . 14
3.4 Road map of data extraction from Revit to Excel . . . . . . . . . . . 153.5 Road map of data input from Excel to BSim . . . . . . . . . . . . . . 153.6 Work-flow of geometry extraction from Revit to BSim . . . . . . . . 16
4.1 Example of visual programming (ArchSmarter) . . . . . . . . . . . . 194.2 Data type hierarchy and relationships in Dynamo and BSim . . . . 204.3 Geometry and data type hierarchy in Dynamo (Dynamo Primer) . . 204.4 Element properties visualized by using LookUp add-on in Revit . . 214.5 Relation between elements observed with Revit LookUp . . . . . . . 214.6 Road map describing the wrokflow for the Room Method . . . . . . 224.7 Process of collecting topology data in Dynamo script . . . . . . . . . 224.8 Geometrical representation of data extracted using the Room Method
. . . . . . . . . . . . . . . . . . . . . . . . . . . . . . . . . . . . . . . . 234.9 Wall connection in Revit . . . . . . . . . . . . . . . . . . . . . . . . . . 244.10 Road map of data extraction using the Space Method . . . . . . . . 24
vii

viii List of Figures
4.11 Diagram of selecting and extracting data for windows in the SpaceMethod . . . . . . . . . . . . . . . . . . . . . . . . . . . . . . . . . . . 25
4.12 Geometry model in Dynamo as result of data extraction with theSpace Method . . . . . . . . . . . . . . . . . . . . . . . . . . . . . . . . 26
5.1 Example of XSD populated with information in Excel . . . . . . . . 285.2 Example of manually written information in measurements spread-
sheet . . . . . . . . . . . . . . . . . . . . . . . . . . . . . . . . . . . . . 295.3 Data collected by the VBA code from the measurements spreadsheet 295.4 Workflow of data extraction to get required attributes . . . . . . . . 295.5 Example of data imported in Excel using Dynamo . . . . . . . . . . 305.6 Workflow for the second method of exporting data from Excel to
BSim . . . . . . . . . . . . . . . . . . . . . . . . . . . . . . . . . . . . . 315.7 Using Excel formula to extract numbers from a text . . . . . . . . . 31
6.1 Workflow for proposed solution . . . . . . . . . . . . . . . . . . . . . 34
A.1 BSim XML text . . . . . . . . . . . . . . . . . . . . . . . . . . . . . . . 37A.2 BSim XML tree structure . . . . . . . . . . . . . . . . . . . . . . . . . 38A.3 BSim XML tree hierarchy . . . . . . . . . . . . . . . . . . . . . . . . . 39A.4 BSim parent-child hierarchy diagram . . . . . . . . . . . . . . . . . . 40A.5 Graphic representation of XML parent-child relation . . . . . . . . . 41
B.1 Script diagram of export room coordinates from Revit model . . . . 43B.2 Getting room geometry from Revit using Room Method part1 . . . 44B.3 Getting room geometry from Revit using Room Method part2 . . . 44B.4 Getting the wall type from Revit to Excel . . . . . . . . . . . . . . . . 45B.5 Getting the windows from Revit to Excel . . . . . . . . . . . . . . . . 46B.6 Script diagram for the Space Method . . . . . . . . . . . . . . . . . . 47
C.1 XSD structure tree in Excel . . . . . . . . . . . . . . . . . . . . . . . . 49C.2 XSD details of elements . . . . . . . . . . . . . . . . . . . . . . . . . . 50C.3 Excel spreadsheet with geometry coordinates and conversion of string
type data to integer . . . . . . . . . . . . . . . . . . . . . . . . . . . . 50C.4 Building information manually added in Excel (Kim Trangbæk Jøns-
son) . . . . . . . . . . . . . . . . . . . . . . . . . . . . . . . . . . . . . . 51
Preface
This Master Thesis has been written from September 2018 to January 2019 at thefaculty of Engineering and Science at Aalborg University during the 4th semesterof the Building Energy Design program.
Working in a BIM environment has been an interest of mine and I always en-joyed working with Computer-Aided Design (CAD) tools. So choosing a topic thatoffers the opportunity to learn a new program like Dynamo was seen as a chanceto further develop my skills and get an introduction in to the programming envi-ronment.
Therefore, with guidance from the supervisors Rasmus Lund Jensen, KjeldSvidt, and Torben Østergaard, it is decided to investigate the possibility of datatransfer from Revit to BSim and improving the building energy simulation process.
A special gratitude goes to my supervisors Rasmus Lund Jensen, Kjeld Svidt,and Torben Østergaard for their guidance, helpful ideas and their overall inputsthrough out the semester. Moreover I would like to thank Kim Trangbæk Jønssonfor sharing his raw data and advises. I would also like to thank my colleaguesfrom the 2nd semester of Building Informatic for sharing their knowledge , andJohn Ellingsgaard for commenting on the work.
Aalborg University, January 10, 2019
Bogdan Alexandru Murariu<[email protected]>
ix


Chapter 1
Introduction
The focus on more energy efficient construction raises,and so does the need onmore accurate energy analysis of the building in the early stages of the project [14].
The standard in modern building design is to use a model-based approach fordesigning, refining and optimizing building energy systems[8].
Traditionally the preparation for building performance simulation (BPS) startsonly after architectural and HVAC design have progressed sufficiently to provideenough information to represent the building.
This means that by the time a simulation and analysis about the energy perfor-mance is performed, some fundamental design decisions have already been made.Decisions that might turn out to be critical for the energy performance of the futurebuilding[1].
The accuracy of simulation depends significantly on the correct representa-tion of the building geometry. The geometry is commonly being generated bya Building Information Model (BIM) authoring tool according to an architecturalperspective, in this project Revit is used. That geometry must be altered for en-ergy performance simulation tasks and used in simulation software, and in thisproject BSim is being used.[2]. Further in this report any mentioning of simulationsoftware will refer strictly to BSim.
1
2 Chapter 1. Introduction
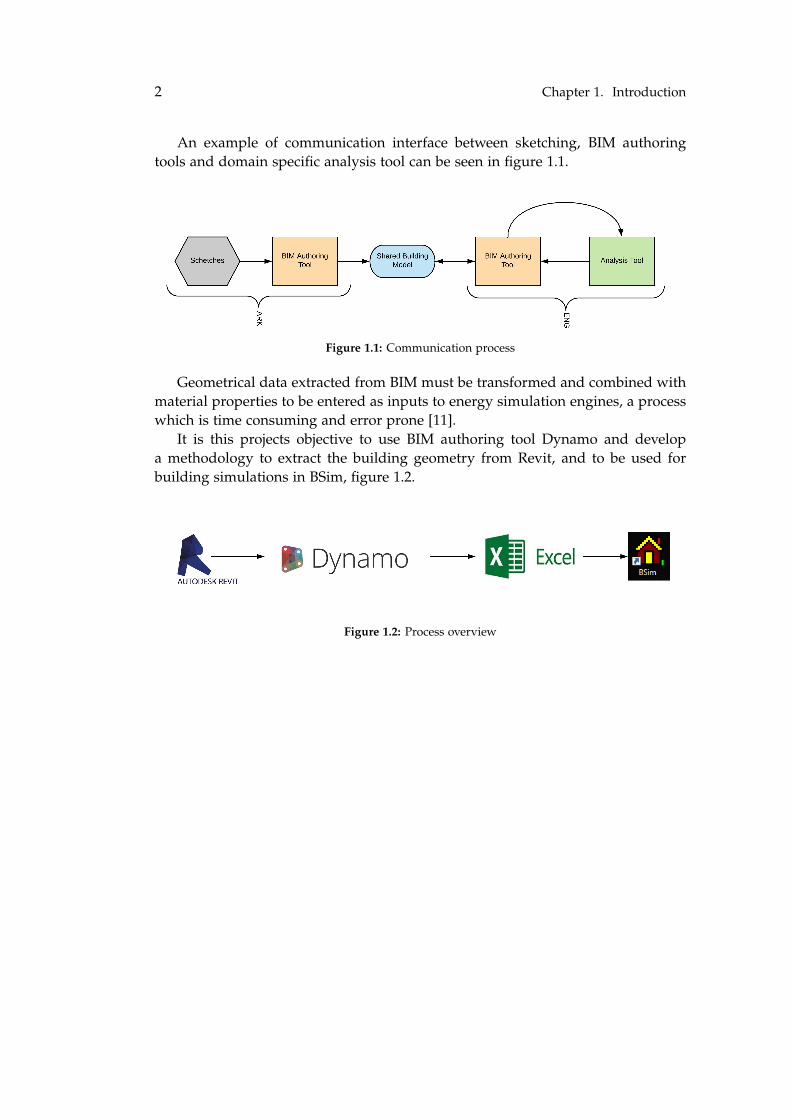
An example of communication interface between sketching, BIM authoringtools and domain specific analysis tool can be seen in figure 1.1.
Figure 1.1: Communication process
Geometrical data extracted from BIM must be transformed and combined withmaterial properties to be entered as inputs to energy simulation engines, a processwhich is time consuming and error prone [11].
It is this projects objective to use BIM authoring tool Dynamo and developa methodology to extract the building geometry from Revit, and to be used forbuilding simulations in BSim, figure 1.2.
Figure 1.2: Process overview
1.1. Current Practice 3
1.1 Current Practice
Building energy simulation is currently being practiced as a combination of scienceand skill. The basis of science can be seen in the simulation algorithms, and in thelevel of building information detail required as input to these algorithms. The skillcomes in to play in the current process of collecting building information from avariety of sources and manually transforming this information into specific inputrequired by BSim [17].
This skill translates in to methods and rule-of-thumb developed over time bythe specialist. But while based on professional expertise, the results can vary fromone modeler to the next, even given the same initial building design information[1].
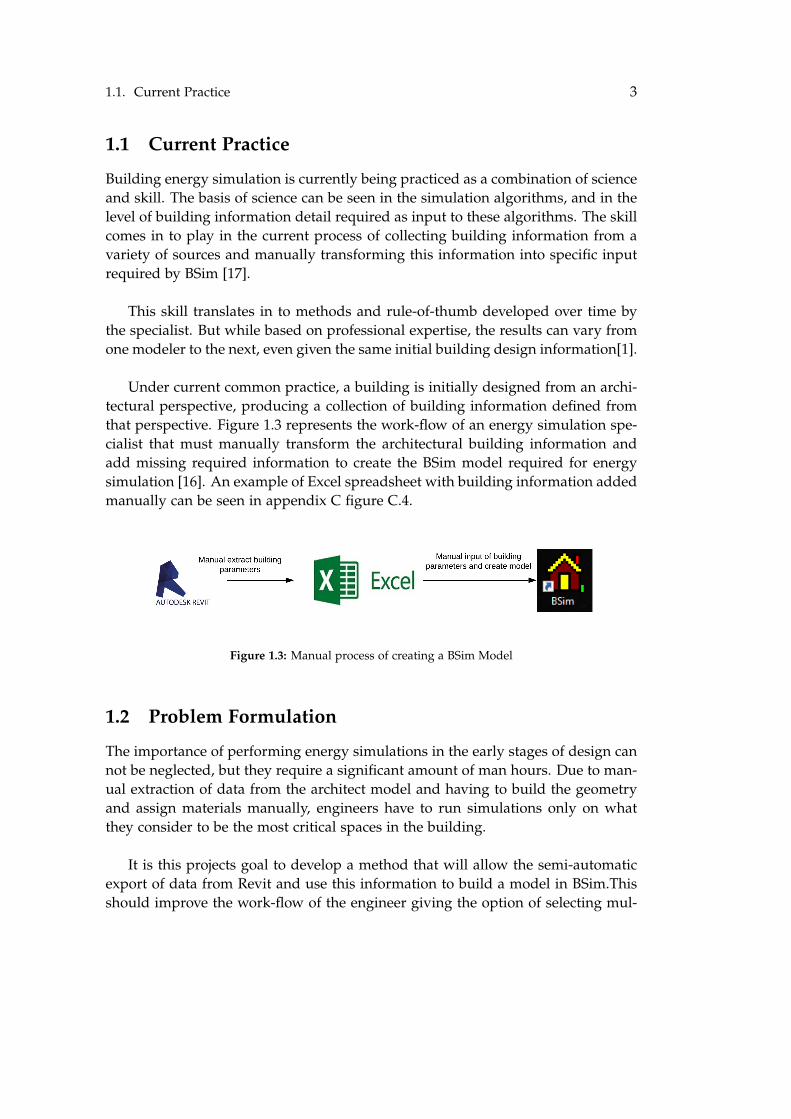
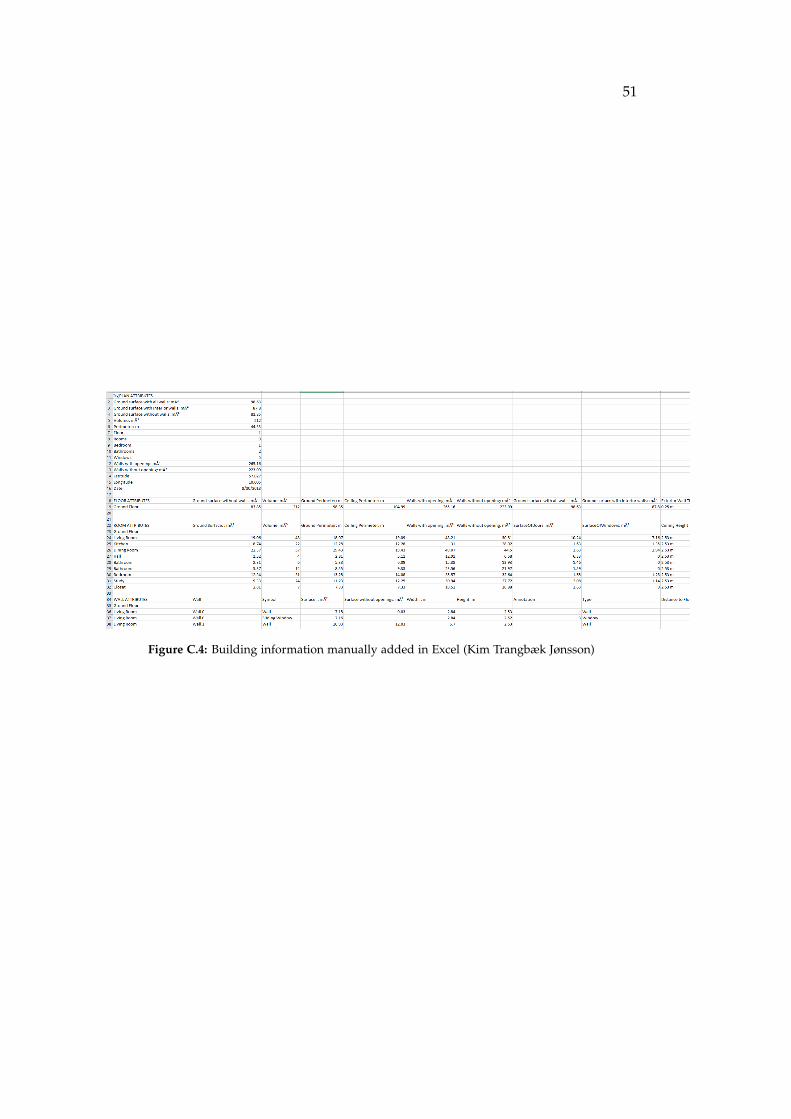
Under current common practice, a building is initially designed from an archi-tectural perspective, producing a collection of building information defined fromthat perspective. Figure 1.3 represents the work-flow of an energy simulation spe-cialist that must manually transform the architectural building information andadd missing required information to create the BSim model required for energysimulation [16]. An example of Excel spreadsheet with building information addedmanually can be seen in appendix C figure C.4.
Figure 1.3: Manual process of creating a BSim Model
1.2 Problem Formulation
The importance of performing energy simulations in the early stages of design cannot be neglected, but they require a significant amount of man hours. Due to man-ual extraction of data from the architect model and having to build the geometryand assign materials manually, engineers have to run simulations only on whatthey consider to be the most critical spaces in the building.
It is this projects goal to develop a method that will allow the semi-automaticexport of data from Revit and use this information to build a model in BSim.Thisshould improve the work-flow of the engineer giving the option of selecting mul-

4 Chapter 1. Introduction
tiple spaces and perform more precise simulations.
Problem formulation:How can the correct definition of a model space boundaries improve the qual-
ity of data exported from Revit and allow the building energy simulation on astochastic method?

Chapter 2
BSim
BSim provides user-friendly detailed hygrothermal simulation of buildings andconstructions. This program is typically used to perform analyses on room level,but can be used for entire buildings if needed.
The high level of detail in the calculations places correspondingly greater de-mands on the degree of detail of the inputs to the model.
BSim has been used extensively over the past 20 years, previously under thename tsbi3.
Today BSim is the most commonly used tool in Denmark, and with increasinginterest abroad, for energy design of buildings and moisture analysis[6].
2.1 BSim Structure
The program is composed of several modules:
• SimView - Graphic Editor
• tsbi5 - Building Simulation
• SimLight - Daylight
• XSun - Direct Sunlight and Shadowing
• SimPV - Photovoltaic power
• NatVent - Natural Ventilation
• SimDxf - Import from CAD
5
6 Chapter 2. BSim
Because this project is focused on extracting the geometry information fromRevit, only the SimView module will be described.
The modules in BSim are built around SimView which is the central programand the user interface.
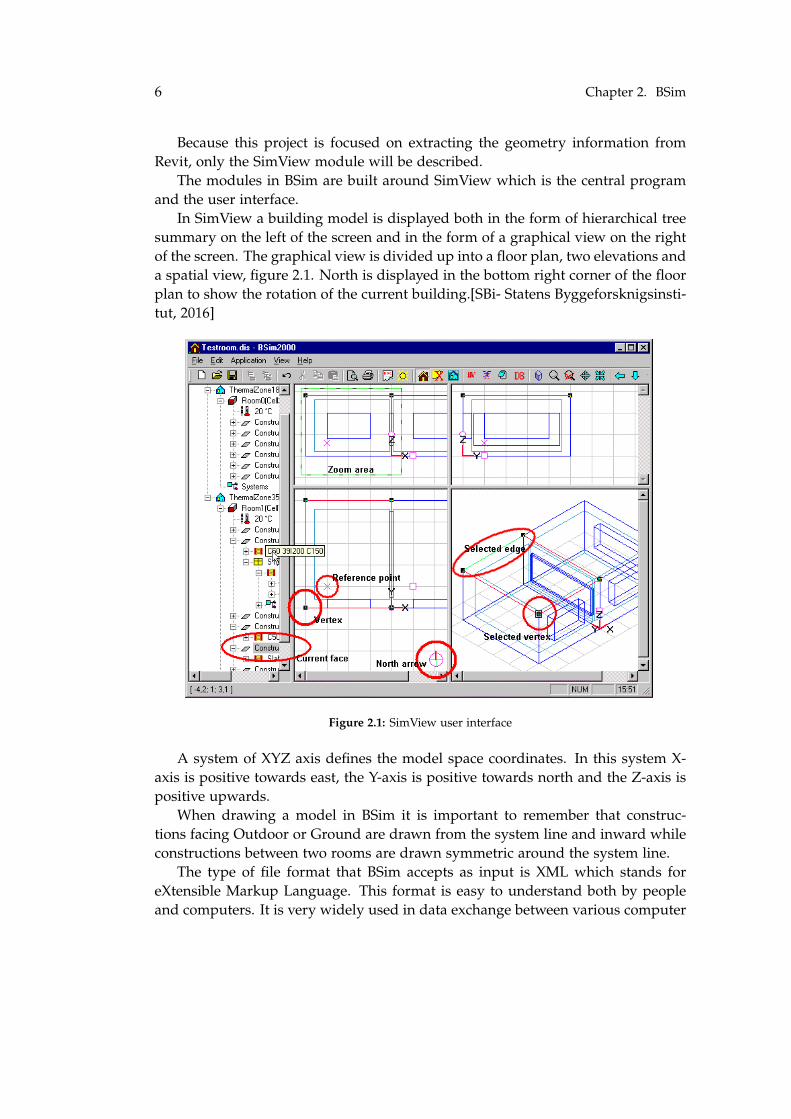
In SimView a building model is displayed both in the form of hierarchical treesummary on the left of the screen and in the form of a graphical view on the rightof the screen. The graphical view is divided up into a floor plan, two elevations anda spatial view, figure 2.1. North is displayed in the bottom right corner of the floorplan to show the rotation of the current building.[SBi- Statens Byggeforsknigsinsti-tut, 2016]
Figure 2.1: SimView user interface
A system of XYZ axis defines the model space coordinates. In this system X-axis is positive towards east, the Y-axis is positive towards north and the Z-axis ispositive upwards.
When drawing a model in BSim it is important to remember that construc-tions facing Outdoor or Ground are drawn from the system line and inward whileconstructions between two rooms are drawn symmetric around the system line.
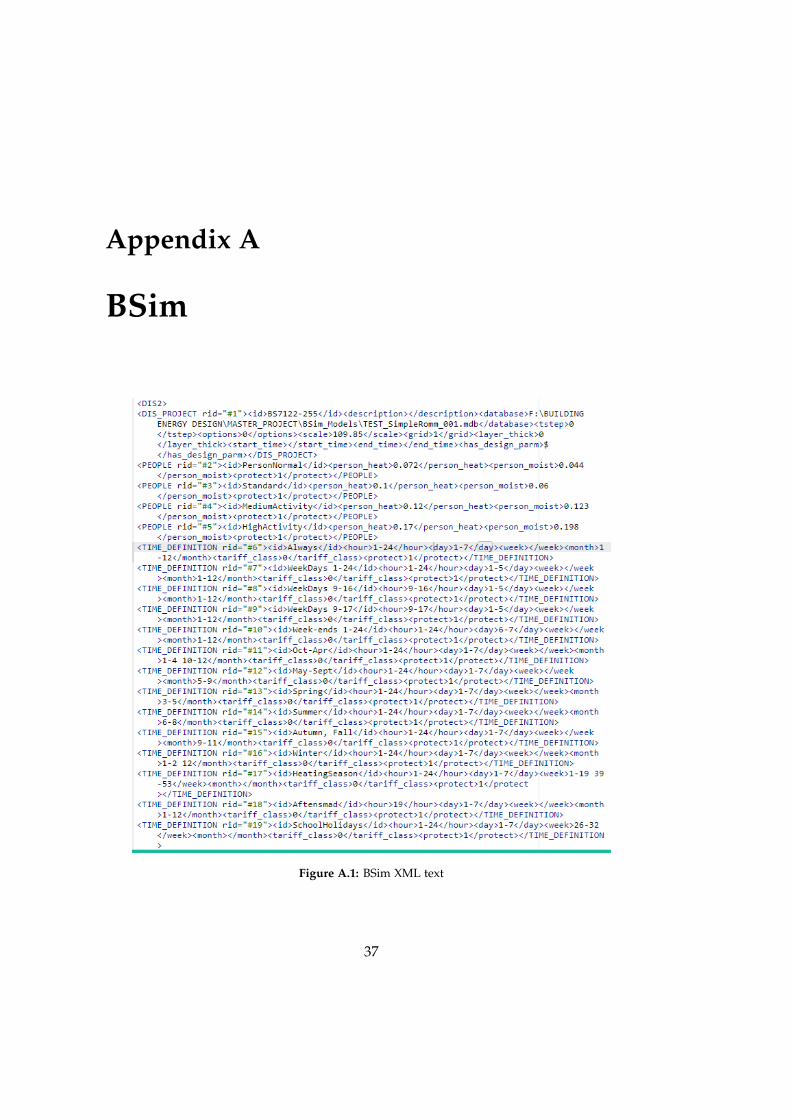
The type of file format that BSim accepts as input is XML which stands foreXtensible Markup Language. This format is easy to understand both by peopleand computers. It is very widely used in data exchange between various computer

2.1. BSim Structure 7
software due to its excellent capability to contain information. An example of XMLcode from BSim can be seen in appendix A figure A.1.
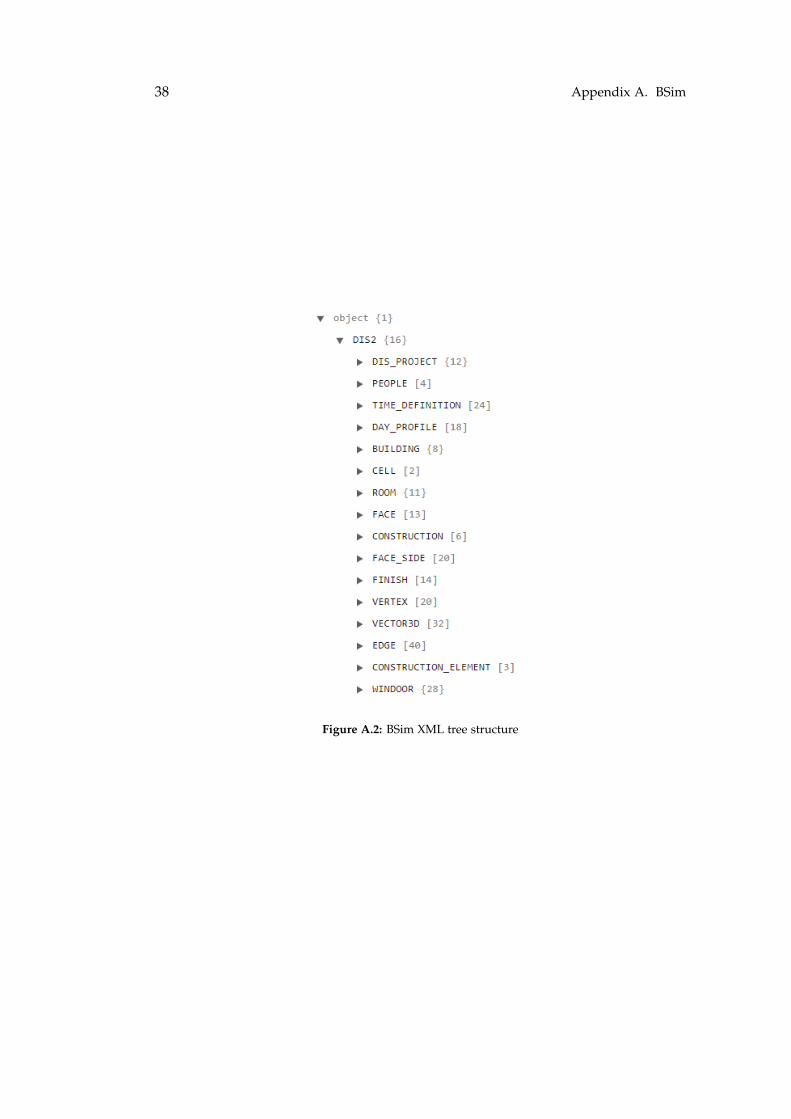
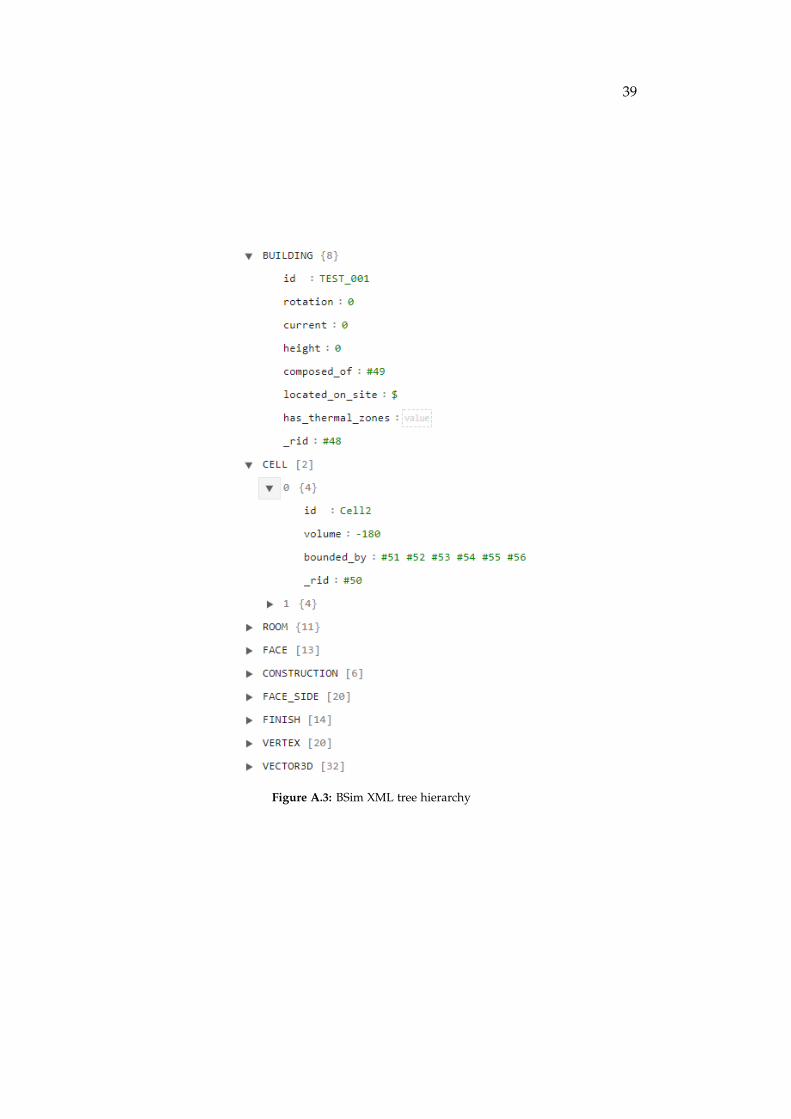
Although as a limitation the format is only able to describe hierarchical rela-tionships, appendix A figures A.2 and A.3.
8 Chapter 2. BSim
2.2 Requirements for model geometry
A Revit model element contains a multitude of parameters, but not all of them arenecessary to build a BSim model.To create an output file from BSim it is requireda specific information for geometry of the building, and the type of construction.General information about the rooms such as room name and/or number are alsonecessary for easier identification. This geometry requirements refers to the build-ing envelope.
The geometry of a BSim model is made up of 9 elements:
• Vector3D - is a point defined by xyz coordinates and it defines the location ofthe vertices.
• Vertex- it contains the Vector3D and defines all exported geometry.
• Edge - an element defined by two vertices.
• Face - an element defined by 3 or more edges. This elements include wallsand storey partitions. The specific location of the object in relation to thebuilding element depends on the type and location of the element.
• Windoor - an object defined by four edges and it includes windows anddoors.
• Face-Side - is one of the two sides of the face. It can face outside or one ofthe Cell(inside).
• Cell - it is defined by several face-sides. Typically 4 walls, ceiling and floor.
• Room - it is represented by a Cell.
• Construction - it describes an element represented by a Face. It has an IDwhich is linked to a specific construction type from BSim database.
2.2. Requirements for model geometry 9
2.2.1 Geometry hierarchy
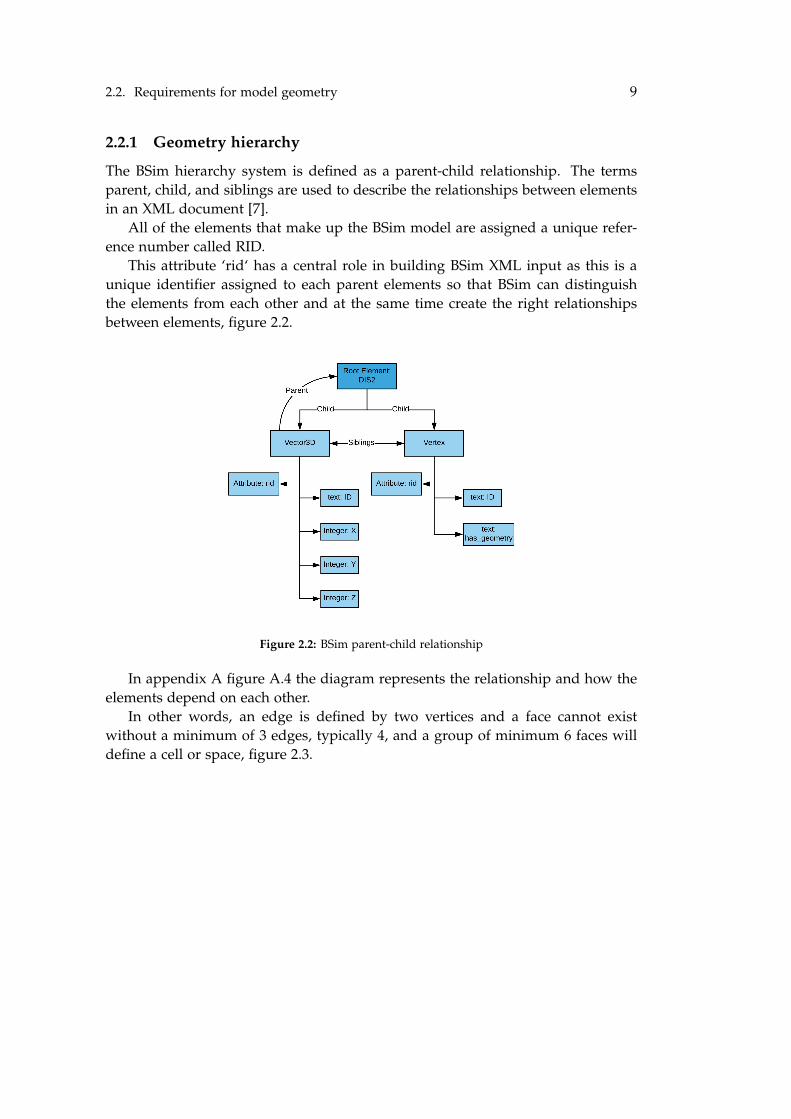
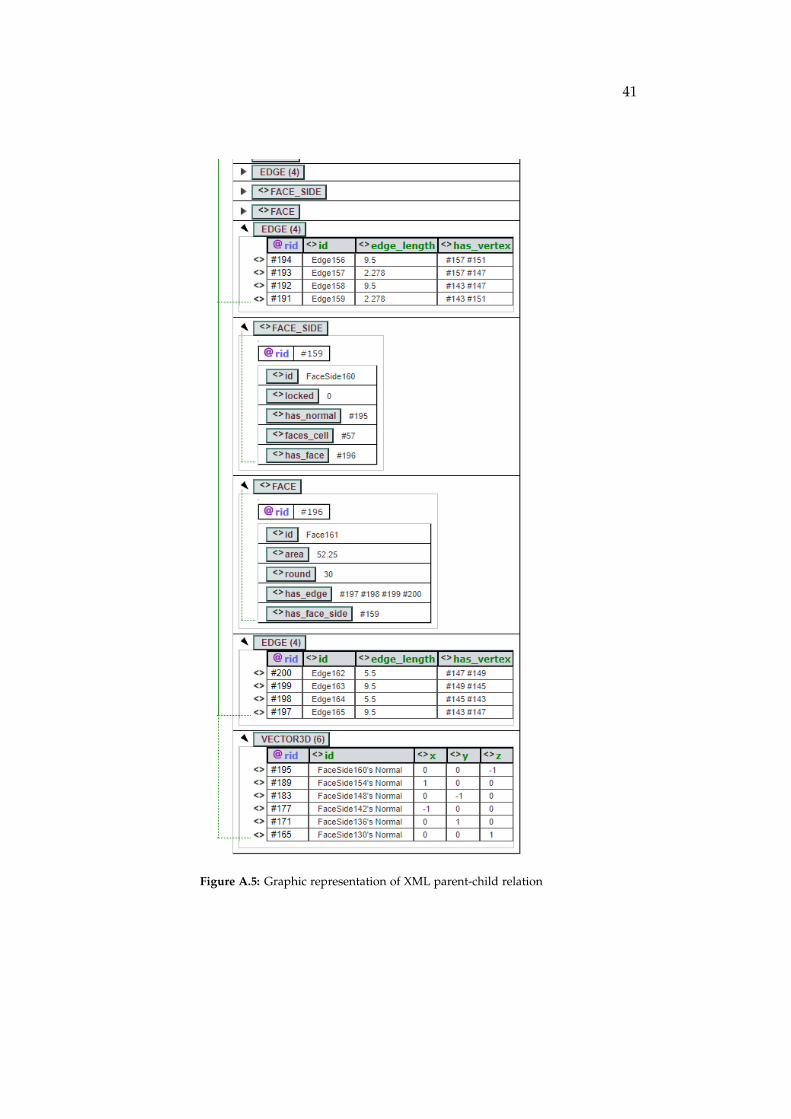
The BSim hierarchy system is defined as a parent-child relationship. The termsparent, child, and siblings are used to describe the relationships between elementsin an XML document [7].
All of the elements that make up the BSim model are assigned a unique refer-ence number called RID.
This attribute ‘rid‘ has a central role in building BSim XML input as this is aunique identifier assigned to each parent elements so that BSim can distinguishthe elements from each other and at the same time create the right relationshipsbetween elements, figure 2.2.
Figure 2.2: BSim parent-child relationship
In appendix A figure A.4 the diagram represents the relationship and how theelements depend on each other.
In other words, an edge is defined by two vertices and a face cannot existwithout a minimum of 3 edges, typically 4, and a group of minimum 6 faces willdefine a cell or space, figure 2.3.

10 Chapter 2. BSim
Figure 2.3: Visual representation of the main elements that define a Cell (space) in BSim
Chapter 3
Methodology
The work that has been done on this project is based on the Action ResearchMethodology.
Action research can be defined as an approach in which the action researcherand a client collaborate in the diagnosis of the problem and in the development ofa solution based on the diagnosis[3]. In other words, one of the main characteristictraits of action research relates to collaboration between researcher and member oforganization in order to solve organizational problems.
In this specific case, the researcher is represented by the student that is theauthor of this report, and the member of the organization will be the companyrepresentative Torben Østergaard, since he is representing the industry.
When using action research method, the following features need to be taken into account:[9]
• It is applied in order to improve specific practices. Action research is basedon action, evaluation and critical analysis of practices based on collected datain order to introduce improvements in relevant practices.
• This type of research is facilitated by participation and collaboration of anumber of individuals with common purpose.
• Such research focuses on specific situations and their context.
11

12 Chapter 3. Methodology
Figure 3.1 represents the process of action study following self-reflective cy-cles:[9]
• Planning in order to initiate change
• Implementing the change (acting) and observing the process of implementa-tion and consequences
• Reflecting on process of change and re-planning
• Acting and observing
• Reflecting
Figure 3.1: Kemmis and McTaggart Action Research Spiral (2000)
3.1. Observing the Situation 13
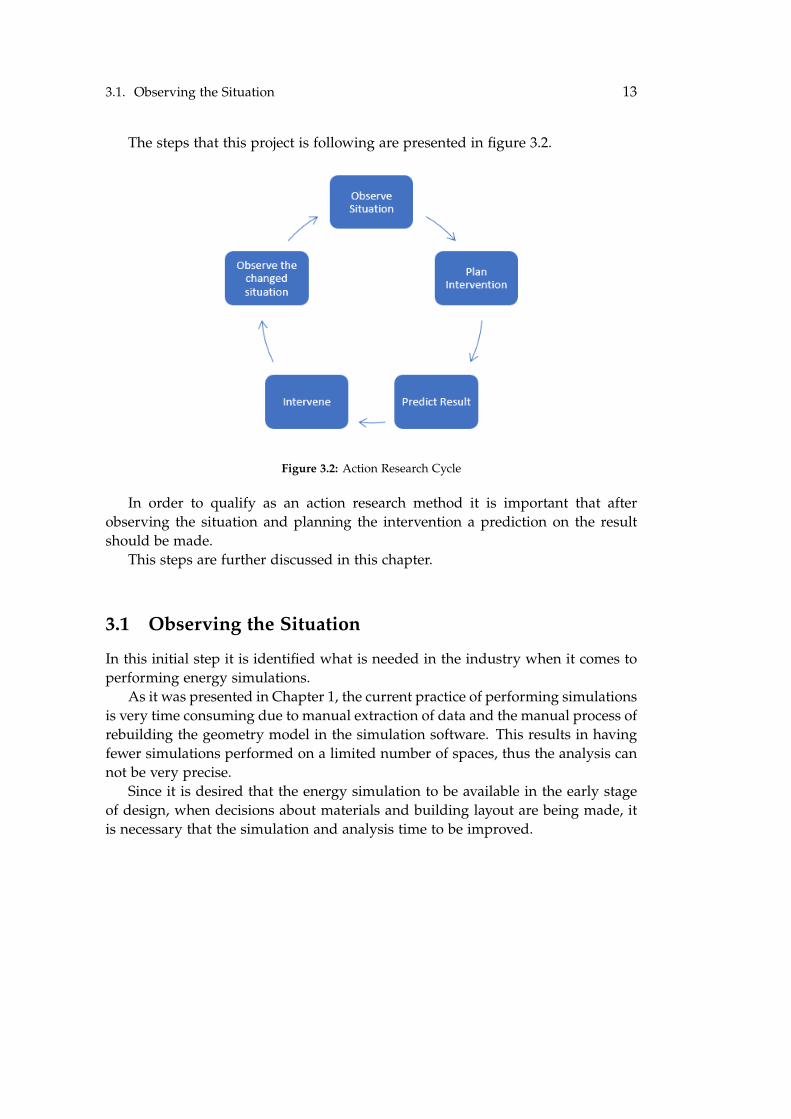
The steps that this project is following are presented in figure 3.2.
Figure 3.2: Action Research Cycle
In order to qualify as an action research method it is important that afterobserving the situation and planning the intervention a prediction on the resultshould be made.
This steps are further discussed in this chapter.
3.1 Observing the Situation
In this initial step it is identified what is needed in the industry when it comes toperforming energy simulations.
As it was presented in Chapter 1, the current practice of performing simulationsis very time consuming due to manual extraction of data and the manual process ofrebuilding the geometry model in the simulation software. This results in havingfewer simulations performed on a limited number of spaces, thus the analysis cannot be very precise.
Since it is desired that the energy simulation to be available in the early stageof design, when decisions about materials and building layout are being made, itis necessary that the simulation and analysis time to be improved.
14 Chapter 3. Methodology
3.2 Planning the Intervention
One way of increasing the efficiency of building simulations is to develop a methodthat will automate building the model geometry for simulation software.
In collaboration with company MOE A/S, represented by Torben Østergaard,a plan is developed to semi-automate the extraction of geometry data from Revitand import it in BSim simulation software.
Although having a fully automated method of building models in BSim mightsound like a better solution, it is desired that the specialist performing this tasksshould have control over the input that goes in the simulation software. Achievingthe goal of full system autonomy is quite difficult, and most systems will exist atsome level of semi-autonomy for quite some time[10].
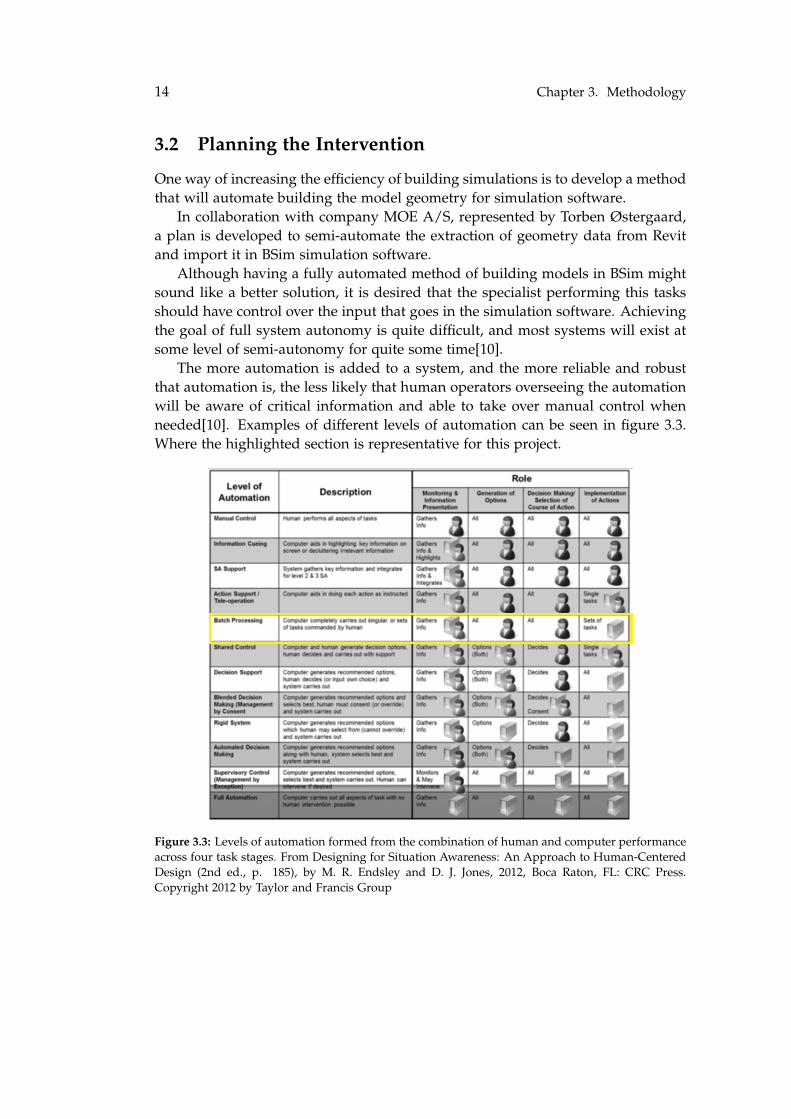
The more automation is added to a system, and the more reliable and robustthat automation is, the less likely that human operators overseeing the automationwill be aware of critical information and able to take over manual control whenneeded[10]. Examples of different levels of automation can be seen in figure 3.3.Where the highlighted section is representative for this project.
Figure 3.3: Levels of automation formed from the combination of human and computer performanceacross four task stages. From Designing for Situation Awareness: An Approach to Human-CenteredDesign (2nd ed., p. 185), by M. R. Endsley and D. J. Jones, 2012, Boca Raton, FL: CRC Press.Copyright 2012 by Taylor and Francis Group
3.2. Planning the Intervention 15
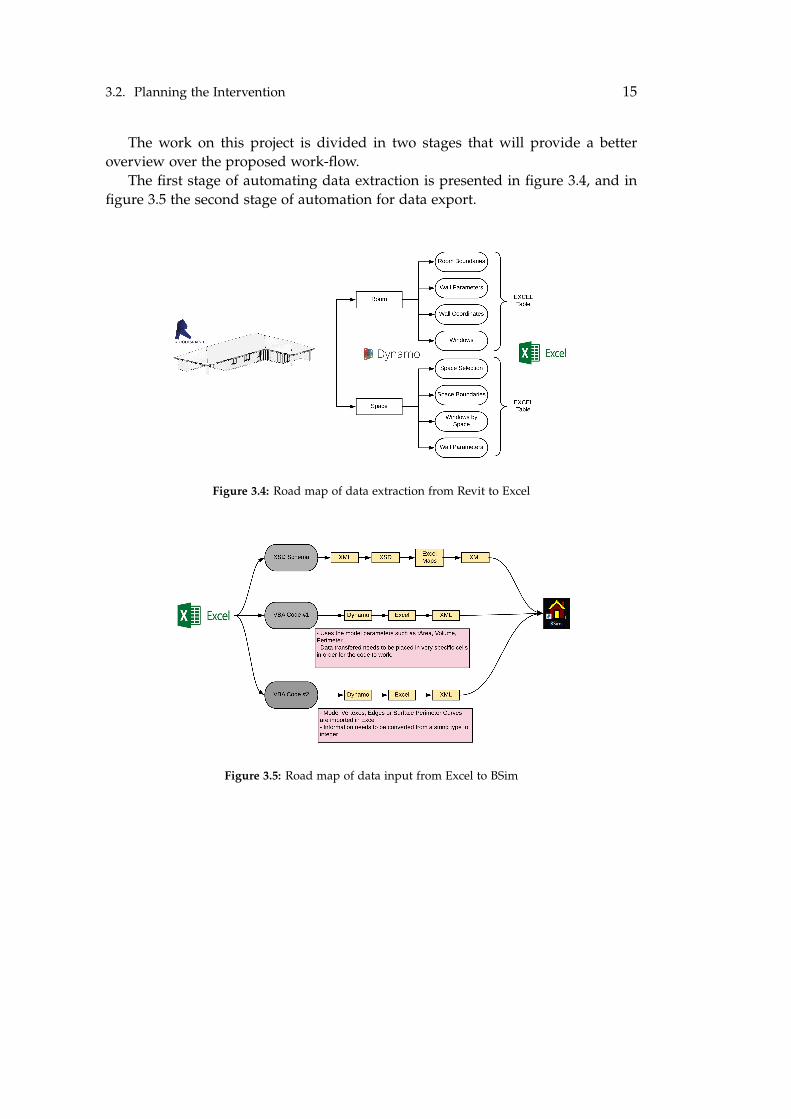
The work on this project is divided in two stages that will provide a betteroverview over the proposed work-flow.
The first stage of automating data extraction is presented in figure 3.4, and infigure 3.5 the second stage of automation for data export.
Figure 3.4: Road map of data extraction from Revit to Excel
Figure 3.5: Road map of data input from Excel to BSim
16 Chapter 3. Methodology
3.3 Prediction of Result
It is expected that by automating part of the work-flow in a simulation process,the performance of engineers will improve in terms of time and precision. Therepetitive task of collecting geometry data from an architect model and writingit in Excel spreadsheets will be performed by running a Dynamo script in Revit.Also the process of creating a model in BSim will be automated by exporting thenecessary data from Excel in an XML format that can be opened in the simulationsoftware. This improvements will allow the engineer to run simulations on multi-ple spaces and on more complex building layouts.
3.4 Intervene
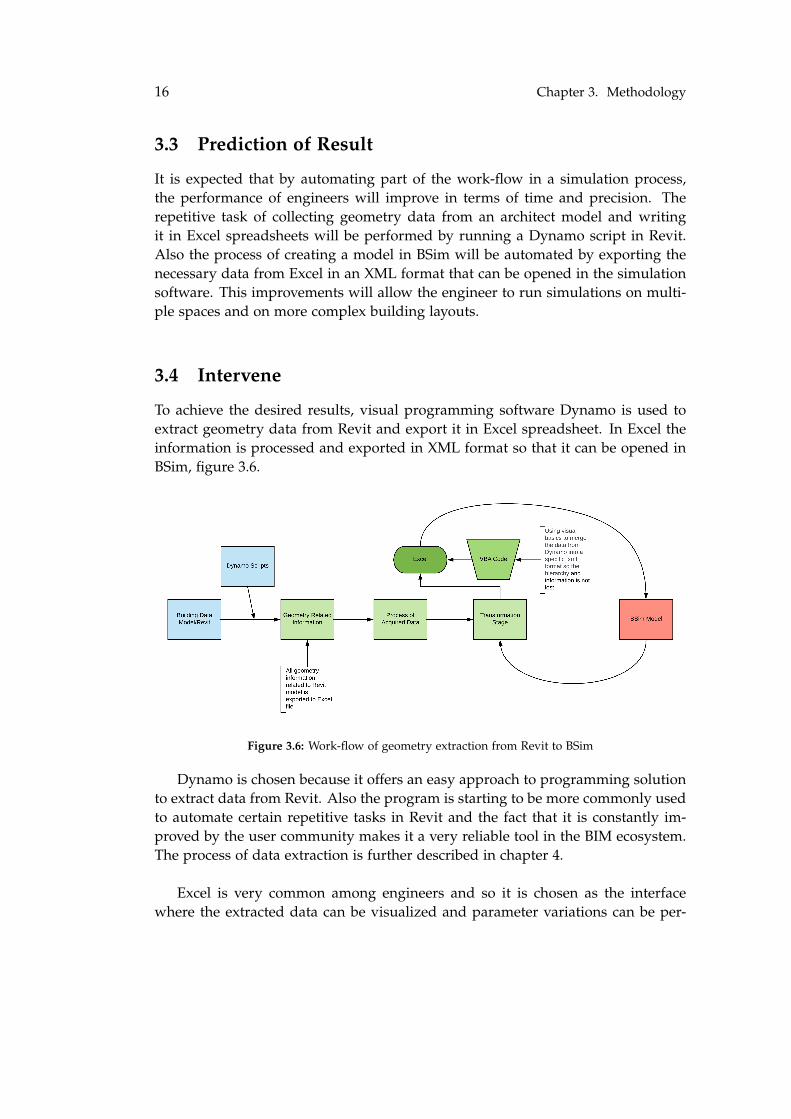
To achieve the desired results, visual programming software Dynamo is used toextract geometry data from Revit and export it in Excel spreadsheet. In Excel theinformation is processed and exported in XML format so that it can be opened inBSim, figure 3.6.
Figure 3.6: Work-flow of geometry extraction from Revit to BSim
Dynamo is chosen because it offers an easy approach to programming solutionto extract data from Revit. Also the program is starting to be more commonly usedto automate certain repetitive tasks in Revit and the fact that it is constantly im-proved by the user community makes it a very reliable tool in the BIM ecosystem.The process of data extraction is further described in chapter 4.
Excel is very common among engineers and so it is chosen as the interfacewhere the extracted data can be visualized and parameter variations can be per-

3.5. Observe Results 17
formed if needed. It is also the program that is used when building a BSim modelthe manual way. All the geometry information about the building such as wallsand windows/doors dimensions or construction type is written down in spread-sheets. The convenience of creating an Excel file and setting up spreadsheet inDynamo contribute to the decision of using Excel as a link between Revit and BSim.
3.5 Observe Results
This step will be discussed in chapter 6.


Chapter 4
Dynamo
When preparing for a building simulation the process is often defined by repeti-tive tasks that involve collecting of data and then using it to build a model. Pro-gramming allows for developing a system where this type of loop actions can beautomatized.
Dynamo is a Visual Programming tool that works as an extension of Revit andhas seen an impressive amount of popularity in the construction industry. It isused in design by architects, designers, engineers, and even contractors [12].
Rather than typing a code, in Dynamo the programs are created by manipulat-ing graphic elements called nodes, figure 4.1.
Figure 4.1: Example of visual programming (ArchSmarter)
In Dynamo, each node performs a specific task and they are connected by wires.The output from one node is connected to the input on another.
One of the most important benefit of Dynamo is the access to a library of nodesand packages. Thanks to a very active community this packages are updated allthe time and they can help solve some very specific tasks.
19

20 Chapter 4. Dynamo
4.1 Script Design
It is true that a lot of information can be exported from Revit but, looking atthe BSim requirements for geometry, an analysis of what information to extract isneeded and exporting only that information is critical to the speed and resourceconsumption of the script and to avoid crowding the output file with data that isnot used later[14].
In figure 4.2 the hierarchy in Dynamo of abstract geometric types is presentedand how this information is related with the BSim requirements. Seeing the simi-larity in hierarchy can help in deciding what type of nodes to choose for the script.
Figure 4.2: Data type hierarchy and relationships in Dynamo and BSim
A complete representation of Dynamo data type hierarchy can be seen in figure4.3.
Figure 4.3: Geometry and data type hierarchy in Dynamo (Dynamo Primer)
4.1. Script Design 21
It is decided that using Topology nodes it is possible to extract 3 main compo-nents that will create the geometry in BSim.
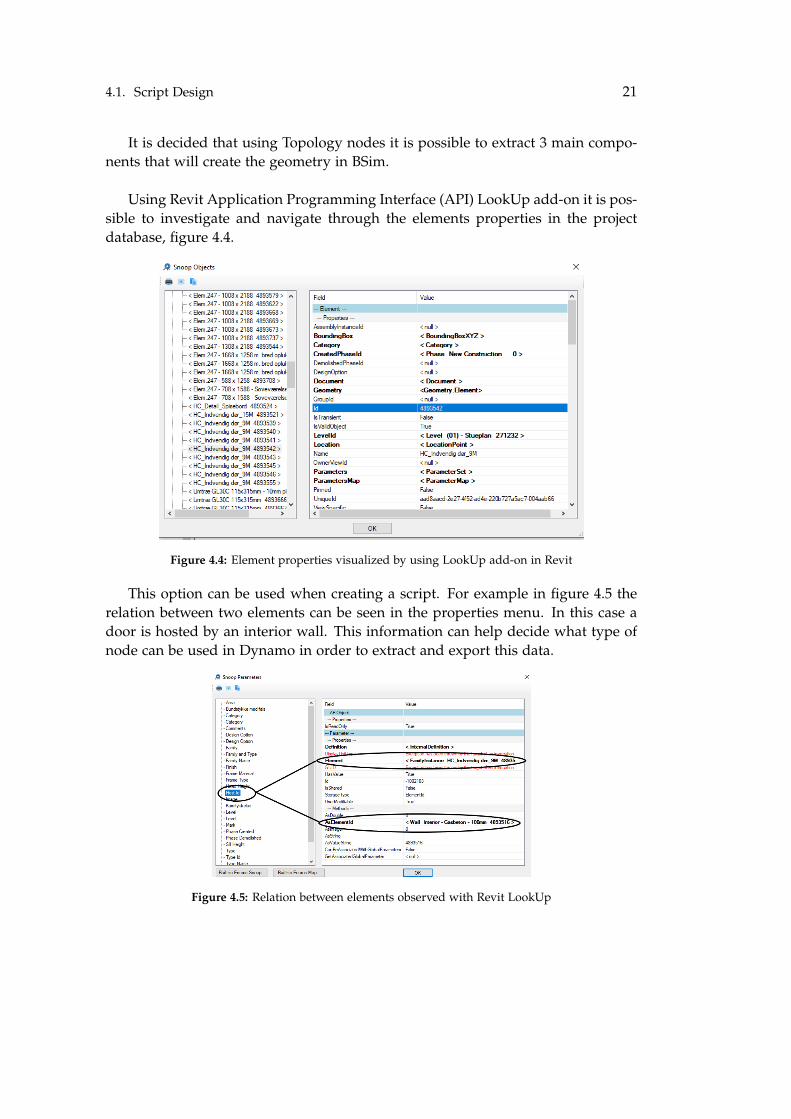
Using Revit Application Programming Interface (API) LookUp add-on it is pos-sible to investigate and navigate through the elements properties in the projectdatabase, figure 4.4.
Figure 4.4: Element properties visualized by using LookUp add-on in Revit
This option can be used when creating a script. For example in figure 4.5 therelation between two elements can be seen in the properties menu. In this case adoor is hosted by an interior wall. This information can help decide what type ofnode can be used in Dynamo in order to extract and export this data.
Figure 4.5: Relation between elements observed with Revit LookUp

22 Chapter 4. Dynamo
4.2 Data extraction strategies
One of the strategies of collecting the required data is by creating a script that willreach in the BIM model and extract parameters such as room boundaries, wallopenings and wall parameters. This method will be mentioned to from now as theRoom Method. In figure 4.6 it is described the approach in Dynamo when usingthis method.
Figure 4.6: Road map describing the wrokflow for the Room Method
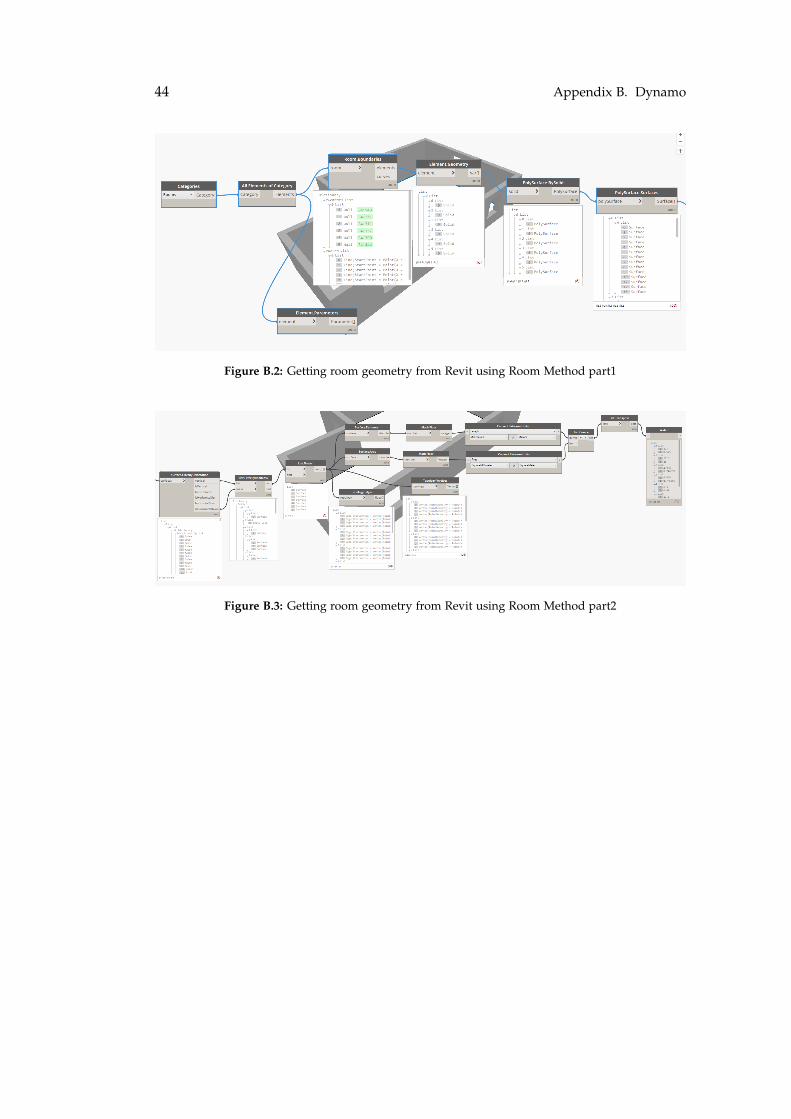
The use of this method is intended to select the walls that form the boundariesof a room, and get the walls geometry. In order to obtain the wall vertices andedges, Dynamo will convert the geometry into solids then to polysurfaces andsurfaces. The entire process of the script can be seen in diagram B.1 and a moredetailed representation in appendix B figure B.2 and B.3.
The process of extracting topology out of a Revit model is basically a reverseengineering on the geometry hierarchy, and can be seen in figure 4.7.
Figure 4.7: Process of collecting topology data in Dynamo script
4.2. Data extraction strategies 23
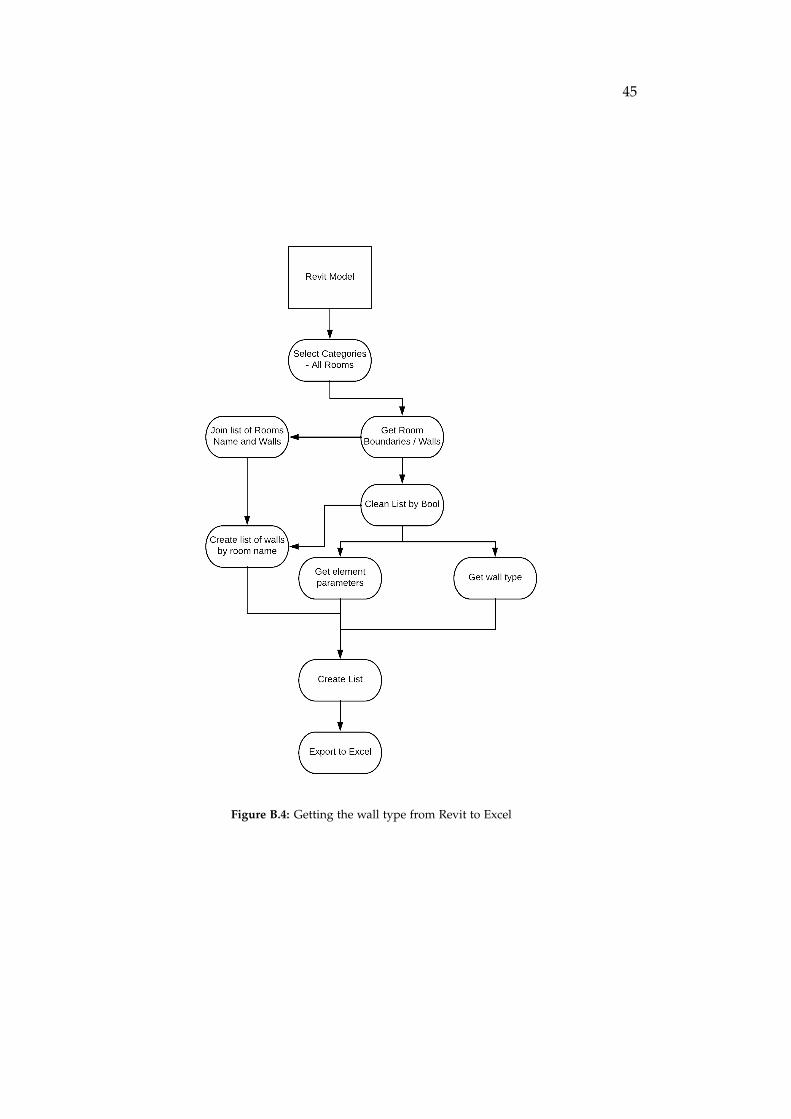
The wall type and windows are extracted using scripts presented in appendix Bfigure B.4 and B.5. The diagrams are kept separated for a more clear view on howthey are designed. But they are merged into the main script in the Room Method.
The result of running this script although promising it does have some draw-backs.
The method is successful in:
• Selecting all the rooms in the model.
• Taking the room boundary walls and convert the solid geometry into sur-faces.
• Can extract the inner surface of walls and write the vertex coordinates, edgesand surface perimeter.
The method does fail in some categories:
• Inconsistent results.
• Surfaces extracted appear to be in a random selection.
• Can not select specific windows or doors.
• Can not define which rooms should be selected in larger models.
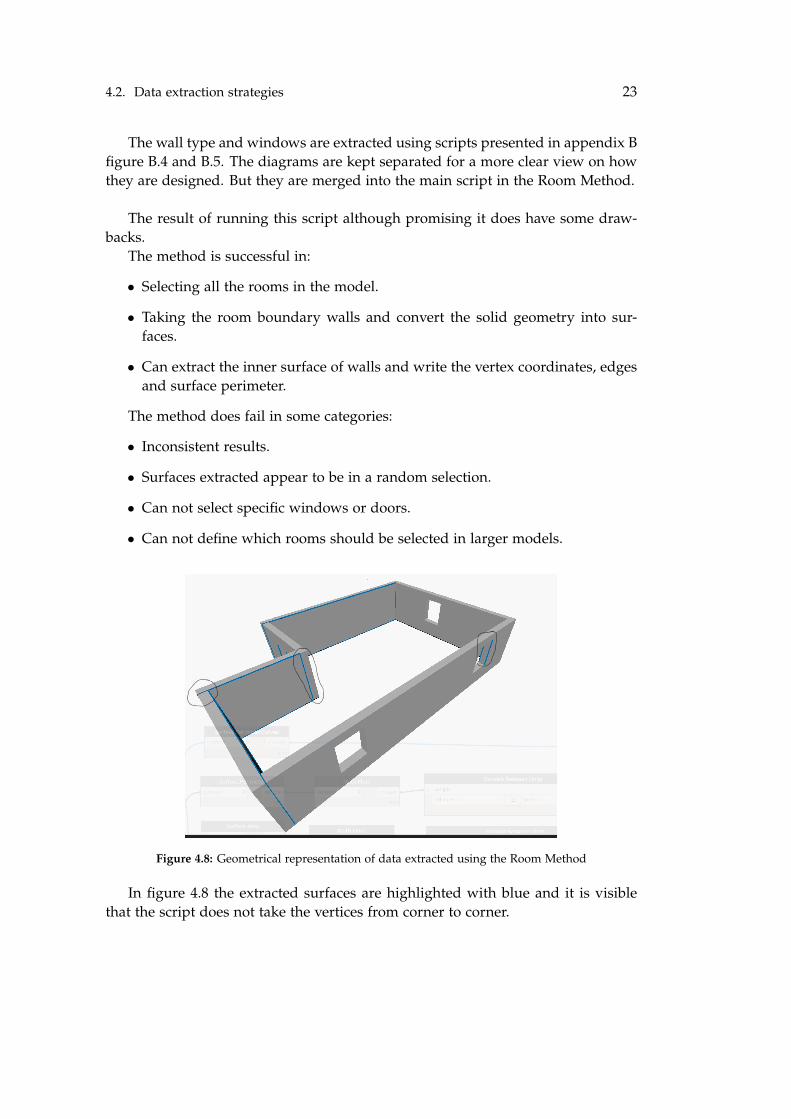
Figure 4.8: Geometrical representation of data extracted using the Room Method
In figure 4.8 the extracted surfaces are highlighted with blue and it is visiblethat the script does not take the vertices from corner to corner.
24 Chapter 4. Dynamo
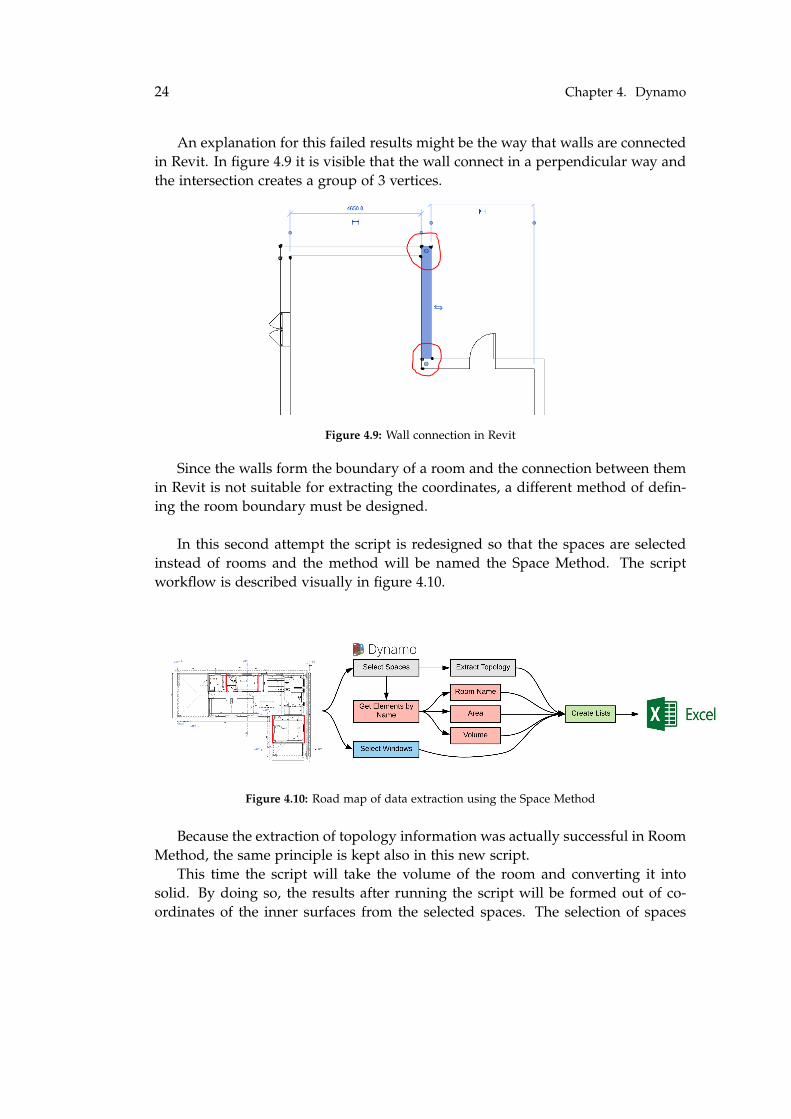
An explanation for this failed results might be the way that walls are connectedin Revit. In figure 4.9 it is visible that the wall connect in a perpendicular way andthe intersection creates a group of 3 vertices.
Figure 4.9: Wall connection in Revit
Since the walls form the boundary of a room and the connection between themin Revit is not suitable for extracting the coordinates, a different method of defin-ing the room boundary must be designed.
In this second attempt the script is redesigned so that the spaces are selectedinstead of rooms and the method will be named the Space Method. The scriptworkflow is described visually in figure 4.10.
Figure 4.10: Road map of data extraction using the Space Method
Because the extraction of topology information was actually successful in RoomMethod, the same principle is kept also in this new script.
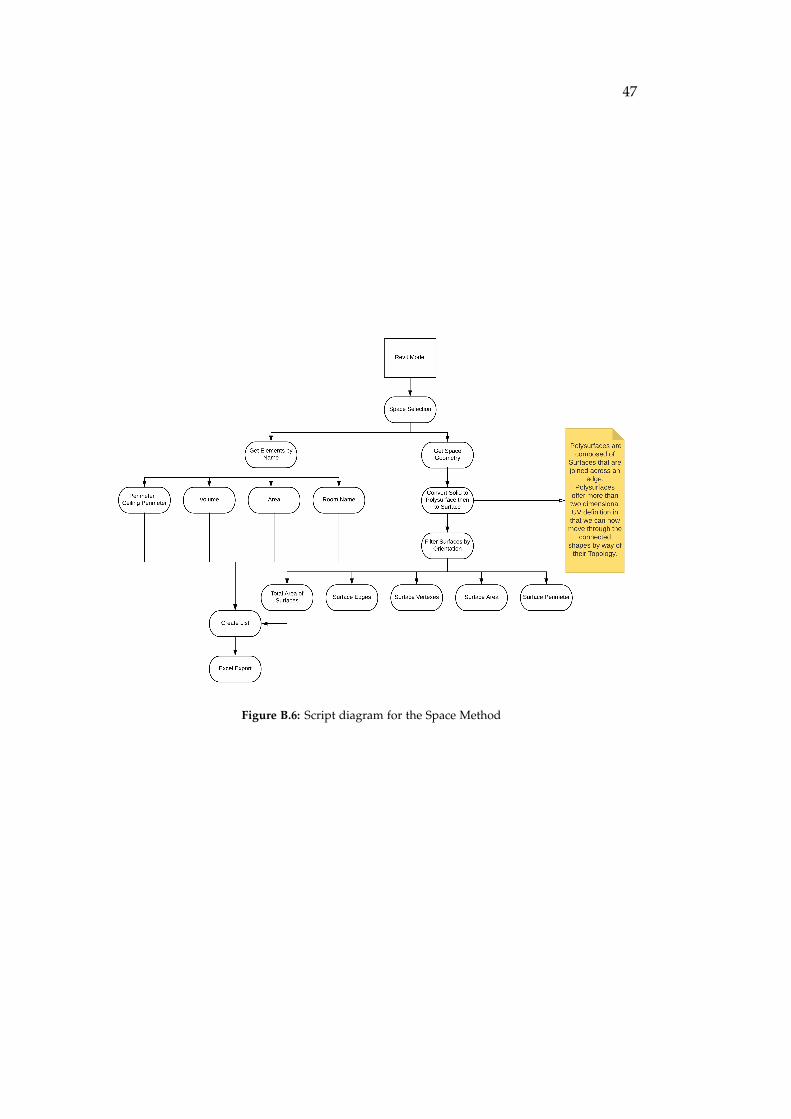
This time the script will take the volume of the room and converting it intosolid. By doing so, the results after running the script will be formed out of co-ordinates of the inner surfaces from the selected spaces. The selection of spaces
4.2. Data extraction strategies 25
it is not done in Dynamo. It is actually more convenient if the received architectmodel does not have spaces assigned, giving the opportunity to the specialist toselect which of the building spaces he wants to simulate.
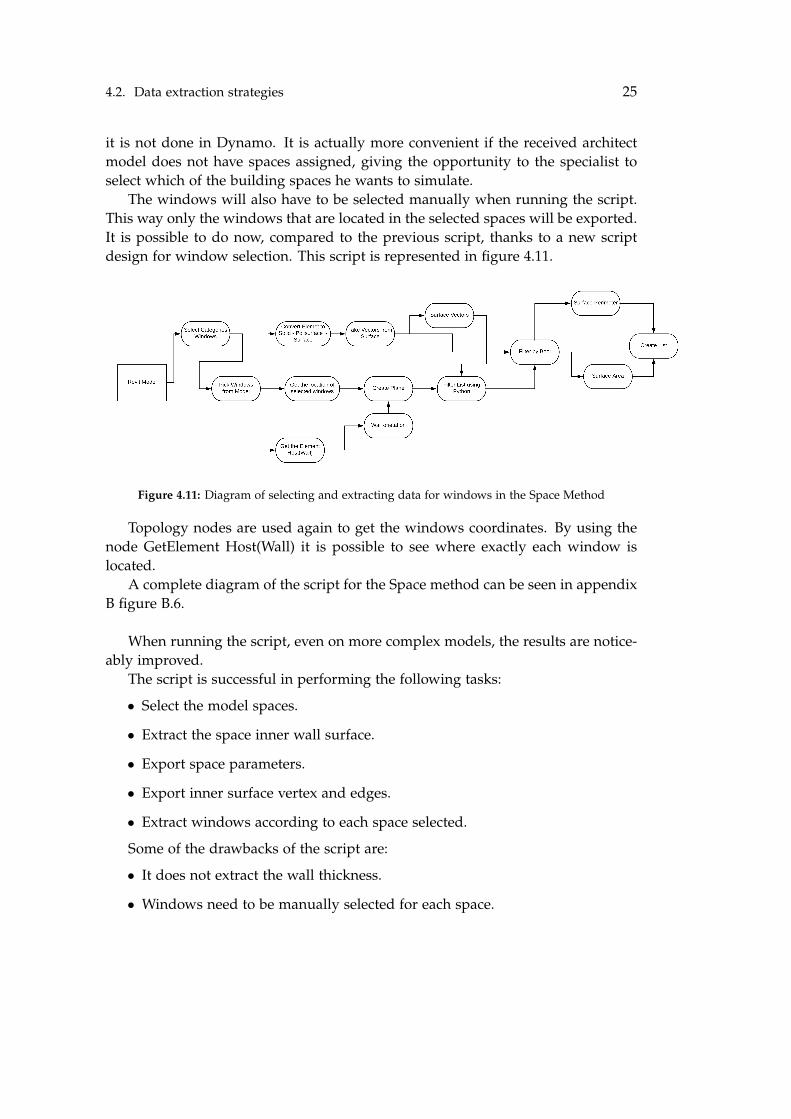
The windows will also have to be selected manually when running the script.This way only the windows that are located in the selected spaces will be exported.It is possible to do now, compared to the previous script, thanks to a new scriptdesign for window selection. This script is represented in figure 4.11.
Figure 4.11: Diagram of selecting and extracting data for windows in the Space Method
Topology nodes are used again to get the windows coordinates. By using thenode GetElement Host(Wall) it is possible to see where exactly each window islocated.
A complete diagram of the script for the Space method can be seen in appendixB figure B.6.
When running the script, even on more complex models, the results are notice-ably improved.
The script is successful in performing the following tasks:
• Select the model spaces.
• Extract the space inner wall surface.
• Export space parameters.
• Export inner surface vertex and edges.
• Extract windows according to each space selected.
Some of the drawbacks of the script are:
• It does not extract the wall thickness.
• Windows need to be manually selected for each space.
26 Chapter 4. Dynamo
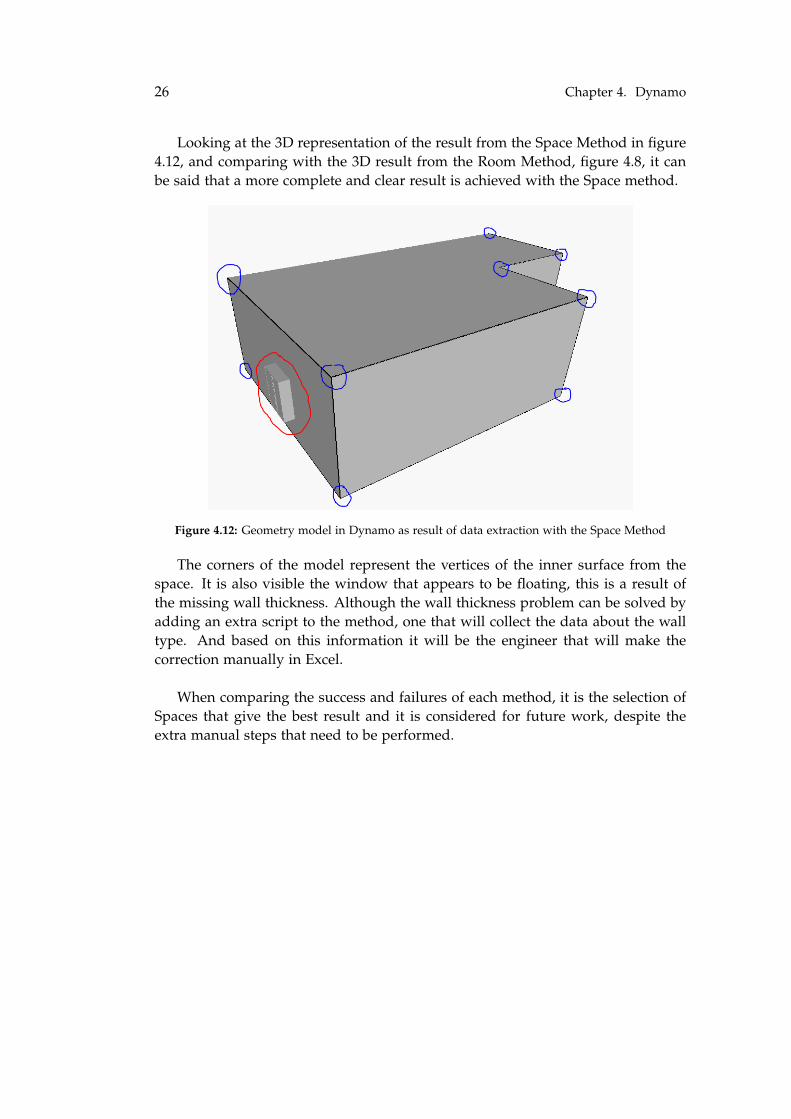
Looking at the 3D representation of the result from the Space Method in figure4.12, and comparing with the 3D result from the Room Method, figure 4.8, it canbe said that a more complete and clear result is achieved with the Space method.
Figure 4.12: Geometry model in Dynamo as result of data extraction with the Space Method
The corners of the model represent the vertices of the inner surface from thespace. It is also visible the window that appears to be floating, this is a result ofthe missing wall thickness. Although the wall thickness problem can be solved byadding an extra script to the method, one that will collect the data about the walltype. And based on this information it will be the engineer that will make thecorrection manually in Excel.
When comparing the success and failures of each method, it is the selection ofSpaces that give the best result and it is considered for future work, despite theextra manual steps that need to be performed.

Chapter 5
Excel to BSim
After receiving the geometry data via Dynamo script in the Excel file, the next stepis to export this data to BSim and reconstruct the model.
A method to transform the information received in to a format readable byBSim needs to be used.
Two methods will be tried in this project. Using an XSD schema and the ExcelVisual Basic for Applications. Both of this methods can export data in an XMLformat.
5.1 Using the XSD schema
XSD stand for XML Schema Definition and it is used to describe in an abstract waythe characteristics of an object and the relationship with other objects in an XMLdocument[13].
It is chosen to work with XSD because it can generate XML documents andkeep the desired hierarchy.
In order to work with XSD first an XML document needs to be converted. ABSim XML document it is used since it is desired that the schema to contain thesame type of object and hierarchy as it is in BSim. The conversion can be doneeasily using online converters XML to XSD.
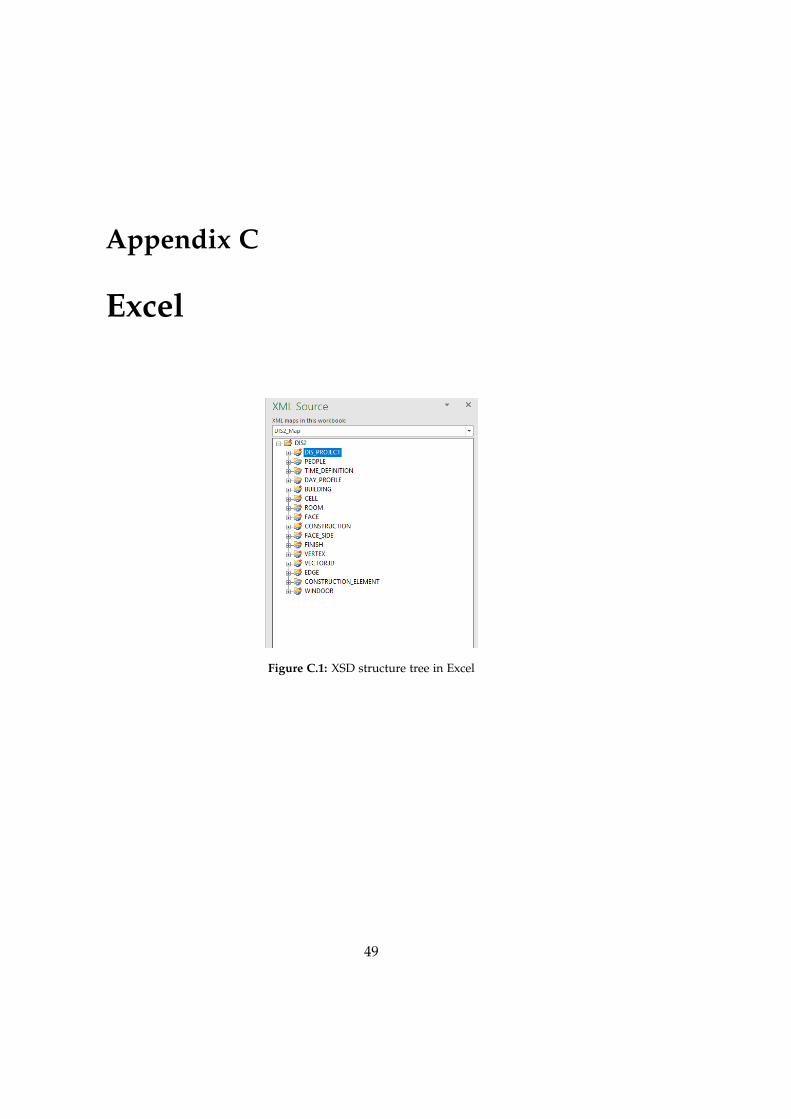
Next step is to import the schema in Excel using the Developer tab and uploadvia XML Maps. From this point the XSD needs to be populated with informationabout the model and just export in XML format.
In appendix C figure C.1 and C.2, examples of the imported XSD schema inExcel can be seen. And in figure 5.1, the schema is filled with information aboutthe BSim model.
27
28 Chapter 5. Excel to BSim
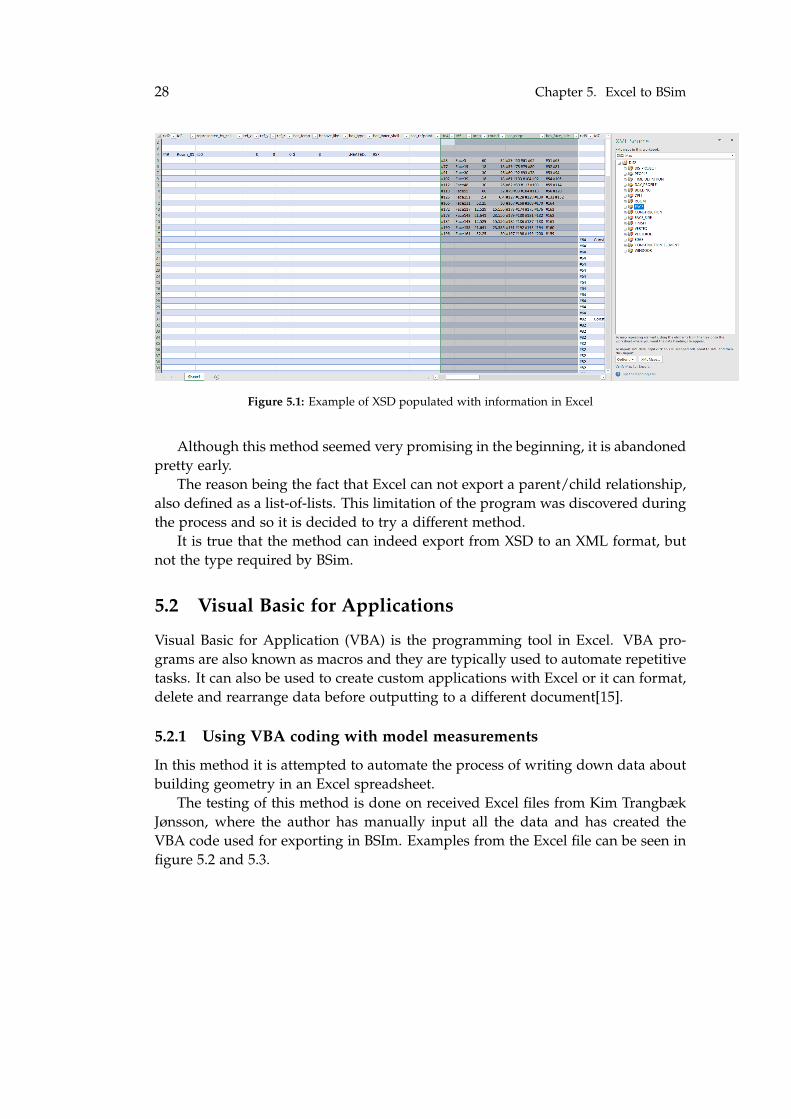
Figure 5.1: Example of XSD populated with information in Excel
Although this method seemed very promising in the beginning, it is abandonedpretty early.
The reason being the fact that Excel can not export a parent/child relationship,also defined as a list-of-lists. This limitation of the program was discovered duringthe process and so it is decided to try a different method.
It is true that the method can indeed export from XSD to an XML format, butnot the type required by BSim.
5.2 Visual Basic for Applications
Visual Basic for Application (VBA) is the programming tool in Excel. VBA pro-grams are also known as macros and they are typically used to automate repetitivetasks. It can also be used to create custom applications with Excel or it can format,delete and rearrange data before outputting to a different document[15].
5.2.1 Using VBA coding with model measurements
In this method it is attempted to automate the process of writing down data aboutbuilding geometry in an Excel spreadsheet.
The testing of this method is done on received Excel files from Kim TrangbækJønsson, where the author has manually input all the data and has created theVBA code used for exporting in BSIm. Examples from the Excel file can be seen infigure 5.2 and 5.3.

5.2. Visual Basic for Applications 29
Figure 5.2: Example of manually written information in measurements spreadsheet
Figure 5.3: Data collected by the VBA code from the measurements spreadsheet
The necessary data for this VBA code consists of rooms, walls and windows/doorsattributes. This attributes are: areas, volume, perimeter and dimensions of height,length and width. All of which can be obtained using the Dynamo scripts.
The challenge is to organize all of this data in list and export it from Dynamo.Since the VBA code collects the information from already defined cells it is im-portant that the export to be done in those specific locations, otherwise the entireprocess will not work.
Although possible, figure 5.5, this process will require multiple scripts to runat the same time and each script to have a separate export to Excel, figure 5.4.
Figure 5.4: Workflow of data extraction to get required attributes

30 Chapter 5. Excel to BSim
Figure 5.5: Example of data imported in Excel using Dynamo
The use of a multitude of scripts will make the process more vulnerable tosoftware errors. It will also not be a reliable method in case it will be used onbigger models.
And BSim does not require this amount of information for modeling geometry,since it can calculate the areas, volumes and perimeters by itself.
Considering the effort of designing the scripts and the method not being viablefor a variety of projects, a different way of exporting the data to BSim will be tried.
5.2.2 Using VBA coding with model coordinates
This method is designed to work with the main elements that stand at the coreof building a geometry model in BSim. As it was presented in chapter 2 BsimHierarchy, this elements are the vertex, edge and face. It is considered that havingonly the edges exported to Excel, enough information will be provided to buildthe geometry in BSim. This is decided because a face is defined by edges and theedge will consist out of a set of vertices that define the start and end point of theedge.
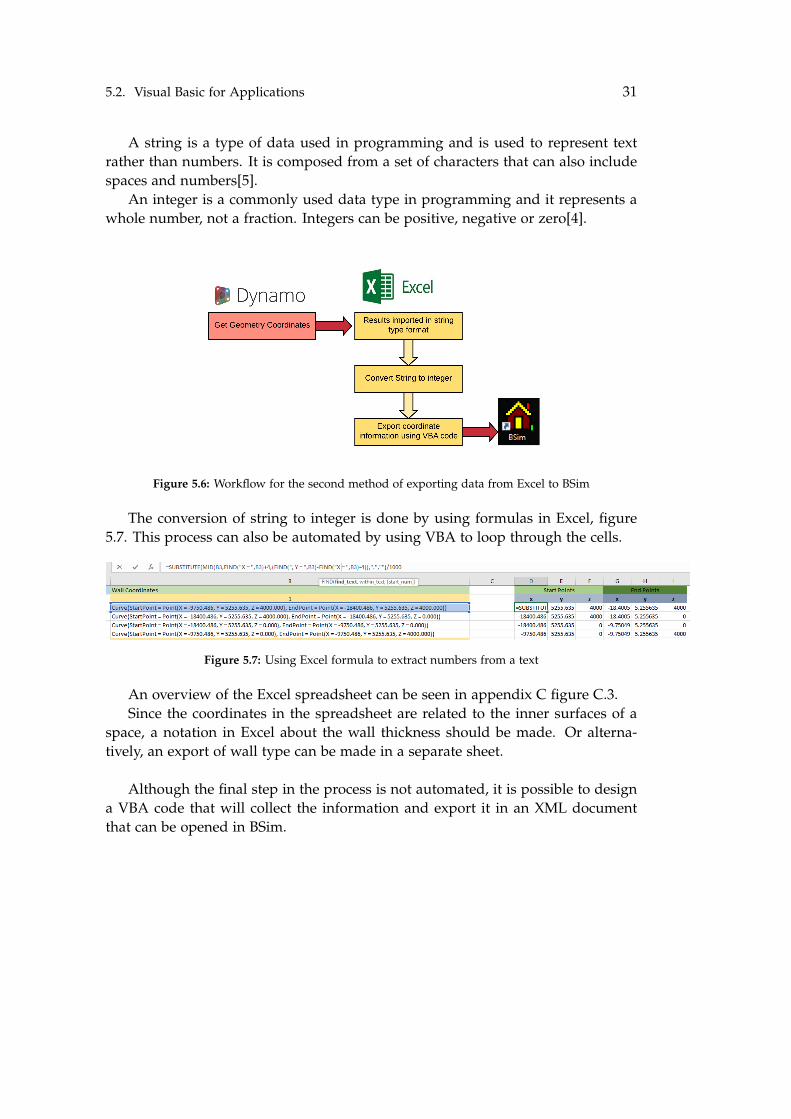
When the information is imported in Excel, it will be presented in the form ofa string. This means that a set up of transforming this type of data to integer typeneeds to be implemented. The workflow of this process can be seen in figure 5.6.
5.2. Visual Basic for Applications 31
A string is a type of data used in programming and is used to represent textrather than numbers. It is composed from a set of characters that can also includespaces and numbers[5].
An integer is a commonly used data type in programming and it represents awhole number, not a fraction. Integers can be positive, negative or zero[4].
Figure 5.6: Workflow for the second method of exporting data from Excel to BSim
The conversion of string to integer is done by using formulas in Excel, figure5.7. This process can also be automated by using VBA to loop through the cells.
Figure 5.7: Using Excel formula to extract numbers from a text
An overview of the Excel spreadsheet can be seen in appendix C figure C.3.Since the coordinates in the spreadsheet are related to the inner surfaces of a
space, a notation in Excel about the wall thickness should be made. Or alterna-tively, an export of wall type can be made in a separate sheet.
Although the final step in the process is not automated, it is possible to designa VBA code that will collect the information and export it in an XML documentthat can be opened in BSim.


Chapter 6
Conclusion
From the experience of 3 semesters working with BSim on each semester project,and with insight from the industry, it can be said that the modeling part in theprogram has proven to be a real challenge and time consuming process.
Considering the importance of simulations and the benefits of having them in avery early stage of the project, the need of a method that can improve this processit is more and more necessary.
Because BSim is such a common tool for simulations, in this project it was triedto automate parts of the simulation process, and thus creating a semi-automaticworkflow.
Dynamo and Excel are used in attempt of achieving this goal, and in each pro-gram more than one methods are tried.
In Dynamo, two methods are designed for collecting data in different ways.The Room method is focused on extracting the geometric coordinates of a roomboundary, which are the walls.
Using the Space method, the coordinates of the inner surfaces from a room areextracted. This points define the volume of the room otherwise named a Cell inBSim.
The Space method is considered to work better when compared to the Room.This is due to the ability of selecting what window should be exported, consistencyin results, and the amount of data extracted is easier to work with.
In Excel three methods are tried, although the first option of using the XSDschema is proved to be unusable from an early stage.
The second option of using VBA code and measurements of the model it isdisconsidered due to high amount of data required and the difficulty of organizingthis data in Excel spreadsheets.
33
34 Chapter 6. Conclusion
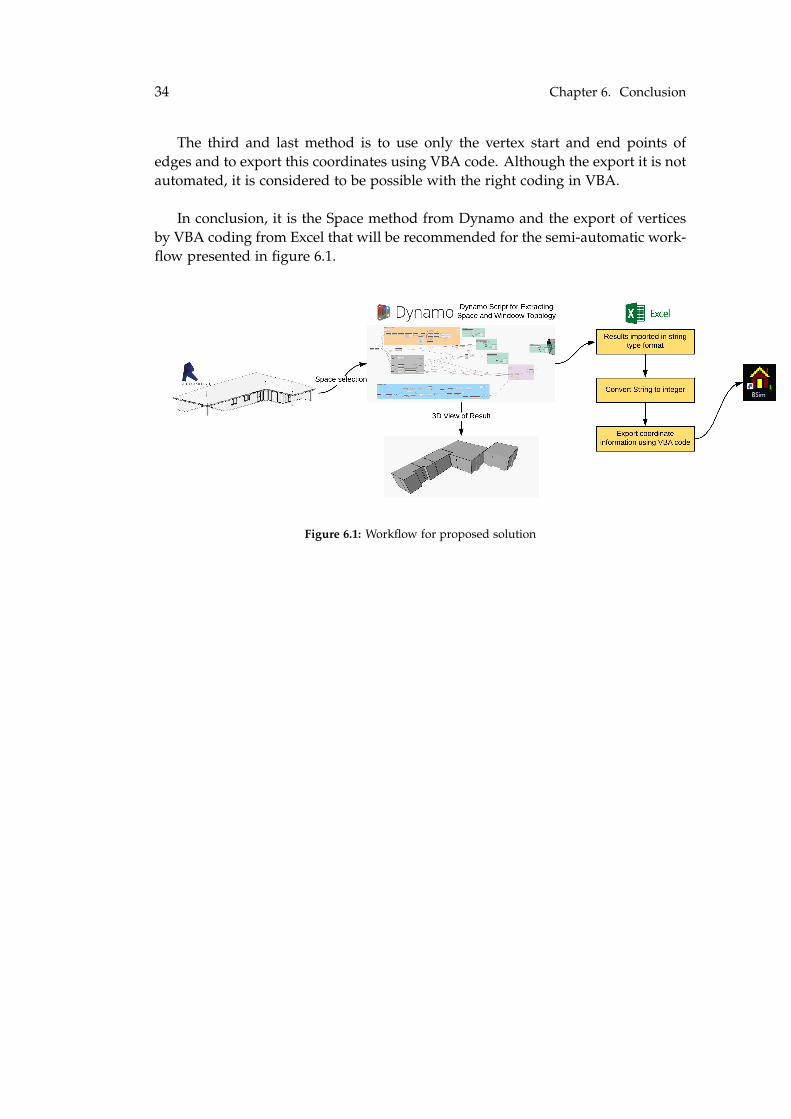
The third and last method is to use only the vertex start and end points ofedges and to export this coordinates using VBA code. Although the export it is notautomated, it is considered to be possible with the right coding in VBA.
In conclusion, it is the Space method from Dynamo and the export of verticesby VBA coding from Excel that will be recommended for the semi-automatic work-flow presented in figure 6.1.
Figure 6.1: Workflow for proposed solution
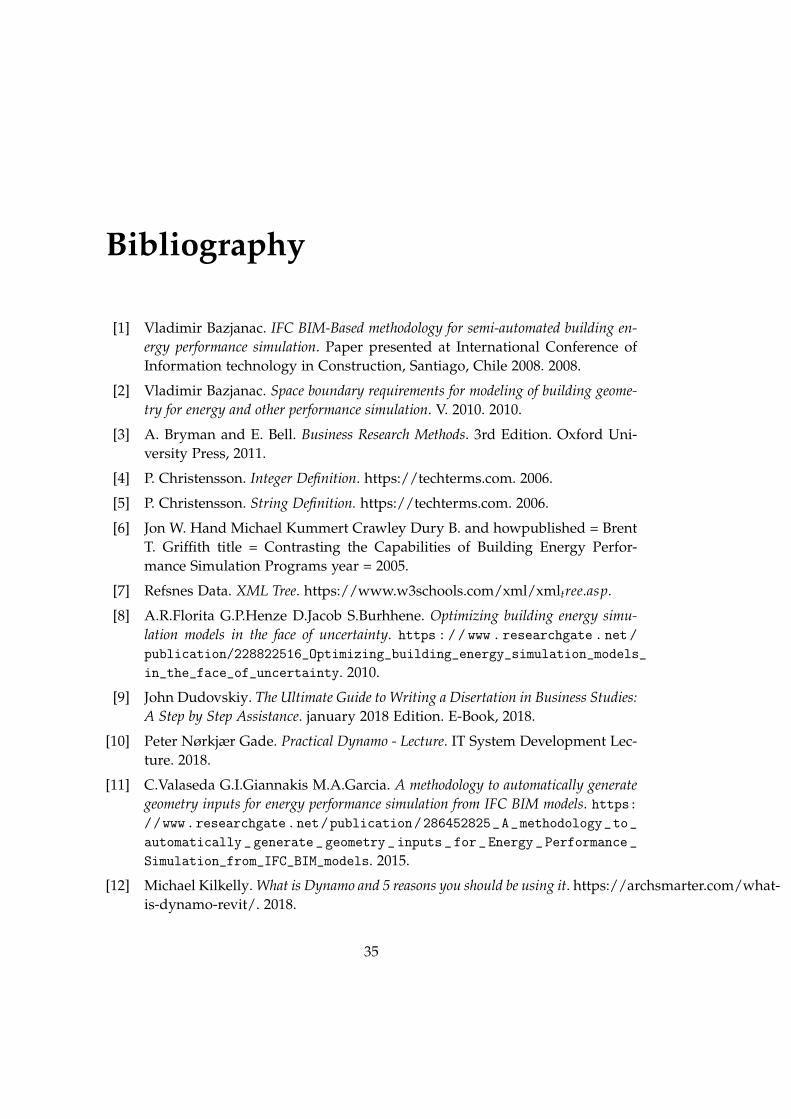
Bibliography
[1] Vladimir Bazjanac. IFC BIM-Based methodology for semi-automated building en-ergy performance simulation. Paper presented at International Conference ofInformation technology in Construction, Santiago, Chile 2008. 2008.
[2] Vladimir Bazjanac. Space boundary requirements for modeling of building geome-try for energy and other performance simulation. V. 2010. 2010.
[3] A. Bryman and E. Bell. Business Research Methods. 3rd Edition. Oxford Uni-versity Press, 2011.
[4] P. Christensson. Integer Definition. https://techterms.com. 2006.
[5] P. Christensson. String Definition. https://techterms.com. 2006.
[6] Jon W. Hand Michael Kummert Crawley Dury B. and howpublished = BrentT. Griffith title = Contrasting the Capabilities of Building Energy Perfor-mance Simulation Programs year = 2005.
[7] Refsnes Data. XML Tree. https://www.w3schools.com/xml/xmltree.asp.
[8] A.R.Florita G.P.Henze D.Jacob S.Burhhene. Optimizing building energy simu-lation models in the face of uncertainty. https : / / www . researchgate . net /publication/228822516_Optimizing_building_energy_simulation_models_in_the_face_of_uncertainty. 2010.
[9] John Dudovskiy. The Ultimate Guide to Writing a Disertation in Business Studies:A Step by Step Assistance. january 2018 Edition. E-Book, 2018.
[10] Peter Nørkjær Gade. Practical Dynamo - Lecture. IT System Development Lec-ture. 2018.
[11] C.Valaseda G.I.Giannakis M.A.Garcia. A methodology to automatically generategeometry inputs for energy performance simulation from IFC BIM models. https://www.researchgate.net/publication/286452825_A_methodology_to_automatically_generate_geometry_inputs_for_Energy_Performance_Simulation_from_IFC_BIM_models. 2015.
[12] Michael Kilkelly. What is Dynamo and 5 reasons you should be using it. https://archsmarter.com/what-is-dynamo-revit/. 2018.
35

36 Bibliography
[13] George Lawton Margaret Rouse. XSD (XML Schema Definition). https://searchmicroservices.techtarget.com/definition/XSD-XML-Schema-Definition. 2015.
[14] Pavel Pavlov. Automation of information flow freom Revit to BSim using Dy-namo. https://projekter.aau.dk/projekter/files/231026964/Dynamo_Project.pdf. 2015.
[15] Website i programmer.info. Getting started with Excel VBA. https://www.i-programmer.info/ebooks/automating-excel/1264-getting-started.html. 2018.
[16] Arto Kiviniemi Vladimir Bazjanac. Reduction, simplification, translation and in-terpretation in the exchange of model data. https://www.researchgate.net/publication/228963955_Reduction_simplification_translation_and_interpretation_in_the_exchange_of_model_data. 2007.
[17] C. Wilkins and Kiviniemi A. Engineering- Centric BIM. ASHRAE Journal, De-cember 2008. 2008.
Appendix A
BSim
Figure A.1: BSim XML text
37
38 Appendix A. BSim
Figure A.2: BSim XML tree structure
39
Figure A.3: BSim XML tree hierarchy

40 Appendix A. BSim
Figure A.4: BSim parent-child hierarchy diagram
41
Figure A.5: Graphic representation of XML parent-child relation


Appendix B
Dynamo
Figure B.1: Script diagram of export room coordinates from Revit model
43
44 Appendix B. Dynamo
Figure B.2: Getting room geometry from Revit using Room Method part1
Figure B.3: Getting room geometry from Revit using Room Method part2
45
Figure B.4: Getting the wall type from Revit to Excel

46 Appendix B. Dynamo
Figure B.5: Getting the windows from Revit to Excel
47
Figure B.6: Script diagram for the Space Method

Appendix C
Excel
Figure C.1: XSD structure tree in Excel
49

50 Appendix C. Excel
Figure C.2: XSD details of elements
Figure C.3: Excel spreadsheet with geometry coordinates and conversion of string type data tointeger
51
Figure C.4: Building information manually added in Excel (Kim Trangbæk Jønsson)


