226 Korean J Radiol 9(3), June 2008 Semi-Automatic Measurement of the Airway Dimension by Computed Tomography Using the Full-Width-Half- Maximum Method: a Study on the Measurement Accuracy according to the CT Parameters and Size of the Airway Objective: To assess the influence of variable factors such as the size of the airway and the CT imaging parameters such as the reconstruction kernel, field-of- view (FOV), and slice thickness on the automatic measurement of airway dimen- sion. Materials and Methods: An airway phantom was fabricated that contained eleven poly-acryl tubes of various lumen diameters and wall thicknesses. The measured density of the poly-acryl wall was 150 HU, and the measured density of the airspace filled with polyurethane foam was 900 HU. CT images were obtained using a 16-MDCT (multidetector CT) scanner and were reconstructed with various reconstruction kernels, thicknesses and FOV. The luminal radius and wall thickness were measured using in-house software based on the full- width-half-maximum method. The measured values as determined by CT and the actual dimensions of the tubes were compared. Results: Measurements were most accurate on images reconstructed with use of a standard kernel (mean error: 0.03 0.21 mm for wall thickness and 0.12 0.11 mm for the luminal radius). There was no significant difference in accura- cy among images with the use of variable slice thicknesses or a variable FOV. Below a 1-mm threshold, the measurement failed to represent the change of the real dimensions. Conclusion: Measurement accuracy was strongly influenced by the specific reconstruction kernel utilized. For accurate measurement, standardization of the imaging protocol and selection of the appropriate anatomic level are essential. ulti-detector computerized tomography (MDCT) provides volumetric images of the lungs and bronchial tree geometry to the sub-lobal level with sub-millimeter resolution. It is possible to measure quantitatively various anatomical features including the airway wall thickness, luminal diameter, wall area, lumen area, wall-lumen area ratio and wall-lumen diameter ratio, which were previously studied only by the use of indirect methods such as pulmonary function tests. Quantification of the peripheral geometry using MDCT images provides an important tool for evaluating the regional airway physiology and structure. Dimensions of the bronchial tree can be used to evaluate and track the development of disease affecting the airways, such as asthma and chronic obstructive pulmonary disease (COPD), and the determination of bronchial tree dimensions can be used to Namkug Kim, PhD 1,2 Joon Beom Seo, MD 1 Koun-Sik Song, MD 1 Eun Jin Chae, MD 1 Suk-Ho Kang, PhD 2 Index terms : Airway Computed tomography (CT) FWHM (Full Width at Half Maximum) Measurement, phantom DOI:10.3348/kjr.2008.9.3.226 Korean J Radiol 2008 ; 9 : 226-235 Received August 21, 2007; accepted after revision November 16, 2007. 1 Department of Radiology and Research Institute of Radiology, University of Ulsan College of Medicine, Asan Medical Center, Seoul 138-736, Korea; 2 Department of Industrial Engineering, Seoul National University, Seoul 138-736, Korea Address reprint requests to : Joon Beom Seo, MD, Department of Radiology and Research Institute of Radiology, University of Ulsan College of Medicine, Asan Medical Center, 388-1, Pungnap-dong, Songpa-gu, Seoul 138- 736, Korea. Tel. (822) 3010-4400 Fax. (822) 476-4719 e-mail: [email protected]M
Transcript
226 Korean J Radiol 9(3), June 2008
Semi-Automatic Measurement of theAirway Dimension by ComputedTomography Using the Full-Width-Half-Maximum Method: a Study on theMeasurement Accuracy according to theCT Parameters and Size of the Airway
Objective: To assess the influence of variable factors such as the size of theairway and the CT imaging parameters such as the reconstruction kernel, field-of-view (FOV), and slice thickness on the automatic measurement of airway dimen-sion.
Materials and Methods: An airway phantom was fabricated that containedeleven poly-acryl tubes of various lumen diameters and wall thicknesses. Themeasured density of the poly-acryl wall was 150 HU, and the measured density ofthe airspace filled with polyurethane foam was 900 HU. CT images wereobtained using a 16-MDCT (multidetector CT) scanner and were reconstructedwith various reconstruction kernels, thicknesses and FOV. The luminal radiusand wall thickness were measured using in-house software based on the full-width-half-maximum method. The measured values as determined by CT and theactual dimensions of the tubes were compared.
Results: Measurements were most accurate on images reconstructed with useof a standard kernel (mean error: 0.03 0.21 mm for wall thickness and 0.12
0.11 mm for the luminal radius). There was no significant difference in accura-cy among images with the use of variable slice thicknesses or a variable FOV.Below a 1-mm threshold, the measurement failed to represent the change of thereal dimensions.
Conclusion: Measurement accuracy was strongly influenced by the specificreconstruction kernel utilized. For accurate measurement, standardization of theimaging protocol and selection of the appropriate anatomic level are essential.
ulti-detector computerized tomography (MDCT) provides volumetricimages of the lungs and bronchial tree geometry to the sub-lobal levelwith sub-millimeter resolution. It is possible to measure quantitatively
various anatomical features including the airway wall thickness, luminal diameter, wallarea, lumen area, wall-lumen area ratio and wall-lumen diameter ratio, which werepreviously studied only by the use of indirect methods such as pulmonary functiontests. Quantification of the peripheral geometry using MDCT images provides animportant tool for evaluating the regional airway physiology and structure.Dimensions of the bronchial tree can be used to evaluate and track the developmentof disease affecting the airways, such as asthma and chronic obstructive pulmonarydisease (COPD), and the determination of bronchial tree dimensions can be used to
Namkug Kim, PhD1,2
Joon Beom Seo, MD1
Koun-Sik Song, MD1
Eun Jin Chae, MD1
Suk-Ho Kang, PhD2
Index terms:AirwayComputed tomography (CT)FWHM (Full Width at Half
Maximum)Measurement, phantom
DOI:10.3348/kjr.2008.9.3.226
Korean J Radiol 2008;9:226-235Received August 21, 2007; accepted after revision November 16, 2007.
1Department of Radiology and ResearchInstitute of Radiology, University of UlsanCollege of Medicine, Asan MedicalCenter, Seoul 138-736, Korea;2Department of Industrial Engineering,Seoul National University, Seoul 138-736,Korea
Address reprint requests to:Joon Beom Seo, MD, Department ofRadiology and Research Institute ofRadiology, University of Ulsan College ofMedicine, Asan Medical Center, 388-1,Pungnap-dong, Songpa-gu, Seoul 138-736, Korea.Tel. (822) 3010-4400Fax. (822) 476-4719e-mail: [email protected]
M
assess the efficacy of new therapeutic approaches (1, 2). A variety of techniques has been proposed for the
measurement of extra- and intra-thoracic airways in two-dimensional (2D) sections on volumetric X-ray CT images.Simpler methods to assess airway dimensions include theuse of manual or semi-automatic border tracing andmeasurement on film, a computer monitor or by the use ofa projected image with the adjustment of window andlevel (3 5); these methods are not free from inter-measurement variability. The full-width-half-maximum(FWHM) method is a typical technique as an objective,quantitative approach to automatic airway measurement(6 8). The half-maximum criteria assume that the imagegray level at the true airway wall will be halfway betweenthe minimum and maximum gray levels along a raycrossing the wall. By casting a number of rays at differentangles from the centroid of the airway, inner and outerwall locations can be estimated by examining the gray-level profile along each ray. Although the FWHM methodis regarded as a simple and robust method (6, 7), inprevious studies, it has been shown that the measuringaccuracy of the FWHM method is strongly influenced bythe target size, shape, and imaging parameters (8).
It is known that the critical site of airway obstruction inpatients with COPD is in the small airways that are definedas having a luminal diameter of less than 2 mm (9 11).Accordingly, accurate measurement of small airwaydimensions on CT has been of importance and there havebeen several reports on the measurement of small airwaydimensions using the FWHM method (11, 12). However,measurement of small airway dimensions may not beaccurate as edge detection using the FWHM method isknown to be influenced by several factors, such as theimaging parameters of the CT scanner and the size of the
airways (13).The aim of this study is to evaluate the influence of
variable factors such as the size of the airway and the CTimage reconstruction parameters for measurement of anairway dimension using the FWHM method. Using CTscans of a physical phantom, we attempted to determinethe optimal imaging parameters and limitations of theFWHM method for obtaining an accurate measurement ofan airway dimension.
MATERIALS AND METHODS
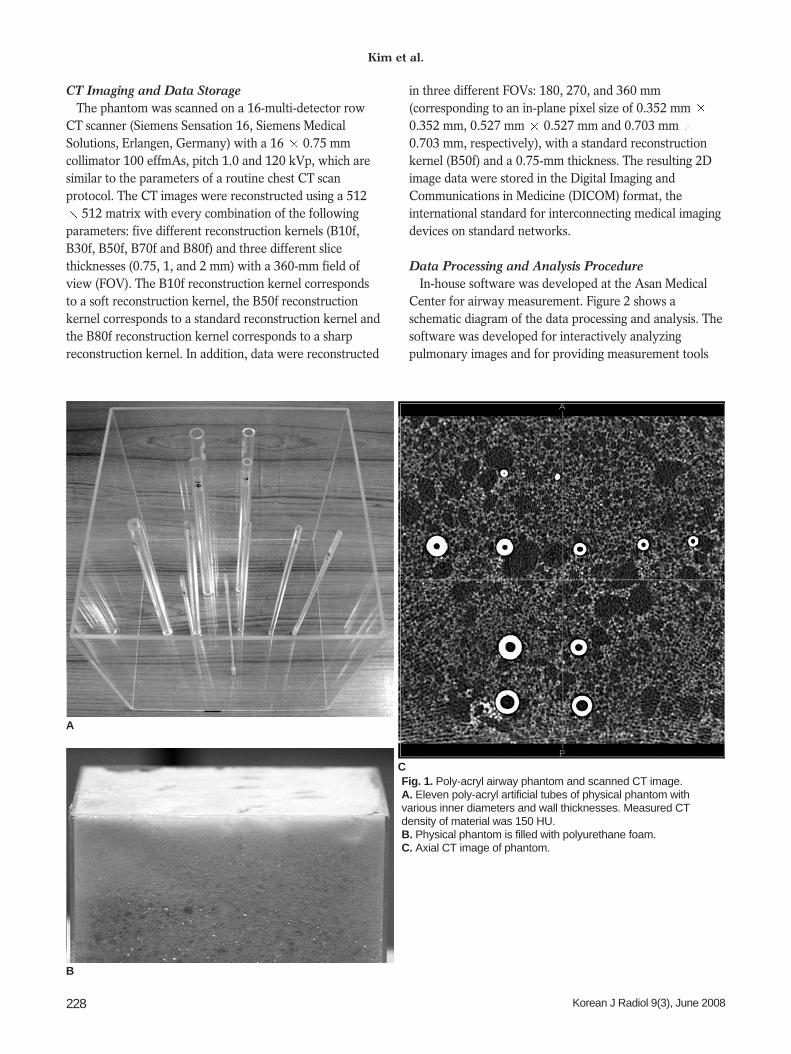
Airway PhantomThe phantom consisted of eleven poly-acryl tubes that
simulated airways, with various inner diameters and wallthicknesses. The measured density of the artificial airwaywall on CT images was 150 HU. The tubes were containedin a poly-acryl box. The airspace outside of the tube wasfilled with polyurethane foam ( 900 HU) to simulate thelung parenchyma with emphysema. The actual dimensionof the artificial phantom was repetitively measured using adigital caliper (Digimatic Caliper, Mitutoyo, Kawasaki,Japan). The resolution of the caliper was 0.01 mm and itsaccuracy was 0.02 mm. Measurement was performedten times at different locations along the z-axis of eachtube, and the mean value was used as a reference standard.
The actual dimensions of the tubes are shown in Table 1.The ranges of the inner lumen radius and the outer lumenradius were from 0.63 mm to 4.23 mm and from 1.08 mmto 6.04 mm, respectively. The range of the wall thicknesswas from 0.45 mm to 3.08 mm. Figure 1 presents thephysical phantom with and without polyurethane foam.The representative CT image of the phantom was scannedat an angle perpendicular to the axis of the tubes.
Effect of CT Parameters and Airway Size on Airway Dimension Measurement Using Full-Width-Half-Maximum Method
Korean J Radiol 9(3), June 2008 227
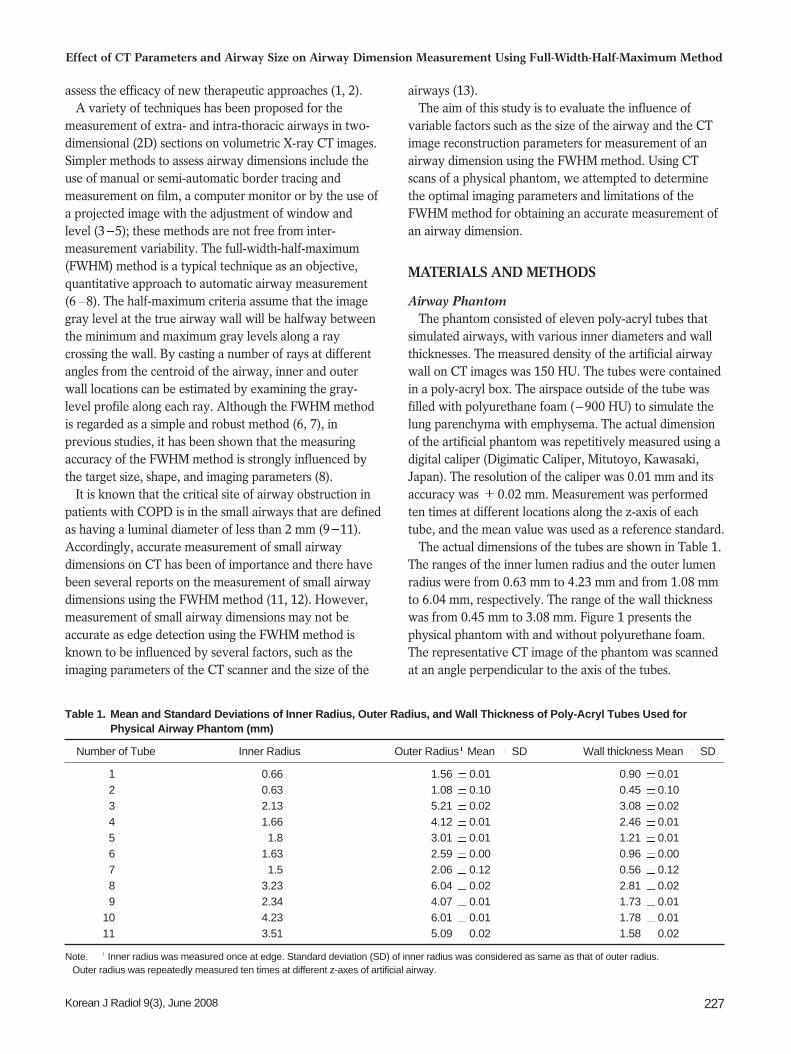
Table 1. Mean and Standard Deviations of Inner Radius, Outer Radius, and Wall Thickness of Poly-Acryl Tubes Used forPhysical Airway Phantom (mm)
Number of Tube Inner Radius Outer Radius Mean SD Wall thickness Mean SD
Note. Inner radius was measured once at edge. Standard deviation (SD) of inner radius was considered as same as that of outer radius. Outer radius was repeatedly measured ten times at different z-axes of artificial airway.
CT Imaging and Data StorageThe phantom was scanned on a 16-multi-detector row
CT scanner (Siemens Sensation 16, Siemens MedicalSolutions, Erlangen, Germany) with a 16 0.75 mmcollimator 100 effmAs, pitch 1.0 and 120 kVp, which aresimilar to the parameters of a routine chest CT scanprotocol. The CT images were reconstructed using a 512
512 matrix with every combination of the followingparameters: five different reconstruction kernels (B10f,B30f, B50f, B70f and B80f) and three different slicethicknesses (0.75, 1, and 2 mm) with a 360-mm field ofview (FOV). The B10f reconstruction kernel correspondsto a soft reconstruction kernel, the B50f reconstructionkernel corresponds to a standard reconstruction kernel andthe B80f reconstruction kernel corresponds to a sharpreconstruction kernel. In addition, data were reconstructed
in three different FOVs: 180, 270, and 360 mm(corresponding to an in-plane pixel size of 0.352 mm 0.352 mm, 0.527 mm 0.527 mm and 0.703 mm 0.703 mm, respectively), with a standard reconstructionkernel (B50f) and a 0.75-mm thickness. The resulting 2Dimage data were stored in the Digital Imaging andCommunications in Medicine (DICOM) format, theinternational standard for interconnecting medical imagingdevices on standard networks.
Data Processing and Analysis ProcedureIn-house software was developed at the Asan Medical
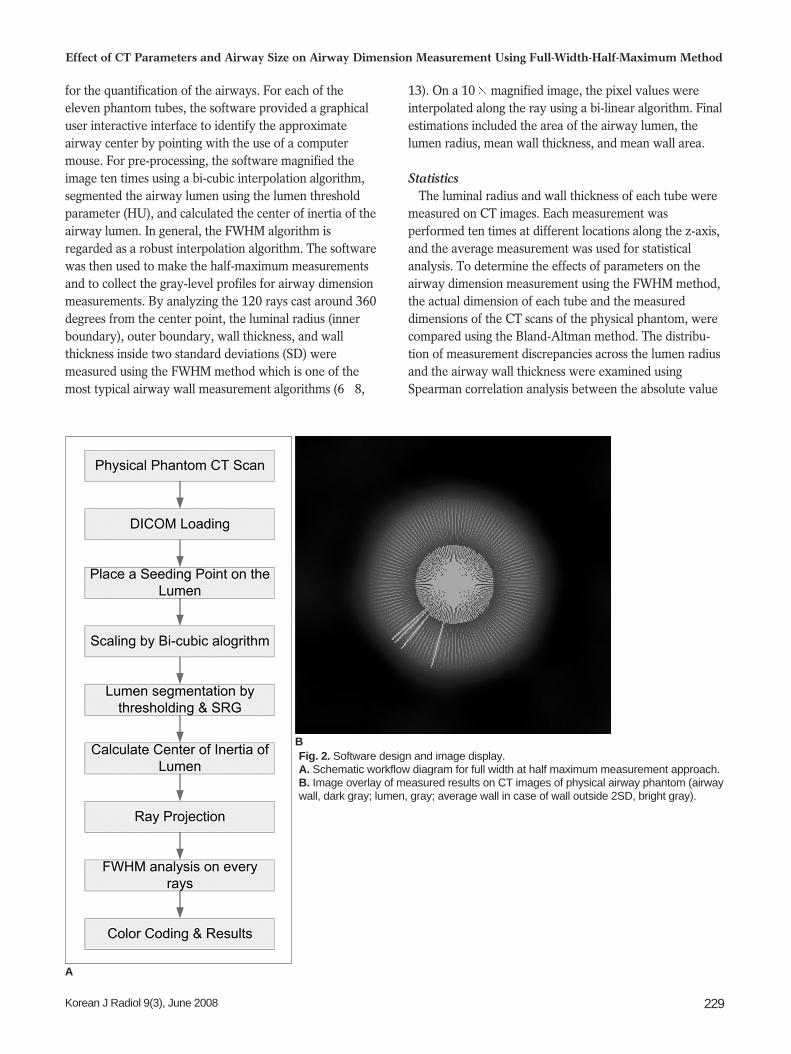
Center for airway measurement. Figure 2 shows aschematic diagram of the data processing and analysis. Thesoftware was developed for interactively analyzingpulmonary images and for providing measurement tools
Kim et al.
228 Korean J Radiol 9(3), June 2008
A
Fig. 1. Poly-acryl airway phantom and scanned CT image.A. Eleven poly-acryl artificial tubes of physical phantom withvarious inner diameters and wall thicknesses. Measured CTdensity of material was 150 HU. B. Physical phantom is filled with polyurethane foam. C. Axial CT image of phantom.
C
B
for the quantification of the airways. For each of theeleven phantom tubes, the software provided a graphicaluser interactive interface to identify the approximateairway center by pointing with the use of a computermouse. For pre-processing, the software magnified theimage ten times using a bi-cubic interpolation algorithm,segmented the airway lumen using the lumen thresholdparameter (HU), and calculated the center of inertia of theairway lumen. In general, the FWHM algorithm isregarded as a robust interpolation algorithm. The softwarewas then used to make the half-maximum measurementsand to collect the gray-level profiles for airway dimensionmeasurements. By analyzing the 120 rays cast around 360degrees from the center point, the luminal radius (innerboundary), outer boundary, wall thickness, and wallthickness inside two standard deviations (SD) weremeasured using the FWHM method which is one of themost typical airway wall measurement algorithms (6 8,
13). On a 10 magnified image, the pixel values wereinterpolated along the ray using a bi-linear algorithm. Finalestimations included the area of the airway lumen, thelumen radius, mean wall thickness, and mean wall area.
StatisticsThe luminal radius and wall thickness of each tube were
measured on CT images. Each measurement wasperformed ten times at different locations along the z-axis,and the average measurement was used for statisticalanalysis. To determine the effects of parameters on theairway dimension measurement using the FWHM method,the actual dimension of each tube and the measureddimensions of the CT scans of the physical phantom, werecompared using the Bland-Altman method. The distribu-tion of measurement discrepancies across the lumen radiusand the airway wall thickness were examined usingSpearman correlation analysis between the absolute value
Effect of CT Parameters and Airway Size on Airway Dimension Measurement Using Full-Width-Half-Maximum Method
Korean J Radiol 9(3), June 2008 229
Fig. 2. Software design and image display.A. Schematic workflow diagram for full width at half maximum measurement approach.B. Image overlay of measured results on CT images of physical airway phantom (airwaywall, dark gray; lumen, gray; average wall in case of wall outside 2SD, bright gray).
A
B
of the measurement discrepancy and the actual measure-ments. The paired t test was used to determine thepresence of a significant difference between each set ofmeasurements and the actual reference dimensions. A pvalue less than 0.01, i.e. the Bonferroni adjustment toaccount for multiple comparisons, was considered as statis-tically significant. All other statistical tests were performedusing Statistica 7.0 (StatSoft, Tulsa, OK).
RESULTS
Feasibility of Airway Dimension Measurement Usingthe FWHM Method
In cases of the use of the smoother reconstruction kernels(B10f, and B30f), the small airway lumen and wallthickness of the first and second tubes could not bemeasured. A severe partial volume effect made the profileof these tubes, which have a lumen radius of less than 0.66mm, unrepresentative of the typical curve of the airwaylumen and wall. Therefore, these measurements weretreated as missing measurements. In addition, all of themeasurements of the first and second tubes were excludedin all statistical tests, as there is a measurement limitationof the spatial resolution of MDCT below a 1-mm wallthickness with the use of the FWHM method (Fig. 3).
Airway Wall ThicknessEffect of the CT Reconstruction Kernels
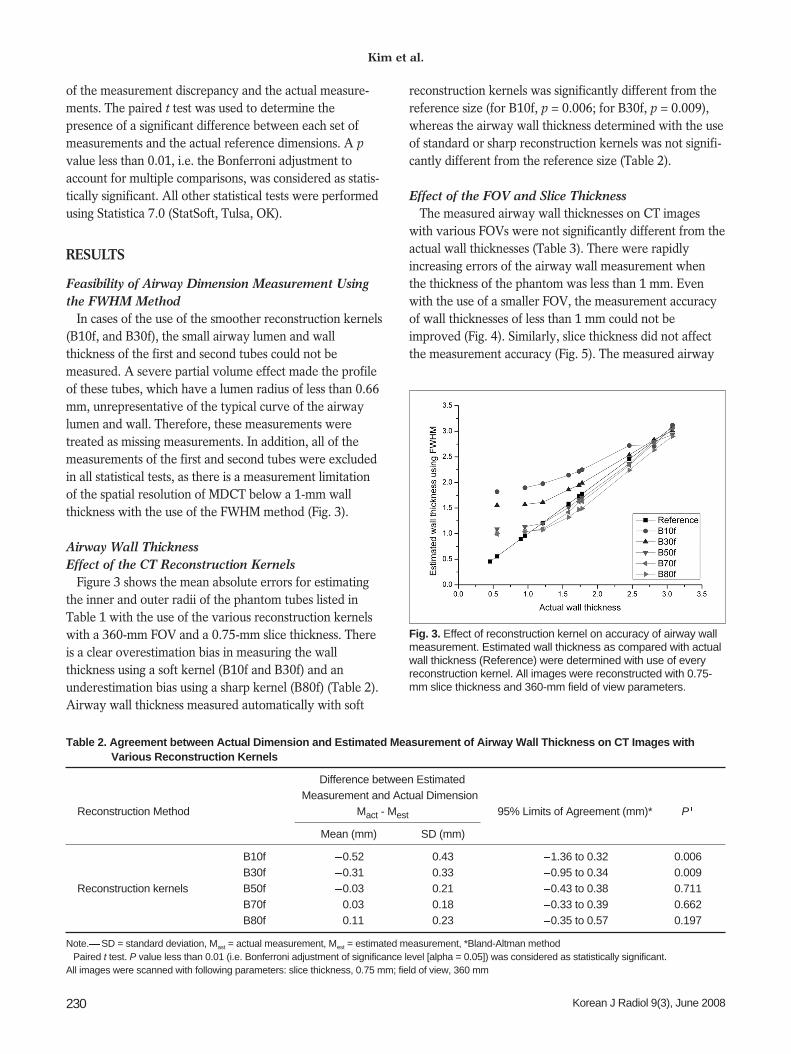
Figure 3 shows the mean absolute errors for estimatingthe inner and outer radii of the phantom tubes listed inTable 1 with the use of the various reconstruction kernelswith a 360-mm FOV and a 0.75-mm slice thickness. Thereis a clear overestimation bias in measuring the wallthickness using a soft kernel (B10f and B30f) and anunderestimation bias using a sharp kernel (B80f) (Table 2).Airway wall thickness measured automatically with soft
reconstruction kernels was significantly different from thereference size (for B10f, p = 0.006; for B30f, p = 0.009),whereas the airway wall thickness determined with the useof standard or sharp reconstruction kernels was not signifi-cantly different from the reference size (Table 2).
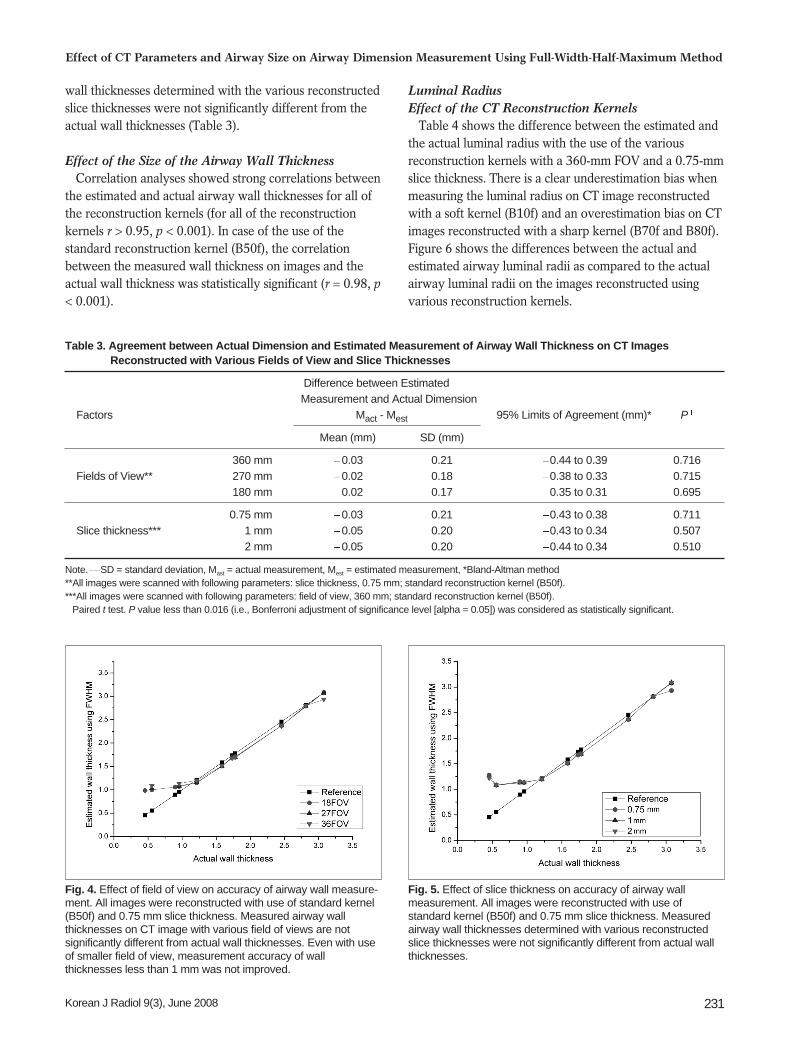
Effect of the FOV and Slice ThicknessThe measured airway wall thicknesses on CT images
with various FOVs were not significantly different from theactual wall thicknesses (Table 3). There were rapidlyincreasing errors of the airway wall measurement whenthe thickness of the phantom was less than 1 mm. Evenwith the use of a smaller FOV, the measurement accuracyof wall thicknesses of less than 1 mm could not beimproved (Fig. 4). Similarly, slice thickness did not affectthe measurement accuracy (Fig. 5). The measured airway
Kim et al.
230 Korean J Radiol 9(3), June 2008
Table 2. Agreement between Actual Dimension and Estimated Measurement of Airway Wall Thickness on CT Images withVarious Reconstruction Kernels
Difference between Estimated Measurement and Actual Dimension
Reconstruction Method Mact - Mest 95% Limits of Agreement (mm)* P
Mean (mm) SD (mm)
B10f 0.52 0.43 1.36 to 0.32 0.006B30f 0.31 0.33 0.95 to 0.34 0.009
Reconstruction kernels B50f 0.03 0.21 0.43 to 0.38 0.711B70f 0.03 0.18 0.33 to 0.39 0.662B80f 0.11 0.23 0.35 to 0.57 0.197
Note. SD = standard deviation, Mast = actual measurement, Mest = estimated measurement, *Bland-Altman methodPaired t test. P value less than 0.01 (i.e. Bonferroni adjustment of significance level [alpha = 0.05]) was considered as statistically significant.
All images were scanned with following parameters: slice thickness, 0.75 mm; field of view, 360 mm
Fig. 3. Effect of reconstruction kernel on accuracy of airway wallmeasurement. Estimated wall thickness as compared with actualwall thickness (Reference) were determined with use of everyreconstruction kernel. All images were reconstructed with 0.75-mm slice thickness and 360-mm field of view parameters.
wall thicknesses determined with the various reconstructedslice thicknesses were not significantly different from theactual wall thicknesses (Table 3).
Effect of the Size of the Airway Wall ThicknessCorrelation analyses showed strong correlations between
the estimated and actual airway wall thicknesses for all ofthe reconstruction kernels (for all of the reconstructionkernels r > 0.95, p < 0.001). In case of the use of thestandard reconstruction kernel (B50f), the correlationbetween the measured wall thickness on images and theactual wall thickness was statistically significant (r = 0.98, p< 0.001).
Luminal RadiusEffect of the CT Reconstruction Kernels
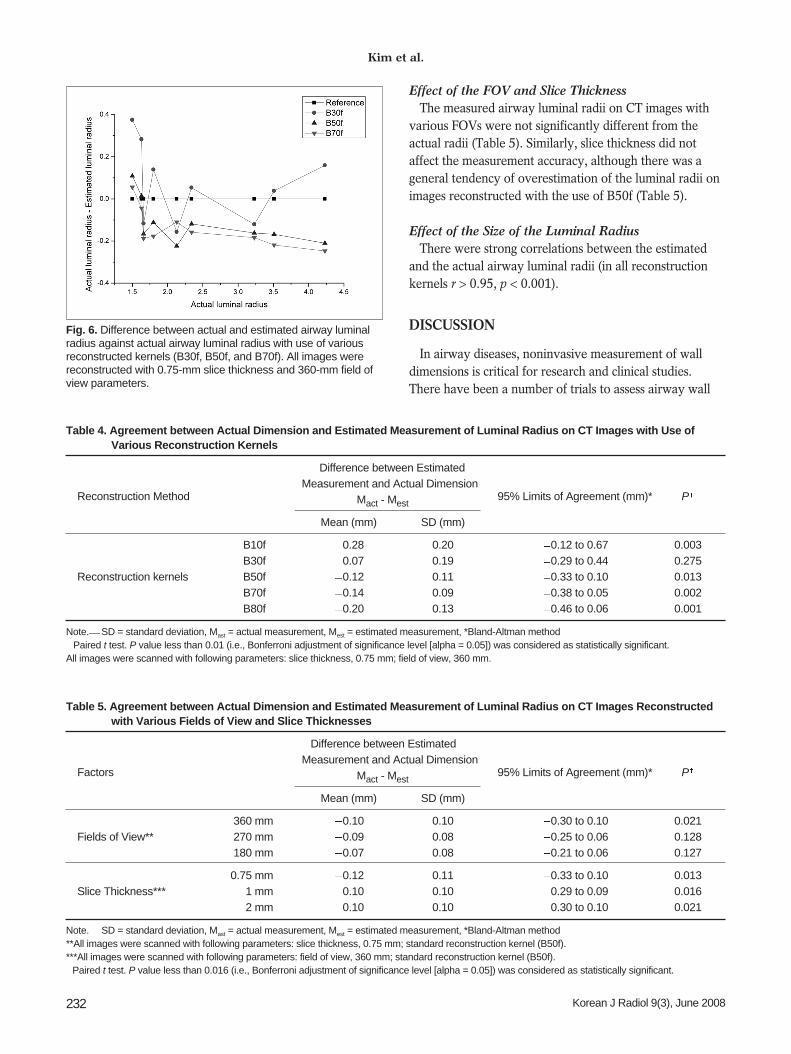
Table 4 shows the difference between the estimated andthe actual luminal radius with the use of the variousreconstruction kernels with a 360-mm FOV and a 0.75-mmslice thickness. There is a clear underestimation bias whenmeasuring the luminal radius on CT image reconstructedwith a soft kernel (B10f) and an overestimation bias on CTimages reconstructed with a sharp kernel (B70f and B80f).Figure 6 shows the differences between the actual andestimated airway luminal radii as compared to the actualairway luminal radii on the images reconstructed usingvarious reconstruction kernels.
Effect of CT Parameters and Airway Size on Airway Dimension Measurement Using Full-Width-Half-Maximum Method
Korean J Radiol 9(3), June 2008 231
Fig. 5. Effect of slice thickness on accuracy of airway wallmeasurement. All images were reconstructed with use ofstandard kernel (B50f) and 0.75 mm slice thickness. Measuredairway wall thicknesses determined with various reconstructedslice thicknesses were not significantly different from actual wallthicknesses.
Fig. 4. Effect of field of view on accuracy of airway wall measure-ment. All images were reconstructed with use of standard kernel(B50f) and 0.75 mm slice thickness. Measured airway wallthicknesses on CT image with various field of views are notsignificantly different from actual wall thicknesses. Even with useof smaller field of view, measurement accuracy of wallthicknesses less than 1 mm was not improved.
Table 3. Agreement between Actual Dimension and Estimated Measurement of Airway Wall Thickness on CT ImagesReconstructed with Various Fields of View and Slice Thicknesses
Difference between Estimated Measurement and Actual Dimension
Factors Mact - Mest 95% Limits of Agreement (mm)* P
Mean (mm) SD (mm)
360 mm 0.03 0.21 0.44 to 0.39 0.716Fields of View** 270 mm 0.02 0.18 0.38 to 0.33 0.715
180 mm 0.02 0.17 0.35 to 0.31 0.695
0.75 mm 0.03 0.21 0.43 to 0.38 0.711Slice thickness*** 1 mm 0.05 0.20 0.43 to 0.34 0.507
2 mm 0.05 0.20 0.44 to 0.34 0.510
Note. SD = standard deviation, Mast = actual measurement, Mest = estimated measurement, *Bland-Altman method**All images were scanned with following parameters: slice thickness, 0.75 mm; standard reconstruction kernel (B50f).***All images were scanned with following parameters: field of view, 360 mm; standard reconstruction kernel (B50f).
Paired t test. P value less than 0.016 (i.e., Bonferroni adjustment of significance level [alpha = 0.05]) was considered as statistically significant.
Effect of the FOV and Slice ThicknessThe measured airway luminal radii on CT images with
various FOVs were not significantly different from theactual radii (Table 5). Similarly, slice thickness did notaffect the measurement accuracy, although there was ageneral tendency of overestimation of the luminal radii onimages reconstructed with the use of B50f (Table 5).
Effect of the Size of the Luminal RadiusThere were strong correlations between the estimated
and the actual airway luminal radii (in all reconstructionkernels r > 0.95, p < 0.001).
DISCUSSION
In airway diseases, noninvasive measurement of walldimensions is critical for research and clinical studies.There have been a number of trials to assess airway wall
Kim et al.
232 Korean J Radiol 9(3), June 2008
Table 5. Agreement between Actual Dimension and Estimated Measurement of Luminal Radius on CT Images Reconstructedwith Various Fields of View and Slice Thicknesses
Difference between Estimated Measurement and Actual Dimension
Factors Mact - Mest 95% Limits of Agreement (mm)* P
Mean (mm) SD (mm)
360 mm 0.10 0.10 0.30 to 0.10 0.021Fields of View** 270 mm 0.09 0.08 0.25 to 0.06 0.128
180 mm 0.07 0.08 0.21 to 0.06 0.127
0.75 mm 0.12 0.11 0.33 to 0.10 0.013Slice Thickness*** 1 mm 0.10 0.10 0.29 to 0.09 0.016
2 mm 0.10 0.10 0.30 to 0.10 0.021
Note. SD = standard deviation, Mast = actual measurement, Mest = estimated measurement, *Bland-Altman method**All images were scanned with following parameters: slice thickness, 0.75 mm; standard reconstruction kernel (B50f).***All images were scanned with following parameters: field of view, 360 mm; standard reconstruction kernel (B50f).
Paired t test. P value less than 0.016 (i.e., Bonferroni adjustment of significance level [alpha = 0.05]) was considered as statistically significant.
Fig. 6. Difference between actual and estimated airway luminalradius against actual airway luminal radius with use of variousreconstructed kernels (B30f, B50f, and B70f). All images werereconstructed with 0.75-mm slice thickness and 360-mm field ofview parameters.
Table 4. Agreement between Actual Dimension and Estimated Measurement of Luminal Radius on CT Images with Use ofVarious Reconstruction Kernels
Difference between Estimated Measurement and Actual Dimension
Reconstruction Method Mact - Mest 95% Limits of Agreement (mm)* P
Mean (mm) SD (mm)
B10f 0.28 0.20 0.12 to 0.67 0.003B30f 0.07 0.19 0.29 to 0.44 0.275
Reconstruction kernels B50f 0.12 0.11 0.33 to 0.10 0.013B70f 0.14 0.09 0.38 to 0.05 0.002B80f 0.20 0.13 0.46 to 0.06 0.001
Note. SD = standard deviation, Mast = actual measurement, Mest = estimated measurement, *Bland-Altman methodPaired t test. P value less than 0.01 (i.e., Bonferroni adjustment of significance level [alpha = 0.05]) was considered as statistically significant.
All images were scanned with following parameters: slice thickness, 0.75 mm; field of view, 360 mm.
dimensions by the use of high resolution CT (HRCT) inasthma and COPD (12, 14 22). Recently, MDCT has beenshown to provide volumetric data of the whole lung.However, in previous studies various methods of imageacquisition and measurement were used (12, 14 22). Inmost studies, airway dimensions were measured by semi-quantitative assessment by manual tracing of the inner-and outer-perimeter of an airway wall on film, a computermonitor or by a projected image with the adjustment ofwindow and level (14, 17 19). By this semi-quantitativemethod, problems occurred when small bronchi weremeasured as the interfaces between the lumen, wall andlung parenchyma became more difficult for the operator todefine as they became increasingly indistinct. Therefore,there is a need to standardize the CT protocols andmeasurement methods.
Nakano and coworkers measured airway dimensions in114 smokers by the use of an automatic computerizedmethod using the “full width at half maximum (FWHM)”principle (16). The FWHM method is one of quantitativemethods of automatic airway measurement.
This study has shown that among the evaluated CTparameters, the reconstruction kernel is the mostimportant for accurate measurement of airway dimensions,and this is in concordance with the results of a previousstudy (12). As measurements of airway dimensions arebased on the determination of the half-level of the CTdensity profile, the choice of reconstruction kernel maylargely affect the accuracy of the measurement. The CTdensity profile is broadened by use of a softer reconstruc-tion kernel, which results in an overestimation of theairway wall thickness and underestimation of the lumendiameter (23). In addition, the actual size of the airwayalso influenced the accuracy of measurement, becauselimitation of spatial resolution results in broadening the CTdensity profile. The correlation study of the measurementerror and the actual airway wall dimension indicate that athinner wall thickness and softer reconstruction kernelresult in an overestimation of the wall thickness. Thecurrent study shows that the most accurate luminal radiusand wall thickness may be obtained by use of a standardkernel (B50f); these results are similar to the findings of aprevious report (12).
There has been increasing interest on the measurementof smaller airways as it has been recognized that thecritical site of airway obstruction in patients with COPD isin small airways that are defined as less than 2 mm in theluminal diameter (9 11). Accordingly, accurate measure-ment of small airway dimensions on CT has been consid-ered as important and there have been several reports onthe measurement of the small airway dimensions using the
FWHM method (11 13). It is important to acknowledgethe limitation of an airway thickness above which anaccurate or reliable measurement can be acquired.Hasegawa et al. (12) determined that airway dimensionscan be measured if the airway has an inner diameter largerthan 2 mm located anywhere in the lung. These investiga-tors focused a phantom study on defining the measurableinner diameter rather than the measurable wall thickness.In the present study, we showed that airways with a wallthickness of less than 1 mm could not be accuratelyassessed using current CT techniques. Anatomically,airways that are 1 mm in wall thickness correspond to thesixth level of airways in humans (1). This finding suggeststhat the FWHM method can be used in the fourth to fifthgeneration segmental airways in clinical practice.
To overcome the limitation of spatial resolution, weadopted the use of the bi-cubic interpolation technique, bywhich the number of pixels of a given region of interest(ROI) were increased by 100 fold. However, limitation ofspatial resolution could not be improved. Interestingly, theaccuracy was not improved even when the FOV wasreduced to 180 mm. This limitation seems to stem from themechanical limitations of CT. Therefore, an airway with awall thickness less than 1 mm is not accurately measuredusing the FWHM method with current clinical CTequipment (24). The slice thickness did not affect themeasurement accuracy of the wall thickness, which wasexpected, as the phantom was placed perpendicular to thegantry orientation. If the airway is oriented obliquely tothe imaging plane, these parameters also affect themeasurement accuracy (25).
McNamara et al. (26) measured airway dimensions usingHRCT in the excised canine lung and this experimentalstudy suggested that HRCT might allow measurement ofairway wall thickness and determination of the site ofairway narrowing in patients with asthma. Several investi-gators have attempted to measure airway dimensions bythe use of HRCT and to demonstrate a correlation betweenairway wall thickness and pulmonary function in asthmaand COPD (12, 14 22). In asthmatic patients, manystudies have shown a good correlation between airwaydimensions and clinical functional parameters in variousclinical settings (14, 15, 17, 18). In COPD patients, it isknown that the extent of emphysema can only partiallypredict the severity of the pulmonary functional changes(27, 28). Several studies have shown that pulmonaryfunction abnormalities are more accurately predicted by acombined evaluation of the extent of low attenuation areasor emphysema as well as by the airway wall thickeningseen on HRCT (12, 16, 20). In addition, by combining theinformation of the lung density and airway dimensions,
Effect of CT Parameters and Airway Size on Airway Dimension Measurement Using Full-Width-Half-Maximum Method
Korean J Radiol 9(3), June 2008 233
sub-grouping of the COPD patients into airway dominantor emphysema dominant types may be possible, which canbe important to optimize the treatment strategy (29).
There are several limitations to this study. First, thedensity of tubes used for the phantom is higher than that ofreal airways and this may affect the results. However, theFWHM method is known to be resistant to the densitydifferences of various measured materials. Second, theresults of this study regarding the threshold of a measur-able airway may not be transferred directly to clinical CTimages, as there are additional factors that hamper theaccurate measurement of airway dimensions, such ascardiac motion, respiratory motion, and mucosal edema orsecretions. Lastly, we have used a CT scanner for thisstudy. There may be a difference in results with use ofdifferent CT equipment from different manufacturers,although the difference would be small because as eachmanufacturer uses similar reconstruction kernels and otherimaging parameters.
In conclusion, the accuracy of airway wall measurementusing the FWHM method is strongly influenced by thereconstruction kernel. Due to the limits of spatial resolu-tion using MDCT and to the partial volume effect, anairway wall thickness less than 1 mm could not beaccurately measured. For clinically acceptable measure-ment of airway dimensions, CT images should bereconstructed using the standard kernel.
AcknowledgmentsThis work was supported by a Korea Science and
Engineering Foundation (KOSEF) grant funded by theKorea government (MOST) (No. R01-2006-000-11244-0).
References1. Weibel ER, Taylor CR. Design and structure of human lung. In:
Pulmonary disease and disorders. New York: McGraw-Hill,1988:11-60
2. Barnes PJ, Hansel TT. Prospects for new drugs for chronicobstructive pulmonary disease. Lancet 2004;364:985-996
3. Schwab RJ, Gefter WB, Pack AI, Hoffman EA. Dynamicimaging of the upper airway during respiration in normalsubjects. J Appl Physiol 1993;74:1504-1514
4. Amirav I, Kramer SS, Grunstein MM, Hoffman EA. Assessmentof methacholine-induced airway constriction by ultrafast high-resolution computed tomography. J Appl Physiol 1993;75:2239-2250
5. Brown RH, Herold CJ, Hirshman CA, Zerhouni EA, Mitzner W.Individual airway constrictor response heterogeneity tohistamine assessed by high-resolution computed tomography. JAppl Physiol 1993;74:2615-2620
6. Block M, Liu YH, Harris LD, Robb RA, Ritman EL. Quantitativeanalysis of a vascular tree model with the dynamic spatialreconstructor. J Comput Assist Tomogr 1984;8:390-400
7. Wood SA, Zerhouni EA, Hoford JD, Hoffman EA, Mitzner W.
Measurement of three-dimensional lung tree structures by usingcomputed tomography. J Appl Physiol 1995;79:1687-1697
8. King MA, Long DT, Brill AB. SPECT volume quantitation:influence of spatial resolution, source size and shape, and voxelsize. Med Phys 1991;18:1016-1024
9. Van Brabandt H, Cauberghs M, Verbeken E, Moerman P,Lauweryns JM, Van de Woestijne KP. Partitioning ofpulmonary impedance in excised human and canine lungs. JAppl Physiol 1983;55:1733-1742
10. Yanai M, Sekizawa K, Ohrui T, Sasaki H, Takishima T. Site ofairway obstruction in pulmonary disease: direct measurement ofintrabronchial pressure. J Appl Physiol 1992;72:1016-1023
11. Nakano Y, Wong JC, de Jong PA, Buzatu L, Nagao T, CoxsonHO, et al. The prediction of small airway dimensions usingcomputed tomography. Am J Respir Crit Care Med2005;171:142-146
12. Hasegawa M, Nasuhara Y, Onodera Y, Makita H, Nagai K, FukeS, et al. Airflow limitation and airway dimensions in chronicobstructive pulmonary disease. Am J Respir Crit Care Med2006;173:1309-1315
14. Awadh N, Muller NL, Park CS, Abboud RT, FitzGerald JM.Airway wall thickness in patients with near fatal asthma andcontrol groups: assessment with high resolution computedtomographic scanning. Thorax 1998;53:248-253
15. Niimi A, Matsumoto H, Amitani R, Nakano Y, Mishima M,Minakuchi M, et al. Airway wall thickness in asthma assessed bycomputed tomography. Relation to clinical indices. Am J RespirCrit Care Med 2000;162:1518-1523
16. Nakano Y, Muro S, Sakai H, Hirai T, Chin K, Tsukino M, et al.Computed tomographic measurements of airway dimensionsand emphysema in smokers. Correlation with lung function. AmJ Respir Crit Care Med 2000;162:1102-1108
18. Little SA, Sproule MW, Cowan MD, Macleod KJ, Robertson M,Love JG, et al. High resolution computed tomographic assess-ment of airway wall thickness in chronic asthma: reproducibilityand relationship with lung function and severity. Thorax2002;57:247-253
19. Gono H, Fujimoto K, Kawakami S, Kubo K. Evaluation ofairway wall thickness and air trapping by HRCT in asympto-matic asthma. Eur Respir J 2003;22:965-971
20. Aziz ZA, Wells AU, Desai SR, Ellis SM, Walker AE,MacDonald S, et al. Functional impairment in emphysema:contribution of airway abnormalities and distribution ofparenchymal disease. AJR Am J Roentgenol 2005;185:1509-1515
21. Orlandi I, Moroni C, Camiciottoli G, Bartolucci M, Pistolesi M,Villari N, et al. Chronic obstructive pulmonary disease: thin-section CT measurement of airway wall thickness and lungattenuation. Radiology 2005;234:604-610
22. Lee YK, Oh YM, Lee JH, Kim EK, Lee JH, Kim N, et al.Quantitative assessment of emphysema, airtrapping, and airwaythickening on computed tomography. Lung, in press, DOI:10.1007/S00408-008-9071-0
24. Rollano-Hijarrubia E, Stokking R, van der Meer F, Niessen WJ.
Kim et al.
234 Korean J Radiol 9(3), June 2008
Effect of CT Parameters and Airway Size on Airway Dimension Measurement Using Full-Width-Half-Maximum Method
Korean J Radiol 9(3), June 2008 235
Imaging of small high-density structures in CT: a phantomstudy. Acad Radiol 2006;13:893-908
25. Kim N, Seo JB, Song KS, Chae EJ, Kang SH. Semi-automaticmeasurement of the airway dimension at computed tomographyusing the full-with-half-maximum method: study on themeasurement accuracy according to orientation of an artificialairway. Korean J Radiol 2008;9:236-242
27. Gelb AF, Hogg JC, Muller NL, Schein MJ, Kuei J, Tashkin DP,et al. Contribution of emphysema and small airways in COPD.Chest 1996;109:353-359
28. Gelb AF, Zamel N, Hogg JC, Muller NL, Schein MJ.Pseudophysiologic emphysema resulting from severe small-airways disease. Am J Respir Crit Care Med 1998;158:815-819