RADIATION PATTERNS OF SEISMIC SURFACE WAVES FROM NUCLEAR EXPLOSIONS by Harold Henry Kehrer B.S., Tufts University (1968) Submitted in Partial Fulfillment of the Requirements for the Degree of Master of Science at the Massachusetts Institute of Technology September, 1969 Signature of Author.... - .........-......... ... ... Department of Geology and Geophysics, July 18, 1969 Certified by. *Thesis Supervisor Thesis~ Supervisor Accepted by... Chairman, Chairman, Departmental Committee on Graduate Students Indge SEMI . ~___ __~ __ ^ ___~ 111^1__ ___1 -.-I-.__-_ -- I- ~~- ~---~~-- --- ^L- .^-- --- ^ -- _. -X -X...-^r~l-.II-_. -^ II--~_.---~~ Il.-l-X l_. . S-.f1 v_ /7 Y .
Transcript
RADIATION PATTERNS OF SEISMIC SURFACE WAVES
FROM NUCLEAR EXPLOSIONS
by
Harold Henry Kehrer
B.S., Tufts University(1968)
Submitted in Partial Fulfillment
of the Requirements for the
Degree of Master of
Science
at the
Massachusetts Institute ofTechnology
September, 1969
Signature of Author.... - .........-......... ... ...Department of Geology and Geophysics, July 18, 1969
Submitted to the Department of Geology and Geophysics onJuly 18, 1969 in partial fulfillment of the requirement for
the degree of Master of Science
ABSTRACT
The source mechanism of underground nuclear explosionsis studied by considering a composite source. An orthogonaldouble-couple superimposed on an isotropic explosive sourceadequately accounts for the observed Love waves. The rela-tive strength of the double-couple component and the azimuthof the fault plane at the source are determined for elevenexplosions by fitting the Love over Rayleigh wave amplituderadiation pattern. The fault plane azimuths of explosionsin the Pahute Mesa portion of the Nevada Test Site aresimilar to the orientations of the local faults. Explosionsin Yucca Flat show a possible dependence on the Yucca Faultsystem and on joint trends in the surrounding bedrock. Ingereral, the agreement appears more than coincidental andtends to support the hypothesis that regional strain isreleased by nuclear explosions. The relative strength ofthe double-couple depends upon rock type and shot depth.
Thesis Supervisor: M. Nafi Toks8zTitle: Associate Professor of Geophysics
Aki K., p. Reasenberg, T. DeFazio and Y. Tsai (1969).Near-field and Far-Field Seismic Evidences for Trig-gering of an Earthquake by the Benham Explosion,paper presented at the annual meeting of the AGU,April, 1969.
Badgley, P. C. (1965). Structural and Tectonic Principles,Harper and Row, N.Y.
Barosh, P. J. (1968). Relationship of Explosion-producedFracture Patterns to Geologic Structure in YuccaFlat, Nevada Test Site, Geol. Soc. Am. Mem. 110,Nevada Test Site, 199-217.
Ben-Menahem, A. and D. G. Harkrider (1964). RadiationPatterns of Seismic Surface Waves From Buried DipolarPoint Sources in a Flat Stratified Earth, J. Geophys.Res. 6, 2605-2620.
Boore, D. M. and M. N. Toks8z (1969). Rayleigh WaveParticle Motion and Crustal Structure, Bull. Seism.Soc. Am. 22, 331-346.
Brune, J. N. and P. W. Pomeroy (1963). Surface Wave Radia-tion Patterns for Underground Nuclear Explosions andSmall-magnitude Earthquakes, J. Geophys. Res. 68,5005-5028.
Dickey, D. D. (1968). Fault Displacement as a Result ofUnderground Nuclear Explosions, Geol. Soc. Am. Mem.110, Nevada Test Site, 219-232.
Ekren, E. B. (1968). Geologic Setting of Nevada Test Siteand Nellis Air Force Range, Geol. Soc. Am. Mem. 110,Nevada Test Site, 11-19.
Healey, D. L. (1968). Application of Gravity Data toGeologic Problems at Nevada Test Site, Geol. Soc. Am.Mem 110, Nevada Test Site, 147-156.
Hoover, D. L. (1968). Genesis of Zeolites, Nevada TestSite, Geol. Soc. Am. Mem. 110, Nevada Test Site,275-284.
Johnson, M. S. and D. E. Hibbard (1957). Geology of theAtomic Energy Commission Nevada Proving Grounds Area,Nevada, USGS Bull. 1021-K, 333-384.
Longwell, C. R. (1960). Possible Explanation of DiverseStructural Patterns in Southern Nevada, Am. Jour.Sci, 258,A (Bradley Volume), 192-203.
McKeown, F. A., P. P. Orkild, D. D. Dickey and R. P. Snyder(1966). Some Geologic Data Pertinent to the SeismicCharacteristics of Pahute Mesa, USGS Tech-letter:Sg. Std. I-4A.
Press, F. and C. Archambeau (1962). Release of TectonicStrain by Underground Nuclear Explosions, J. Geophys.Res. 6, 337-343.
Surface Wavesfrom Underground Explosions, Proceedings of the VESIACConference on the Current Status and Future Prognosisfor Understanding the Source Mechanism of ShallowSeismic Events in the 3 to 5 Magnitude Range, Reportof VESIAC 7885-1-X, Willow Run Laboratories, 65-83.
_ _~ __~___j I_/_I1 I ______LII~~_ ____U_____ ~1~_111 I
-27-
Toksbz, M. N. and K. Clermont (1967). Radiation of SeismicWaves from the Bilby Explosion, SDL Report No. 183.
Toks8z, M. N., D. G. Harkrider and A. Ben-Menahem (1965).Determination of Source Parameters by AmplitudeEqualization of Seismic Surface Waves 2. Release ofTectonic Strain by Underground Nuclear Explosions andMechanism of Earthquakes, J. Geophys. Res. 70, 907-922.
11_1_ _~(1~ __I1LL__I_~~~X__I_~____1____1_111~
-28-
Table 1. EXPLOSION I FORMATION
f
ORIGIN TIMEGMT
LOCATIONN. LAT. Wi LONG.
SHOTDEPTH
MEDIUMEQUIV.
ft MAGNITUDE
Cup
Bronze
Corduroy
Buff
Duryea
Chartreuse
Tan
Half Beak
Greeley
Faultless
Boxcar
3-26-65
7-23-65
12-03-65
12-16-65
4-14-66
5-06-66
6-03-66
6-30-66
12-20-66
1-19-68
4-26-68
15:34:08.2
17:00:00.0
15:13:02.1
19:15:00.0
14:13:43.1
15:00:00.1
14:00:00.0
22:15:00.1
15:30:00.1
18:15:00.1
15:00:00.0
3708'51"
3705 '52"
37'09'53"
37'04'21"
37"14 ' 34"
37"20'53"
37004 '06"
37°18'57"
37"18'07"
38"38 '03"
37"17'44"
1 "02'34"
1 '01'59"
16*03'08"
I'01 '45"
1 '25'51"
16"14'19"
160o2'07"
1" 17'56"
16"24'30"
16"12'55"
16027'21"
Tuff
Tuff
Tuff
Tuf f
Rayolite
Ihyolite
Tuff
Rhyolite
kZolitizedTuf f
Water Satura-tod Tuff
Rhyollte
EVENT DATE
1.
2.
3.
4.
5.
6.
7.
8.
9.
10.
11.
2470
1750
2248
1650
1795
a
1840
2884
4040
3200
3800
5.25
5.22
5.62
5.14
5.17
5.2
5.56
6.02
6.29
6.25
6.14
-- I I -r A
J64 V A g "M 46 dh &.0 WA . -dhk o w- -W 0
-29-
Table 2. FAULT PLANE SOLUTIOS
MIN. DEV.mI PO" AfmA
PARTDOUBLE- RT.-LATERAL FAULT PLANE
AZIMUTH 1 AZIMUTH 2
DIFF. INFROM DAT,
AZIMUTHS
1. Cup
2. Bronze
3. Corduroy
4. Buff
5. Duryea
6. Chartreuse
7. Tan
8. Half Beak
9. Greeley
10. Faultless
5.25
5.22
5.62
5.14
5.17
2470
1750
2248
1650
1795
5.2
5.56
6.02
6.29
6.25
1840
2884
4040
3200
Tuff
Tuff
Tuff
Tuff
Rhyolite
Rhyolite
Tuff
Rhyolite
ZeolitizedTuff
Water Satura-ted Tuff
.50
.20
.44
.20
.33
.33
.23
.56
1 .31
.16
.6o
.36
.60
.38
.56
.63
.36
.57
.90
.36
112"
13"
166
28"
168"
179"
154"
160'
180"
102"
22"
94"
720
111"
30"
650
260
95"
80
.05
0.00
.10
.05
.05
.10
.01
.02
.05
85 .10Rhyolite .28 .45 160'
EQUIV.O DEPTH.e+
DEV.L OF&2
xyR~tgg I
EVENT MAU. It jMEIUM F-VI DA A tj dVI ". - ' A L VA... .UL/'IT"IIlr"I ,M
11. Boxcar 6.14 3800
-30-
FIGURE CAPTIONS
Fig. 1. Rayleigh waves from the Greeley explosion on long-period vertical component at Resolute Bay, Canada.
Fig. 2. Love and Rayleigh waves from the Greeley explosionon long-period north-south component at ResoluteBay, Canada.
Fig. 3. Love waves from the Greeley explosion on long-period east-west component at Resolute Bay, Canada.
Fig. 4. Contour plot of deviations of combinations of partdouble-couple and fault plane azimuth from exper-imental data for the explosion Corduroy. Experi-mental data not smoothed. Scale factor, S=1 .25.
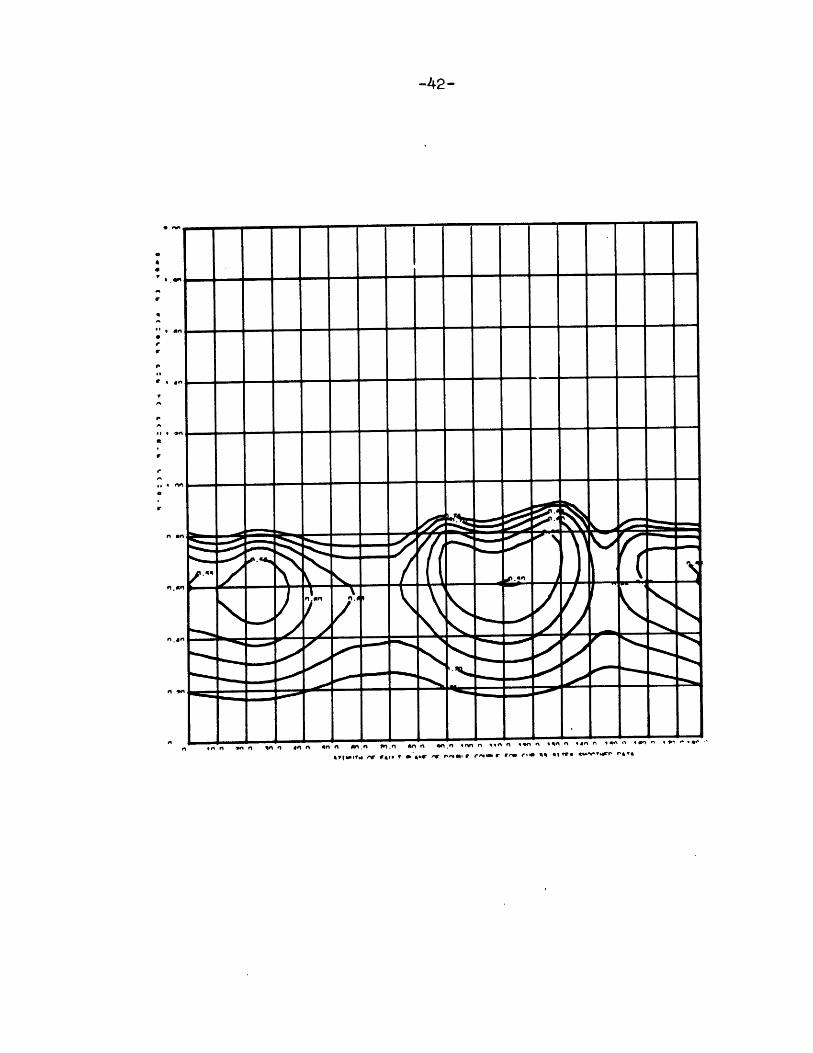
Figs. 5 - 15. Contour plots of deviations of combinationsof part double-couple and fault plane azimuth fromexperimental data for eleven explosions. Experi-mental data smoothed. S=1.25.
Fig. 5. Cup.
Fig. 6. Bronze.
Fig. 6a. Bronze, finer contour.
Fig. 7. Corduroy.
Fig. 8. Buff.
Fig. 9. Duryea.
Fig. 10. Chartreuse.
Fig. 11. Tan.
Fig. 11a. Tan, finer contour.
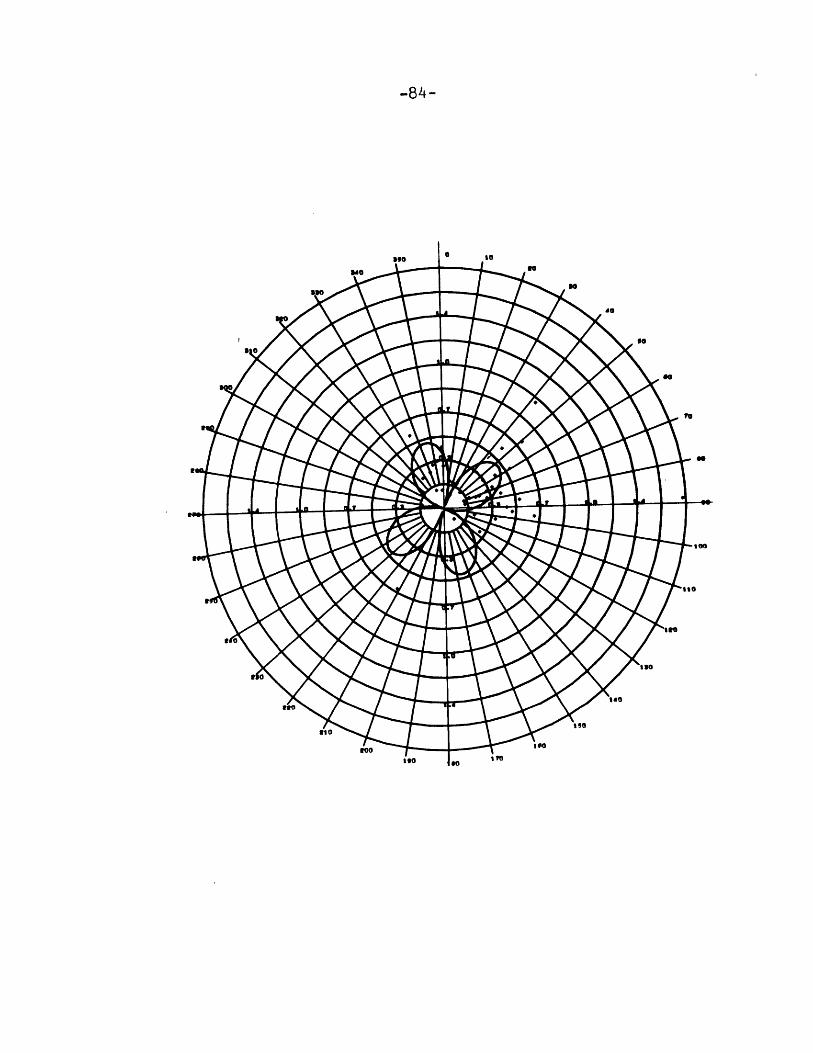
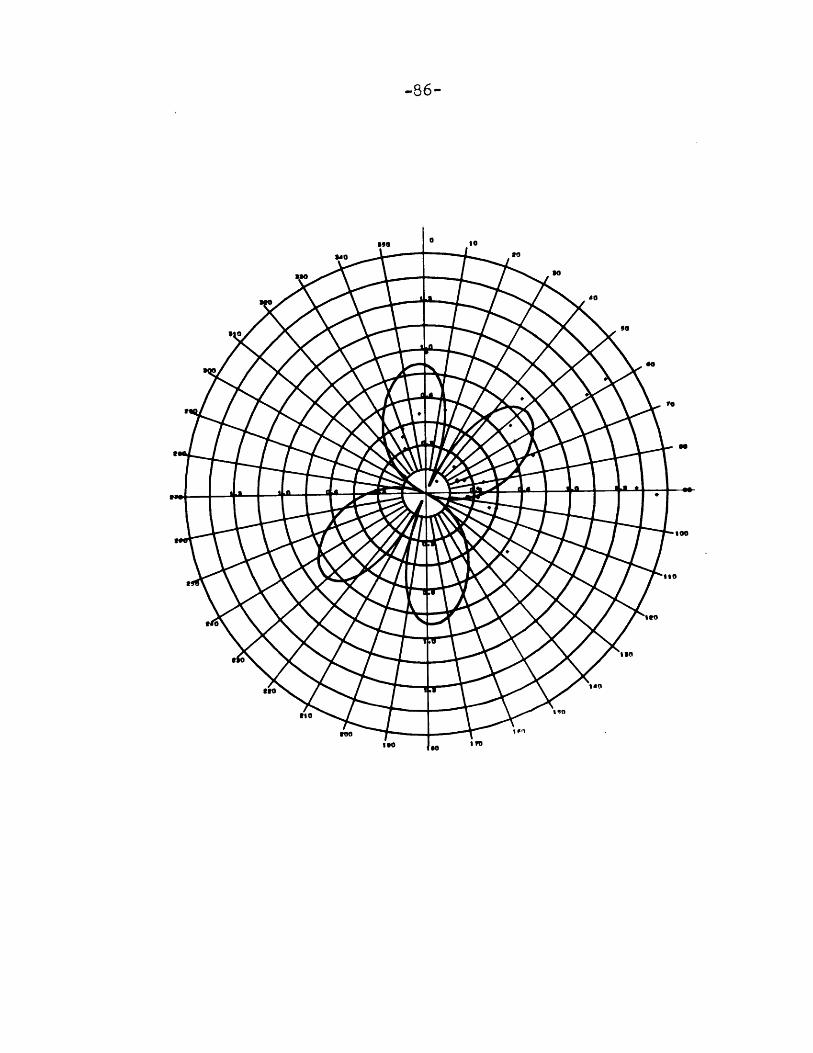
Fig. 12. Half Beak.
Fig. 12a. Half Beak, finer contour.
Fig. 13. Greeley.
Fig. 14. Faultless.
Fig. 15. Boxcar.
-31-
Fig. 16.
Figs. 17
L/R radiation pattern produced by either a right-lateral strike-slip fault at 166 degrees or aleft-lateral strike-slip fault at 76 degrees.
- 27. L/R radiation patterns for vertical strike-slip faults for eleven explosions. Scale factor,S=1.25. Fault orientation T is that of the bestfitting right-lateral fault for each explosion.F is the part double-couple. Crosses are experi-mental (unsmoothed) points. Numbers at edge aredata points which fall outside the plots. Note:The radial scales on the polar plots are not allthe same.
Event
Fig. 17.
Fig. 18.
Fig. 19.
Fig. 20.
Fig. 21.
Fig. 22.
Fig. 23.
Fig. 24.
Fig. 25.
Fig. 26.
Fig. 27.
Cup
Bronze
Corduroy
Buff
Duryea
Chartreuse
Tan
Half Beak
Greeley
Faultless
Boxcar
Figs. 28 - 31. Contour plots of part double-couple versusfault azimuth for the explosion Corduroy forvarious values of the scale factor S.
Fig. 28. S = .5
Fig. 29. S = 1.0
Fig. 30. 8 = 1.5
Fig. 31. S = 2.0
112
112
.36
.38
.56
.63
.36
.57
.9
.36
.45
166
28
168
179
154
160
180
102
160
_^_~III^__X ~I__I__LII
-32-
Fig. 32. Generalized geologic map of the Nevada Test Sitewith the location of explosions in relation tomajor faults.
Fig. 33. Yucca Flat with the fault plane solutions ofthree explosions in relation to the natural andexplosion produced fracture trends.
_ ~__Y1^ _~1~1~_1~ 1^_4111111_IPLI.--~_ 11_1_
-33-
Fig. 1. Rayleigh waves from the Greeley explosion on long-period vertical component at Resolute Bay, Canada.
II __ ~_;~;_ *II^-.--IIPILLI~II _ - -. 1~~----^1_1
-35-
Fig. 2. Love and Rayleigh waves from the Greeley explosionon long-period north-south component at ResoluteBay, Canada.
l^i~l _1-(1111_. 1
-36-
LPN
RAYLEIGH
I15:49
LOVE
^_i~~--il-~lll-*-l Ill^~-i IIIP-i*-----_I-
-37-
Fig. 3. Love waves from the Greeley explosion on long-period east-west component at Resolute Bay,Canada.
LPE
115:49
LOVE
-39-
Fig. 4. Contour plot of deviations of combinations of partdouble-couple and fault plane azimuth from exper-imental data for the explosion Corduroy. Experi-mental data not smoothed. Scale factor, S=1.25.
-40-
------------------------
*1 ~ -
4.1 - -
.4.1 - - - - ------- -
9~* .7
7~
.4.1- - - - --
91 791
del --- ~ -- -V
K
94A MA~ ~ ~~ A~mV VV A~. olV0 "A "A ~ in nwi 011 ".11 FM lir.4 IM.flw 1JI 148;J I I. 41.11v I
Il. 191.
a
F
91
Fq
91
a
F
@9 I
*1
91 -P"
11
-41 -
Figs. 5 - 15. Contour plots of deviations of combinationsof part double-couple and fault plane azimuth fromexperimental data for eleven explosions. Experi-mental data smoothed. Scale factor, S=1.25.
Fig. 5. Cup.
-42-
Vt 0t~t ~ *Vtfl Attn onn n ltn n lenin 4%n n qjmf *n *n
AVIW~~flo PC A'. At C et. r C041M r re. r.m 141 At Vt err.vl4rr rti'a
M.* In
-43-
Fig. 6. Bronze.
-44-
ekIlmol?. PCw f4ile it S r .r or c"Utr r CPr. m- ne0l * 4 1 TV*er't pok1
-45-
Fig. 6a. Bronze, finer contour.
-46-
-
- -
1. *1 P 1.
"S4
'1
-
'1. -
A/1M4144 V ~AS~ I A APE V p ~,-~gp' p ~ d.~W/E 44 %j UF% %W4~I4PS~ OAIA
-47-
Fig. 7. Corduroy.
_g~ ~___
Va VAVJ J,ha.4a bAL~bIIIa AvjSiwjJ 06,4js &aL# k.jsU A i At SO # A atIVj Si M4Aanodw
4Meaub Jute9 Uufl46 uubeA U'eS* WU& W UUS Us, tCud UUA U*Uk UIUb upu
go9 17-
", LA
-49-
Fig. 8. Buff.
b*Jha.66flb SA bI *.UW OWi0 S 0 J 0 W1 %l SS A a A 6 m1&6 I NAV
LA'Ubh UUaS Lefl Uah UN S SW ULo g UU, a
-51-
Fie. 9. Duryea.
V4'J IAJW4 e lb bb U A* j WSW a t J *0 % Wd J 'C A A GVS AO MAI idV
_11~_~1~ 1~~1_11~1_ ----1-1
-53-
Fig 10. Chartreuse.
V.jat.a bA& ib Uo 4Wjt.OtNVJ Stji J WOJ A ON At CM 4 A AJ.9W NOaOMIAt
-trg-
-55-
Fig. Tan.11.
ViaV-j404%"wb " I w& A aj lowI AS OWJ NOAe. w a IV Ao $~IAnAeV
-57-
Fig. 1la. Tan, finer contour.
_
-58-
gn.il 1.f0 m.in n.q 901.41 W1. 111.1, 1. 111. 1.1 *.n1 1+141. I i
AIIJTM O F'V U I a AW E 'F CIM t I CrLm f w lAm deY -%i If, WmInVO 04It
o .41
F
0e-F )
0
I 1. P 1IF
C
FSII*n~Vt(.Y
-59-
Fig. 12. Half Beak.
VtJ.".wfb b. Ib %Ub AlJw a .*I* Oj A wkoj A .0^ A~o JA 0 & #0 o$*sniA
6 m 6 u koob Lob6 u U.. u u~b U*Uko LDUO Uo UIN UW U U#A U wv u
-09.
-61-
Fig. 12a. Half Beak, finer contour.
-62-
.0 410.-1 FI.,-1 50.1 661.0 imm1. 110. 1S.fl i1.1 ldfl~e1 I*1i.A i1.1 iiA1A*Jfv tW VA'Sl V A AWE ev Ot15. f Col1Jo f Vew poor Vwo Sol %s I f% i %"WfO GAlA4
-63-
Fig. 13. Greeley.
-64-
Allowrq e I'Vm F rt 0 'AS ev OrtF cfJvA fr Fw GOFF f3 11 Ff.;% iWb'4FO -O AI
-65-
Fig. 14. Faultless.
-- ~Y_ _ll__~ -ilPII~ li-ri~-U~_- IC II.I~I~-^I--_II
1. Aj".Aa& b * Ab a~i *a~i .j *q, a .J *to ,Sb. AI ab A .,ba AO 10seml
vS b kb Ubi UU*Lv Utah Ub U'UbI U*UUI UUb U'Ub U*UA U'S UO U*b UISW U'Ut
-99-
-67-
Fig. 15. Boxcar.
-68-
A1194004 ev fVAW I A AWE ev OF#W4 v OVIA r fe~w aWcao to sa VIA mmowIO OtA4
Fig. 16. L/R radiation pattern produced by either a right-lateral strike-slip fault at 166 degrees or aleft-lateral strike-slip fault at 76 degrees.
-70-
270
180
90
-71 -
Figs. 17 - 27. L/R radiation patterns for vertical strike-slip faults for eleven explosions. Scale factor,S=1.25. Fault orientation f is that of the bestfitting right-lateral fault for each explosion.F is the part double-couple. Crosses are experi-mental (unsmoothed) points. Numbers at edge aredata points which fall outside the plots. Note:The radial scales on the polar plots are not allthe same.
.I'Tl~ if Patih V g 91. aNY r.c a. am) .aI abetrl a a aca. 1.U.r UrIt.p41180111. ef FatII I ofawr 4cqre c 34 as yfrS SskevqFFrat V sta SCAI vscqp.l
p. 1i
~~(Ussrrr;i-l~~---r___~__ .._iyrr~-l~yi_
-101-
Fig. 32. Generalized geologic map of the Nevada Test Sitewith the location of explosions in relation tomajor faults. (Healey, 1968; Hoover, 1968)
--- ' --.- -- -M , -- - -- wilowillImu-
-102-
0 4 8 12 16 Miles
Quaternary andTertiary Alluvium
TertiaryVolconics
Pre -TertiarySedimentoar andIntrusive Rocks
30'
15'
370O'
45'
30'45
.._-...r~ *r~---l -~-'^c-~-~- I- "C-- ----~-crri n rr~i~r-*s~-r-y_~
-103-
Fig. 33. Yucca Flat with the fault plane solutions of threeexplosions in relation to the natural and explo-sion produced fracture trends. (Barosh, 1968)
~...,.,.~-~~ - on- -^-~- -IIYC1II*-~LIIC ~IYI-Y- --P~YI III C1 ---_qb_