118
Reinaldo Valenzuela 1 Seminar Outline • Communications for the new Economy • Wireless Technology Evolution • Broadband Wireless Tutorial • BLAST Tutorial: The next dimension

Reinaldo Valenzuela 1
Seminar Outline• Communications for the new Economy• Wireless Technology Evolution• Broadband Wireless Tutorial• BLAST Tutorial: The next dimension

Reinaldo Valenzuela 2
BLAST Overview
• Motivation: Overcome conventional limits• The BLAST Concept: Assumptions, gains and
asymptotes• Experimental Evidence: Real time test bed and
propagation measurements• Practical Implementations: V-Blast, T-BLAST,
Coding• Near Term Impact: CDMA2000 and UMTS
Reinaldo Valenzuela 3
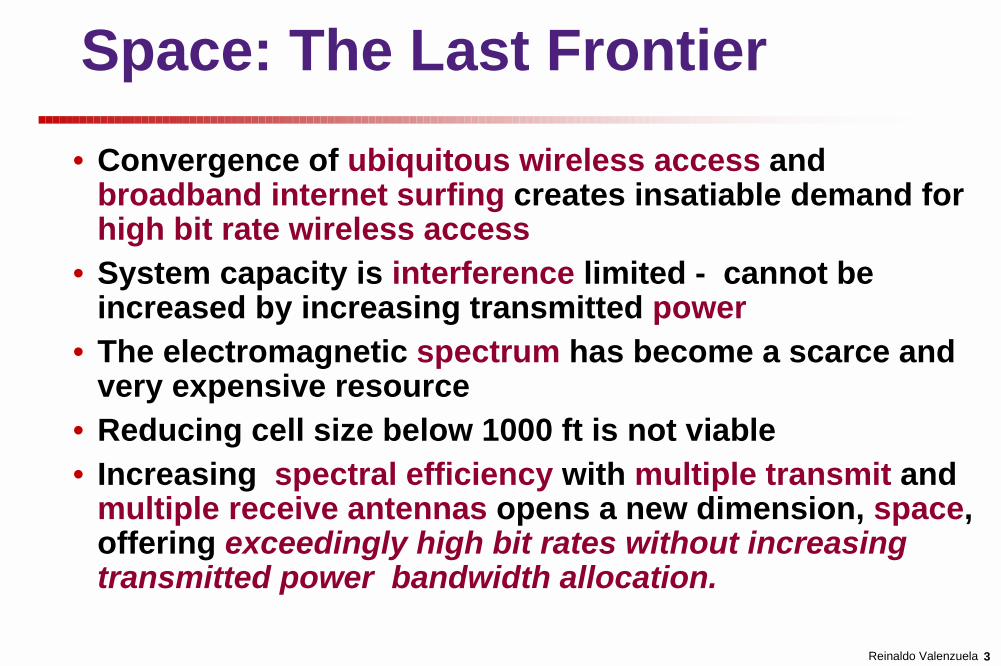
Space: The Last Frontier• Convergence of ubiquitous wireless access and
broadband internet surfing creates insatiable demand forhigh bit rate wireless access
• System capacity is interference limited - cannot beincreased by increasing transmitted power
• The electromagnetic spectrum has become a scarce andvery expensive resource
• Reducing cell size below 1000 ft is not viable• Increasing spectral efficiency with multiple transmit and
multiple receive antennas opens a new dimension, space,offering exceedingly high bit rates without increasingtransmitted power bandwidth allocation.

Reinaldo Valenzuela 4
The Wireless Channel
Multipath propagation has historically beenregarded as an impairment because it causessignal fading.To mitigate this problem, diversity techniqueswere developed over the years. Antennadiversity is a widespread form of diversity.
Information theory has shown that with multipath propagation, multipleantennas at both transmitter and receiver can establish essentiallymultiple parallel channels that operate simultaneously, on the same
frequency band at the same total radiated power.

Reinaldo Valenzuela 5
Spectral Efficiency Limits: Shannon Bound
“It is dangerous to put limits on wireless”Guglielmo Marconi, 1932
C. ShannonBell Labs Technical Journal, 1948
[ ]2 /lo g 1 b p s H zSCN
= +
•The information-theoretic capacity of single-antenna links is limited by thelink’s signal to noise ratio according to Shannon’s celebrated formula
•Each extra bps/Hz requires roughly a doubling of the Tx power (to go from1bps/Hz to 11 bps/Hz, the Tx power must be increased by ~1000 times!)
Tx Rx

Reinaldo Valenzuela 6
Multiple antenna links
• Keeping the game fair: total Tx power should remain the same• Questions: (1) How should we transmit from the different antennas? (2) What is the corresponding capacity? (3) How should the receiver operate?
... ...
... ...TX 1
TX 2
TX M
s k1( )
s k2 ( )
s kM ( )
Tx1
Tx1
Tx1 Rx 2
Rx N
x k1( )
x k2 ( )
x kN ( )
Rx1

Reinaldo Valenzuela 7
Parallel Channels
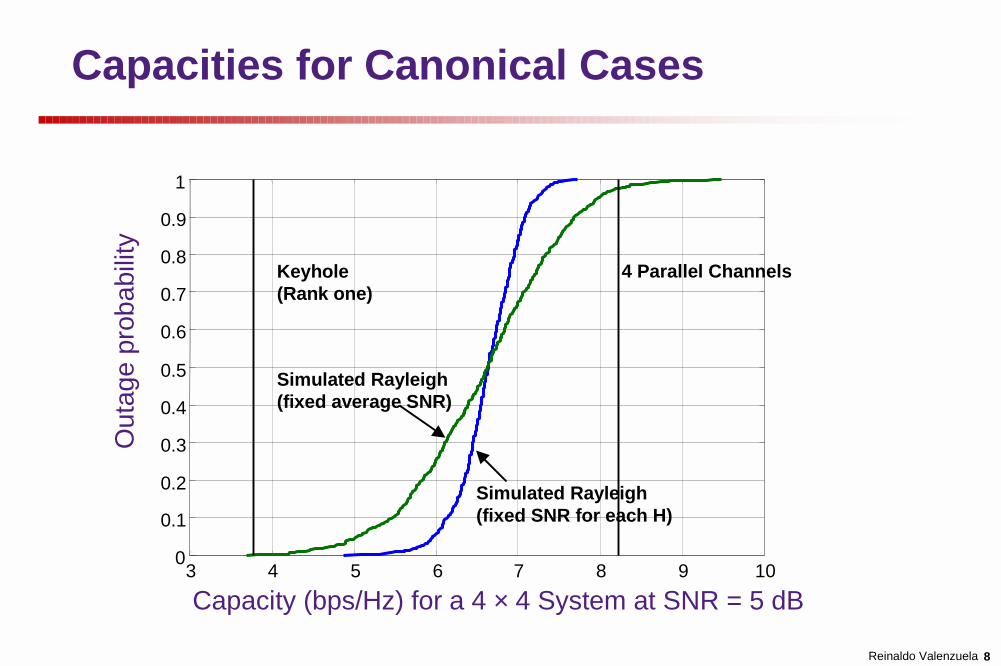
(N,N) Key-hole, C = log2(1+SNR)N (1,1) parallel channels C = N log2(1+SNR) = 8.2 b/sec/HzN (1,N) parallel channels with diversity C = N log2(1+SNR) = 15 b/sec/Hz
N=4, SNR = 5 dB
TX 2
TX M
s k2 ( )
s kM ( )
TX 1 s k1( )Tx1
Tx1
Tx1 Rx 2
Rx N
x k1( )
x k2 ( )
x kN ( )
Rx1
Reinaldo Valenzuela 8
4 Parallel Channels
3 4 5 6 7 8 9 100
0.1
0.2
0.3
0.4
0.5
0.6
0.7
0.8
0.9
1
Out
age
prob
abilit
y
Capacity (bps/Hz) for a 4 × 4 System at SNR = 5 dB
Simulated Rayleigh(fixed SNR for each H)
Simulated Rayleigh (fixed average SNR)
Keyhole(Rank one)
Capacities for Canonical Cases

Reinaldo Valenzuela 9
Efficiency Limits with a Single Array
•A single array provides diversity against fading•Slow logarithmic growth of the bandwidth efficiency limit
+=
NSC 1log 2
x k1( )
+=
NSMC 1log 2
Rx 2
Rx N
x k2 ( )
x kN ( )
Rx1TX 1 s k1( )Tx1
Reinaldo Valenzuela 10
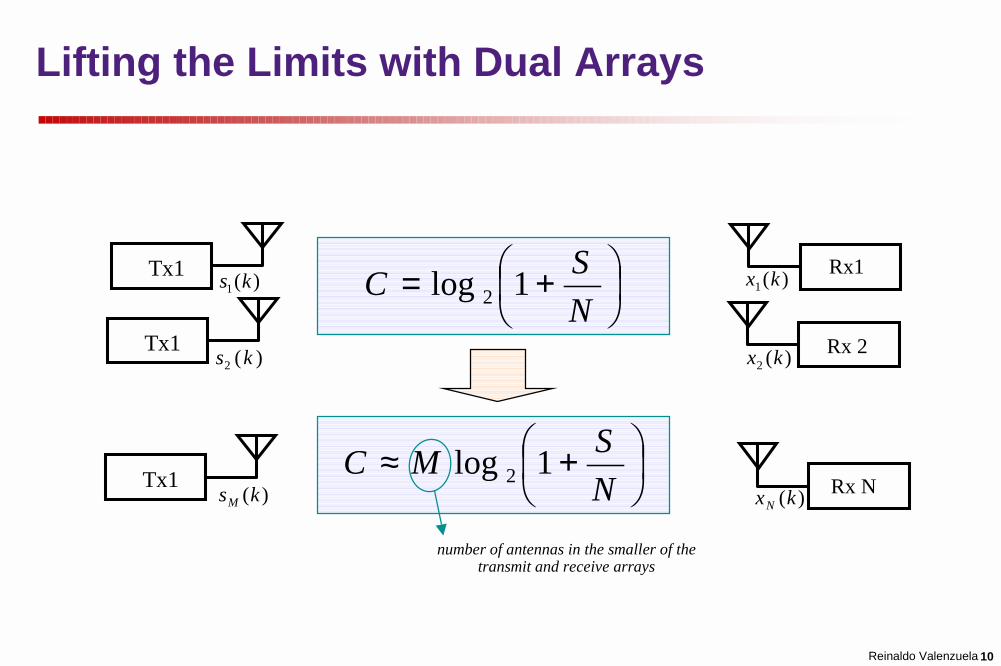
Lifting the Limits with Dual Arrays
+=
NSC 1log 2
x k1( ) Rx1TX 1 s k1( )Tx1
+≈
NSMC 1log 2
number of antennas in the smaller of thetransmit and receive arrays
Rx 2
Rx N
x k2 ( )
x kN ( )
TX 2
TX M
s k2 ( )
s kM ( )Tx1
Tx1

Reinaldo Valenzuela 11
Extending the Limits with Multiple Antennas
(Noise σ2)
CE s g
= +⋅F
HGIKJlog2
12 2
21σ
x k1( ) Rx1TX 1 s k1( )Tx1
C H= +FHG IKJlog det2 2
1I G Gσ
ΦΦΦΦ
Φ = ⋅E Hs s}{g=G
- Total Transmit Power Held Constant -
Rx 2
Rx N
x k2 ( )
x kN ( )
TX 2
TX M
s k2 ( )
s kM ( )Tx1
Tx1

Reinaldo Valenzuela 12
Extending The Limits: Frequency selective case
F: Covariance matrix of transmit signal (nT×nT)G: Channel response matrix, not normalized (nR×nT)K: Covariance matrix of impairment (nR×nR)B: Bandwidth.
Only requirement: that the impairment be Gaussian.With flat fading, the integration and its averaging effectsdisappear
-112log det + ( ) ( ) ( ) ( ) dB B
C f f f f f+ = Φ ∫ I G G K
-12log det +C + = Φ I G G K

Reinaldo Valenzuela 13
Propagation Model and Array Structure
T
-12log det + P
nC g + = I HH K
When entries of G are independent, open-loop capacity ismaximized by transmitting Gaussian signals withcovariance
with P the total radiated power.If entries of G have same variance (g), define unit-variancenormalized channel matrix H so that
T
PnΦ = I

Reinaldo Valenzuela 14
Noise-limited Open Loop Capacity
When the impairment consists exclusively of thermal noise:
:noise power per receive antenna.
2σ=K I
2T
12log det + P g
nCσ
+ = I HH
SNR
Different levels of randomness in the channel:• Large-scale randomness distance dependent , shadowing, etc. Absorbed into SNR, which can be regarded as deterministic within a local area.• Small-scale randomness cause by multipath and contained within H.
2σ

Reinaldo Valenzuela 15
Asymptotic Capacities
...SNR with symmetric arrays, nT=nR= n
...transmitters, nT, with nR constant
…receivers, nR, with nT constant
2SNRlogC n e
=
( )R 2log 1 SNRC n= +
RT 2
Tlog 1 SNRnC n n
= +
Increasing......

Reinaldo Valenzuela 16
Capacity Scaling
ErgodicCapacities
0
5
10
15
20
1 2 3 4 5 6 7 8 9 10
Number of Antennas
Link
Cap
acity
(bps
/Hz)
SNR=10 dBSNR=10 dB
nT=4
nR=4
Reinaldo Valenzuela 17
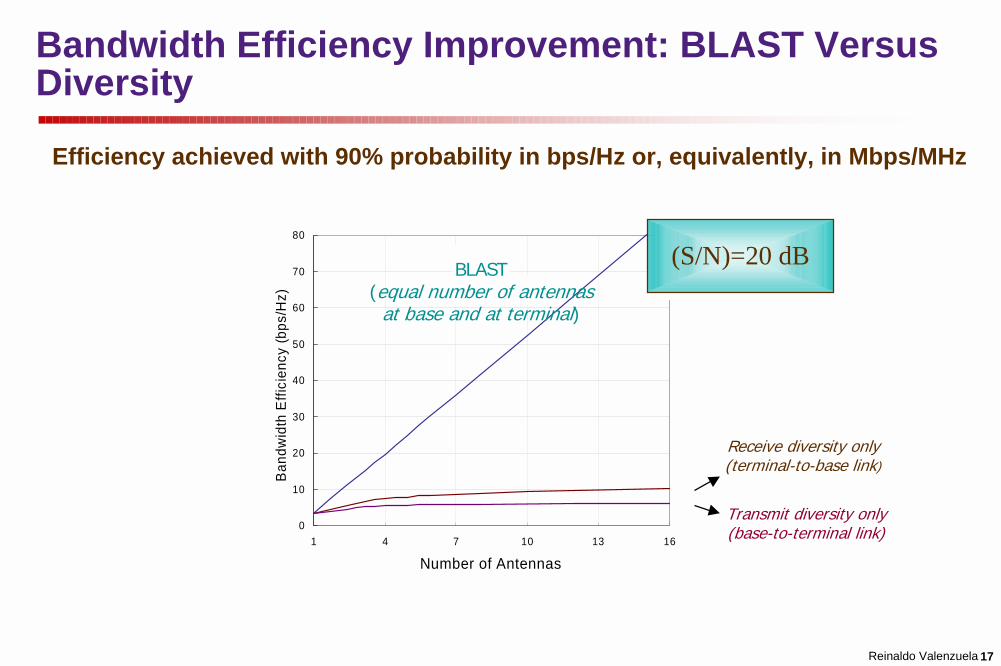
Bandwidth Efficiency Improvement: BLAST VersusDiversity
0
10
20
30
40
50
60
70
80
1 4 7 10 13 16
Number of Antennas
Ban
dwid
th E
ffici
ency
(bps
/Hz)
BLAST(equal number of antennas
at base and at terminal)
Receive diversity only(terminal-to-base link)
Transmit diversity only(base-to-terminal link)
Efficiency achieved with 90% probability in bps/Hz or, equivalently, in Mbps/MHz
(S/N)=20 dB(S/N)=20 dB

Reinaldo Valenzuela 18
Basic Assumptions
To evaluate the levels of spectral efficiency attainable with some highprobability, let us assume --for the time being-- some idealizedconditions. We will revisit these assumptions later …
Single-user linkAWGN limited (no co-channel interference)NarrowbandChannel perfectly known to receiverRich multipath conditionsperfectly known at the receiver.Open-loop operation. Only long-term information (defined as thatwhich varies slowly with respect to the fading rate) available to thetransmitter.Terminal antennas: uncorrelated.Base station antennas: coherent if closely spaced, uncorrelated ifwidely spaced. (limiting cases.)Focus on downlink, most of the results apply to uplink as well.

Reinaldo Valenzuela 19
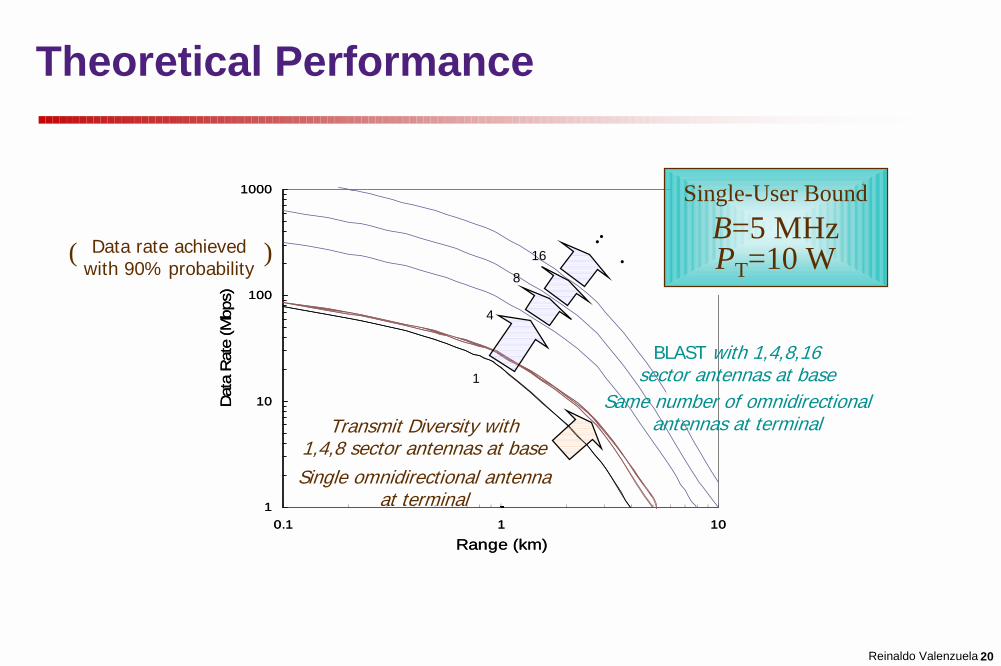
Base-to-Terminal Link Analysis
• How does BLAST enhance the theoretically achievable data rates ina case of practical interest ? Let us look at how fast information canbe transferred from a base station down to a mobile user in thefollowing conditions:
– Bandwidth B=5 MHz– Power PT=10 W– No interference from other users (best possible scenario)– Sector antennas at base station– Omnidirectional antennas at terminal
Reinaldo Valenzuela 20
1
10
100
1000
0.1 1 10
Range (km)
Dat
a R
ate
(Mbp
s)
Theoretical Performance
1
10
100
1000
0.1 1 10
Range (km)
Dat
a R
ate
(Mbp
s)
...
Single-User BoundB=5 MHzPT=10 W
Single-User BoundB=5 MHzPT=10 W
Transmit Diversity with1,4,8 sector antennas at baseSingle omnidirectional antenna
at terminal
BLAST with 1,4,8,16sector antennas at base
Same number of omnidirectionalantennas at terminal
1
4
8
16( )Data rate achievedwith 90% probability
Reinaldo Valenzuela 21
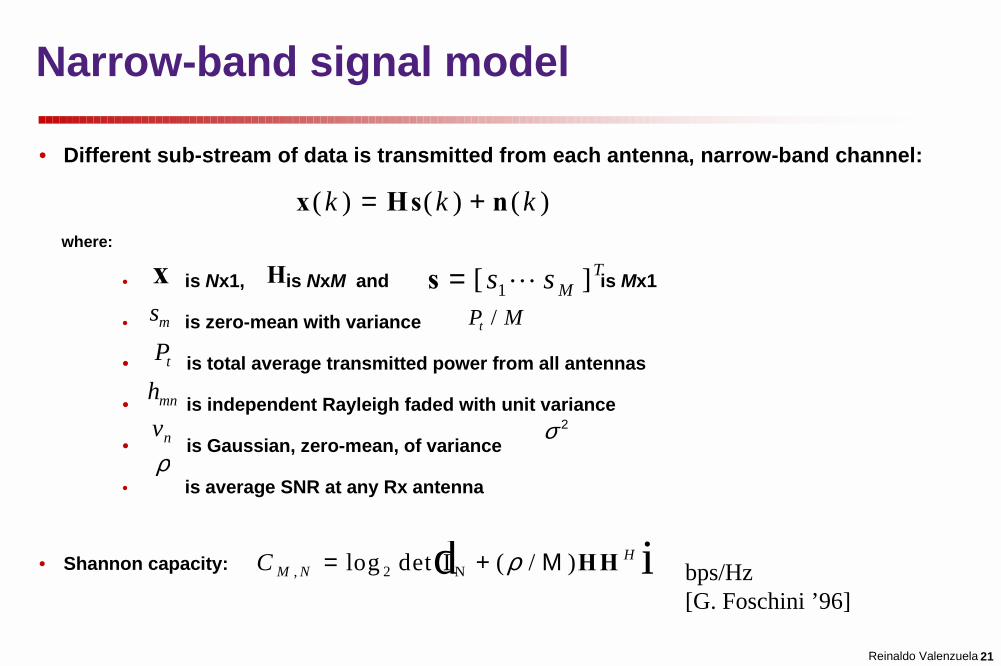
Narrow-band signal model
• Different sub-stream of data is transmitted from each antenna, narrow-band channel:
where:
• is Nx1, is NxM and is Mx1
• is zero-mean with variance
• is total average transmitted power from all antennas
• is independent Rayleigh faded with unit variance
• is Gaussian, zero-mean, of variance
• is average SNR at any Rx antenna
• Shannon capacity:
x Hs n( ) ( ) ( )k k k= +
ρ
C M NH
, log det ( / )= +2 I N ρ Μ HHd i
sm
hmn
vn
x H s = [ ]s s MT
1L
bps/Hz[G. Foschini ’96]
Pt
P Mt /
σ 2

Reinaldo Valenzuela 22
Bell-laboratories LAyered Space-Time
• With dual arrays bandwidth efficiency growth is linear withthe number of antennas. This is in contrast with thelogarithmic growth obtained with a single array (conventionaldiversity).
• To exploit this potential, G. J. Foschini proposed a layeredspace-time architecture that was baptized as BLAST.
• In BLAST, multiple data streams are transmittedsimultaneously and on the same frequency using a transmitarray. Those different streams can be separated andsuccessfully decoded at the receiver using another array.
• The total transmit power is preserved irrespective of thenumber of transmit antennas ..! Hence, there is no increasein the amount of interference caused to other users.
• The transmitter needs no information about the channel,which eliminates the need for fast feedback links -- veryattractive for mobile systems.

Reinaldo Valenzuela 23
BLAST transceiver architecture
• Different data sub-streams are transmitted from differentantennas
• Signal processing at the receiver attempts to separate thereceived signals
Rx Data
TxBLAST
TX:
(De/MuxCoding
etc.)
TxTxTxTxTxTxTx
RxRxRxRxRxRxRxRx
BLASTRx
Tx Data
RxRx
RxRx

Reinaldo Valenzuela 24
D-BLAST transmission architecture
TX 1
TX 2
TX 3
TX 4
...time
space ...
...
...
Theoretically achieves log-det capacity with appropriate RxprocessingPractical caveats: - lost triangles - high complexity - coding constraints

Reinaldo Valenzuela 25
V-BLAST transmission architecture
TX 1
TX 2
TX 3
TX 4
time
space
...
.........Achieves far lower capacity than the log-det boundPractical advantages: - no lost triangles - lower complexity - simple 1-D codecs

Reinaldo Valenzuela 26
Narrow-band processing options
• Linear receivers:
– Decorrelating (ZF) receiver:
– Maximum SNR (MMSE) receiver:
• Non-linear receivers:– Similarly to Multi-User Detection (MUD), a number of non-linear
alternatives range from successive interference cancellation tojoint maximum likelihood receivers
– V-BLAST Rx: an appealing architecture based on successiveintf. Cancellation (SIC)
z W x( ) ( ) ( )k k kT=
( ) 1†( ) Tk−∗ ∗= =W H H H H
1
( ) TN
Mkρ
−∗ ∗
= +
W H H I H

Reinaldo Valenzuela 27
V-BLAST
A V-BLAST receiver extracts the various data streamsusing a ZF or MMSE filter with ordered successiveinterference cancellation
Spatial MMSE Filtering
Ordering
Interference Cancellation
V-BLASTRx...
RF
RF
RF
...
V-BLASTTx
(SpatialMultiplex)
...
RF
RF
RF
...ScatteringChannel

Reinaldo Valenzuela 28
V-BLAST (DFE-type) receiver
• Sequential processing based on successive nulling+cancellation• Let denote the order into which the sub-streams are
detected
– Sub-stream : Nulling: Slicing: Cancelling:
– Sub-stream : Nulling: Slicing: Cancelling:
– Sub-stream : Nulling: Slicing:
{ }1 , , Mk kK
1k
2 2
1( ) ( )Tk kz k W k= x
( )1 1ˆ ( ) dec ( )k ks k z k=
1
11ˆ( ) ( ) ( ) (:, )kk k s k k= −x x H
2
2 12ˆ( ) ( ) ( ) (:, )kk k s k k= −x x H
( )ˆ ( ) dec ( )M Mk ks k z k=
( )2 2ˆ ( ) dec ( )k ks k z k=
1 1( ) ( )T
k kz k W k= x
1( ) ( )M M
T Mk kz k W k−= x
2k
Mk
.. .
Optimal Ordering:1
SNR SNRMk k> >L

Reinaldo Valenzuela 29
Bell-Laboratories LAyered Space-Time
• Under these idealized conditions, the link spectral efficiency growth is(asymptotically) linear with the number of antennas, with the slopedetermined by the average SNR. This is in contrast with the logarithmicgrowth obtained through diversity.
• To exploit this potential, G. J. Foschini proposed two layered space-timearchitectures: Diagonal BLAST (D-BLAST) and Vertical BLAST (V-BLAST) inwhich multiple data streams are transmitted simultaneously on the samefrequency band using a transmit array. Those different streams can beseparated and successfully decoded using a receive array . The totaltransmit power is preserved irrespective of the number of transmitantennas. There is no increase in the interference caused to other users.
• Shannon limit can be approached with D-BLAST, and even attained,although with significant complexity.
• V-BLAST is much simpler and still attains a hefty portion of the Shannonspectral efficiency. Every antenna radiates an independently encodedequal-rate data stream. A V-BLAST receiver bridges the gap betweenadaptive antenna and multiuser detection techniques.
• The transmitter needs no channel information, which eliminates the needfor fast feedback links -- very attractive for mobile systems.

Reinaldo Valenzuela 30
0 5 10 15 20 25 30 35 40 45 500
0.1
0.2
0.3
0.4
0.5
0.6
0.7
0.8
0.9
1 ρ ρ ρ ρ = 10 dB
capacity [bps/Hz]
Pr.(c
apac
ity>a
bsci
ssa)
(1,1)
(1,2)
(1,4)
(1,8)
(1,16)
V-BLAST(16,16)
open-loop(16,16)“LogDet”
BLAST advantage over Rx Diversity
(inf.,1)

Reinaldo Valenzuela 31
Closed-loop vs. Open-loop
Line-of-SightRich Scattering
0
5
10
15
20
25
30
35
0.01 0.1 1 10 100 1000 10000
K -Factor
10%
-Out
age
Link
Spe
ctra
l Effi
cien
cy (b
ps/H
z)
Closed-loopBLAST
Open-loopBLAST
Phased Array
10×16Avg. SNR=10 dB
10×16Avg. SNR=10 dB
Open and closed loop BLAST are close for K <10 : Open-loop BLAST is very robust.With little scattering, closed-loop BLAST, forms a beam (Phased Array),Open-loop BLAST insists on M different modes. The difference in spectral efficiency is only moderate.Water pouring over eigen modes is optimal in AWGN. Requires fast CSI feedback. Practical for FWL andportable

Reinaldo Valenzuela 32
Generalized Closed-loop BLAST
Generalized BLAST optimal with spatially colored co-channelInterferenceObtains the link eigenmodes in the presence of non-whiteinterference.Maximizes the link spectral efficiency.Includes all other forms of BLAST as particular cases.A “fast” feedback with information on the channel and theinterference statistics is required.

Reinaldo Valenzuela 33
0 5 10 15 20 25 30 35 400
10
20
30
40
50
60
Capacity for a 4x4 system for H = identityfor various measurement SNR values, pH
System SNR
Cap
acity
in b
ps/H
z
exact pH = 40 dBpH = 35 dBpH = 30 dBpH = 25 dBpH = 20 dB
The Best H Matrix, identity
XMTR RCVRImportant as a calibration tool for normalizing transmitter and receiver gains
)1(log,1]|[|
...00............0...00...0
22 SNRNChE
N
NN
H ij +==⇒
=
M = N
supremum = "parallel interferenceless beam steering" = all equal eigen values
Pt
Pt
Pt
Pt
Pr = g * PtSNR = g * Pt * 1/No
No
+
No
+
No
No
+
No
Pr
Pr
Pr
Pr +
Reinaldo Valenzuela 34
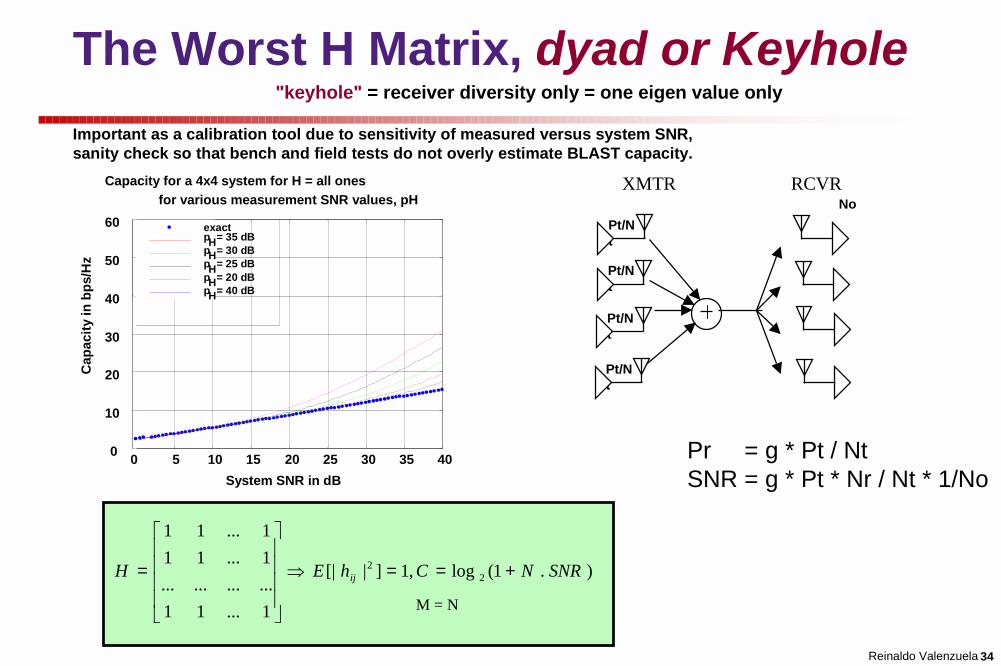
0 5 10 15 20 25 30 35 400
10
20
30
40
50
60
Capacity for a 4x4 system for H = all onesfor various measurement SNR values, pH
System SNR in dB
Cap
acity
in b
ps/H
z
exact pH = 35 dBpH = 30 dBpH = 25 dBpH = 20 dBpH = 40 dB
The Worst H Matrix, dyad or Keyhole
).1(log,1]|[|
1...11............1...111...11
22 SNRNChEH ij +==⇒
=
Important as a calibration tool due to sensitivity of measured versus system SNR,sanity check so that bench and field tests do not overly estimate BLAST capacity.
M = N
"keyhole" = receiver diversity only = one eigen value only
XMTR RCVR
Pt/Nt
No
Pr = g * Pt / NtSNR = g * Pt * Nr / Nt * 1/No
Pt/Nt
Pt/Nt
Pt/Nt

Reinaldo Valenzuela 35
Capacity vs. system size (M=N): keyhole
2 4 6 8 10 12 14 166
8
10
12
14
16
18
20
22
24
Capacity for H = ones(N), SNR = 20 dBand various measurement SNR values, pH
System size
Cap
acity
in b
ps/H
z
exact PH= 40 dBPH = 35 dB = 30 dB
PH = 25 dBPH = 20 dB
PH

Reinaldo Valenzuela 36
Propagation Modeling Theory
• Background• Capacity in correlated Rayleigh channels• Singular Value Decomposition (SVD)• Keyholes• Waveguides• Outdoor propagation• Summary and conclusions

Reinaldo Valenzuela 37
Propagation Modeling• BLAST capacity has been explored in
– Statistical Rayleigh and Rician channels– Deterministic Ray-Tracing simulations (WiSE)– Abstract ray-tracing (1 and 2-ring scatterer models)– Deterministic over the ground plane propagation– Statistical Rayleigh channels with correlation due to
limited angular spread• What really happens outdoors and how is it connected
to propagation conditions ?

Reinaldo Valenzuela 38
Capacity in correlated complex Gaussian channels
• Separable correlation among transmit elements and receiveelements:
• Hiid has complex Gaussian iid entries• ρρρρ is average SNR• ΦR is the covariance matrix of the receive elements• ΦT is the covariance matrix of the transmit elements
†2log , iid
T
Cnρ= + R TI HH H = Φ H Φ

Reinaldo Valenzuela 39
Representation of H using SVD
• U and V are orthogonal (unitary) matrices• ΛΛΛΛ is a diagonal matrix
*VUH nnmnmmmn Λ=
( ) ( )∗∗∗∗
∗∗
∗∗
+
=
=
222111
2111
122
32
22
12
1
31
21
11
22122
1
333231
232221
131211
000
0
vvuuu
vvuuu
vvvv
uuuuuuuuu
λλ
λλ
H
H

Reinaldo Valenzuela 40
Keyholes
EincσEinc
( )
( )
=
=
=
dbdacbca
badc
ss
baEinc
σσH
2
1
( )
=2
1
ss
badc
E rec σ
Reinaldo Valenzuela 41
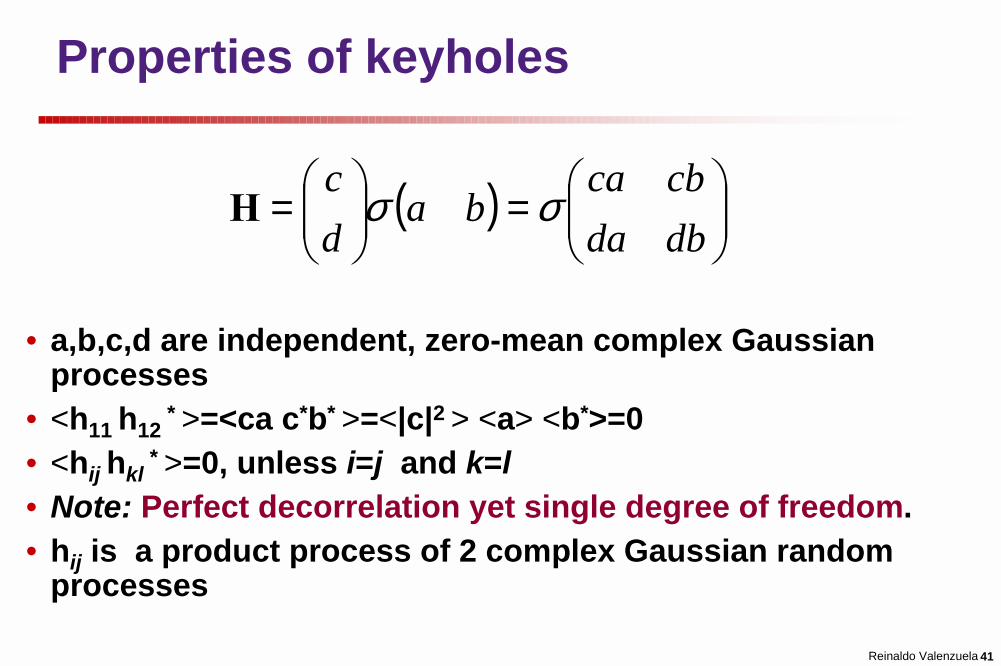
Properties of keyholes
• a,b,c,d are independent, zero-mean complex Gaussianprocesses
• <h11 h12 * >=<ca c*b*
>=<|c|2 > <a> <b*>=0• <hij hkl
* >=0, unless i=j and k=l
• Note: Perfect decorrelation yet single degree of freedom.• hij is a product process of 2 complex Gaussian random
processes
( )
=
=dbdacbca
badc
σσH

Reinaldo Valenzuela 42
Properties of keyholes• Received power z=xy, where x, y are exponential power distributions (Rayleigh
processes) with mean power b
)2(2)( 02 bzK
bzf =

Reinaldo Valenzuela 43
Normal scattering
• Multiple scattering may be written as a sum over “keyhole” contributions, eacha cascaded process of 2 complex Gaussian processes.
• For many “keyholes”, this sum is a complex Gaussian process according to theCentral Limit Theorem
Reinaldo Valenzuela 44
Implications of the presence of keyholes
• Low capacity due to high correlation may be addressedby spreading antennas further.
• That strategy will not improve capacity in the presence ofa keyhole.
• Possible indication of a keyhole: low correlation, yet lowcapacity.
• Keyholes provide a demanding test of the channelmeasurement system

Reinaldo Valenzuela 45
Waveguide modes
Not SVD but keyhole still occurs when 1 mode dominates.
( ) ( ) ...)()(2
)()(
)()(2
)()(
)()()()(
20
02
)()()()(
2)()(
2)()(
)(
22122
22
12
21111
21
11
2
1
2212
2111
2
1
2221
1211
2
1
111
1111
11112
112
21
2
1
+⋅
⋅+⋅
⋅=
⋅
⋅⋅⋅⋅⋅
⋅⋅⋅
⋅
⋅
⋅⋅⋅⋅⋅
=
⋅=
==
=
−=+∇
∑ ∑∑
∑
tti
err
tti
err
ss
tttt
ie
ie
rrrr
rr
si
etrshr
ietrh
trhkh
xixi
xi
xi
m m km
k
xi
mkkmm
k k
xi
kk
k
k
φφβ
φφ
φφβ
φφ
φφφφ
β
β
φφφφ
βφφ
βφφ
δ
ββ
β
β
β
β
H
r

Reinaldo Valenzuela 46
Canonical outdoor environment
( )4 4
ik r r ik r re eG r
r r r rπ π
′ ″ ′− −
′′ = − ″ ′− −
U(r')
Aperture A'
U(r)
Imager"
x
B.C. : U,G=0
y� (roof edge)
2 2 0U k U∇ + =
( ) ( )U r dA U G G U′= ⋅ ∇ − ∇∫∫

Reinaldo Valenzuela 47
Field at the base in the Fresnel approximation
Note: No dependence on z' coordinates.
)2
exp()0,,0()(
)2
exp()0,,()(
2)'()'()'()'()'()'(
22
)(
2
202
)(
2
22222
22
22
xyiky
xyikyUyde
kxzerU
xyiky
xyikxikyxUxdyde
xizerU
xzzyyxxzzyyxxR
xyzikikx
xyzikikx
′−
′′′=
′−
′+′−′′′′=
−+−+−≈−+−+−=
∫
∫ ∫∞
∞−
+
∞
∞− ∞−
+
λ
λ

Reinaldo Valenzuela 48
Vertical base array
• H matrix may be factored:
• Gi(0,y',0) is the Green’s function due to the source i, including allthe street-level scattering
• H matrix is a dyad - single degree of freedom
21
2 2 22
21
( ) ( )2 2 2
2 1 22 (0, ,0) (0, ,0)
zikx
z ik y y ik y yikxikx x x
z e
ez e dy G y e dy G y ex kλ
′ ′∞ ∞− −
−∞ −∞
′ ′ ′ ′= •
•
∫ ∫H

Reinaldo Valenzuela 49
Horizontally separated base array
• Each receiver perceives each transmitter in a different way, thus nodegeneracy
• Each Gi(0,y',0) is a zero-mean, complex Gaussian RV
2 21 1
2 2 22 2
( ) ( )2 2
1 2
( ) ( )2 2 2
1 22
(0, ,0) (0, ,0)
(0, ,0) (0, ,0)
ik y y ik y yx x
z ik y y ik y yikx ikx x x
dy G y e dy G y e
e ze dy G y e dy G y ex kλ
′ ′− −∞ ∞
−∞ −∞′ ′− −∞ ∞
−∞ −∞
′ ′ ′ ′ • ′ ′ ′ ′= •
• • •
∫ ∫
∫ ∫H

Reinaldo Valenzuela 50
Correlation
• Received field U(r) is a linear functional of aperture fieldU(r'). If U(r') is a gaussian process, so is U(r).
• Mean and correlation describe the process completely.
• Correlation at base is a linear functional of correlation atthe aperture.
2 21 2( ) ( )2
* 2 21 2 1 14( ) ( ) (0, , 0) (0, , 0)
2
ik y y ik y yx xzU r U r dy dy G y G y e e
xπ
′ ′′∞ ∞ − −−∗
−∞ −∞
′ ′′ ′ ′′= ∫ ∫

Reinaldo Valenzuela 51
Incoherent line source at roof edge• Correlation at roof edge
• Incoherent intensity
• Correlation coefficient
• yd is separation between base antennas• σσσσy ~ street width ~ 30 meters
2*
2
4(0, ,0) (0, ,0) ( ) ( )2
y yG y G y I y ykπρ δ′ ′′+′ ′′ ′ ′′= = −
2
2 2
1( ) exp( )2 2y y
yI yπσ σ
= −
2 2 21 2
22 2
1 2
( ) ( )( ) exp( )
2( ) ( )
y dd
U r U r k yy
xU r U r
σρ
∗
= = −

Reinaldo Valenzuela 52
Correlation at the base station (1 km)

Reinaldo Valenzuela 53
Summary for outdoors
• Using this correlation in the capacity formula:
• results in 80% of Rayleigh iid capacity for antennasseparated horizontally by 4λ.λ.λ.λ.
†2log , iid
T
Cnρ= + RI HH H = Φ H

Reinaldo Valenzuela 54
Propagation Modeling Conclusions
• Decorrelation is not a guarantee of BLAST performance• Existence of keyholes postulated and demonstrated in canonical
situations.• Statistical properties discussed and detection of keyholes proposed.• Canonical outdoor propagation scenario is analyzed:
– Keyhole found for vertically spaced antennas– Adequate decorrelation and BLAST performance for horizontally
spaced antennas (4λλλλ apart)• Nightmare scenario: A vertical edge following a roof edge would leave
only 2 degrees of freedom for 2 polarizations (conceivable, butunlikely)

Reinaldo Valenzuela 55
Experimental Evidence: Measuring BLAST capacities
Eight Easy Steps to BLAST capacity measurements1. Send 16 unique RF tones (centered at 2.11 GHz), one per antenna, each separated by 2kHz.2. Receive 16 I/Q tone pairs, store time series data to disk at 78,125 Samples/sec/channel.
upwards of 3 Gbytes per data run including static and mobile data.3. Record LAT/LON position with Global Positioning System enhanced with inertial guidance.4. Drive around recording 16 time series to disk.5. Come home, post process data as 120 point FFTs.
1.5 milliseconds/H = 650 Hz channel update ratemeasure transmitted tones as signal powermeasure adjacent tones as noise power calculate average measured SNR
6. Guarantee adequate measured SNR (guard against poorly recorded H matrix).7. Assign system SNR (assume signal as power controlled, typically 10 or 20 dB).8. Substitute into log det formula.
C = log2 det [I + (SNR*N/M) HH' ] [bits/sec/Hertz]
SNR = system SNRH = normalized to unit variance, dimension MxN (measured with sufficiently high accuracy, referred to as measured SNR)H' = matrix transposeM = no. of transmittersN = no. of receivers

Reinaldo Valenzuela 56
Error in Measured Rician Channel CapacityN=M=16
5 10 15 20 25 30 350
10
20
30
40
50
60
70
80
90
100
Measurement SNR (dB)
Erro
r in
perc
ent a
t 20
dB S
NR
Rayleighk=5 dB k=10 dB k=15 dB k=20dB k=25 dB Dyad
10% cutoff criteria

Reinaldo Valenzuela 57
Estimated Capacity vs. Measurement SNR, Rician Channel, N=M=16
5 10 15 20 25 30 3510
20
30
40
50
60
70
80
90
Measurement SNR (dB)
Med
ian
Cap
acity
(bps
/Hz)
at 2
0 dB
SN
R
Rayleighk=5 dB k=10 dB k=15 dB k=20 dB k=25 dB Dyad
Rician K factor = specular power/scattered power
dashed line = capacity calculated with noiseless H matrixsolid line = capacity calculated with noisy H matrix

Reinaldo Valenzuela 58
Calibration: Measured and Theoretical Capacity over ground plane
10 100 100020
30
40
50
60
70
Cap
acity
(bps
/Hz)
D = Distance (wavelengths)
Horizontal array, SNR 20 dB, Tx ht 1.5 m
Free space Over ground planeMeasured Measured (van)
XMTR RCVR
D1.5m

Reinaldo Valenzuela 59
Experimental Evidence
• The BLAST prototype has demonstrated unprecedentedbandwidth efficiencies (30-40 bps/Hz). Over 1 Mbps within a30-kHz channel that typically delivers about 50 Kbps.
• Without the parallel channels created by BLAST, it isimpossible to even approach this type of bandwidthefficiencies.
• Excellent agreement between theory and experiment inindoor environments.
• To achieve 40 bps/Hz, a conventional single-antennasystem would require a constellation with 240 = 1012 points..!
• Furthermore, a constellation with such density of pointswould require SNR levels in excess of 100 dB to operate atany reasonable error rate.

Reinaldo Valenzuela 60
V-BLAST Prototype
• A 1.9-GHz, 30 KHz, V-BLAST prototype with 12 transmit and 16receive antennas is operational at the Crawford Hill facilities.

Reinaldo Valenzuela 61
Hardware prototype

Reinaldo Valenzuela 62
V-BLAST Single Position Indoor Results
M = 8 (8 x 16QAM)N = 12Es = 26 bps/Hzk = 100 symbols (20 training + 80 payload)Raw data rate = 780 kbpsPayload rate = 624 kbpsBLER = 3200 bits

Reinaldo Valenzuela 63
Measurement Setup:• Base station:
• horizontal array of 5 antennas• 150 HPBW, 13 dB gain, 0.52 m spacing• ht : 34.7 m on top of Crawford Hill• 5 discrete frequency tones• fc : 2.44 GHz + [8:12] KHz• Pt : 30 dBm/Ant
• Remote:• horizontal array of 4 antennas• vertical array of 4 antennas• 260 HPBW, 15 dB gain, 1.1 m spacing• hr : 10 m and 5 m.• Speed: 10 ms per H, 30 s per 300 H.
Goal:• Evaluate BLAST capacity in suburban environments.• Characterization of MIMO Channel.
Measurement Setup

Reinaldo Valenzuela 64
BLAST Outdoor Measurements
Narrow Band5 Transmit and 7 receive elements35 m base10 m remote2 GHz
35 m Base Station Height5 transmit elements
10 m Remote Station Height7 receive elements
20 dBm Total Transmitter Power30 kHz Bandwidth10 dB Noise FigurePath Loss Fluctuations includedover an 11 km radius cell size

Reinaldo Valenzuela 65
Cumulative Distribution of the Capacity for Sixteen Locations, 10m Remote Height, SNR = 7 dB
Out
age
Prob
abili
ty
Minimum Channel Capacity @ 7dB System SNR, Bits/Sec/Hz
0
0.2
0.4
0.6
0.8
1
5 6 7 8 9 10 11
Keyhole Channel Capacity @ 7dB System SNR = 5.2 Bits/Sec/Hz
Rayleigh iid Channel Capacity @ 7dB System SNR =13.02 Bits/Sec/Hz
35 m Base Station Height5 transmit elements
10 m Remote Station Height7 receive elements
20 dBm Total Transmitter Power30 kHz Bandwidth10 dB Noise FigurePath Loss Fluctuations includedover an 11 km radius cell size

Reinaldo Valenzuela 66
Cumulative Distribution of the Capacity forSixteen Locations, 10m Remote Height, SNR = 17 dB
0
0.2
0.4
0.6
0.8
1
8 10 12 14 16 18 20 22 24
Out
age
Prob
abili
ty
Minimum Channel Capacity @ 17dB System SNR, Bits/Sec/Hz
@17dB System SNR =8.46 Bits/Sec/Hz
@ 17 dB System SNR = 27.6 Bits/Sec/Hz
Keyhole Channel Capacity
Rayleigh iid Channel Capacity
For All Curves:
35 m Base Station Height5 transmit elements
10 m Remote Station Height7 receive elements
20 dBm Total Transmitter Power30 kHz Bandwidth10 dB Noise FigurePath Loss Fluctuations includedover an 11 km radius cell size

Reinaldo Valenzuela 67
0
0.2
0.4
0.6
0.8
1.0
0 20 40 60 80 100
For All Curves:
35 m Base Station Height5 transmit elements
10 m Remote Station Height7 receive elements
20 dBm Total TransmitterPower30 kHz Bandwidth10 dB Noise FigurePath Loss Fluctuationsincludedover an 11 km radius cell size
Conclusion:Directional Suburban BLASTis half-way to Rayleigh iid.
Suburban results
BLAST Capacity Probability in Suburban Environment,5x7
BLAST measurements
Rayleigh iid
Focussed Base Station ArrayBLAST RCVR (Keyhole)
Average Capacity in bps/Hz
Prob
abilit
y C
apac
ity >
Abs
ciss
a

Reinaldo Valenzuela 68
0
10
20
30
40
50
60
0 5 10 15 20 25 30 35
Average Measured Capacity Vs. System SNRSixteen Locations, 10m Remote Height
Cha
nnel
Cap
acity
, Bits
/Sec
/Hz
System SNR, dB
Rayleigh iid
Keyhole
For All Curves:
35 m Base Station Height5 transmit elements
10 m Remote Station Height7 receive elements
20 dBm Total Transmitter Power30 kHz Bandwidth10 dB Noise FigurePath Loss Fluctuations includedover an 11 km radius cell size

Reinaldo Valenzuela 69
6 8 10 12 14 16 18 20 220
0.1
0.2
0.3
0.4
0.5
0.6
0.7
0.8
0.91
Out
age
prob
abilit
y
Channel Capacity (bps/Hz) at SNR = 10 dB
Effects of Remote Antenna Height
Rayleigh iid Full
Keyhole
5 m remote
10 m remoteFor All Curves:
35 m Base Station Height5 transmit elements
10 m Remote Station Height7 receive elements
20 dBm Total Transmitter Power30 kHz Bandwidth10 dB Noise FigurePath Loss Fluctuations includedover an 11 km radius cell size

Reinaldo Valenzuela 70
•Measured capacities range from key-hole to Rayleigh iid
• Median capacity is about 55% of the capacity of Rayleigh iidat 10 dB system SNR
• Capacity is higher at lower remote antenna height due to additional scattering
• Both vertical and horizontal arrays contribute to the overallcapacity of the channel
Conclusion (suburban)

Reinaldo Valenzuela 71
Urban Locations: Experiment goals
• Measure capacity supported by real channels in urbanand suburban environments
• Determine the impact of antenna spacing, polarization,antenna height, range, environment, etc. on capacity.
• Develop channel models to allow performanceassessment of proposed systems and algorithms

Reinaldo Valenzuela 72
BLAST Capacity in Urban:Manhattan) Environment, 16x16
• Goal:– Evaluate BLAST capacity in dense urban environments using
plausible antennas at transmitter and receiver.– Characterize MTMR Channel for stationary and low mobility
subscribers• Measurement Setup:
– Base station:• horizontal 2x8 array of polarized antennas• 600 HPBW, 4.16 dBi gain, 2 and 4 lambda spacing• ht : 100 m.• 16 discrete frequency tones• fc : 2.110 GHz + [4:32] KHz• Pt : 23 dBm/Ant
– Remote: van mounted• 4x4 array of alternating polarizations with laptop profile• 600 HPBW, 4.16 dBi gain, 1/2 lambda spacing• hr : 1.5 m.• 1.5 ms per H or 650 H matrices/second

Reinaldo Valenzuela 73
VSNR: Transmitter Block Diagram
AMP
to 15 other RF mixers
RFLO GPS
this portion appears atotal of 16 times
this portion appears atotal of 1 time
Po = +23 dBm
10 MHz freq.ref
XTONE
2 WSPLIT
LEGENDSMA coax cable or connector
1112
1314
1516
2X8 Transmitting Antenna Array with two polarizations
2 lambda
20 lambda = 3 m = 10 ft.
16 W SPLIT
F = 2.1 GHz + M*2 kHz|A|
F
910
78
56
34
12
4 lambda
Transmit 16 RF (2.1 GHz) tones separated by 2 kHz
GPSSIGNAL
Fc

Reinaldo Valenzuela 74
Multiple Antenna Terminals...
Many elements an be integrated on a lap top or palm device

Reinaldo Valenzuela 75
VSNR: Receiver Block Diagram
-60 dBm > Pin > -145 dBm
I/Q stream to disk
GPS RFLO
2WSPLIT
16 CHANNELRCVR
10 MHz freq. ref.LAT/LON
Fc = 2.1 GHz, BW = 32 kHz
Pin
F
1/2 lambda
1. 16 simultaneous I/Q pairs2. sample rate = 78,125 S/s/ch3. FFT size = 120 points4. Sample time = 1.5 ms5. RES BW = 650 Hz6. Typical file size = 2-3 GB7. 10 MHz GPS freq. ref.
sample 16 radios at 650 Hzchannel update rate

Reinaldo Valenzuela 76
Capacity & SNR for Single Drive Run
• 16 Tx 16 Rx• 10 dB System
SNR• Max 43 bps/Hz
(Rayleigh IID)• Min 7 bps/Hz
(Dyad)
1000 2000 3000 4000 5000 6000 7000 8000 90000
10
20
30
40
Cap
acity
bps
/Hz
10 d
B S
NR
D7 Measured Capacity 16 Tx 16 Rx
1000 2000 3000 4000 5000 6000 7000 8000 90000
10
20
30
40
Measured SNR
SN
R d
B

Reinaldo Valenzuela 77
0 100 200 300 400 500 6000
10
20
30
40
50Full Scattering (Rayleigh IID)
Keyhole (Dyad)
Cap
acity
bps
/Hz
10 d
B SN
R
0 100 200 300 400 500 6000
10
20
30
40
SNR
dB
Distance in meters
Measured Manhattan Capacity & SNR for aSingle Drive Run, D7
• 16 Tx 16 Rx• 10 dB System SNR• Max 43 bps/Hz
(Rayleigh IID)• Min 7 bps/Hz
(Dyad)
Measured SNR
Measured Capacity

Reinaldo Valenzuela 78
Drive Route & Capacity
• RED Very High 70to 88 bps/Hz
• YELLOW High50 to 70 bps/Hz
• GREEN Med.30 to 50 bps/Hz
• BLUE Low.10 to 30 bps/Hz
• 16Tx 16 Rx• 20 dB SNR• 1 Mile Range

Reinaldo Valenzuela 79
• 16Tx by 16 Rx• 10 dB System SNR
>10 dB Measured SNR
• 2 km Range
• RED Very High35 to 44 bps/Hz
• YELLOW High25 to 35 bps/Hz
• GREEN Med.15 to 25 bps/Hz
• BLUE Low.5 to 15 bps/Hz
Midtown Manhattan Drive Runs and Color-Coded Capacities

Reinaldo Valenzuela 80
Capacity at Constant Tx Power, Nt = Nr = 4
System SNR = Measured SNR
Meas. SNR from 10 to 44 dB
For sys SNR from 5 to 22 dB,just divide scale by 2.
Antenna Arrays:
Base height 100 m
Terminal height 1.5 m
H or V Polarized
1/2 wavelength spacing terminal
20 wavelength spacing at base
Base is at (0,0)
Cap
acity
bps
/Hz

Reinaldo Valenzuela 81
Capacity at Constant Tx Power, Nt = Nr = 16
System SNR = Measured SNR
Meas. SNR from 10 to 44 dB
For sys. SNR from 5 to 22 dB,just divide scale by 2.
Antenna Arrays:
Base height 100 m
Terminal height 1.5 m
H or V Polarized
1/2 wavelength spacing terminal
20 wavelength total base size
Base is at (0,0)
Cap
acity
bps
/Hz

Reinaldo Valenzuela 82
Measured Channel for BLAST 4Tx 4Rx
0 2 4 6 8 10 12 140
0.1
0.2
0.3
0.4
0.5
0.6
0.7
0.8
0.9
1
Capacity in bps/Hz at 10 dB SNR
Pro
babi
lity
Cap
acity
> A
bsci
ssa 1Tx 1Rx Conventional
4 Branch OC Diversity
4Tx 4Rx Measurements
Rayleigh IID BLAST
CCDF of Measured Capacity & Theoretical CapacitiesCDF is of entiredataset
Measured Capacity is90% of Rayleigh IID

Reinaldo Valenzuela 83
0 5 10 15 20 25 30 35 40 45 500
0.1
0.2
0.3
0.4
0.5
0.6
0.7
0.8
0.9
1
Capacity in bps/Hz at 10 dB SNR
Prob
abilit
y C
apac
ity >
Abs
ciss
a
N=1
N=2
N=4
N=16
Measured Rayleigh iid
Measured and Theoretical Capacities: all Manhattan Data
N = M

Reinaldo Valenzuela 84
Capacity for 16Tx 16Rx
0 10 20 30 40 50 60 70 80 90 1000
0.1
0.2
0.3
0.4
0.5
0.6
0.7
0.8
0.9
1
Capacity in bps/Hz at 20 dB SNR
Prob
abili
ty C
apac
ity >
Abs
ciss
a
CCDF of Measured Capacity & Theoretical Capacities
1Tx 1Rx Conventional
16 Branch OC Diversity
16Tx 16Rx Measured BLAST
16Tx 16Rx Rayleigh BLAST
CDF is of entiredataset
Measured Capacity is80% of Rayleigh IID

Reinaldo Valenzuela 85
Theory: Correlated Gaussian channels
• Separable correlation among transmit and receive elements:
(bps/Hz)
• H has complex Gaussian iid entries• ρρρρ is average SNR• ΦΦΦΦR is the covariance matrix of the receive elements• ΦΦΦΦT is the covariance matrix of the transmit elements• Hypothesis allows generation of H matrices based on local
covariance or angular spectra
*TR HHΦΦI
TnC ρ+= 2log

Reinaldo Valenzuela 86
Theory: Correlation vs. Antenna Separation
0 10 20 30 40 50 60 70 80−0.4
−0.2
0
0.2
0.4
0.6
0.8
1
Antenna separation (wavelengths)
Cor
rela
tion
Gaussian angular spectrum, std. dev. 20
Uniform (70 wide) angular spectrum
2 2cos( )
0 0
( ) , ( ) 1ijikdij e p d p d
π πα φρ α α α α−= =∫ ∫
XMTR
d
!

Reinaldo Valenzuela 87
Theory: 90% Capacity bound vs. AntennaSeparation
16 Transmitters, 2 deg rms angular spread at base station
16 receivers, uncorrelated remote antennas
SNR 10 dB
0 2 4 6 8 10 12 14 16 18 205
10
15
20
25
30
35
40
45
Base station antenna separation (wavelengths)
Cap
acity
bou
nd (9
0%),
(bps
/Hz)
Uniform
Gaussian
Gaussian beam, 2 polarizations Gaussian beam, 1 polarization Uniform 70 sector,1 polarization
XMTR
d
!

Reinaldo Valenzuela 88
Theory: Capacity vs. antenna coupling, 16x16, 100Scatterers/Ring, 10 dB System SNR
•10000 Wavelengths from Transmitter toReceiver.
•Scatterers Equally Spaced in a Circlearound Receiver, 1000 Wavelength Radius
•All waves propagating in the horizontalPlaneVertically Polarized
•Antenna Elements are all vertical, thin, half-wavelength dipoles,arranged in a regularsquare array.
•Transmitter Elements are spaced by 25wavelengths
•Look out for Supergain (Precise ChannelKnowledge.)
0
10
20
30
40
50
60
0 0.1 0.2 0.3 0.4 0.5
Cha
nnel
Cap
acity
, Bits
/Sec
/Hz
Antenna Element Spacing in Wavelengths
All Equal Eigenvalues
Rayleigh, iid
Channel Capacity
KeyholeCorrelation Coefficient
0.0
0.5
1.0
0.75
0.25
Cor
rela
tion
Coe
ffici
ent,
H11
.H21
*
10,000 lambda
1,000 lambda
XMTR RCVR

Reinaldo Valenzuela 89
5 6 7 8 9 10 11 12 13 140
0.1
0.2
0.3
0.4
0.5
0.6
0.7
0.8
0.9
1
Capacity in bps/Hz at 10 dB SNR
Prob
abilit
y C
apac
ity >
Abs
ciss
a
Measured: BLAST Capacity vs. TX spacing, 4 x 4
Measurements
Rayleigh IID
2 Lambda Spacing 6 Lambda Spacing 20 Lambda Spacing

Reinaldo Valenzuela 90
Additional narrowband measurements in suburban and urbanenvironments using smaller antenna arrays,
0.1, 0.2, 0.4, 0.8 lambda spacing at receiver<1.0 lambda at transmitter
Broadband MTMR sounder is in calibration.
10 Mchip/sec 16×16 MTMR sounder built by ITS* for joint work.
Collected data is being analyzed in support of model development
Ongoing Work
* Institute for Telecommunications Science, Boulder, CO.

Reinaldo Valenzuela 91
Conclusion (urban)
• Capacity Survey Performed in Manhattanwith high base, 16 Tx 16 Rx
• Lower capacity as Tx antennas are broughtcloser
• Measured capacity is a large faction ofcapacity of Rayleigh iid channel
Array Size % of Rayleigh IID2 Tx 2 Rx 99 %4 Tx 4 Rx 90 %16 Tx 16 Rx 80 %

Reinaldo Valenzuela 92
Conclusion (urban)
• Terrific BLAST capacity found in urban environments,
>90% of theoretical max with 4x4• Rich data set will support modeling and standards work
Array Size Measured mediancapacity(bps/Hz at 10 dB SNR)
Theoretical median capacity(bps/Hz with Rayleigh iid at 10 dB SNR)
1Tx 1Rx 3.46 3.46
2 Tx 2 Rx 5.8 5.88
4 Tx 4 Rx 10.3 11.116 Tx 16 Rx 32 43.7

Reinaldo Valenzuela 93
Wideband V-BLAST
With a narrowband receiver, the signal width isconstrained by the coherence bandwidth of thechannel. With the ever-growing push for higherdata rates, it is desirable to lift this limitation.If this constraint is violated, the channelintroduces Inter Symbol Interference and theperformance of a narrowband receiverdegrades rapidly.

Reinaldo Valenzuela 94
A Wideband BLAST Rx architecture
T T T...
ΣW2KW20 W21
[x(k)]elem2 [x(k-1)]elem2 [x(k-K)]elem2
T T T...
ΣW1KW10 W11
[x(k)]elem1 [x(k-1)]elem1 [x(k-K)]elem1
T T T...
ΣWNKWN0 WN1
[x(k)]elemN [x(k-1)]elemN [x(k-K)]elemN
...
" ym(k)
• Linear space-time processing: can be optimized with MMSE criterion• Important issues: synchronization, convergence, training

Reinaldo Valenzuela 95
Performance of Wideband MMSE Rx
4 6 8 10 12 1410
-4
10-3
10-2
10-1
100
Space and Space-Time Decision-Feedback Decorrelator, L=1
Unc
oded
BER
Average SNR (dB)
Space-only orSpace-Time MMSE
Receiver
Space-only MMSE Receiver(Narrowband BLAST)
Space-Time MMSEReceiver K=0,1,3, K
Delay-uncorrelatedChannel
0 1 0
L=1 L=0
L=1

Reinaldo Valenzuela 96
Small number of receive antennas
• Applications such as:– fixed wireless– indoor LANS– mobile laptops
may allow for large antenna configurations at the receiver
• However, today’s cellular handsets can only afford a very smallnumber of antennas (typically just 1), due to size, power andcost constraints
There is a need for efficient techniques that only employ many antennas at the transmitter (such as in downlink cellular
transmission)⇒

Reinaldo Valenzuela 97
A hierarchical view of wireless terminals
• Handsets: keep shrinking in size, multiple antennas (even 2) seem to be problematic
• PDA’s: their size remains fixed (or even increases) 2 antennas may be a reasonable design
• Laptops: more room for antennas. Multiple antennas combined with BLAST-type processor m
may offer high data rates (see ORINOCO product family)

Reinaldo Valenzuela 98
Space-Time Spreading
• A ``baby-BLAST’’ technique suitable for current 3G W-CDMA systems:
• Based on a ``transmit diversity’’ principle

Reinaldo Valenzuela 99
STS Transmitter architecture
• Each user’s sub-streams are multiplexed as follows:
1 ( )s i
c2
c1
2 ( )s i 2 2( )s i∗ c
1 1( )s i c
1 2( )s i∗ c
2 1( )s i c 2 1 1 2( ) ( )s i s i∗−c c
1 1 2 2( ) ( )s i s i∗+c c
B2
B2
D D
b i( )
1( )s i
c c1 2,⇒
are double length but are used for 2 sub-streams, no redundancy
and are odd and even samples from the sameuser’s data
2 ( )s i
[J-SAC, to appear]

Reinaldo Valenzuela 100
STS Receiver structure
• Simple MF-type processing yields:
( ){ } ( ) ( )2 21 2Re ( )H i h h i i′= + +H d s v
Provides full 2-branch diversity combining at the receiver!⇒
RFRFr t( )
c1
c 2
H HRel qRel q
1̂( )s i
2ˆ ( )s i
d i2 ( )
d i1 ( )
The case of complex user data can be equally handled (for M=2)

Reinaldo Valenzuela 101
Shannon capacity
• The STS scheme (or its non-spread counterpart, known as theAlamouti space-time coding scheme), achieves the following Shannoncapacity:
• Notice that this expression is identical to the BLAST (2,1) capacity (!):
• Moreover, in achieving this capacity, STS– uses temporal-only coding, in a disjoint fashion among sub-
streams– requires no channel knowledge or feedback from the receiver
22
STS 21
log 1 | |2 i
iC hρ
=
= +
∑
†STS 21 2
2 , 1
log det NM N
C CMρ
= =
= = +
I HH

Reinaldo Valenzuela 102
BALST for UMTS Background
• High speed data packet access (HSDPA) provided overthe downlink shared channel (DSCH) in UMTS.
• Multiple code channels for a single user.• Time-multiplexing between users.• Rate-adaptation so that users with higher SINR receiver
higher data rates.• Goal: enhance the HSDPA system using multiple
antennas at the transmitter and receiver [Multiple-inputmultiple-output (MIMO) techniques].
• Standards note: MIMO has been approved as a workitem with March 2002 completion date.

Reinaldo Valenzuela 103
MIMO in UMTS: Update and Status
• BLAST (MIMO) technologies proposed to 3GPP standards bodyfor use in high speed downlink packet access.
• Link and system level simulation results show promise of MIMOtechnologies.
• MIMO text has been included in the technical report to besubmitted to the March 2001 RAN plenary meeting for approvalto become a work item for UMTS Release 5 (scheduled to becompleted by March 2002).

Reinaldo Valenzuela 104
Transmitted signal Conventional HSDPA(single transmit antenna)
Ant
Scrambling code
Spreading code K
Spreading code 1
demuxChannelencoding,Interleaving,Map to symbols
+

Reinaldo Valenzuela 105
Transmitted signalMIMO transmission with M antennas• Each spreading code modulates M substreams
Spreading code 1
Ant 1
Ant M+
Scrambling code
demux
Spreading code K
Spreading code 2
Spreaddata
Spreaddata
Spreaddata
M substreams
M substreams
+Channelencoding,Interleaving,Map to symbols

Reinaldo Valenzuela 106
MIMO in UMTS: Technology Overview
• Extension of BLAST to multicode CDMA transmission– fat pipe: multiple CDMA codes assigned to one user– each code is re-used M times (M is number of transmit
antennas)– multiple antennas and BLAST processing used at receiver to
resolve spatial interference
De-muxEn-
code
SpreadA
SpreadB
De-spreadA
De-spreadB
MIMOdetec-tion
Mux De-code

Reinaldo Valenzuela 107
Transmission architectures
# TX code modulation rate per # sub- totalants technique rate substream streamsrate
1 Conv. 3/4 64QAM 540kbps 20 10.8Mbps
2 MIMO 3/4 8PSK 270kbps 40 10.8Mbps2 MIMO 3/4 16QAM 360kbps 40 14.4Mbps
4 MIMO ~1/2 QPSK 135kbps 80 10.8Mbps4 MIMO 3/4 QPSK 180kbps 80 14.4Mbps4 MIMO 3/4 8PSK 270kbps 80 21.6Mbps
All options use K = 20 spreading codes.

Reinaldo Valenzuela 108
Receiver architecture
• Multiple antennas and space-time processing used at receiverto resolve spatial interference.
• Space-time processing can be maximum likelihood or VBLAST.
Despread 1
Space-timeproces-sing
Mux Demap,deinterleave,decode
Despread K
Despread 1
Despread K
spatialcombi-ning
spatialcombi-ning
Space-timeproces-sing
M
M
Ant P
Ant 1
KM P
P

Reinaldo Valenzuela 109
MIMO in UMTS: Link level simulation results
• Assumptions:– Turbo coding– 20 codes– 3km/hr– flat fading– known channel
5 10 15 20 25 30 35 4010
-4
10-3
10-2
10-1
100
Ior/Ioc (dB)
FER
(4,4)(2,2)
(1,1)10.8Mbps64QAM
(1,4)10.8Mbps64QAM
14.4Mbps16QAM
10.8Mbps8PSK10.8Mbps
4PSK
14.4Mbps4PSK
21.6Mbps8PSK

Reinaldo Valenzuela 110
Link level simulation results
• Assumptions:– Turbo coding– 3km/hr– flat fading– known channel– uncorrelated
spatial fading
5 10 15 20 25 30 35 4010-4
10-3
10-2
10-1
100 flat 3km/hr, known channel
Ior/Ioc (dB)
FER
4 tx, 4 rx
2 tx, 2 rx
10.8Mbps64QAM
14.4Mbps16QAM
10.8Mbps8PSK
10.8Mbps4PSK
14.4Mbps4PSK
21.6Mbps8PSK
1 tx, 1rx
Dashed: VBLAST
Solid: ML

Reinaldo Valenzuela 111
Additional link level results
• No significantperformancedegradation due to
– Faster Dopplerspeeds (up to30km/hr) and/or
– Non-idealchannelestimation
0 5 10 15 20 25 3010
-3
10-2
10-1
100
Eb/N0 (dB)
FER
flat, uncorr, 3km/hr, known channelsflat, uncorr, 30km/hr, known cha nne lsflat, uncorr, 30km/hr, es timate d channels
(4,4)21.6Mbps
(4,4)10.8Mbps (4,4)
14.4Mbps
(1,1)10.8Mbps
(2,2)14.4Mbps
(2,2)10.8Mbps

Reinaldo Valenzuela 112
Additional link level results
• Effects of spatialcorrelation– minimal
degradation for2 transmitterMIMO
5 10 15 20 25 30 3510
-3
10-2
10-1
100
Ior/Ioc (dB)
FER
(1,1) conventiona l(2,2) uncorre la te d channels ,ML(2,2) corre la ted channe ls , ML
Measuredurbanchannel
10.8Mbps

Reinaldo Valenzuela 113
Additional link level results
• Effects of spatialcorrelation– performance
for 4transmitterMIMO can beimproved byusing 2transmitters.
5 10 15 20 25 30 3510
-3
10-2
10-1
100
Ior/Ioc (dB)
FER
(4,4) uncorrelated channels, ML
(2,4) uncorrelated channels, VBLAS T(4,4) correlated channe ls, VBLAS T(2,4) correlated channe ls,wors t 2 of 4 trans mitters, VBLAS T
(4,4) uncorrelated channels, VBLAS T
Measuredurbanchannel
14.4Mbps

Reinaldo Valenzuela 114
System level simulation results
• Assumptions:– 19 cell system, 3 sectors/cell– consider center cell; max power tx from other cells– Round robin scheduling, transmit to one user at a time.– RAN-specified packet-call model: packet-calls with Pareto dist. (mean
210Kbytes), interarrival time with geometric dist. (mean 5 seconds).– same link level assumptions as before– “optimum” transmission for each user: MIMO transmission for users
with high Ior/Ioc, selection diversity for those with low Ior/Ioc.• Average sector throughput for fully utilized system:
– (1,1), 1.96 Mbps (20 users), 64-QAM, 3/4 convolutional code– (2,2), 3.24 Mbps (20 users), 8-PSK, 3/4 convolutional code– (4,4), 5.37 Mbps (40 users), QPSK, 1/2 conv. code with puncturing

Reinaldo Valenzuela 115
Practical considerations at base station
• Orthogonal pilot sequences for each transmit antenna:backwards compatible
• Total transmit power is same as conventional case; eachantenna transmits with 1/M power.
• For uncorrelated fading, 10 lambda spacing is sufficient. Usingdual polarized antennas, 4 antennas fit in 1.5m.
13cm
8 cm
1.5 m
Antennas used in MIMO channel measurements

Reinaldo Valenzuela 116
Practical considerations at the terminal
• For uncorrelated fading, 1/2 lambda spacing is sufficientbecause of local scatterers.
• Each antenna requires RF/IF chain. Significant cost savingsusing direct conversion (homodyne) solutions.
• 20% and 70% of baseband processing used by VBLASTdetector and turbo decoder, respectively, for (4,4) receiver.Overall processing is within range of existing hardwaretechnologies.
13cm
15cm
Antennas used in MIMOchannel measurements
Reinaldo Valenzuela 117
MIMO in UMTS: Conclusions
• MIMO achieves high data rates (10.8 Mbps) moreefficiently than conventional diversity techniques(QPSK Vs. 64 QAM)
• MIMO achieves higher peak data rates (up to 21.6Mbps).
• Future work:– alternative transmission/detection/decoding
techniques– closed loop MIMO techniques– equalization for frequency selective fading– reduced-complexity receiver processing

Reinaldo Valenzuela 118
CONCLUSIONS
• BLAST overcomes conventional limits• Capacity gains can be very large• Demonstrated experimentally indoors• Very large measured urban and suburban
capacities• Practical implementations achieve
significant fraction of capacity: V-Blast, T-BLAST
• Near term impact on CDMA2000 and UMTS


