Species wide analysis of Escherichia coli identifies a negative regulatory input that controls flhDC transcription Senan Almashta M.Sc., B.Sc. Thesis submitted in partial fulfilment of the requirements of the regulations for the degree of Doctor of Philosophy Centre for Bacterial Cell Biology Institute for Cell and Molecular Biosciences Faculty of Medical Sciences June 2018
Transcript
Species wide analysis of Escherichia
coli identifies a negative regulatory
input that controls flhDC transcription
Senan Almashta M.Sc., B.Sc.
Thesis submitted in partial fulfilment of the requirements of the
regulations for the degree of Doctor of Philosophy
Centre for Bacterial Cell Biology Institute for Cell and Molecular Biosciences
Faculty of Medical Sciences June 2018
i
Abstract
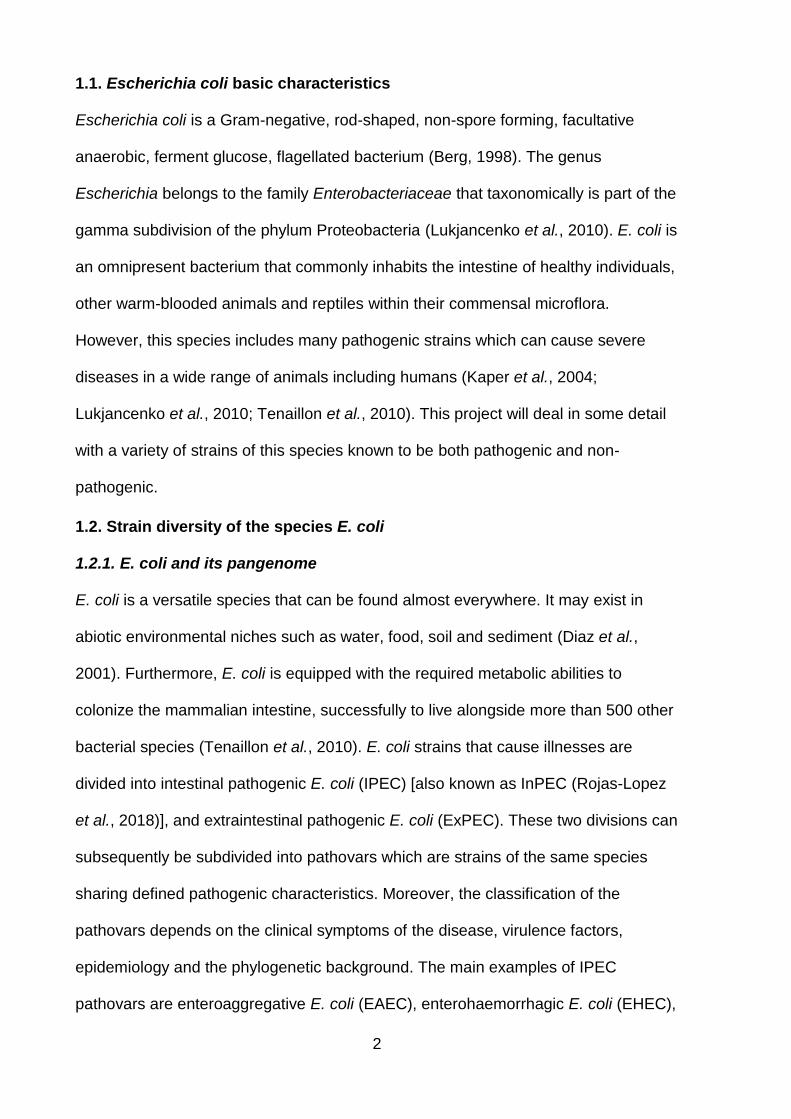
Escherichia coli is a species of bacteria that can be found almost everywhere. It
belongs to the family Enterobacteriaceae which, in turn, belongs to gamma
subdivision of the phylum Proteobacteria. Genomic plasticity and the ability of genes
to transfer across different strains contributed to the division of E. coli into six major
phylogenetic lineages: A, B1, B2, D, E and F. The motility organelle of bacteria is the
flagellum which consists of: basal body, hook and filament. The flagellar system of E.
coli organised into a transcriptional hierarchy strictly dependent on the expression of
the flagellar master regulator, FlhD4C2.
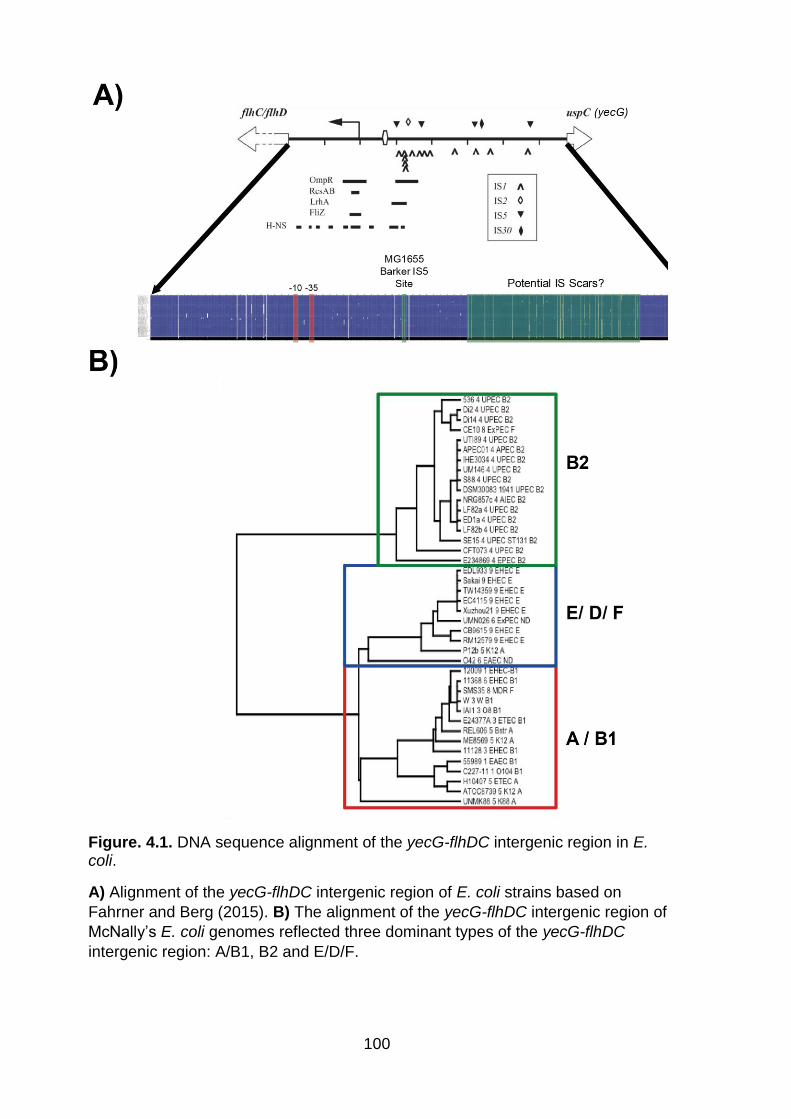
Bioinformatic analysis of the yecG-flhDC intergenic region showed that the
DNA sequence of this region could be grouped into a phylogeny that reflects the
phylogenetic clades of E. coli. However, three dominant sequence types of the yecG-
flhDC intergenic region mapped to clades: A/B1, B2 and D/E/F. We illustrated the
impact of replacing the yecG-flhDC intergenic region of the weakly motile strain
MG1655 with the same region of model strains on motility. Our data revealed
dramatic increase in motility in the newly created strains. We also dissected the
yecG-flhDC intergenic region to investigate the effect of each part on motility. Our
analysis revealed that the yecG is a negative regulator of flhDC expression.
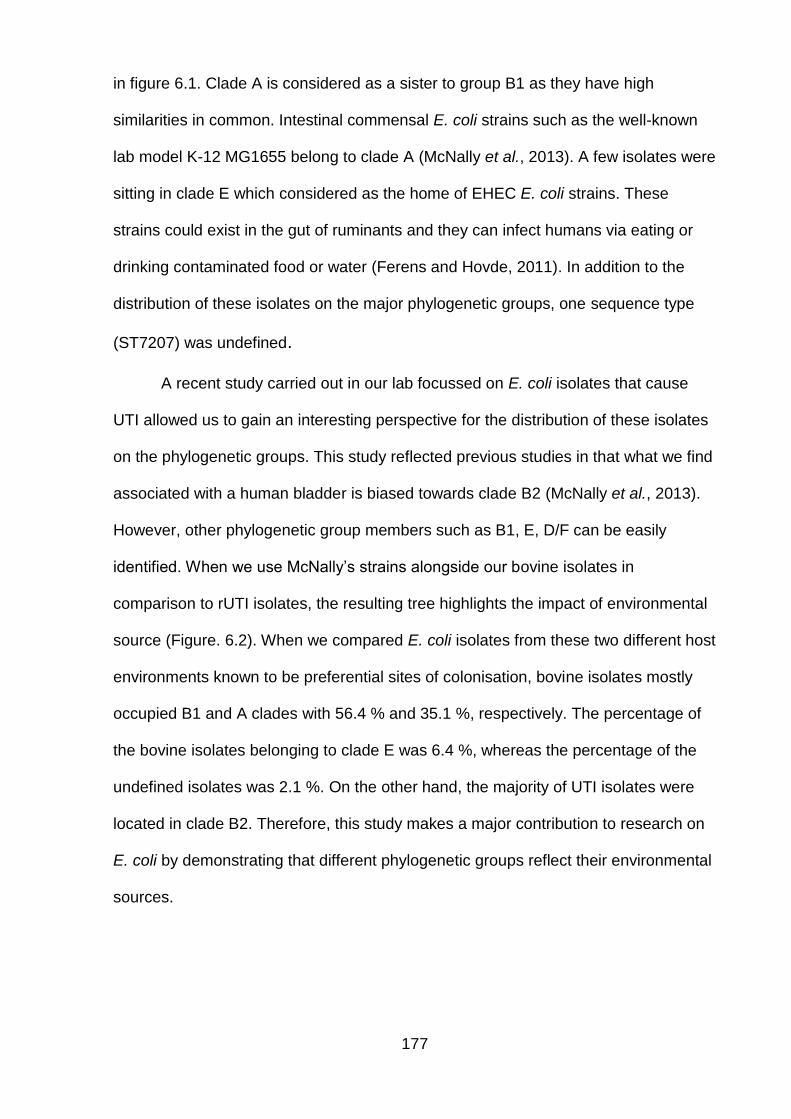
We tested the impact of host niche environments on the motility phenotype of
E. coli. For this reason, we sequenced a collection of bovine strains and aligned them
to their phylogenetic groups and compared them to another collection isolated from
UTIs. The data showed that the bovine isolates lie mostly in clades B1 and A,
whereas UTI isolates mostly occupy clades B2 and D/F. The bovine strains exhibited
robust motility compared to the UTI strains. We screened the yecG-flhDC intergenic
region for IS elements, and found no isolate has the IS element.
ii
Dedication
This work is dedicated to the memory of my mother and father.
iii
Acknowledgements
Firstly, I would like to thank my supervisor Dr. Phillip Aldridge for providing me with
this great opportunity to study a PhD in a well accredited university which has an
advanced global ranking. His assistance has been vitally important in supervising me
and helping me to maintain focus in order to achieve the findings for this project. I
would also acknowledge my assessors Dr. David Bolam and Dr. Henrik Strahl for
their advice throughout my work. I would like to express my gratitude to Prof. Mark
Fielder at Kingston University in London for providing the bovine strains. A special
thanks to my postgraduate tutor Dr. Timothy Cheek for his continuous support and
kind understanding.
My thanks to everyone who helped me in the Centre for Bacterial Cell Biology
and the Medical School at Newcastle University. I would also like to include my
heartfelt appreciation for my friends in Iraq and the UK who exhibited real support to
me in my life, during times of both happiness and sadness. A big thanks to my
sponsor: The Higher Committee for Education Development in Iraq for sending me to
study a PhD in the UK, and for their funding during my scholarship. Notable thanks to
the Ministry of Higher Education and Scientific Research in Iraq and the University of
Babylon for their approval in allowing me to gain this doctorate.
Senan Almashta, May 2018
iv
Table of Contents
Abstract ........................................................................................................................ i
Dedication .................................................................................................................... ii
Acknowledgements ..................................................................................................... iii
Table of Figures ........................................................................................................ viii
Table of Tables ........................................................................................................... xi
List of Abbreviations .................................................................................................. xii
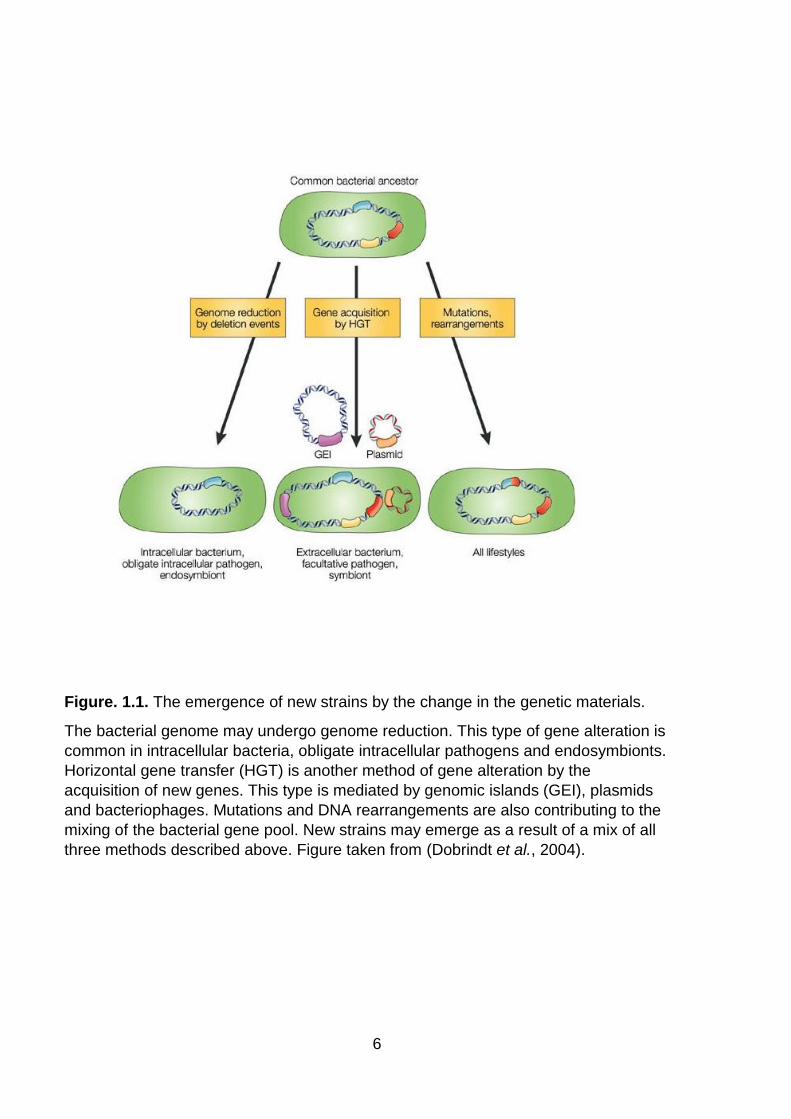
Figure. 1.1. The emergence of new strains by the change in the genetic materials ... 6
Figure. 1.2. Phylogenetic groups of the ECOR collection ......................................... 10
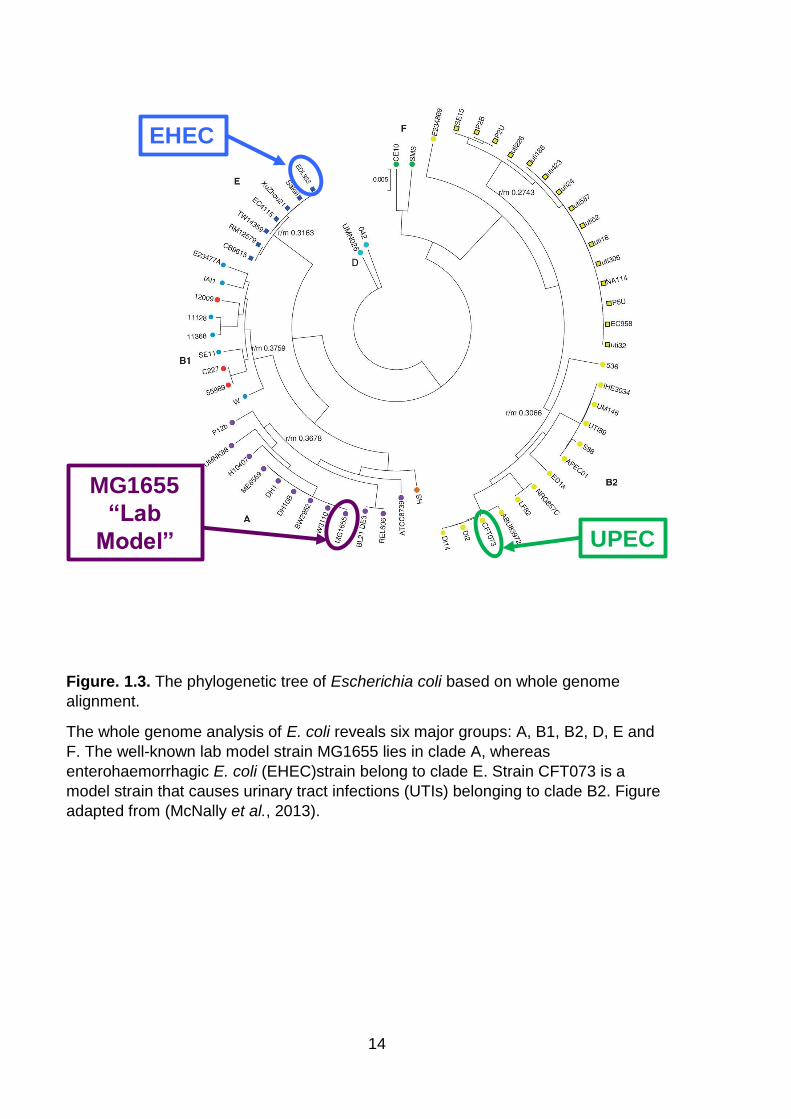
Figure. 1.3. The phylogenetic tree of Escherichia coli based on whole genome alignment .................................................................................................................. 14
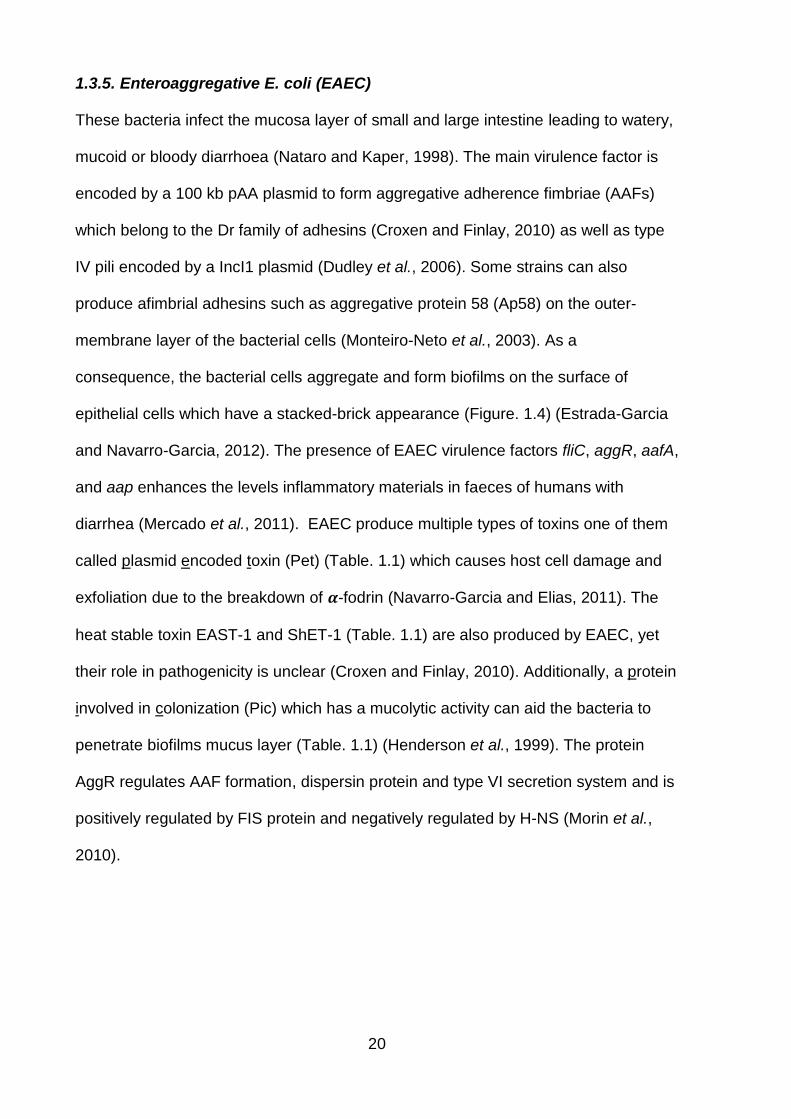
Figure. 1.4. Virulence factors and mode of infection of Enteroaggregative E. coli .... 21
Figure. 1.5. Pathogenecity of urinary tract infection by uropathogenic E. coli ........... 27
Figure. 1.6. Datsenko and Wanner method of gene removal .................................... 29
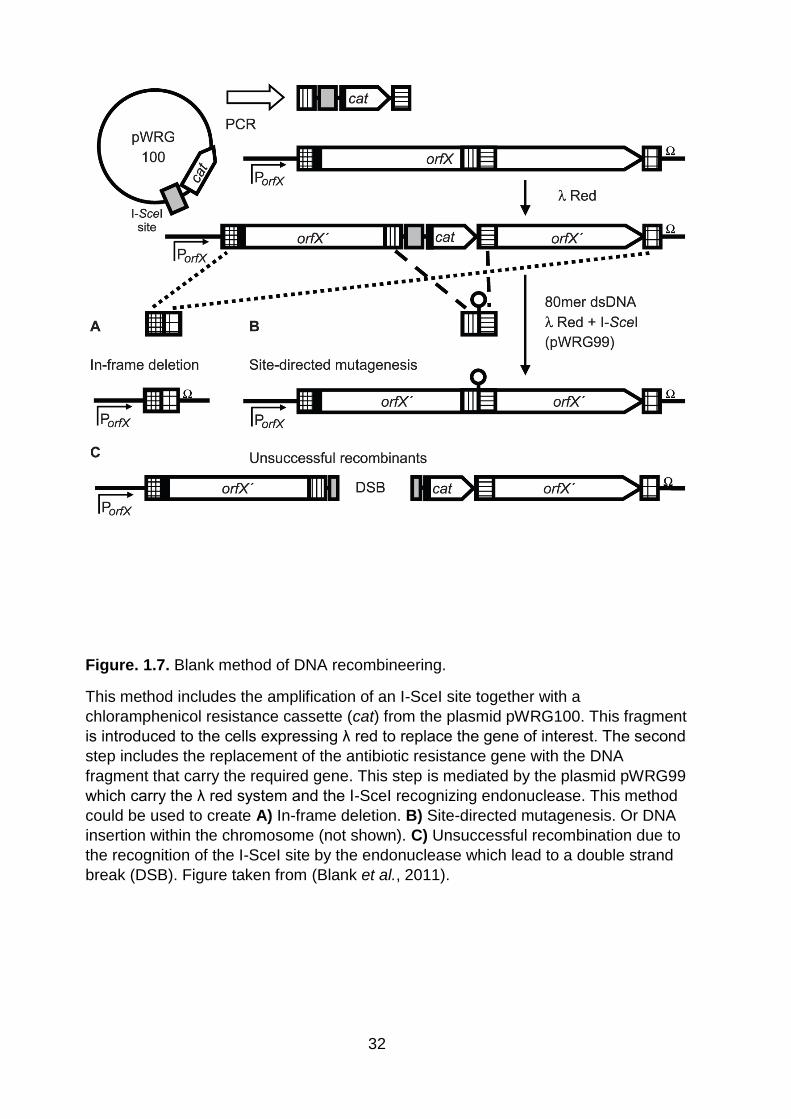
Figure. 1.7. Blank method of DNA recombineering ................................................... 32
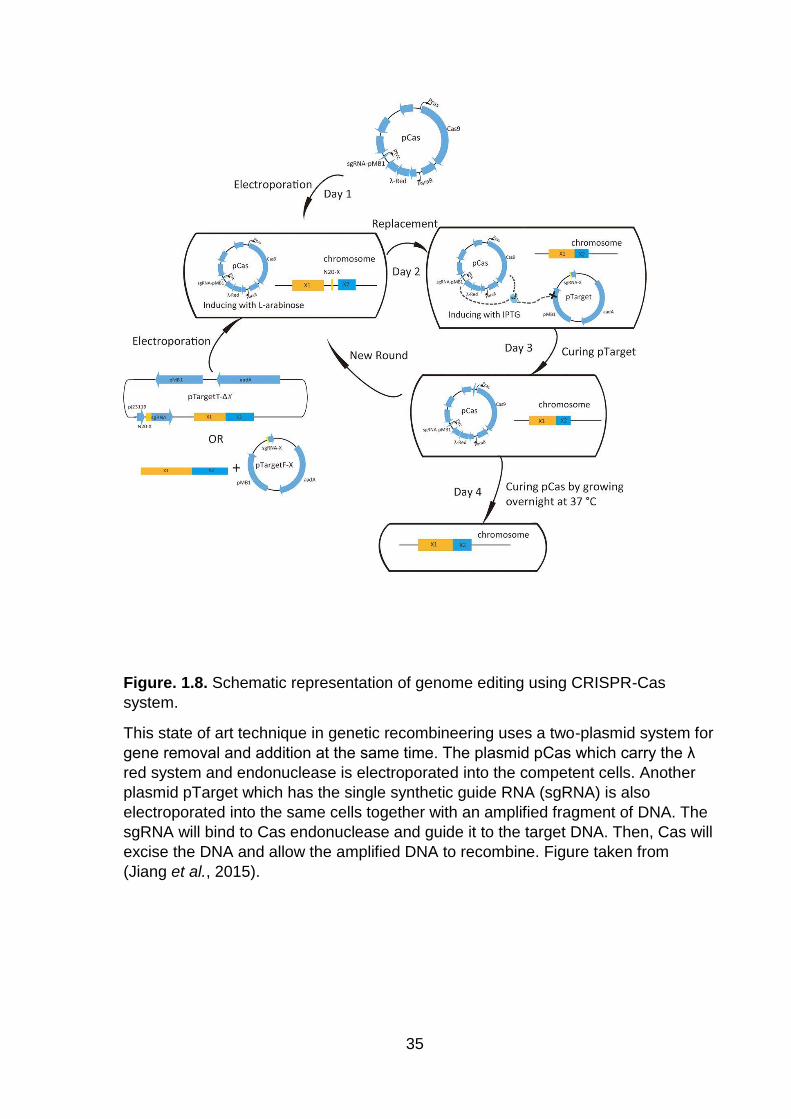
Figure. 1.8. Schematic representation of genome editing using CRISPR-Cas system .................................................................................................................................. 35
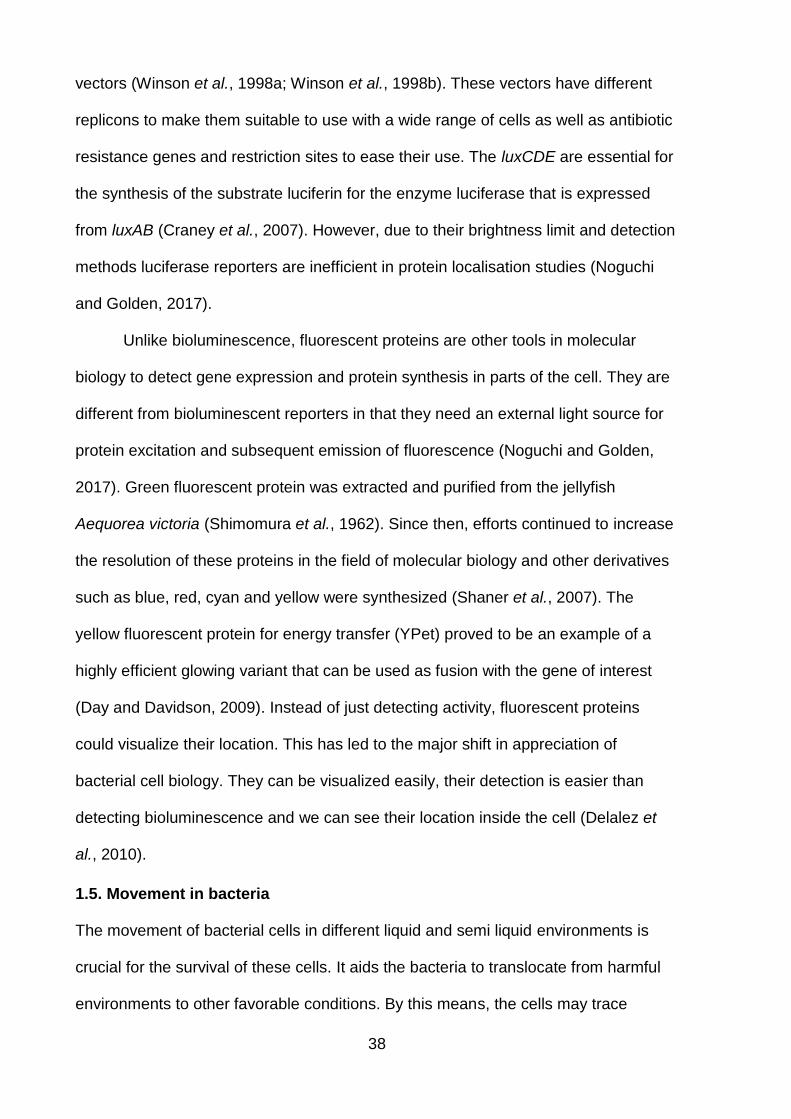
Figure. 1.9. The main structural components of the flagellum .................................. 43
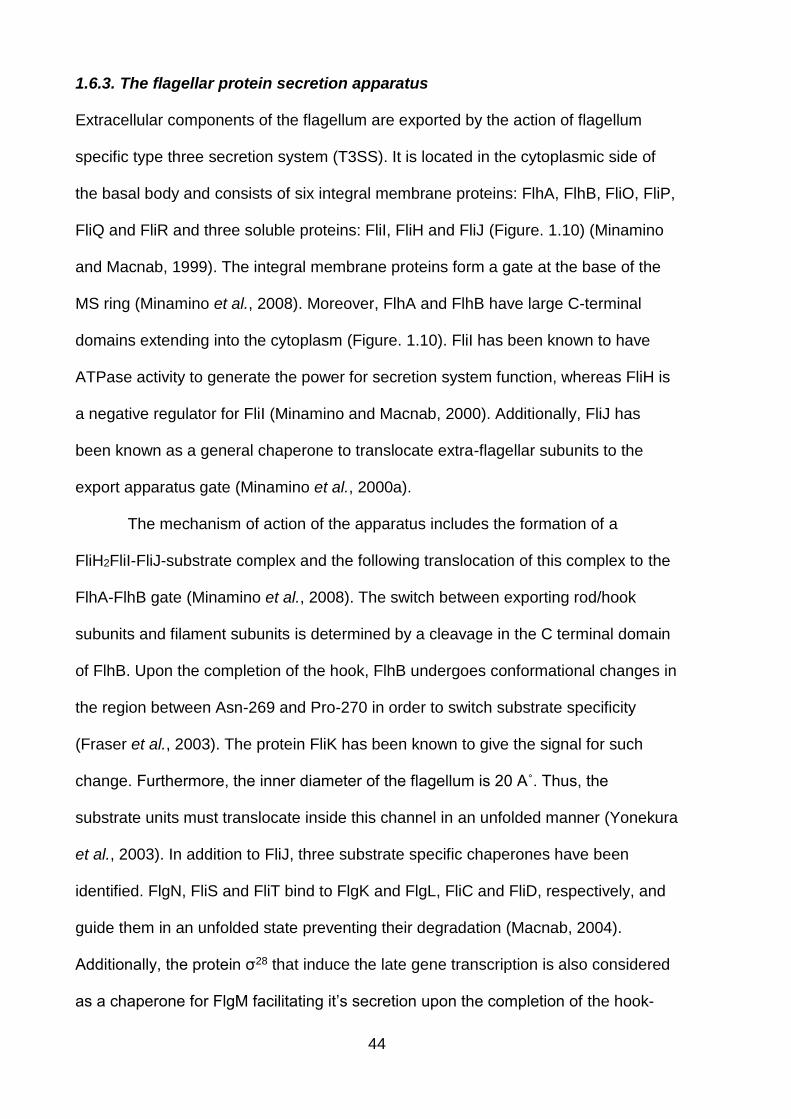
Figure. 1.10. Schematic model of the flagellar protein secretion apparatus .............. 46
Figure. 1.11. Schematic representation of the transcription hierarchy of flagellar promoter classes ...................................................................................................... 50
Figure. 1.12. The crystallographic structure of the flagellar master regulator, FlhD4C2
Figure. 1.13. Paradigm of the insertion sequence element structure ........................ 59
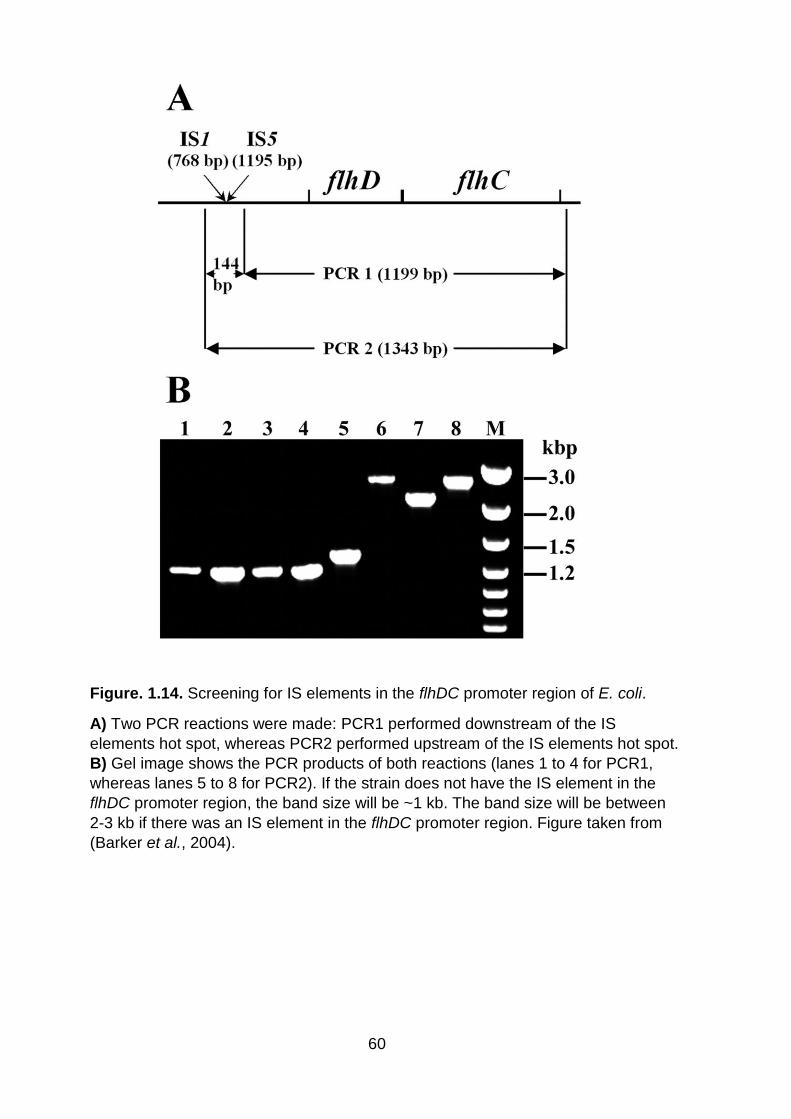
Figure. 1.14. Screening for IS elements in the flhDC promoter region of E. coli ....... 60
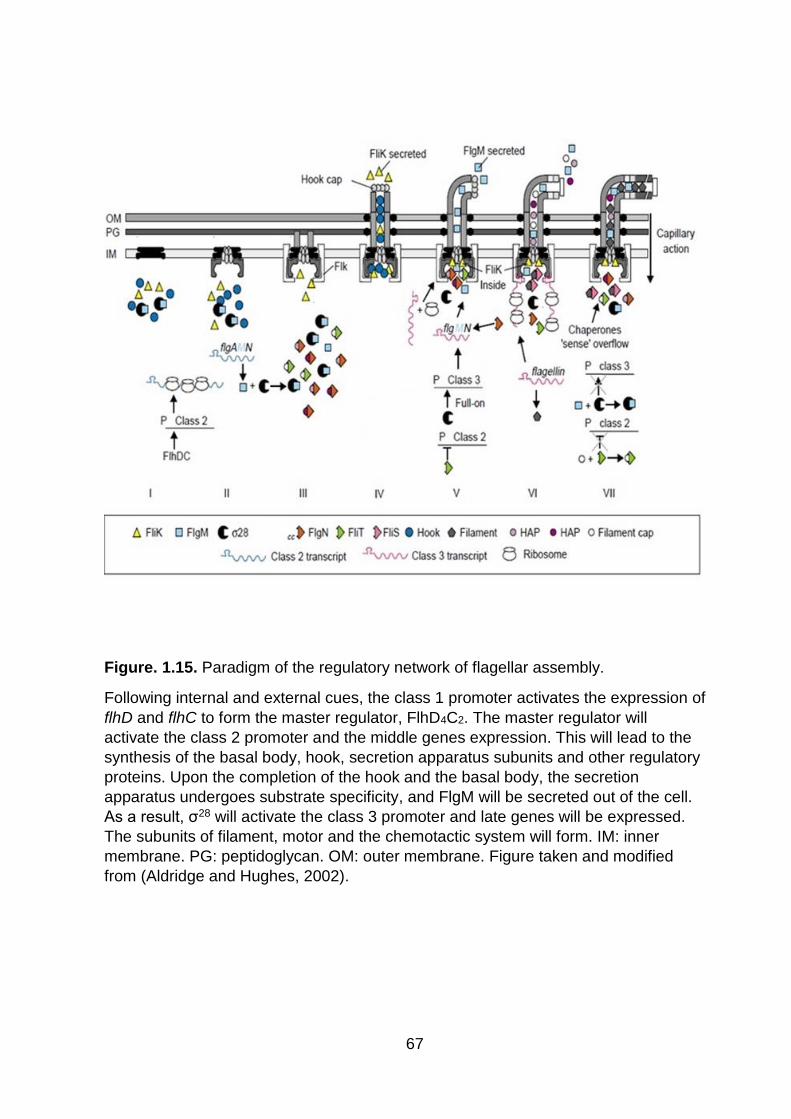
Figure. 1.15. Paradigm of the regulatory network of flagellar assembly ................... 67
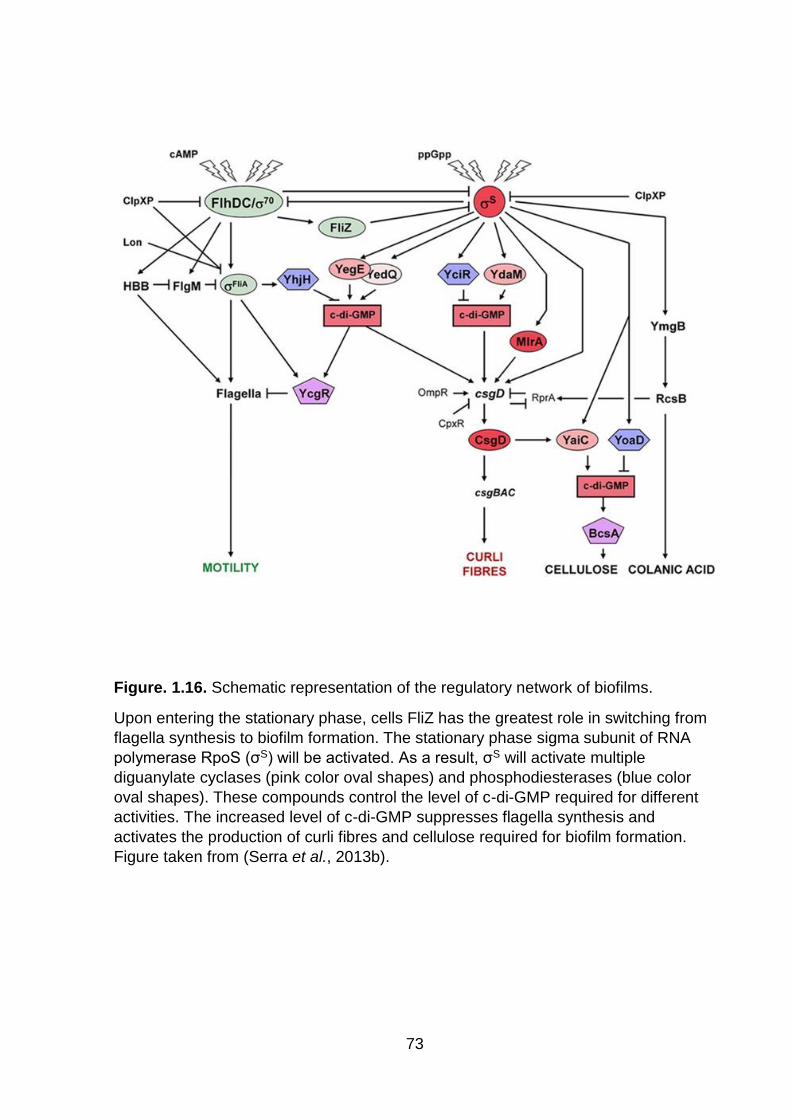
Figure. 1.16. Schematic representation of the regulatory network of biofilms ........... 73
Figure. 4.1. DNA sequence alignment of the yecG-flhDC intergenic region in E. coli ................................................................................................................................ 100
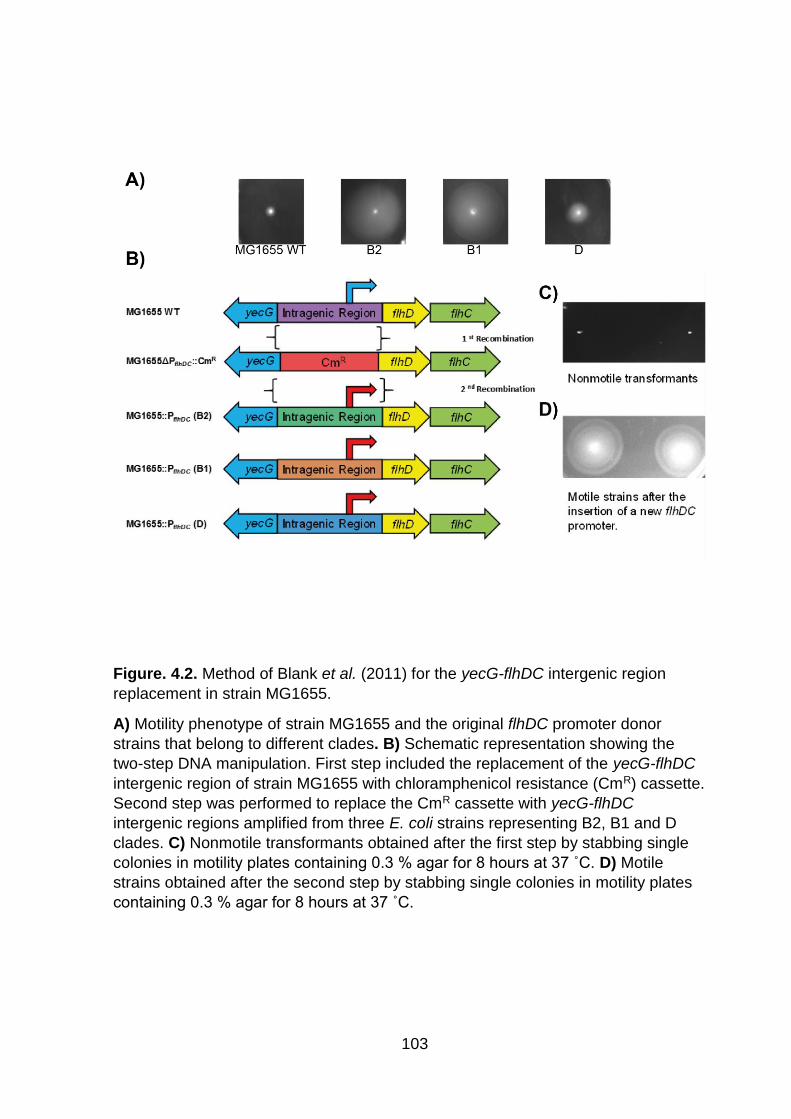
Figure. 4.2. Method of Blank et al. (2011) for the yecG-flhDC intergenic region replacement in strain MG1655 ................................................................................ 103
Figure. 4.3. Motility quantification of strain MG1655 before and after yecG-flhDC replacement ............................................................................................................ 104
Figure. 4.4. Schematic representation of traditional and Gibson cloning method used for the plasmid pSB401........................................................................................... 109
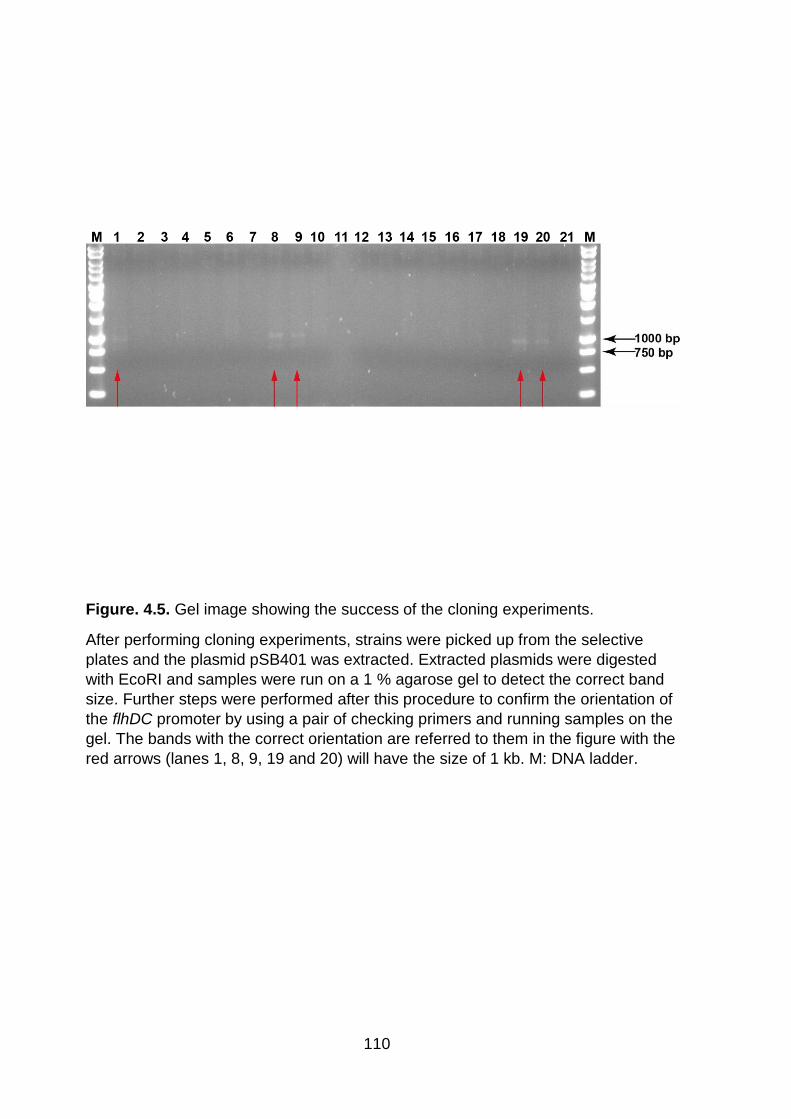
Figure. 4.5. Gel image showing the success of the cloning experiments ................ 110
Figure. 4.6. Activity of the flhDC promoters from the original strains in MG1655 derivatives at 30 ˚C ................................................................................................. 113
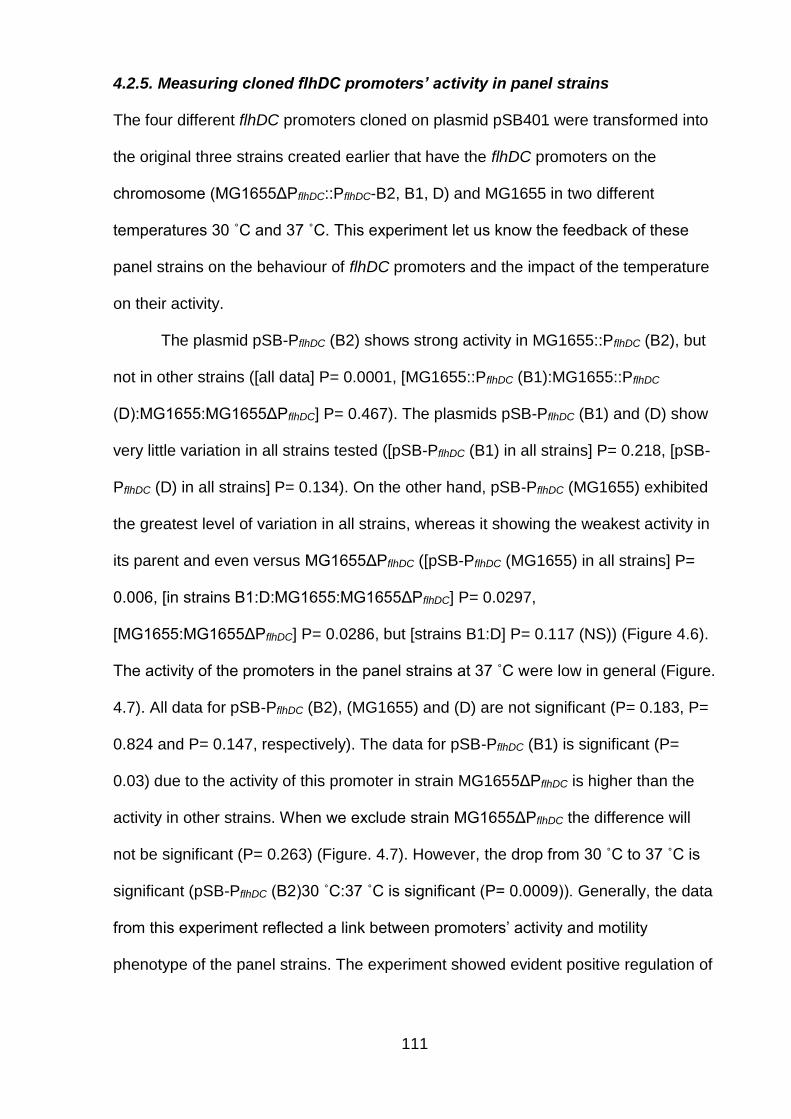
Figure. 4.7. Activity of the flhDC promoters from the original strains in MG1655 derivatives at 37 ˚C ................................................................................................. 114
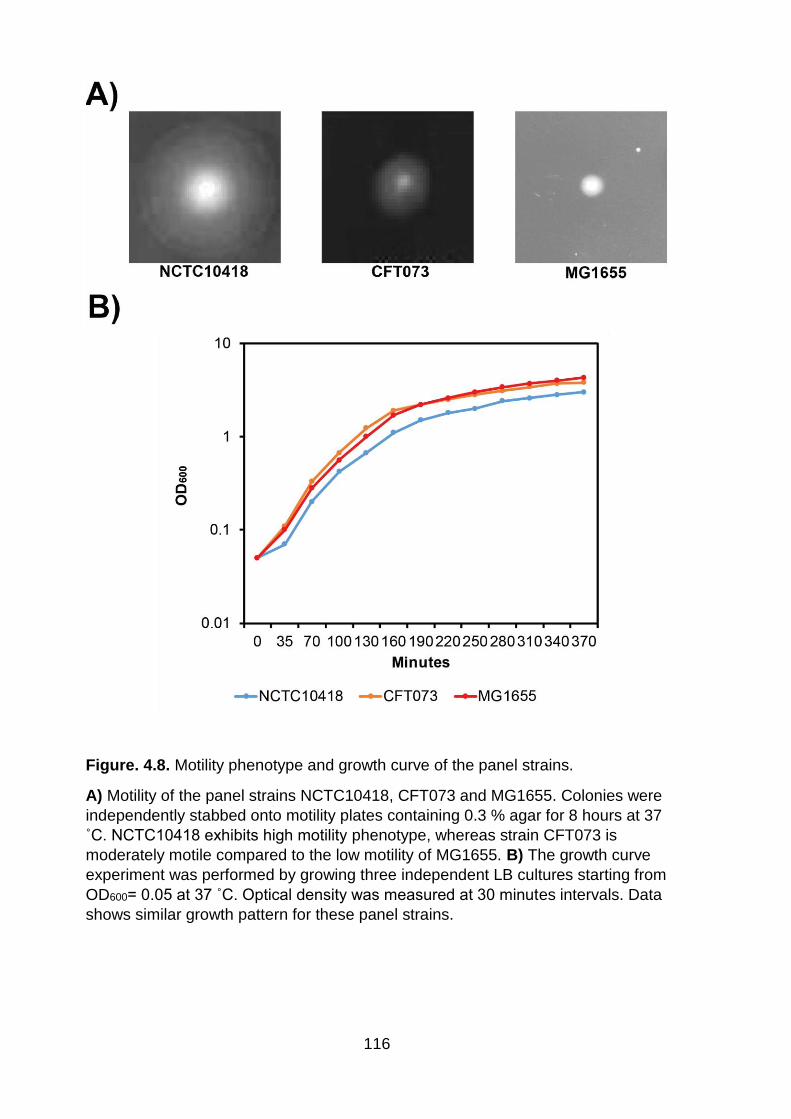
Figure. 4.8. Motility phenotype and growth curve of the panel strains .................... 116
Figure. 4.9. Activity of the flhDC promoters in panel strains NCTC10418, CFT073 and MG1655 .................................................................................................................. 118
ix
Figure. 4.10. Activity of the flhDC promoters in panel strains in minimal media with 1 g/l yeast extract at 30 ˚C and 37 ˚C ......................................................................... 121
Figure. 4.11. Activity of the flhDC promoters in panel strains in minimal media with 0.04, 0.2, 1, 3 g/l yeast extract at 30 ˚C and 37 ˚C .................................................. 122
Figure. 4.12. Impact of global regulators on motility of species E. coli .................... 126
Figure. 4.13. Confirmation step of Δcrp mutants on MacConkey agar .................... 128
Figure. 4.14. Control experiment of the MG1655 and UTI89 flhDC promoter replacement ............................................................................................................. 131
Figure. 4.15. Fluorescent microscope images of MG1655 and MG1655ΔPflhDC::PflhDC-B2, B1, D with fliM-yPet ........................................................................................... 134
Figure. 4.16. Quantification of fliM-yPet foci in MG1655::fliM-yPet, MG1655::PflhDC-B2::fliM-yPet, MG1655::PflhDC-B1::fliM-yPet and MG1655::PflhDC-D::fliM-yPet ......... 135
Figure. 5.1. Dissection of the yecG-flhDC intergenic region showing different zones ................................................................................................................................ 142
Figure. 5.2. Impact of deleting the yecG-flhDC intergenic region zones of strains MG1655 and MG1655::PflhDC(B2) on motility ........................................................... 144
Figure. 5.3. Quantification of motility of the yecG-flhDC intergenic region deletion mutants of strains MG1655 and MG1655::PflhDC(B2) ............................................... 148
Figure. 5.4. Gel images showing the multiple bands during the creation of ΔREG mutants and DNA alignment showing the hairpins .................................................. 149
Figure. 5.5. Dissection of the yecG-flhDC SCAR region in MG1655 and MG1655::PflhDC(B2) ................................................................................................. 151
Figure. 5.6. Motility quantification of SCAR fragments deletion mutants of strain MG1655::PflhDC (B2) ................................................................................................ 153
Figure. 5.7. Motility quantification of SCAR fragments deletion mutants of strain MG1655 .................................................................................................................. 154
Figure. 5.8. Activity of PflgB and PfliC in yecG-flhDC zones deletion mutants ............ 157
Figure. 5.9. Activity of PflgB and PfliC in SCAR fragments deletion mutants .............. 158
Figure. 5.10. Motility quantification of yecG deletion mutants in strains MG1655::PflhDC(B2) and MG1655 ............................................................................ 161
Figure. 5.11. Schematic representation review of motility phenotypes of miscellaneous strains .............................................................................................. 164
Figure. 5.12. Impact of replacing the SCAR region in strain MG1655 with the SCAR region of strain MG1655::PflhDC (B2) on motility ....................................................... 165
Figure. 5.13. Activity of the yecG promoter of strains MG1655 and CFT073 .......... 168
Figure. 6.1. Distribution of bovine isolates on the phylogenetic groups of McNally et al. (2013) ................................................................................................................. 178
Figure. 6.2. Distribution of bovine and UTI isolates on phylogenetic groups of McNally et al. (2013) ............................................................................................................. 179
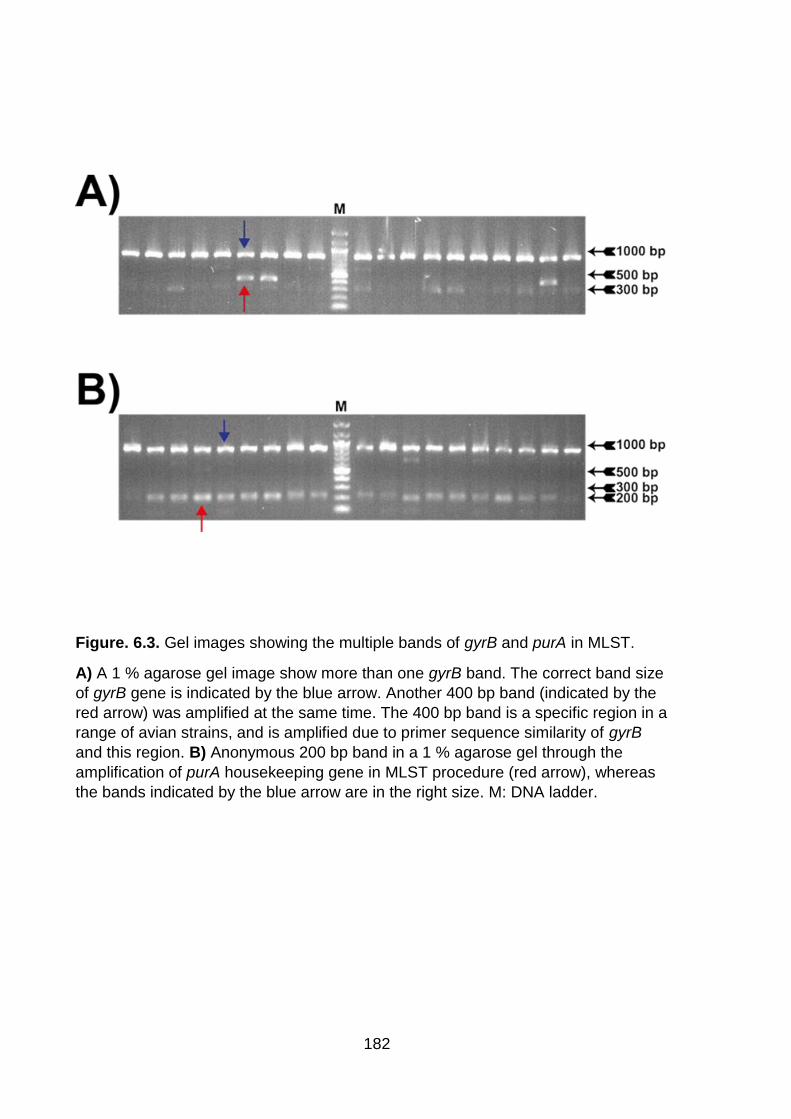
Figure. 6.3. Gel images showing the multiple bands of gyrB and purA in MLST ..... 182
x
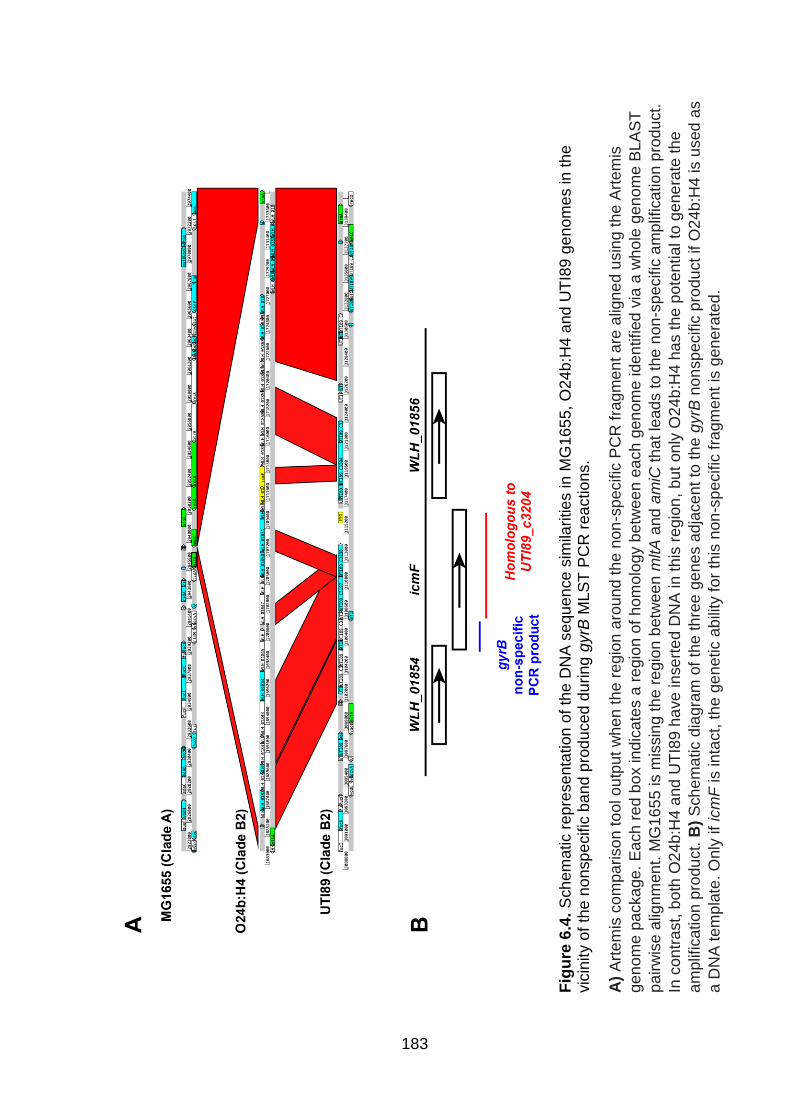
Figure. 6.4. Schematic representation of the DNA sequence similarities in MG1655, O24b:H4 and UTI89 genomes in the vicinity of the nonspecific band produced during gyrB MLST PCR reactions ...................................................................................... 183
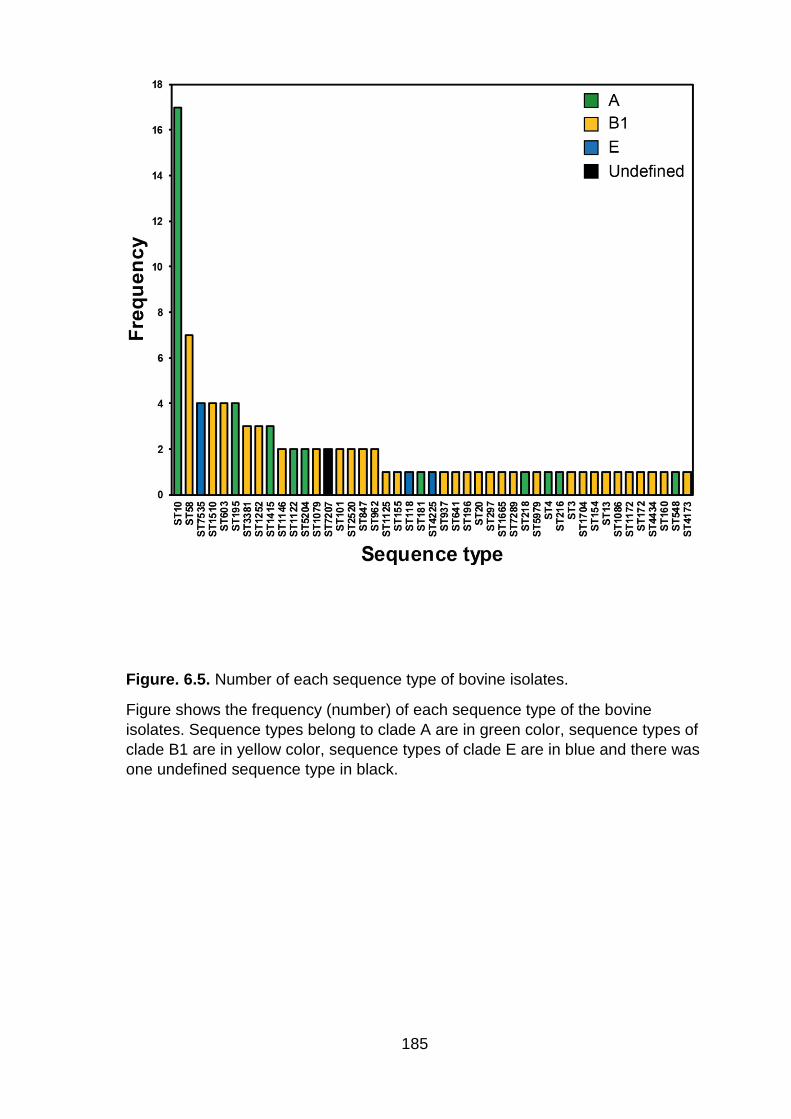
Figure. 6.5. Number of each sequence type of bovine isolates .............................. 185
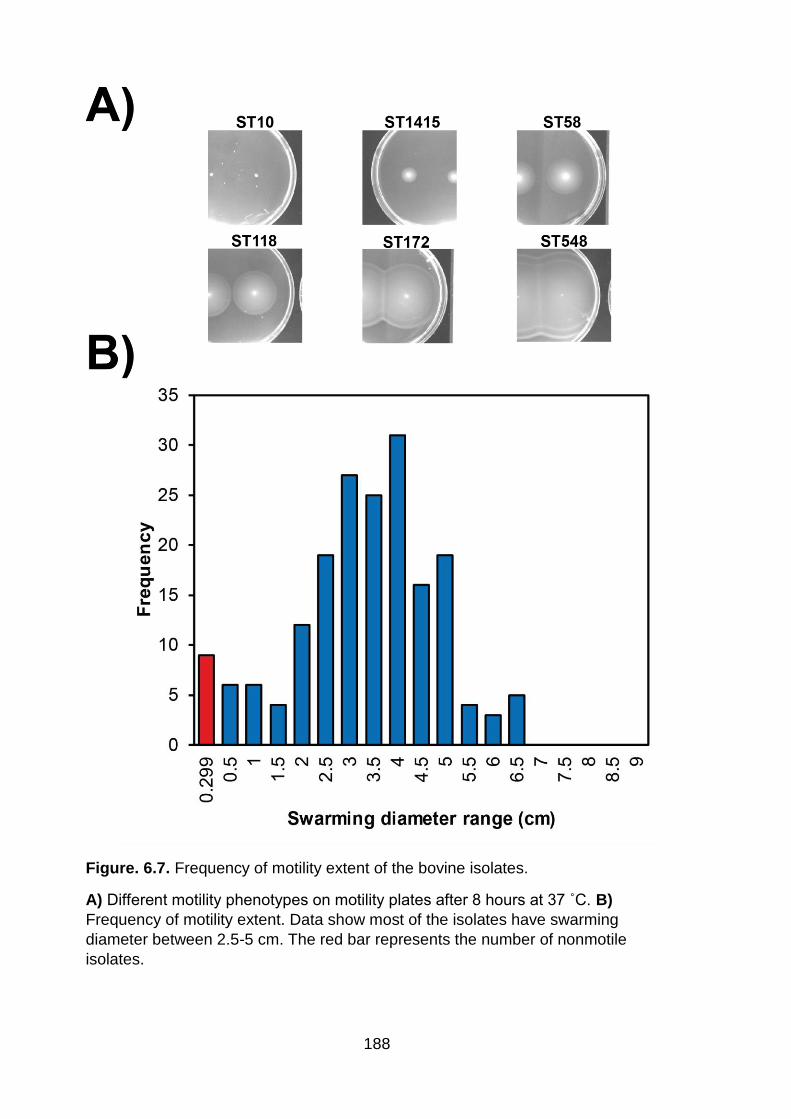
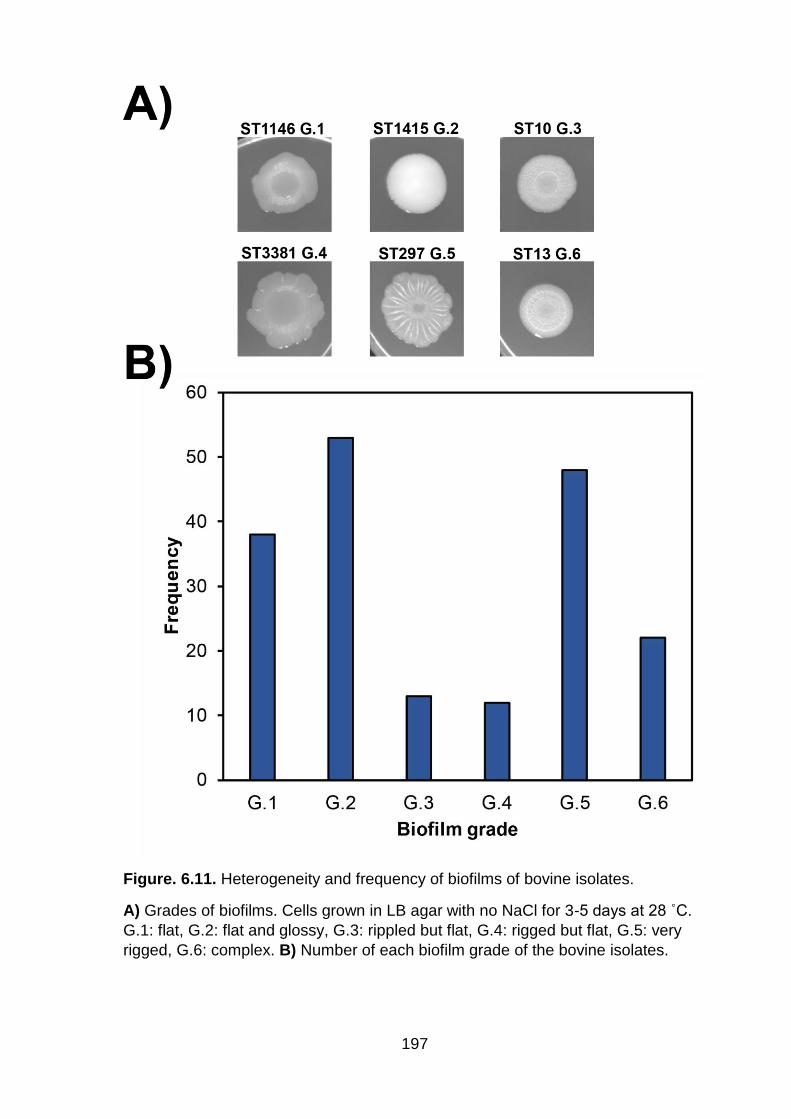
Figure. 6.6. The percentage of motile and nonmotile bovine and UTI isolates ....... 187
Figure. 6.7. Frequency of motility extent of the bovine isolates .............................. 188
Figure. 6.8. Frequency of bovine isolates sequence types that are motile and nonmotile ................................................................................................................ 190
Figure. 6.9. Screening for IS elements in the yecG-flhDC intergenic region of UTI isolates .................................................................................................................... 193
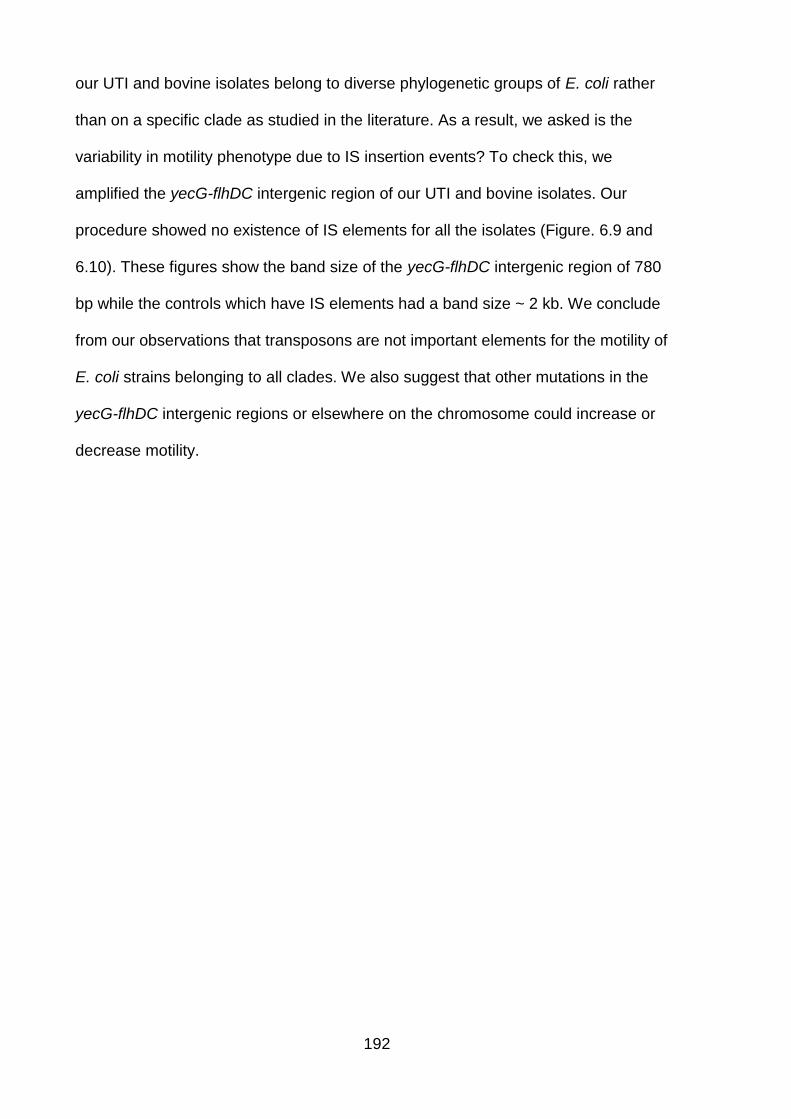
Figure. 6.10. Screening for IS elements in the yecG-flhDC intergenic region of bovine isolates .................................................................................................................... 194
Figure. 6.11. Heterogeneity and frequency of biofilms of bovine isolates ............... 197
Figure. 6.12. Frequency of biofilm grades of different clades of bovine isolates ..... 198
Figure. 8.1. Image showing an example of full motility plates used during the flhDC promoter replacement of strain MG1655 ................................................................ 232
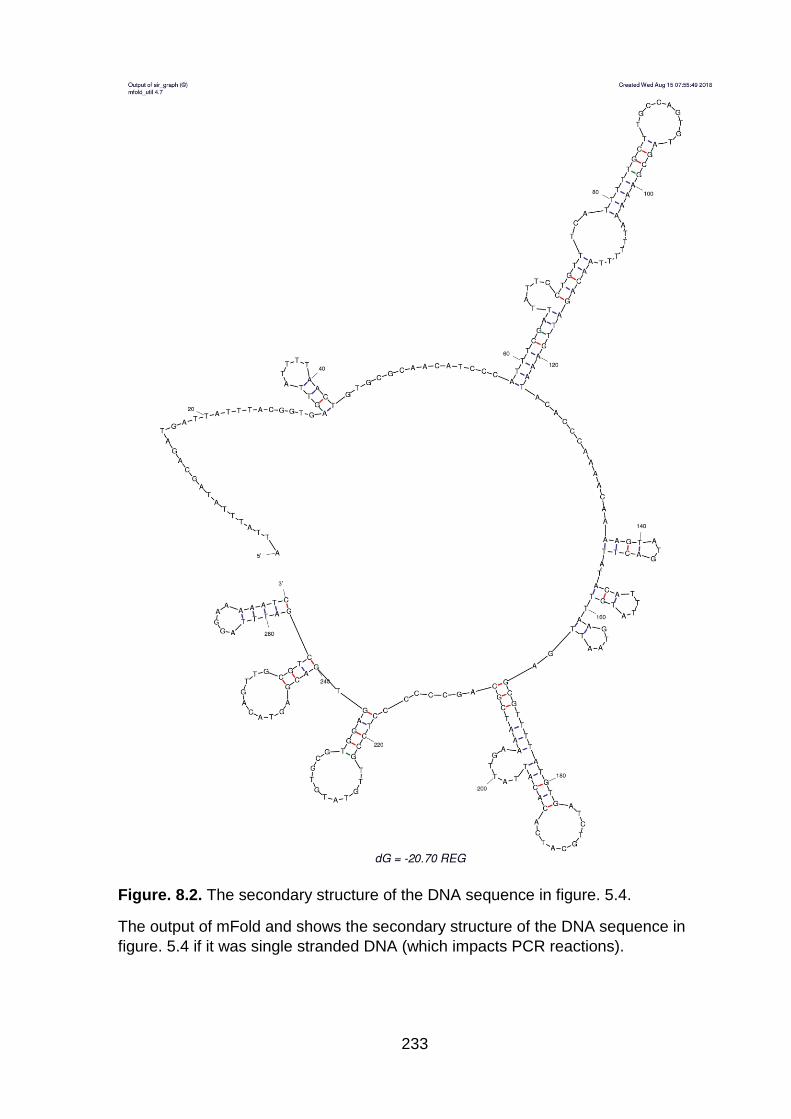
Figure. 8.2. The secondary structure of the DNA sequence in figure. 5.4. ............. 233
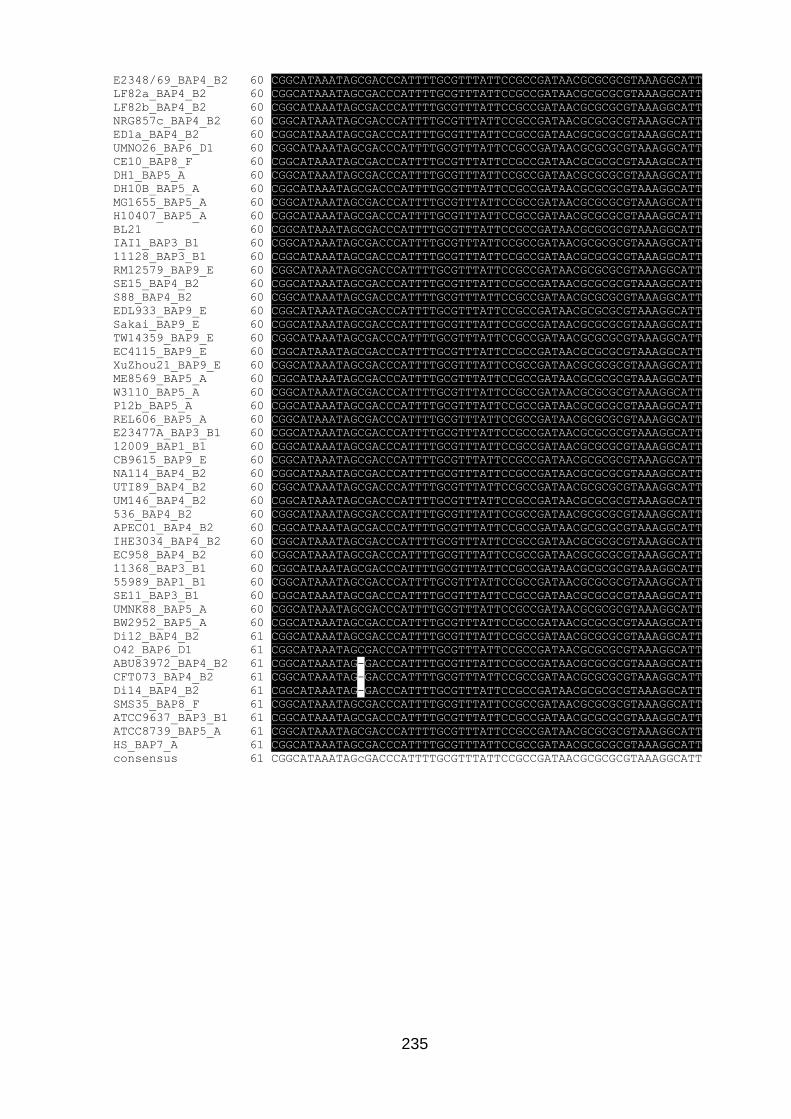
Figure. 8.3. Alignment of the flgB promoter of E. coli strains used in the work of McNally et al. (2013) ............................................................................................... 234
xi
Table of Tables
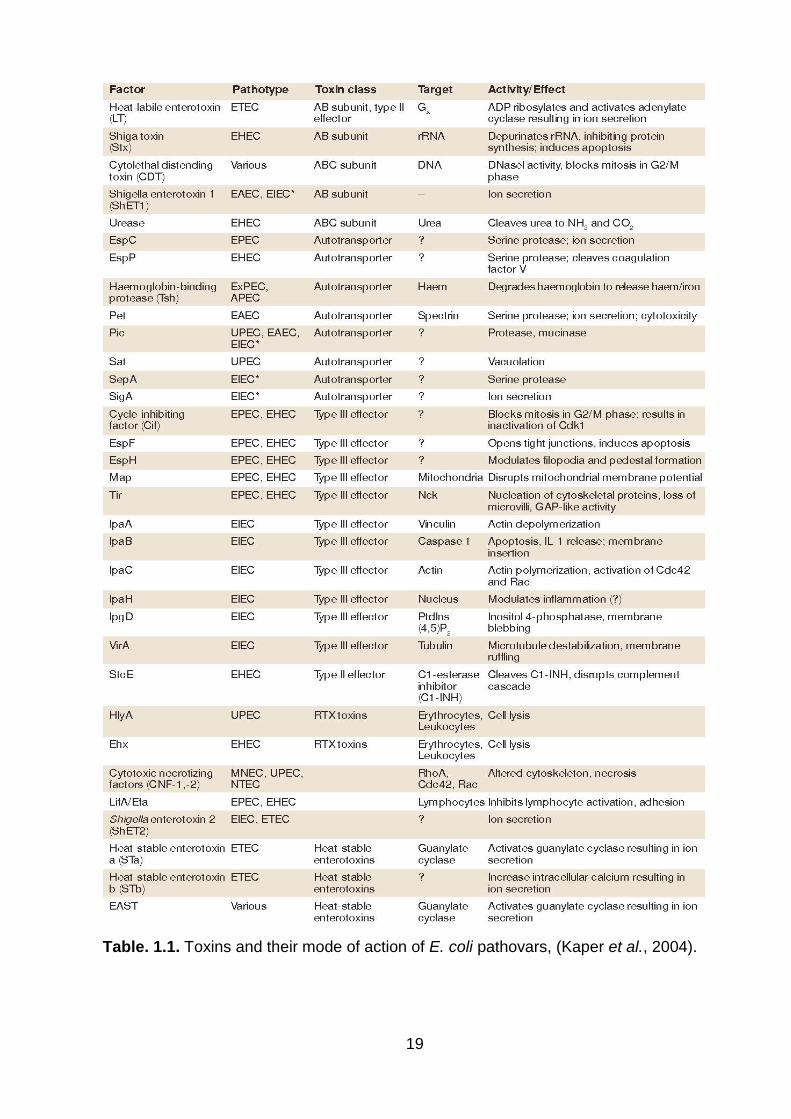
Table. 1.1. Toxins and their mode of action of E. coli pathovars, (Kaper et al., 2004) .................................................................................................................................. 19
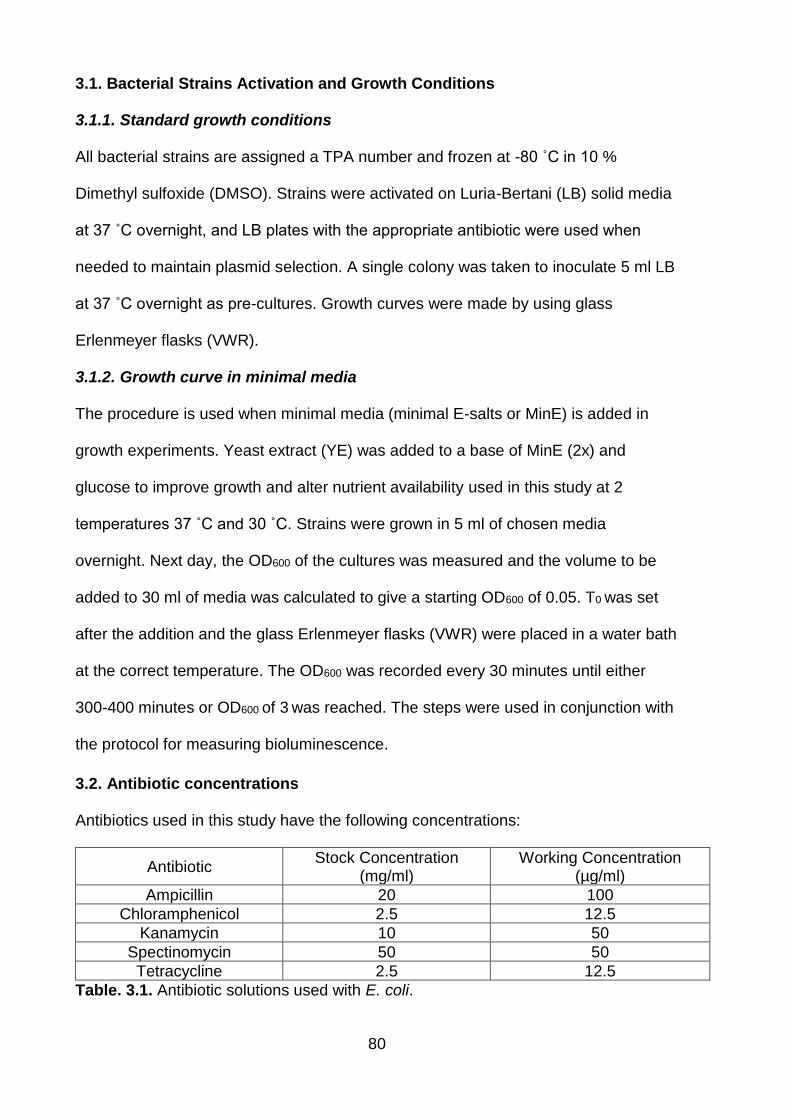
Table. 3.1. Antibiotic solutions used with E. coli ........................................................ 80
Table. 3.2. Standard PCR reaction composition ........................................................ 81
Table. 3.3. Parameters of oufti.org software.............................................................. 93
Table. 3.4. Parameters for spot detection of oufti.org ................................................ 93
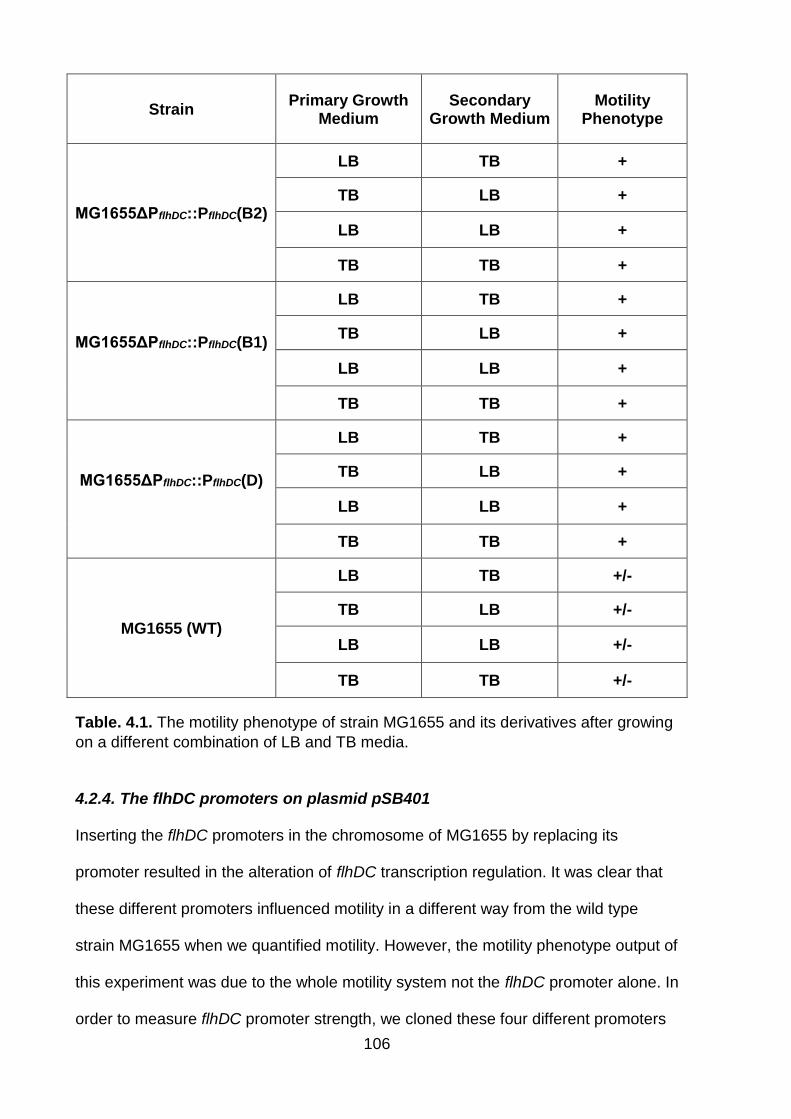
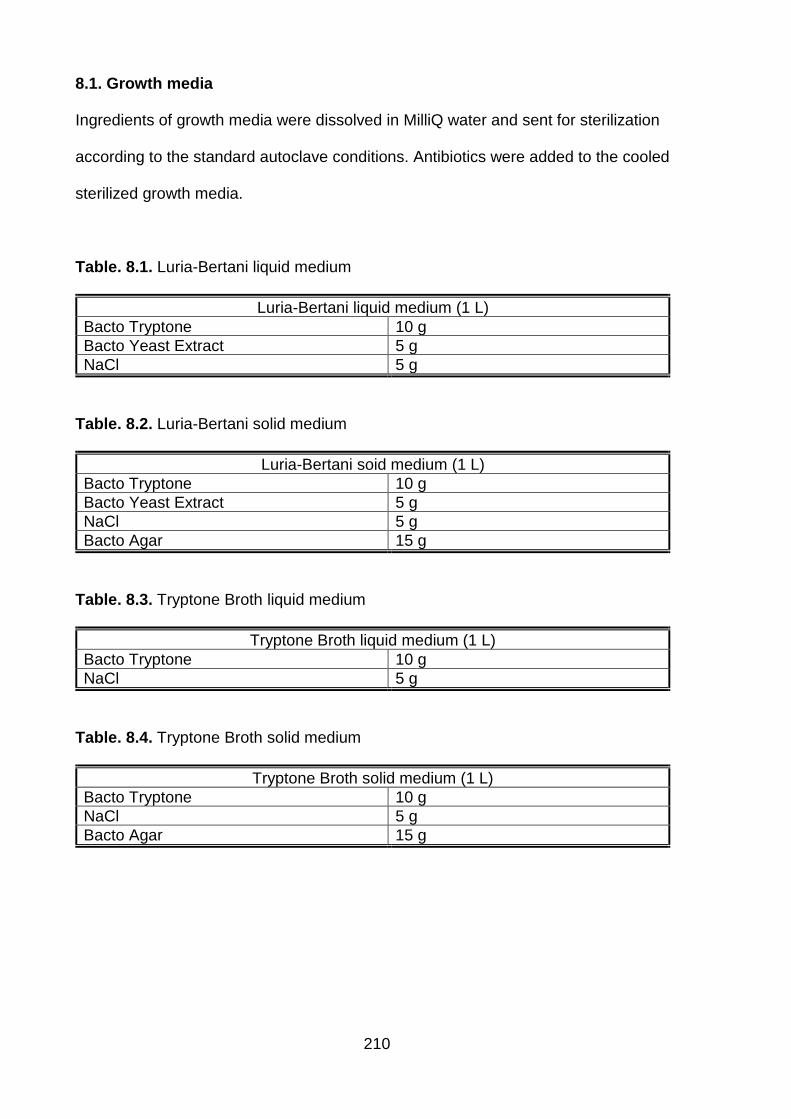
Table. 4.1. The motility phenotype of strain MG1655 and its derivatives after growing on a different combination of LB and TB media....................................................... 106
Table. 8.1. Luria-Bertani liquid medium ................................................................... 210
Table. 8.2. Luria-Bertani solid medium .................................................................... 210
Table. 8.3. Tryptone Broth liquid medium ................................................................ 210
Table. 8.4. Tryptone Broth solid medium ................................................................. 210
˚C:PflhDC (B2) 37 ˚C (P= 0.86). Similarly, a lot of the pairwise comparisons are not
significant. Interestingly, no clear thermoregulation was observed here in contrast to
previous MG1655 based experiments (Figure. 4.6 and 4.7). In figures 4.6 and 4.7, a
rich complex medium was used, whereas a minimal medium with added nutrients
was used in figure. 4.10. This suggests a link between nutrition and temperature
120
regulation (high nutrients lead to temperature regulation, while reduced nutrients lead
to the absence of temperature regulation).
However, when we took the whole picture into consideration we noticed that
the different promoters had variable activity under the two temperatures with changes
of nutrients in media. We notice in figure 4.10 that flhDC promoter (B1) in strain
CFT073 has low activity, this is not due to nutrition change because we see the same
in all tested conditions in figure 4.11. Overall, these promoters showed that they have
a very regular response to changes, and the bioluminescence activity was consistent
with the motility phenotype of the promoters and panel strains. For example, all four
promoters in strain NCTC10418 revealed the highest activity while the same
promoters in MG1655 had very low activity consistent with the weakly motile strain.
Moreover, PflhDC-B2 had the greatest values compared to other sets of this
experiment (Figure 4.11).
121
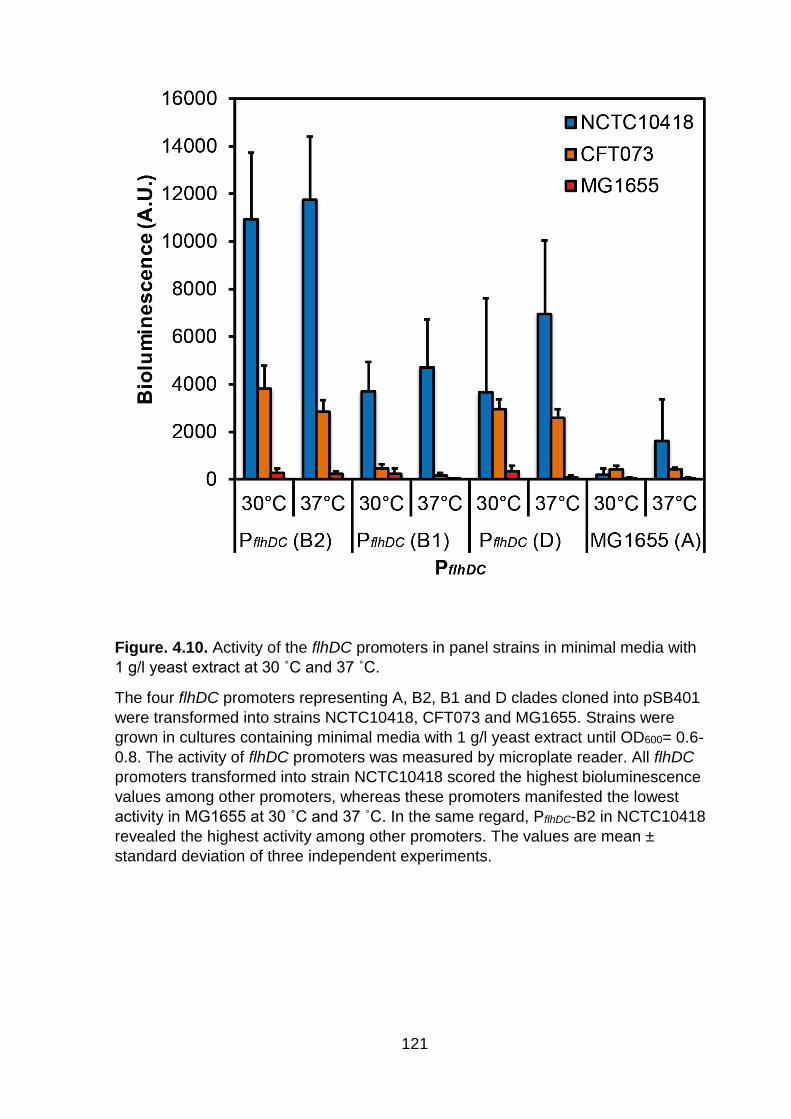
Figure. 4.10. Activity of the flhDC promoters in panel strains in minimal media with
1 g/l yeast extract at 30 ˚C and 37 ˚C.
The four flhDC promoters representing A, B2, B1 and D clades cloned into pSB401
were transformed into strains NCTC10418, CFT073 and MG1655. Strains were
grown in cultures containing minimal media with 1 g/l yeast extract until OD600= 0.6-
0.8. The activity of flhDC promoters was measured by microplate reader. All flhDC
promoters transformed into strain NCTC10418 scored the highest bioluminescence
values among other promoters, whereas these promoters manifested the lowest
activity in MG1655 at 30 ˚C and 37 ˚C. In the same regard, PflhDC-B2 in NCTC10418
revealed the highest activity among other promoters. The values are mean ±
standard deviation of three independent experiments.
122
Figure. 4.11. Activity of the flhDC promoters in panel strains in minimal media with
0.04, 0.2, 1, 3 g/l yeast extract at 30 ˚C and 37 ˚C.
The four flhDC promoters representing different clades A) B2. B) B1. C) D. D) A
cloned into pSB401 were transformed into strains NCTC10418, CFT073 and
MG1655. Strains were grown in cultures containing minimal media with 0.04, 0.2, 1
and 3 g/l yeast extract until OD600= 0.6-0.8. Promoters showed very regular
responses to changes in media. Generally, the activity of these promoters was
consistent with the strength of the promoter and motility phenotype of panel strains.
The values are mean ± standard deviation of three independent experiments. g/l:
gram per litre.
123
4.2.7. Impact of global regulation on the flhDC promoters
There are many regulators in the cells effecting gene expression, biochemical
processes and protein-protein interactions. These regulators are especially important
for the vitality of the cells in such severe conditions like stress. Others may also bind
to promoters to alter gene expression to keep the cell viable in hard and good times.
Here, we tested the effect of five known global regulators (ompR, ftsH, lon, crp and
clpP) on the motility phenotype of strain MG1655 and MG1655ΔPflhDC::PflhDC_B2, B1
and D strains (Figure. 4.12).
These experiments included the deletion of each of these regulators from the
four strains, replacing the genes with DNA fragments containing chloramphenicol
resistance cassette. This cassette was amplified from the plasmid pKD3. Deletions
exploited λ-red activity of the heat sensitive plasmid pKD46. Confirmation of the
deletion was performed by PCR reactions and testing the motility by stabbing inocula
on semi-solid agar motility medium (Figure. 4.12A). By performing these
experiments, we attempted to know the effect of these regulators on flhDC promoters
other than the one of strain MG1655.
One of the stress proteins which belong to the clp family is ClpP. It has
proteolytic activity against cytoplasmic misfolded or damaged proteins (Weichart et
al., 2003). This protease can degrade the flagellar master regulon complex FlhD4C2
with the help of YdiV (Takaya et al., 2012). Our results signified significant increase
in motility of MG1655 and MG1655::PflhDC-B2, B1 and D ΔclpP mutants compared to
their wild type strains (P= 0.01, P= 0.01, P= 0.02 and P= 0.005, respectively) (Figure.
4.12). This data was consistent with other researches in that ClpP acts as a negative
regulator to FlhD4C2 activity.
The gene ompR regulates the expression of the outer membrane porin proteins
OmpF and OmpC in association with EnvZ during changes in osmolarity (Cai and
124
Inouye, 2002). It also has been shown that phosphorylated OmpR binds to the flhDC
promoter and downregulates flagellar synthesis (Shin and Park, 1995). However,
significant decrease has been observed in strains MG1655::PflhDC_B2, B1 and D
ΔompR mutants compared to their wild type (P= 0.04, P= 0.02 and P= 0.03,
respectively), while strain MG1655 exhibited no significant increase in motility (P=
0.07) (Figure. 4.12B). This data contradicts the literature which state that deleting
ompR gene leads to increased motility.
The protease FtsH has been shown to degrade membrane proteins that have
not been assembled into complexes (Akiyama, 2009). The ftsH transcript associates
with AcnB to reduce FtsH protease activity which maintain the levels of σ32, DnaK
and subsequently FliC which is the subunit of flagellar filament (Tang et al., 2004).
Our data revealed no significant change in motility in strains MG1655::PflhDC_B1, D
and in MG1655 ΔftsH mutants compared to the wild type (P=0.49, P=0.11 and
P=0.67, respectively). These data again showed opposite information to what we
found in the literature. However, other proteases may compensate for the role of
FtsH in this process. Thus, further experiments to generate protease deficient
combinations by deleting lon and clpP in the ΔftsH mutants should be done in the
future. The decrease in motility in strain MG1655::PflhDC_B2 is significant (P= 0.02)
(Figure. 4.12B) which is not consistent with Tang et al. (2004).
Yet another protease expressed from lon gene. Lon in E. coli contributes to
different physiological processes in the cell such as cell division and capsule
biosynthesis. It also degrades RcsA and SulA which lead to capsular polysaccharide
accumulation (Ebel et al., 1999). This increased production of polysaccharide in our
lon mutants changed the colony phenotype consistency to mucoid when they grew
on an agar plate. We considered this change as a primary step in addition to using
PCR and antibiotic resistance as extra steps of confirmation. It has been also shown
125
in the literature that lon has a possible role in the degradation of FlhD and FlhC
(Claret and Hughes, 2000b). Moreover, Lon also plays a role in the degradation of
σ28 (Barembruch and Hengge, 2007). Thus, we wanted to test the effect of deleting
the lon gene on the activity of flhDC promoters in our strains. No significant change in
motility phenotype was observed in strain MG1655 (P= 0.07) which indicate no role
for lon in the process of flagellar synthesis. However, all other strains
(MG1655ΔPflhDC::PflhDC_B2, B1, D) Δlon mutants showed significant decrease in
motility compared to the wild type (P= 0.02, P= 0.01 and P= 0.01, respectively)
(Figure. 4.12B). As the deletion of lon did not enhance the swimming diameter, we
believed that a possible reason for this is that the deletion makes the cell longer and
thus hinders the motility. We also attribute the slow motility to the high rate of
polysaccharide secretions which increase the friction of the cell with the growth
medium surface impeding the motility.
126
Figure. 4.12. Impact of global regulators on motility of species E. coli.
A) Motility phenotype of MG1655 and MG1655ΔPflhDC::PflhDC-B2, B1, D. Colonies
were stabbed onto motility plates containing 0.3 % agar for 8 hours at 37 ˚C. ΔclpP
mutants revealed higher motility compared to their corresponding wild types. B)
Motility quantification of global regulators mutants. Average of swarming diameter
of each strain is measured in centimeter. ΔclpP mutants showed the highest motility
among other deletion mutants compared to the wild types. MG1655ΔPflhDC::PflhDC-
B2 crp mutant did not grow on TB agar, thus, we were unable to perform motility
assay. The values are mean ± standard deviation of three independent
experiments.
127
The CRP (cyclic-AMP receptor protein) is known to activate a number of genes for
utilization of carbon source other than glucose (Shimada et al., 2011). The literature
showed that crp mutants are nonmotile as a result of reduced fliC expression
(Soutourina et al., 1999). Reduced FliC production in crp mutants is caused by low
flhDC expression due to unavailability of CRP to bind to its promoter (Soutourina et
al., 1999). Interestingly, our strains MG1655, MG1655ΔPflhDC::PflhDC_B1 and
MG1655ΔPflhDC::PflhDC_D Δcrp mutants showed no significant change in their motility
phenotype (P= 0.06, P= 0.17 and P= 0.16, respectively) (Figure. 4.12B). We
attributed these results to the fact that we are using MG1655 strain that has no IS
elements upstream flhDC promoter which makes this strain very weakly motile as we
have shown earlier.
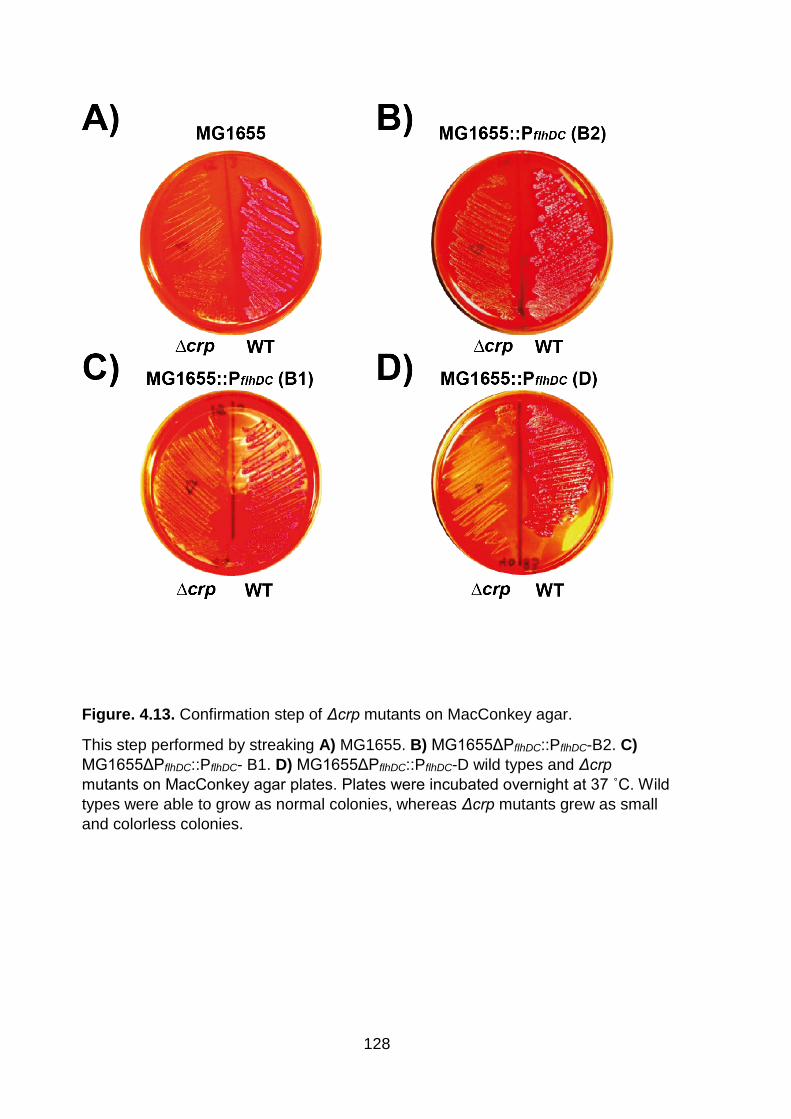
Although crp mutants grew slowly in TB medium as a poor carbon source, we
were unable to grow MG1655ΔPflhDC::PflhDC_B2 crp mutant in TB agar medium to
perform motility assay. We therefore, as an extra step of confirmation, streaked wild
type strains and crp mutants on MacConkey agar, and plates were incubated
overnight at 37 ˚C. wild type strains were able to grow normally as they utilized
lactose in media, while crp mutants produced small and colourless colonies (Figure
4.13). We concluded that Δcrp mutants have other phenotypes consistent with this
mutation. Future research could explore CRP regulation of flhDC transcription across
clades of E. coli.
128
Figure. 4.13. Confirmation step of Δcrp mutants on MacConkey agar.
This step performed by streaking A) MG1655. B) MG1655ΔPflhDC::PflhDC-B2. C)
MG1655ΔPflhDC::PflhDC- B1. D) MG1655ΔPflhDC::PflhDC-D wild types and Δcrp
mutants on MacConkey agar plates. Plates were incubated overnight at 37 ˚C. Wild
types were able to grow as normal colonies, whereas Δcrp mutants grew as small
and colorless colonies.
129
4.2.8. Replacing the flhDC promoter of MG1655 and UTI89
CRISPR-Cas9 technology was used for the first time in this project to generate
flagellar mutants and strain variants. It is considered as an efficient and reliable way
to precisely target the gene of interest and replace it with another that may carry a
reporter or mutation. The literature suggest that this multi-gene editing system is
more precise in genetic recombination than the ordinary methods with efficiency up
to 100 %. The system used in this project was based on a CRISPR-Cas system
described by Jiang et al. (2015). After investigating the variation of the flhDC
promoter in the newly created strains, we wanted to perform a control experiment to
confirm our findings. For this purpose, we choose the strain MG1655 and the strain
UTI89 which belonging to clade B2 represents another model UTI strain. This
experiment included the replacement of the flhDC promoter of strain MG1655 with
that of UTI89, and the replacement of the flhDC promoter of UTI89 with that of strain
MG1655. Furthermore, the CRISPR technique was used rather than the Blank et al.
(2011) method by electroporating the helper plasmids pCas (which has λ-red
recombinase system) and chloramphenicol target plasmid (pTrg-Cm) to the
MG1655ΔPflhDC::Cm with an amplified DNA fragment that includes the flhDC promoter
of strain UTI89. The Datsenko and Wanner method was performed on strain UTI89
to replace its flhDC promoter with the chloramphenicol resistance cassette. Then, the
CRISPR method was applied on UTI89ΔPflhDC::Cm to add the flhDC promoter from
strain MG1655 instead of the antibiotic cassette. The motility, then, was quantified by
growing the bacteria on the motility agar for 8 hours at 37 ˚C (Figure. 4.14A).
Our data showed a decrease in motility of 85.43 % in strain UTI89::PflhDC
(MG1655) compared to the wild type strain UTI89. On the other hand, the strain
MG1655::PflhDC (UTI89) showed a high increase in motility of 465 % compared to the
wild type strain MG1655 (Figure 4.14B). There is a significant variation in motility
130
between MG1655 and UTI89::PflhDC (MG1655) (P= 0.02). A significant variation in
motility is also observed between UTI89 and MG1655::PflhDC (UTI89) (P= 0.02). This
control experiment confirmed our previous flhDC promoter replacement shown at the
start of this chapter when we replaced the weak flhDC promoter of strain MG1655
with other flhDC promoters (Figure. 4.2B).
131
Figure. 4.14. Control experiment of the MG1655 and UTI89 flhDC promoter
replacement.
The experiment included the replacement of the flhDC promoter of strain MG1655
with that of strain UTI89, and the replacement of the flhDC promoter of strain
UTI89 with that of strain MG1655. A) Motility phenotypes by stabbing colonies of
each strain onto motility plates containing 0.3 % agar for 8 hours at 37 ˚C. Strain
MG1655::PflhDC (UTI89) showed increased motility compared to the wild type,
whereas strain UTI89::PflhDC (MG1655) exhibited suppressed motility compared to
its wild type. B) Motility quantification. Average of swarming diameter of each
strain measured in centimetre. The values are mean ± standard deviation of three
independent experiments.
132
4.2.9. Replacing of fliM with fliM-yPet
Amplified DNA cassette contains chloramphenicol resistance gene from plasmid
pKD3 was used to replace fliM in strain MG1655 and MG1655ΔPflhDC::PflhDC_B2, B1,
D. Then, by using the two helper plasmids pTrg-Cm and pCas, we managed to
replace this DNA cassette with another fliM gene that carry a gene capable of
expressing a yellow fluorescent protein (fliM-yPet). We chose this system over how
Jiang originally intended to exploit it as it allowed myself and the lab to use
chloramphenicol resistance mutants in flagellar genes we have already generated.
This was facilitated by using a pTrg-Cm helper plasmid that targets the
chloramphenicol cassette.
Our lab is interested in flagellar cell biology relating flagellar abundance to
flagellar expression. We now know that if flhDC activity is below a given level,
flagellar promoter activity will not relate to the flagella number per cell and swarming
diameter on motility plates (Albanna, 2017). Furthermore, questions were being
raised by the flagellar field whether FliM-XFP fusions are good indicators of
functional flagella. Therefore, we were interested in using a FliM-YPet fusions to
investigate flagellar number in strain MG1655 and MG1655ΔPflhDC::PflhDC-B2, B1, D
by counting flagellar fusion foci (Figure. 4.15). We were also aiming in the long term
to transfer CRISPR technology to use such fusions in a wider range of E. coli
isolates.
However, further experiments are to be done to investigate the ratio of what
we see inside a cell to what we can visualize on the cell surface using other cell
biology based method such as flgEA240C in these strains (Sim et al., 2017). The
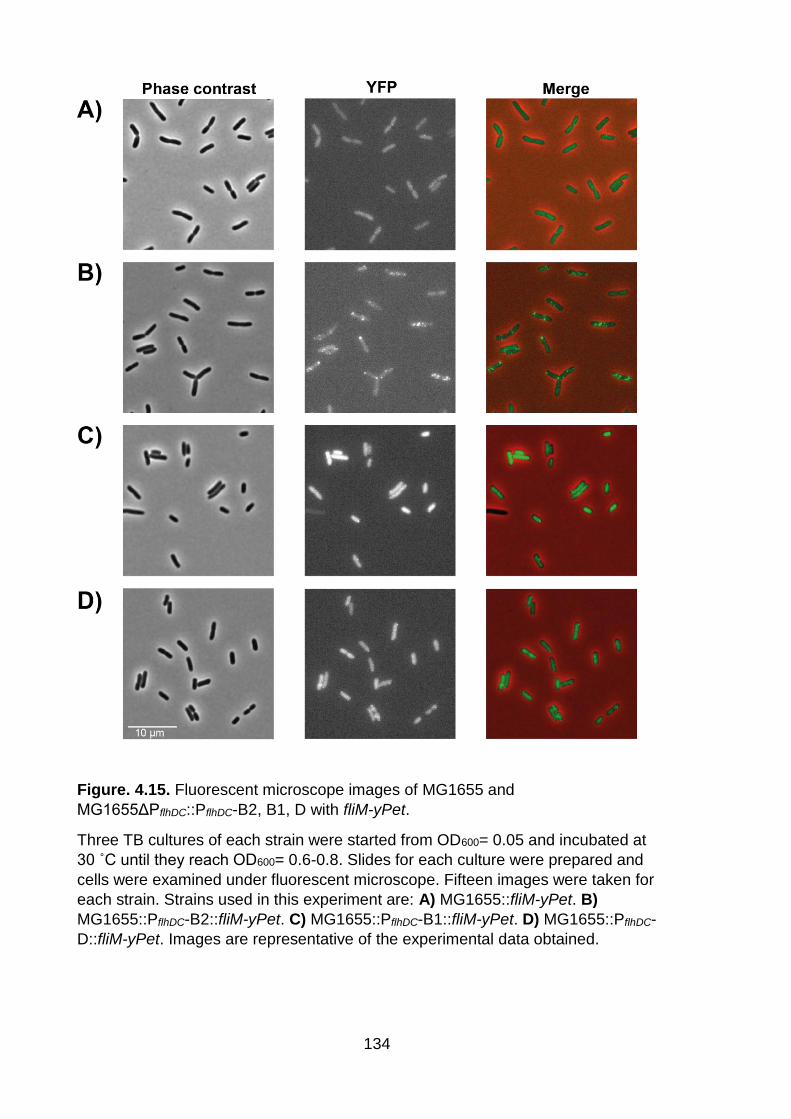
analysis of FliM-YPet foci revealed that over 75 % of the population in strains
MG1655 and MG1655ΔPflhDC::PflhDC-B1 lack the flagella, whereas over 40 % of the
population in strains MG1655ΔPflhDC::PflhDC-B2 and MG1655ΔPflhDC::PflhDC-D have an
133
average of one FliM foci (Figure. 4.16). The data allowed us to compare motility
phenotype, the flhDC promoter activity with the flagellar number. The replacement of
the flhDC promoter of strain MG1655 with the same promoter from B2, B1 and D
groups led to the activation of flagellar system in MG1655. This increased activation
was observed through the motility phenotype and the flhDC promoter activity.
However, the behaviour of the flhDC promoter of clade B1 is confusing as this strain
is highly motile though the lack of FliM foci. We attribute this phenomenon to a
possible mutation developed in the strain MG1655ΔPflhDC::PflhDC-B1.
134
Figure. 4.15. Fluorescent microscope images of MG1655 and
MG1655ΔPflhDC::PflhDC-B2, B1, D with fliM-yPet.
Three TB cultures of each strain were started from OD600= 0.05 and incubated at
30 ˚C until they reach OD600= 0.6-0.8. Slides for each culture were prepared and
cells were examined under fluorescent microscope. Fifteen images were taken for
each strain. Strains used in this experiment are: A) MG1655::fliM-yPet. B)
MG1655::PflhDC-B2::fliM-yPet. C) MG1655::PflhDC-B1::fliM-yPet. D) MG1655::PflhDC-
D::fliM-yPet. Images are representative of the experimental data obtained.
135
Figure. 4.16. Quantification of fliM-yPet foci in MG1655::fliM-yPet, MG1655::PflhDC-
B2::fliM-yPet, MG1655::PflhDC-B1::fliM-yPet and MG1655::PflhDC-D::fliM-yPet.
The fluorescent images were analysed using oufti.org software. The fliM-yPet foci
were quantified using parameters available in this software. Figure was created by
Excel to show the relevant number of foci per strain. The vast majority of cells in
strains MG1655::PflhDC-B2::fliM-yPet and MG1655::PflhDC-D::fliM-yPet possess 1-2
fliM-yPet foci. Most of the cells in strains MG1655::fliM-yPet and MG1655::PflhDC-
B1::fliM-yPet were lacking such foci. Data represents 700-1000 cells analysed from
5 of 15 images taken from three independent cultures of each strain. Figure created
in the same way used in Sim et al. (2017).
136
4.3. Summary
This chapter provides a strong foundation, and data gathered here will form the
backbone to other chapters in this project. We started this work from defining
different groups of E. coli, and we defined the phylogenetic tree of McNally who
allocated E. coli strains into six groups (A, B1, B2, D, E and F) based on the whole
genome analysis. In order for an E. coli strain to be motile, it must express the master
regulator complex FlhD4C2. Flagellar synthesis is also a hierarchical process includes
the activation of three classes of genes (Class 1, 2 and 3) with flhDC on the top.
Regarding E. coli motility, the majority of the literature focus on one lineage of
strains, clade A. Depending on the history of these strains, they are either highly or
weakly motile (Barker et al., 2004). The literature state that the extent of motility of
this lineage is sensitive to insertion sequence elements bind to their flhDC promoter
region. Therefore, we started to perform comprehensive investigation of motility in E.
coli, and we took into consideration the wider picture of the species not only a
specific strain.
As a result, we aligned the flhDC promoter region of E. coli genomes, and we
found that they can be divided into three distinct groups. The first experiment we
attempted to make is to replace the yecG-flhDC intergenic region of MG1655 with
other yecG-flhDC region belong to different clades to examine the effect on motility of
our weakly motile MG1655 strain. Data has shown significant increase in motility of
MG1655 with new promoters inserted. The yecG-flhDC intergenic regions used did
not have an IS element. However, the motility phenotype reflected not only the
activity of the flhDC promoter region but also class 2 and σ28 dependent class 3
promoter activity. We also tested these promoters for catabolite repression by
growing the strains in LB and TB media combination and found no difference occured
137
in motility phenotype regardless to the combination used which indicate no change in
flhDC expression.
In order to measure the strength of the flhDC promoter, we cloned this
promoter of MG1655 and its derivatives into a reporter plasmid and we used pSB401
which carry lux genes for this purpose. Our data showed clearly that the activity of
the promoter reflect whether panel strains descending from three different
phylogenetic groups are motile or not. These promoters also exhibited very similar
response in different growth media and in two temperatures. However, we found
discrepancy in the effect of the different temperatures used based on the panel
strains. There was higher activity of the promoters tested under 30 ˚C compared to
their activity under 37 ˚C when promoters transformed into strain MG1655 and its
derivatives (Figures 4.6 and 4.7). No clear variation in the activity has been observed
for the flhDC promoters under 30 ˚C and 37 ˚C when they transformed into
NCTC10418, CFT073 and MG1655 in minimal media with 1 g/l yeast extract (Figure.
4.10).
We also tested the effect of deleting five genes known to be regulating the
flhDC promoter, and we examined the impact on motility of MG1655 and its
derivatives. Our results did not always reflect the gene function with motility
phenotypes with respect to what we understand from the literature. However, we
attributed this to some physical changes in the cells in case of lon mutants. It may
also caused by the fact that our MG1655 strain lack the insertion element which can
insert in the flhDC promoter and enhance motility. Being this region is susceptible to
mutations is also another possible interpretation of our data. Further experiments
using another MG1655 with IS element need to be done to confirm motility
phenotype in our mutants.
138
The new CRISPR-Cas technology had been used successfully to generate YFP
tagged FliM reporter to study flagellar abundance and distribution of foci in the basal
body region. However, one limitation accompanied this experiment after prolonged
incubation of the motility plates of negative control using pTrg-Cm alone inoculated
with cells after performing final step of CRISPR method. False positive swarming
phenotype was observed sometimes due to contamination of plasmid with
chromosomal DNA in miniprep preparations as we had to sequence fliM amplified
from these cells. Nevertheless, we were able to obtain the correct transformants from
the first attempt from LB/ Spectinomycin-Kanamycin agar plates or from positive
motility plates. The number of foci seen in our experiments is low compared to what
the literature says. We argue that there is a good chance that the E. coli strains used
in the literature have the IS element in the yecG-flhDC intergenic region and, thus,
have a higher number of foci.
The data introduced in this chapter showed that replacing the yecG-flhDC
intergenic region of our strain MG1655 with other regions belong to highly motile E.
coli strains dramatically enhanced its motility. It has also shown that cloning this
region into lux plasmid expressed high bioluminescence activity by all strains across
E. coli as a species. This leads to the question: Which part of the yecG-flhDC region
is responsible for the flhDC promoter activity seen here? We will be dealing with this
question in the next chapter which will analyse this region looking for tenable
recourses for the observed phenomena.
139
Chapter Five: Analytical Study of
the Escherichia coli yecG-flhDC
Intergenic Region
140
5.1. Introduction
In the preceding chapter we have asked what impact replacing the yecG-flhDC
intergenic region with model sequence types has upon motility in the model E. coli
strain MG1655. We demonstrated that this weakly motile strain became highly motile
after swapping its flhDC promoter region with the same region descended from other
clades which represent the species. The data suggested that other factors dictate the
regulation of flhDC transcription across E. coli as a species, as it was clear the
different regions influenced motility differently from the original region in MG1655
reflected by quantified motility and the flhDC promoter activity. Thus, we wanted to
analyse the yecG-flhDC intergenic region to see the effect of its different parts of this
region on the motility phenotype.
We know from experimental results achieved in our lab on Salmonella
serovars that flagellar gene expression and swarming diameter on an agar plate do
not always reflect each other (Albanna, 2017). We also know from our early findings
that E. coli exhibits a dramatic level of variation with respect to motility. Therefore, we
wanted to also ask how do changes to the yecG-flhDC intergenic region architecture
impact other flagellar gene expression? We, therefore, cloned a class 2 flhDC
dependant promoter and a class 3 σ28 dependant promoter onto plasmid pSB401
that carries lux genes. We chose PflgB and PfliC to represent these classes. This
chapter demonstrates our analysis of the yecG-flhDC intergenic region in two distinct
E. coli strains looking for the part of the DNA that dictates motility, and also the
activity of the other flagellar promoter classes (class 2 and class 3) with respect to
motility.
141
5.2. Results and discussion
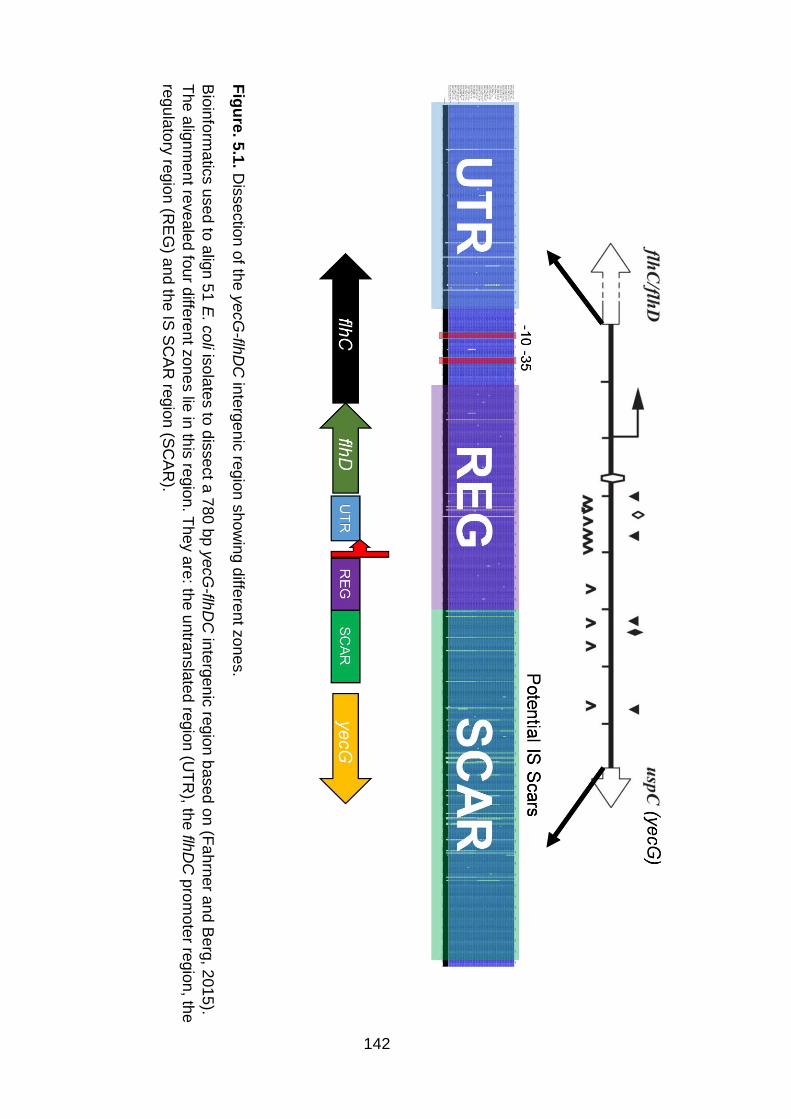
5.2.1. Dissection of the yecG-flhDC intergenic region
Having observed an alteration in motility in strain MG1655 we wanted to study this
phenomenon further to determine which part of the yecG-flhDC intergenic region
influences flhDC expression. By using bioinformatics, we looked closely at this region
with the help of the most recent paper on IS element activation of motility in MG1655
(Figure. 5.1) (Fahrner and Berg, 2015). We noticed we could split the 780 bp yecG-
flhDC intergenic region into zones including: 1) a long untranslated region
downstream of the known transcriptional start site which many regulators can bind to
(Fahrner and Berg, 2015), 2) a flhDC promoter which is conserved in E. coli as a
species, 3) a regulatory region upstream of the flhDC promoter which is defined by
Barker et al. (2004) and 4) a potential IS SCAR region which shows variation among
different strains of E. coli (Figures 4.1A and 5.1).
For this purpose, we analysed this region in two E. coli strains MG1655 and
MG1655ΔPflhDC::PflhDC-B2. Our selection of these two strains was based on the fact
that the yecG-flhDC intergenic region descended from two totally different clades of
E. coli A and B2, respectively. As we mentioned earlier, MG1655 is a well-known lab
model studied exclusively by researchers, whereas the other flhDC promoter belongs
to strain CFT073 which is considered as a model uropathogenic strain that causes
urinary tract infection in humans.
142
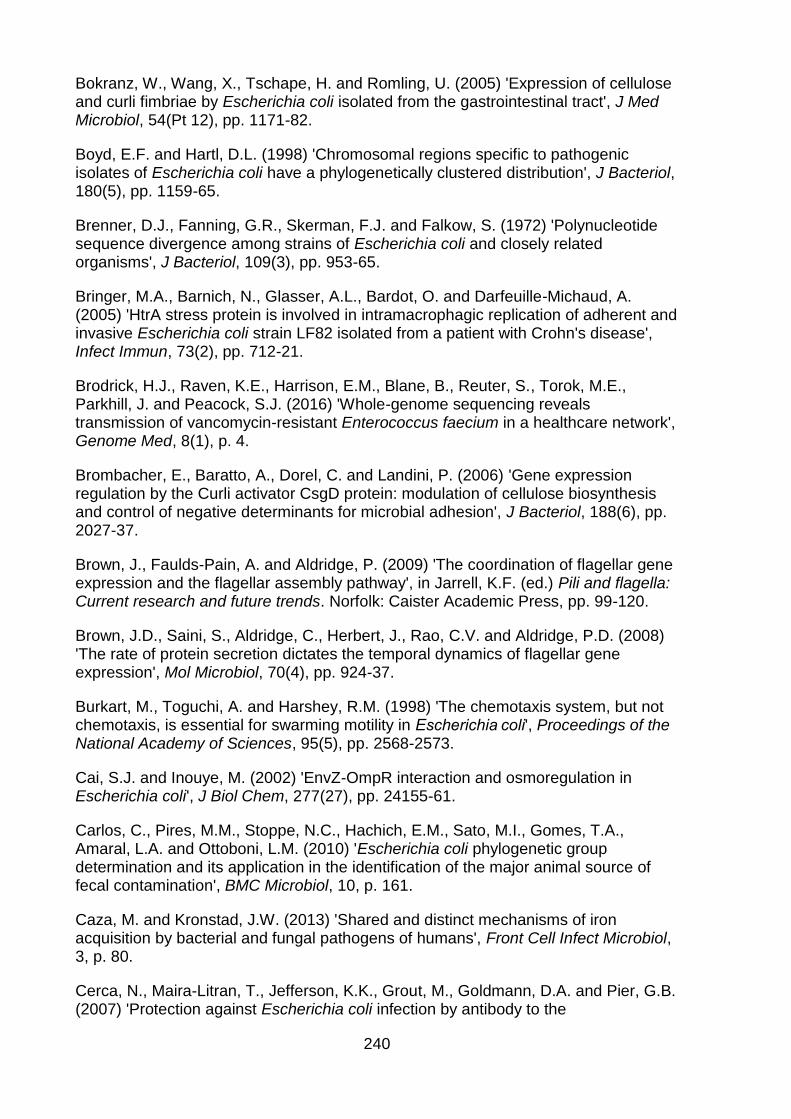
Fig
ure
. 5.1
. Dis
se
ctio
n o
f the
ye
cG
-flhD
C in
terg
en
ic re
gio
n s
ho
win
g d
iffere
nt z
on
es.
Bio
info
rma
tics u
se
d to
alig
n 5
1 E
. co
li isola
tes to
dis
se
ct a
780
bp
yecG
-flhD
C in
terg
en
ic re
gio
n b
ased
on
(Fa
hrn
er a
nd
Be
rg, 2
01
5).
The
alig
nm
en
t reve
ale
d fo
ur d
iffere
nt z
on
es lie
in th
is re
gio
n. T
he
y a
re: th
e u
ntra
nsla
ted
regio
n (U
TR
), the flh
DC
pro
mote
r regio
n, th
e
regu
lato
ry re
gio
n (R
EG
) an
d th
e IS
SC
AR
regio
n (S
CA
R).
143
5.2.2. Effect of different parts of the yecG-flhDC intergenic region on motility
In order to study this region in more detail, our aim was to generate a collection of
strains using CFT073/MG1655 flhDC promoter region as templates to create the
desired amplified DNA fragments with different sets of primers (Figure. 5.2A). Then,
we used the CRISPR system to replace the yecG-flhDC intergenic region of each of
the strains with a defined deletion. As we noticed earlier, we could convert strain
MG1655 to a highly motile strain by replacing just this intergenic region (Figure. 4.3).
Hence, we wished to perform this work to answer the following question: Which zone
of the yecG-flhDC intergenic region dictates the motility phenotype?
As this region includes multiple zones, we tried to delete one zone at a time
and also in combinations to test the impact on motility. Importantly, all constructs
were designed to leave the flhDC promoter intact (Figure. 5.2A). Thus, the following
deletion mutants were created: 1) untranslated region downstream of the flhDC
promoter (ΔUTR), 2) the SCAR fragment (ΔSCAR), 3) regulatory and SCAR
fragments (ΔRG_SCR), 4) untranslated region and SCAR region (ΔUTR_SCR) and
5) deleting the whole intergenic region (ΔU_R_S), whereas the wild type strains were
used as a control in this series of experiments (Figure. 5.2A).
After performing the confirmation steps, we tested the motility of these
mutants. The deletion mutants exhibited a range of motility phenotypes on motility
agar plates ranging from nonmotile to highly motile (Figure. 5.2B).
144
Figure. 5.2. Impact of deleting the yecG-flhDC intergenic region zones of strains
MG1655 and MG1655::PflhDC(B2) on motility.
A) Schematic drawing shows different deletion mutants performed within the yecG-
flhDC intergenic region. Deletion mutants created are: untranslated region
downstream of the flhDC promoter (ΔUTR), the SCAR fragment (ΔSCAR),
regulatory and SCAR fragments (ΔRG_SCR), untranslated region and SCAR
region (ΔUTR_SCR) and deleting the whole intergenic region (ΔU_R_S). B) Motility
phenotypes of deletion mutants. Three colonies of each strain were stabbed onto
motility plates containing 0.3 % agar, incubated for 8 hours at 37 ˚C. Different
mutants exhibited various motility phenotypes with ΔSCAR mutants was the
highest among other mutants.
145
Our data revealed that the ΔUTR, the ΔRG_SCR and the ΔU_R_S mutants turned
the two strains MG1655 and MG1655ΔPflhDC::PflhDC-B2 into completely nonmotile
strains (Figure. 5.2B). This suggests the importance of these zones in the process of
flagellar assembly and regulation. Indeed, the flhDC operon is under control of
different levels of regulation, and is influenced by transcriptional and
posttranscriptional regulators that respond to environmental cues such as nutrients,
osmotic pressure, oxygen, pH and temperature (Soutourina and Bertin, 2003).
The literature showed that many post-transcriptional regulators do positively or
negatively impact flagellar synthesis in E. coli. The 5’ untranslated region (5’ UTR) of
the flhDC mRNA acts as a binding site for small non-coding regulatory RNAs
(sRNAs). ArcZ, OmrA, OmrB and OxyS negatively regulate flagellar synthesis while
McaS positively impact the process following a variety of environmental prompts (De
Lay and Gottesman, 2012). Moreover, the flhDC mRNA leader sequence that has a
197 nucleotide in the 5’ UTR zone acts as a binding site for CsrA. Binding does
dramatically impact both flhDC mRNA stability and translation initiation and therefore
activates flhDC expression (Wei et al., 2001). Furthermore, the regulatory region has
multiple binding sites for OmpR, RcsAB, LrhA and FliZ. These proteins are other
regulators that impact the process of flhDC gene expression (Fahrner and Berg,
2015). Histone-like nucleoid (H-NS) protein and cyclic AMP-catabolite activator
protein (CAP) have multiple binding sites across the yecG-flhDC intergenic region
and they positively regulate flagellar synthesis (Fahrner and Berg, 2015). In
accordance with this information, we concluded that nonmotile strains obtained from
deleting the UTR and REG parts were a normal result from removing many important
regulatory inputs from flhDC operon expression.
146
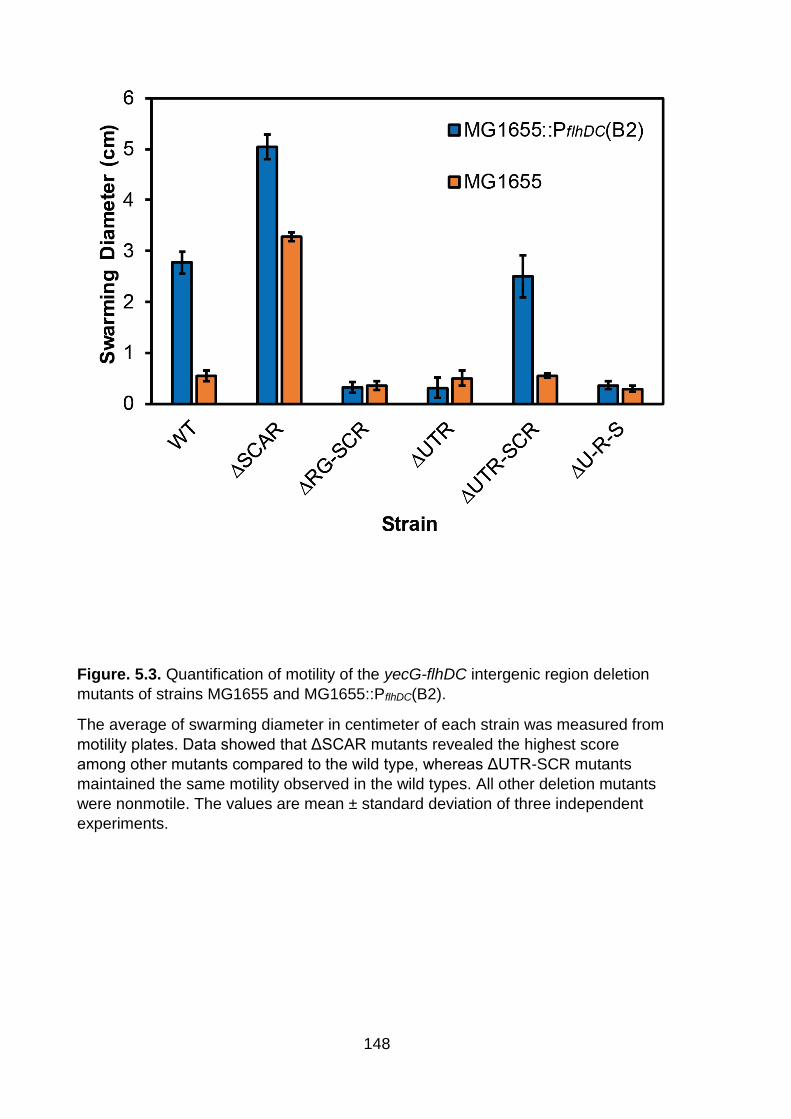
On the other hand, the data showed a weighty shift in motility in strains MG1655 and
MG1655ΔPflhDC::PflhDC-B2 following the deletion of the SCAR region (ΔSCAR). The
motility of strain MG1655ΔSCAR has been increased 6-fold compared to the wild
type (P< 0.0001). No significant variation between MG1655 WT and UTR-SCR (P=
1), but the variation of SCAR:UTR-SCR is significant (P< 0.0001). RG-SCR:UTR:U-
R-S has significant variation (P= 0.01). Both MG1655 WT:RG-SCR (P= 0.01) and
MG1655 WT:U-R-S (P= 0.0009) are significant (Cutoff is close to 0.3 cm which later
we use to define the nonmotile strains (see chapter 6) (Figure. 5.3). The data of
strain MG1655::PflhDC-B2 as a whole is significant. The motility of strain
MG1655ΔPflhDC::PflhDC-B2ΔSCAR has been increased 1.8-fold compared to its wild
type (P< 0.0001) (Figure. 5.3). No significant variation between WT and UTR-SCR
(P= 0.22), whereas there is significant variation between SCAR and UTR-SCR (P<
0.0001). No difference among RG-SCR:UTR:U-R-S (P= 0.82), but still significant
against WT (Figure. 5.3). The SCAR fragment of the yecG-flhDC intergenic region of
K-12 strains such as MG1655 has been known in the literature to be a hot spot
region which has many sites for IS elements insertions (Fahrner and Berg, 2015). A
study showed poor motility of K-12 strains of E. coli lacking IS elements. While other
K-12 strains were highly motile due to IS elements inserted in the SCAR region of
their flhDC promoters (Figure. 1.14) (Barker et al., 2004). This study suggests that IS
elements disorganise repressor binding sites leading to its inactivation and thus,
positively regulate flhDC expression. However, we used strain K-12 MG1655 that has
no IS elements, therefore, Barker’s paper does not apply to our work as we deleted
the SCAR region regardless to the prescence or absence of IS elements.
Interestingly, deleting both the UTR and SCAR from MG1655 and
MG1655ΔPflhDC::PflhDC-B2 (ΔUTR-SCR) maintained the motility of these two strains
147
as their wild type strain phenotype (Figure. 5.2B). We propose that because deleting
SCAR increased flhDC expression, this deletion overcame regulatory inputs via UTR.
Throughout this experiment, we tried to delete the regulatory region (REG)
from the yecG-flhDC intergenic region to see what effect it has over motility. We
amplified two DNA fragments and attempted to sew them together to create ΔREG
strains. However, there was a limitation preventing us from doing so as one primer
designed over a regulatory inverted repeat in the flhDC promoter region, generating
hairpins preventing PCR amplification (Figures 5.4 and 8.2). We demonstrated by
performing this set of experiments the importance of different parts of the yecG-flhDC
intergenic region on motility of two strains. Because the SCAR region showed
suppressive activity upon flagellar gene expression, we wished to study this part
further to explore how does this zone repress motility.
148
Figure. 5.3. Quantification of motility of the yecG-flhDC intergenic region deletion
mutants of strains MG1655 and MG1655::PflhDC(B2).
The average of swarming diameter in centimeter of each strain was measured from
motility plates. Data showed that ΔSCAR mutants revealed the highest score
among other mutants compared to the wild type, whereas ΔUTR-SCR mutants
maintained the same motility observed in the wild types. All other deletion mutants
were nonmotile. The values are mean ± standard deviation of three independent
experiments.
149
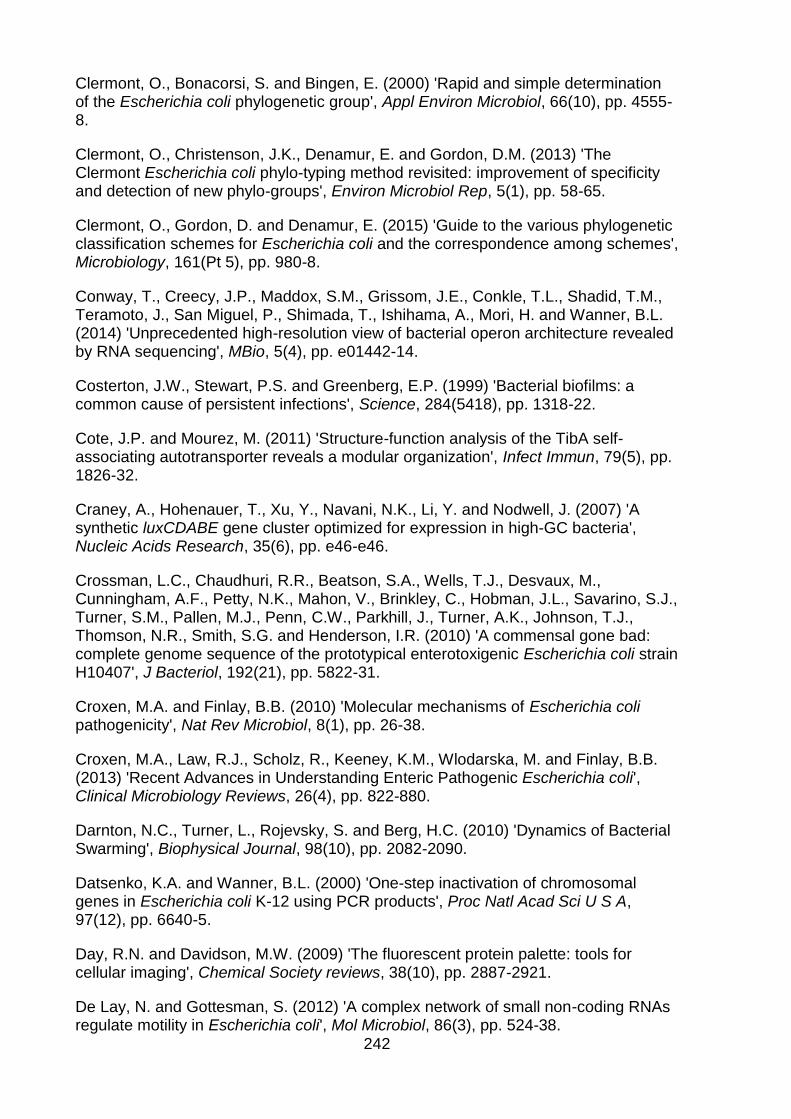
Figure. 5.4. Gel images showing the multiple bands during the creation of ΔREG
mutants and DNA alignment showing the hairpins.
Multiple bands in a 1 % agarose gel after the sewing of two DNA fragments to
create ΔREG mutants in A) MG1655::PflhDC(B2) and B) MG1655. The correct band
size of the expected PCR product is 630 bp encircled with the yellow oval shapes.
M: DNA ladder. C) An alignment showing the REG region and the flhDC promoter
defined in figure 5.1. The green shaded boxes show the CRP binding site
upstream of the flhD promoter region. The -35 and -10 promoter sequences are
shaded in blue. The red highlighted "G" is the transcription start site. At this end of
the REG region there are three sequential hairpins (pink, purple and brown) which
hindered the successful use of PCR primers. All three hairpins were confirmed
using the DNA version of mFold (http://unafold.rna.albany.edu/) with all settings
set as default.
150
5.2.3. Dissection of the yecG-flhDC SCAR region
The flhDC operon of E. coli is under multiplex adjustment by different proteins in
which the SCAR region plays an important role in upregulating or downregulating the
process of flagellar synthesis. As we have described earlier, regulators such as
OmpR, LrhA, H-NS and cAMP-CRP do bind to specific sites in the regulatory region
and therefore regulate flagellar gene expression following a variety of environmental
cues. In our analysis of the yecG-flhDC intergenic region, we have noticed increased
motility in SCAR deletion mutants, and we, therefore, proposed that the SCAR region
has a repression impact in the wild type strains. Thus, we wished to analyse the
SCAR region further to determine what and which part of this region is suppressing
motility. We divided the SCAR region into six zones (A, B, C, D, E and F) each of
which is 40 bp long, and we aimed to generate a series of deletions (Figure. 5.5A).
We designed a group of primers for this purpose and we utilized genomic DNA of
strain MG1655 and strain MG1655ΔPflhDC::PflhDC-B2 as templates to amplify the
SCAR zone fragments and to subsequently electroporate them to strain
MG1655ΔPflhDC::Cm using the CRISPR-Cas technique.
We then confirmed deletion mutants by culture PCR and by running the
fragments on the agarose gel. The gel image showed different DNA fragments as a
ladder with size increasing by 40 bp for both MG1655ΔPflhDC::PflhDC-B2 and strain
MG1655 (we were unable to produce ΔSCAR-C in the B2 version) (Figure. 5.5B and
C). We have also confirmed the right transformation by sending the DNA samples off
for sequencing.
151
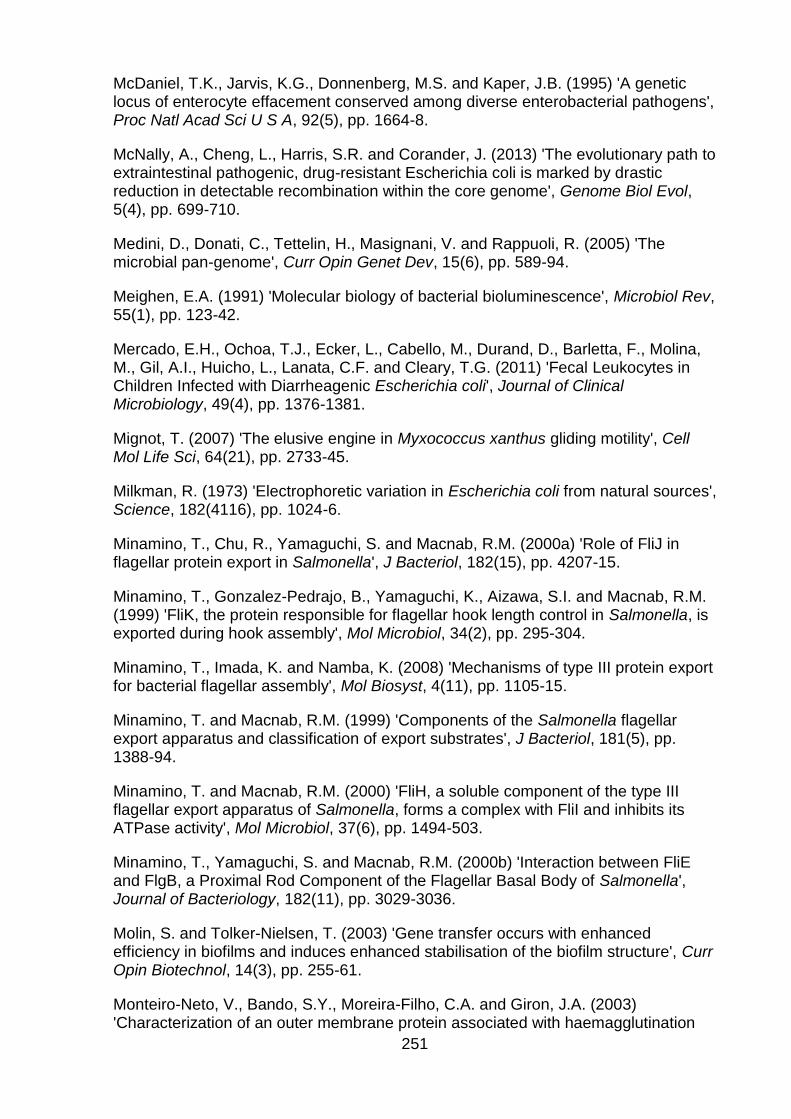
Fig
ure
. 5
.5.
Dis
se
ctio
n o
f th
e y
ecG
-flh
DC
SC
AR
regio
n in
MG
16
55 a
nd
MG
16
55
::P
flh
DC(B
2).
A)
SC
AR
zo
ne
of
str
ain
s M
G1
65
5 a
nd M
G1
65
5::
Pflh
DC(B
2)
wa
s d
isse
cte
d in
to s
ix f
ragm
en
ts (
A t
o F
). a
gro
up
of
prim
ers
wa
s
de
sig
ne
d to
cre
ate
diffe
ren
t S
CA
R d
ele
tio
n m
uta
nts
(Δ
SC
AR
-A to
ΔS
CA
R-F
) b
y a
dd
ing 4
0 b
p a
t a t
ime
. B
) A
1 %
aga
rose
ge
l
sh
ow
ing d
iffe
ren
t S
CA
R d
ele
tion
DN
A f
ragm
en
ts in s
train
MG
16
55
::P
flh
DC(B
2).
C)
A 1
% a
ga
rose
ge
l sh
ow
ing t
he
sam
e D
NA
fragm
en
ts in
str
ain
MG
16
55
. S
CA
R d
ele
tio
n m
uta
nts
(Δ
S)
we
re in
clu
ded
as c
on
tro
ls. M
: D
NA
lad
de
r.
152
We wanted then to quantify motility of ΔSCAR-A through ΔSCAR-F and therefore we
used soft agar media for this reason. Our data of strain MG1655ΔPflhDC::PflhDC-B2
showed an increase in swarming diameter of 2-fold, 2-fold, 2-fold, 2-fold and 1.5-fold
for ΔSCAR-A, ΔSCAR-B, ΔSCAR-D, ΔSCAR-E and ΔSCAR-F, respectively
compared to the wild type strain (Figure. 5.6). The data set in figure. 5.6 is significant
(P< 0.0001). The difference is not significant for ΔSCAR-A:B:D:E (P= 0.149) and is
not significant for ΔSCAR:ΔSCAR-F (P= 0.286). In the same way, strain MG1655
exhibited an increase in its SCAR region fragments mutants’ motility. The motility
increased 3.4-fold, 5-fold, 2.3-fold, 8-fold, 6.6-fold and 1.7-fold for ΔSCAR-A,
ΔSCAR-B, ΔSCAR-C, ΔSCAR-D, ΔSCAR-E and ΔSCAR-F, respectively in
comparison to the wild type strain (Figure. 5.7). All of the data in figure. 5.7 is
significant (P< 0.0001), whereas in pairs (P< 0.001).
These experiments showed consistent response to deletion for both strain
MG1655 which belong to clade A, and strain MG1655ΔPflhDC::PflhDC-B2 which its
promoter belong to clade B2. Since deleting the SCAR fragments from A through E
displayed the highest shift in motility compared to fragment F, we proposed that
something included in this fragment is repressing the motility in both strains. This was
clear as the motility decreased when we added fragment F to the SCAR region.
Based on the proximity of fragment F to the yecG promoter, we propose this zone to
impact the yecG promoter. Therefore, we conclude that yecG is responsible for this
motility phenotype.
153
Figure. 5.6. Motility quantification of SCAR fragments deletion mutants of strain MG1655::PflhDC (B2).
A) Motility phenotypes. Colonies of each strain were stabbed onto motility plates containing 0.3 % agar, incubated for 8 hours at 37 ˚C. B) The average of swarming diameter in centimeter. ΔSCAR-F scored the lowest value compared to other deletion fragments. ΔSCAR included as a control. The values are mean ± standard deviation of three independent experiments.
154
Figure. 5.7. Motility quantification of SCAR fragments deletion mutants of strain MG1655.
A) Motility phenotypes. Colonies of each strain were stabbed onto motility plates containing 0.3 % agar, incubated for 8 hours at 37 ˚C. B) The average of swarming diameter in centimeter. ΔSCAR-F scored the lowest value compared to other deletion fragments. ΔSCAR included as a control. The values are mean ± standard deviation of three independent experiments.
155
5.2.4. Measuring the activity of flgB and fliC promoters
We mentioned earlier that E. coli has three flagellar genes classes: early, middle and
late according to the sequence of their expression. These genes are expressed as a
result of the activity of their class 1, class 2 and class 3 promoters, respectively
(Chilcott and Hughes, 2000). We also stated that the master regulator FlhDC is
expressed following internal and external cues. This protein acts in conjunction with
σ70 to induce the class 2 promoter which expresses genes needed for hook and
basal body assembly, in addition to FlgM and FliA (σ28). Upon completion of hook-
basal body, σ28 becomes free and activates class 3 promoters which can lead to the
activation of late flagellar genes, and the filament will be synthesized.
Here, we wished to examine the other two classes of flagellar promoters by
measuring their activity in our deletion mutants with regard to motility. We have
chosen the flgB promoter and the fliC promoter as representatives for class 2 and
class 3 promoters, respectively. To monitor these promoter activities, we used the
same previously described pSB401 which carry luciferase operon luxCDABE as
gene expression reporters. As these promoters are conserved in E. coli as a species,
we amplified them from strain MG1655, and we mounted them onto their vector using
Gibson cloning. We then chemically transformed pSB::PflgB and pSB::PfliC plasmids
into WT, ΔSCAR, ΔRG-SCR, ΔUTR, ΔUTR-SCR and ΔU-R-S of strains MG1655 and
MG1655ΔPflhDC::PflhDC-B2. We also transformed these two plasmids into the other set
of our SCAR region deletion mutants (ΔSCAR-A through F) for strain MG1655 and its
B2 version. The strain MG1655ΔPflhDC::Cm was our negative control to subtract the
background bioluminescence from the data collected.
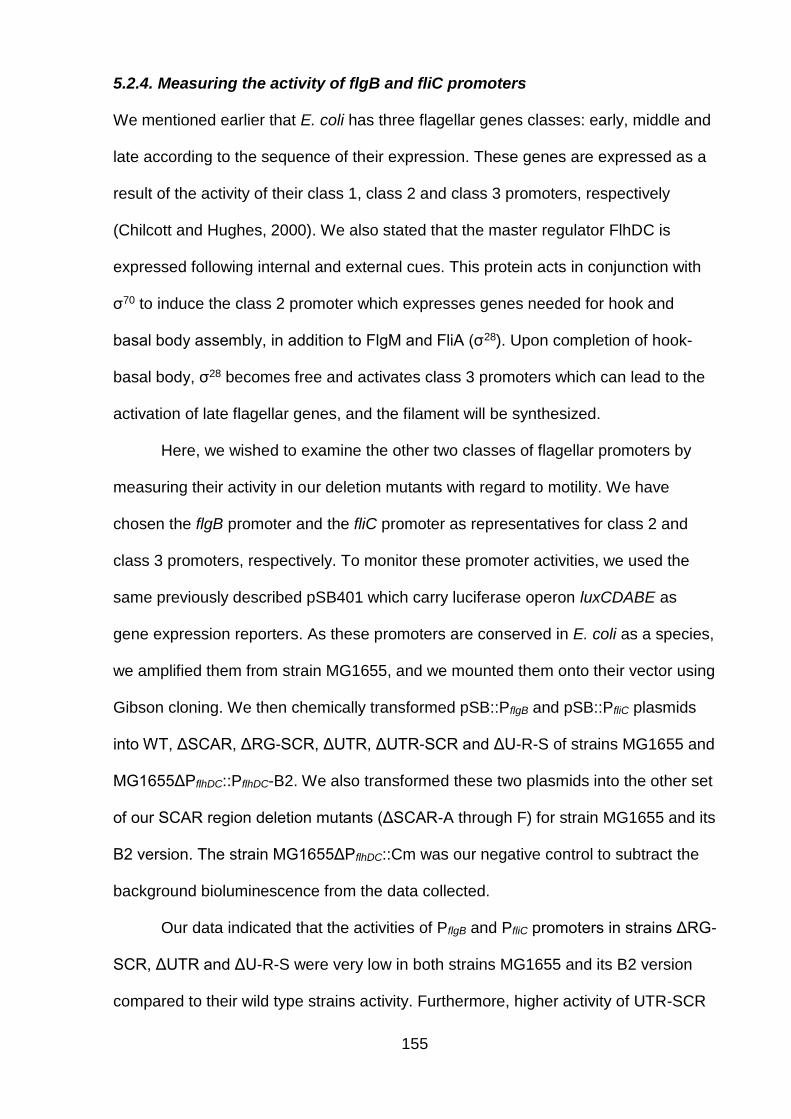
Our data indicated that the activities of PflgB and PfliC promoters in strains ΔRG-
SCR, ΔUTR and ΔU-R-S were very low in both strains MG1655 and its B2 version
compared to their wild type strains activity. Furthermore, higher activity of UTR-SCR
156
mutants was recorded for both strains with values exceeded, to some extent, the
activity of promoters in their wild type strains (Figure. 5.8). Interestingly, SCAR region
mutants documented the highest values for PflgB and for PfliC for strains
MG1655ΔPflhDC::PflhDC-B2 and MG1655 (Figure. 5.8). The data for A and B is
significant (P< 0.0001) and this is not surprising as this matches the motility data for
these mutants. The impact of the UTR mutants is also seen significant (P< 0.0001),
except in B2 for PflgB is not significant (P= 0.08). In addition to that, SCAR fragment
mutants (A to F) scored high bioluminescence values for both strains compared to
their wild types. However, SCAR-F mutants showed the lowest activity among other
mutants in the two strains compared to the wild types (Figure. 5.9). All data in figure.
5.9 is significant. In strain MG1655, D:F is significant (P= 0.00047), E:F is not
significant (P= 0.176), WT:F is significant (P= 0.05), SCAR:F is not significant (P=
0.236) and WT:SCAR is significant (P= 0.0007) (Figure. 5.9A).
We have managed, by measuring bioluminescence, to quantitatively diagnose
flgB and fliC promoter activities using these reporter plasmids and lux genes. As we
recall from earlier data (Figure. 5.3), UTR, RG-SCR and U-R-S mutants of strain
MG1655 and its B2 version were nonmotile. While UTR-SCR mutants exhibited
similar motility phenotype as their wild types, SCAR region mutants were displayed
the highest motility. Moreover, the figures 5.6 and 5.7 showed dramatic shift in
motility with lowest activity of SCAR-F. Here, the data successfully proved consistent
behaviour between the activity of promoters in the deletion mutants and motility
phenotype of the strains.
157
Figure. 5.8. Activity of PflgB and PfliC in yecG-flhDC zones deletion mutants.
A) PflgB and B) PfliC cloned to pSB401, and plasmids transformed into
MG1655::PflhDC(B2) and MG1655 that have different deletion mutants in yecG-
flhDC intergenic region. Cultures were made and started from OD600=0.05 until
they reached OD600=0.6-0.8, and measured in microplate reader. Promoter activity
reflected motility phenotypes. The values are mean ± standard deviation of three
independent experiments.
158
Figure. 5.9. Activity of PflgB and PfliC in SCAR fragments deletion mutants.
A) PflgB and B) PfliC cloned to pSB401, and plasmids transformed into
MG1655::PflhDC(B2) and MG1655 that have different deletion mutants in SCAR
zone. Cultures were made for each strain and started from OD600=0.05 until they
reached OD600=0.6-0.8, and measured in the microplate reader. Promoters activity
reflected motility phenotypes. The values are mean ± standard deviation of three
independent experiments.
159
5.2.5. Does yecG repress flagellar gene expression?
The Usp universal stress protein superfamily is an ancient and sustained class of
proteins that are found in bacteria, archaea, fungi, flies and plants (Kvint et al., 2003).
E. coli has six Usp proteins which can be split into two subfamilies based on
sequence similarities of the Usp domain. UspA, UspC (yecG) and UspD (yiiT) belong
to one subfamily while UspF (ynaF) and UspG (ybdQ) belong to the other subfamily
(Gustavsson et al., 2002). Moreover, Gustavsson et al. (2002) allocated the sixth
protein UspE (ydaA) in between these two subfamilies due to shared characteristics,
and they suggested that these proteins have a role in the DNA damage control. The
protein YecG (UspC) plays an important role in stress conditions of E. coli
(Gustavsson et al., 2002). Under salt stress especially potassium ion (K+) deficiency,
YecG acts as a stabilizing scaffold for the sensor kinase KdpD and the response
regulator KdpE by binding to a Usp domain in KdpD. As a result, the kdpFABC
operon will be expressed and the KdpFABC K+ transport system will uptake K+ for
the cell from other transporters (Heermann et al., 2009). Notwithstanding, Heermann
et al. (2009) mentioned that the exact function of these proteins is unknown. A
previous work has dealt with the deletion of uspC in strain MG1655, and proved that
mutants were nonmotile. The electron microscope showed images for uspC deletion
mutants lacking flagella (Nachin et al., 2005).
Although all SCAR deletion mutants displayed higher motility phenotype
compared to the wild type, fragment F presented the lowest value among the others.
Therefore, our observation suggested negative regulatory effect on motility after
adding fragment F to the SCAR region. For the reason that this fragment is very
close to the yecG promoter (Conway et al., 2014), we turned our attention to the
opposite end of the yecG-flhDC intergenic region which is yecG. We, therefore,
replaced yecG with a DNA cassette which has a chloramphenicol resistance gene,
160
amplified from plasmid pWRG100 using Datsenko and Wanner method. We then
electroporated the cassette into the strains with the help of pKD46 that has λ-red
activity by adding arabinose to the culture media. Motility assays were then
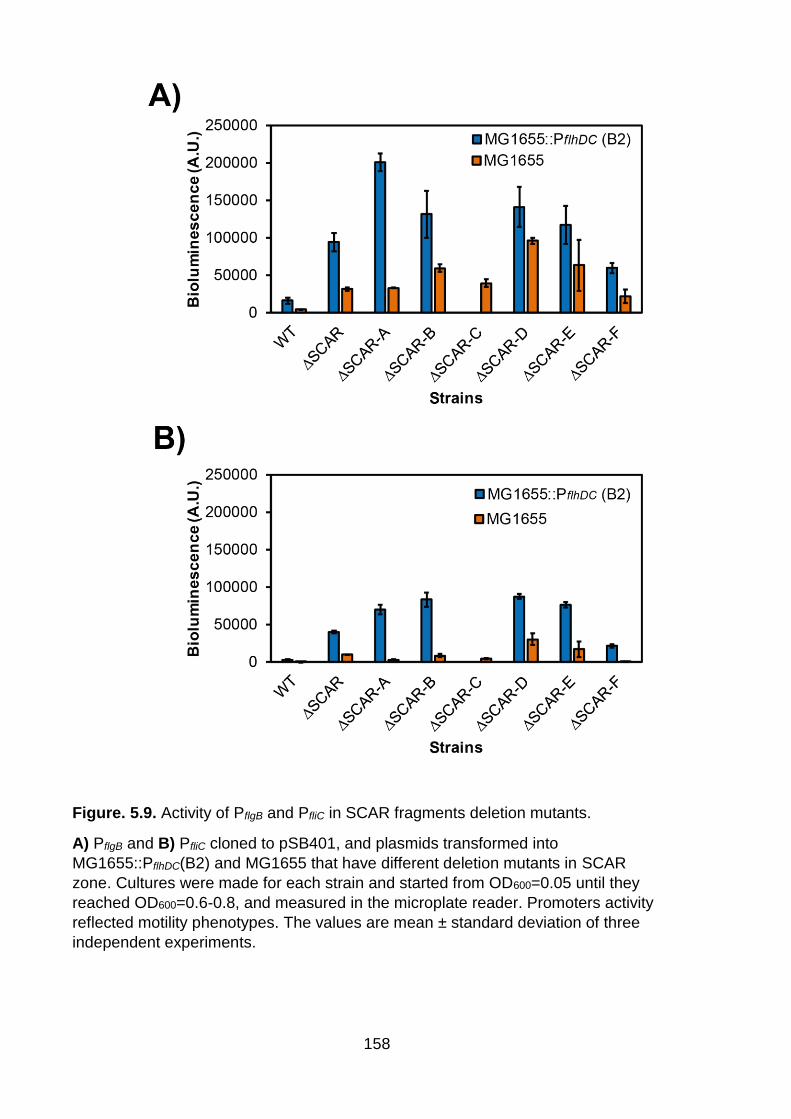
performed using soft agar media. Our data showed that ΔyecG mutants displayed
enhanced swimming capacity (Figure. 5.10). The increase in motility was 1.4-fold in
strain MG1655ΔPflhDC::PflhDC-B2 compared to the wild type. Motility in strain MG1655
ΔyecG mutant increased 4.3-fold compared to the wild type (Figure. 5.10B). Thus,
the impact of the yecG deletion is more visible in strain MG1655 (P= 0.0026),
whereas the difference is not significant for B2 version (P= 0.136). The data for all is
significant (P= 0.00026).
We, therefore, demonstrate that yecG is a negative regulator of flagellar
assembly in our MG1655 strain and also in a strain which has the yecG-flhDC
intergenic region belonging to clade B2. This data therefore does not seem to
correlate with the previous work of Nachin et al. (2005) that yecG mutants were
completely nonmotile due to lack of flagella. However, it is not known whether YecG
directly supresses flhDC expression or it has indirect effect on flagellar assembly.
Additionally, it is not recognised what causes this enhancement in motility whether it
was due to increase in flagellar activity or increased number of functional flagella per
cell.
161
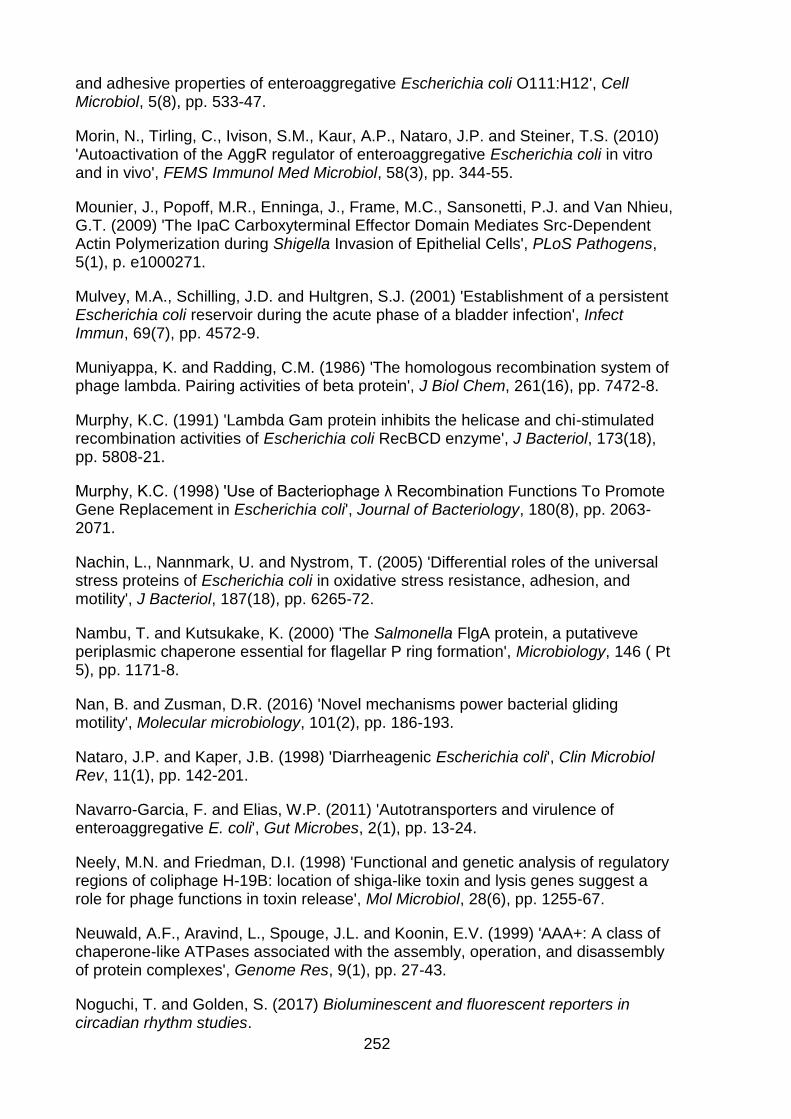
Figure. 5.10. Motility quantification of yecG deletion mutants in strains MG1655::PflhDC(B2) and MG1655.
A) Motility phenotypes. Colonies of each strain were stabbed onto motility plates
containing 0.3 % agar, incubated for 8 hours at 37 ˚C. B) The average of swarming
diameter in centimeter. Data show increased motility in ΔyecG mutants compared
to the wild type strains. The values are mean ± standard deviation of three
independent experiments.
162
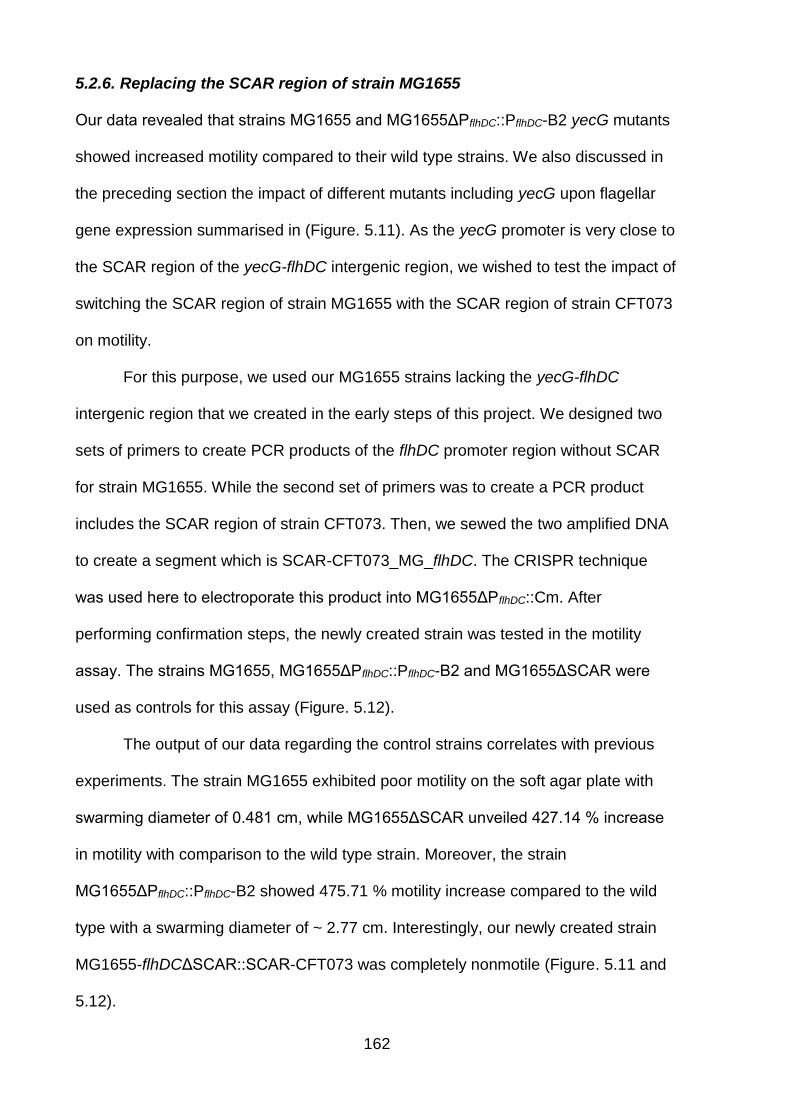
5.2.6. Replacing the SCAR region of strain MG1655
Our data revealed that strains MG1655 and MG1655ΔPflhDC::PflhDC-B2 yecG mutants
showed increased motility compared to their wild type strains. We also discussed in
the preceding section the impact of different mutants including yecG upon flagellar
gene expression summarised in (Figure. 5.11). As the yecG promoter is very close to
the SCAR region of the yecG-flhDC intergenic region, we wished to test the impact of
switching the SCAR region of strain MG1655 with the SCAR region of strain CFT073
on motility.
For this purpose, we used our MG1655 strains lacking the yecG-flhDC
intergenic region that we created in the early steps of this project. We designed two
sets of primers to create PCR products of the flhDC promoter region without SCAR
for strain MG1655. While the second set of primers was to create a PCR product
includes the SCAR region of strain CFT073. Then, we sewed the two amplified DNA
to create a segment which is SCAR-CFT073_MG_flhDC. The CRISPR technique
was used here to electroporate this product into MG1655ΔPflhDC::Cm. After
performing confirmation steps, the newly created strain was tested in the motility
assay. The strains MG1655, MG1655ΔPflhDC::PflhDC-B2 and MG1655ΔSCAR were
used as controls for this assay (Figure. 5.12).
The output of our data regarding the control strains correlates with previous
experiments. The strain MG1655 exhibited poor motility on the soft agar plate with
swarming diameter of 0.481 cm, while MG1655ΔSCAR unveiled 427.14 % increase
in motility with comparison to the wild type strain. Moreover, the strain
MG1655ΔPflhDC::PflhDC-B2 showed 475.71 % motility increase compared to the wild
type with a swarming diameter of ~ 2.77 cm. Interestingly, our newly created strain
MG1655-flhDCΔSCAR::SCAR-CFT073 was completely nonmotile (Figure. 5.11 and
5.12).
163
We assumed that adding the SCAR region of CFT073 to strain MG1655ΔSCAR will
turn the newly created strain to have the same motility phenotype as strain CFT073
or strain MG1655ΔPflhDC::PflhDC-B2. Surprisingly, the new strain had swarming
diameter of 0.28 which is the diameter of the woody tooth pick used to stab the
bacteria in the motility agar plate. This outcome led us to suppose that the
suppression of flagellar gene expression in the SCAR region of strain CFT073 is
higher than the SCAR region in strain MG1655. We believe that the DNA sequence
dissimilarities occur in the SCAR region of strains MG1655 and CFT073 could affect
the binding of regulators to this region. Could these changes reflect this negative
regulation? We also know that the SCAR region is very close to the yecG promoter
which has a negative impact on flagellar gene regulation. Does the yecG promoter of
strain CFT073 have more strength than that of strain MG1655? If the answer was
yes, then this will explain why our new strain turned out to be completely nonmotile.
To take this analysis further, we had to measure the yecG promoter activity of strains
MG1655 and CFT073.
164
Figure. 5.11. Schematic representation review of motility phenotypes of
miscellaneous strains.
The drawing shows the weak motility of our strain MG1655 wild type (Mot+/-), and
the high motility after replacing its flhDC promoter with that of strain CFT073 which
belongs to clade B2 (Mot++). High motility was also observed when we deleted the
SCAR zone in strains MG1655 and MG1655::PflhDC (B2) (Mot++). Then, we
identified the part in the SCAR zone which exhibits the lowest motility among other
parts (fragment F which is very close to the yecG promoter) (Mot+). As a result, we
concluded that yecG may negatively impact the flhDC promoter. Thus, we
quantified motility of ΔyecG mutants and confirmed the repression effect of yecG
upon motility (Mot++). In the same regard, we replaced the SCAR zone of MG1655
with the SCAR zone of MG1655::PflhDC (B2) and found that this strain turned out to
be nonmotile (Mot-).
165
Figure. 5.12. Impact of replacing the SCAR region in strain MG1655 with the SCAR region of strain MG1655::PflhDC (B2) on motility.
A) Motility phenotypes. Colonies of each strain were stabbed onto motility plates
containing 0.3 % agar, incubated for 8 hours at 37 ˚C. B) Average of swarming
diameter in centimeter. Data reveal that strain MG1655ΔSCAR::SCAR(B2) turned
out to be completely nonmotile. Strains MG1655, MG1655::PflhDC (B2) and
MG1655ΔSCAR were included in this experiment as controls. The values are
mean ± standard deviation of three independent experiments.
166
5.2.7. Strains MG1655 and CFT073 PyecG activity
The previous section (Figure. 5.12) showed that replacing the SCAR region of strain
MG1655 with the SCAR region of strain CFT073 inhibited the motility of the former
strain. We stated that yecG could be the reason behind this scenario as its promoter
lies near the SCAR region and acts as a possible suppressor for motility. Therefore,
we wanted to measure the activity of the yecG promoter in both MG1655 and
CFT073. We used the plasmid pSB401 that carry lux genes for this purpose.
By using Gibson cloning, we inserted the yecG promoter of each of MG1655
and CFT073 into pSB401. The cloning details were the same as what we did with the
cloning of the yecG-flhDC intergenic region (Figure 4.4), but in the opposite direction.
The two plasmids pSB401::PyecG-MG1655 and pSB401::PyecG-CFT073 were then
introduced to MG1655 (WT, ΔSCAR and ΔSCAR-F) and also to
MG1655ΔPflhDC::PflhDC-B2 (WT, ΔSCAR and ΔSCAR-F). While the strains
MG1655ΔPflhDC and MG1655::pSBΔER were used as controls. The promoter activity
was measured by the bioluminescence expressed as light units (Figure. 5.13).
The yecG promoter activity of strain MG1655 ranged between 1773 to 3724
light units (Figure. 5.13). However, the activity in strain MG1655 derivatives was
lower than that in MG1655ΔPflhDC::PflhDC-B2 versions. On the other hand, the activity
of the yecG promoter of strain CFT073 was higher in the same panel strains
regardless to the strain genotype with bioluminescence ranging from 4338 to 6411
light units. The activity of the two promoterless strains containing pSBΔER was
extremely low as expected. MG1655WT:MG1655ΔSCAR:MG1655ΔSCR.F is
significant (P= 0.045), MG-B2:MG-B2ΔSCAR:MG-B2ΔSCR.F is not significant (P=
0.116) and MG1655WT:MG-B2WT:MGΔPflhDC is significant (P= 0.00001) which
suggests some level of PflhDC feedback (Figure. 5.13A).
5451 pSB401::PyecG(MG1655)/ DH5a/ ∆yecG-flhDC(3439)::FCF in TPA3459 [PCR1165/1178]
This study
5452 pSB401::PyecG(CFT073)/ DH5a/ ∆yecG-flhDC(3439)::FCF in TPA3459 [PCR1165/1178]
This study
5456 MG1655ΔPflhDC::PflhDC(UTI89) This study
5457 MG1655ΔPflhDC::PflhDC(UTI89) This study
Table. 8.21. Background of bovine isolates used in the characterization
TPA Site Date Kingston no.
5201 DWV1 15/12/2015 17D2
5202 DWV1 15/12/2015 12D
5203 DWV1 15/12/2015 13E
5204 DWV1 15/12/2015 4A1
5205 DWV1 15/12/2015 1DE
5405 DWV1 15/12/2015 4A2
5206 DWV1 15/12/2015 1B
5207 DWV1 15/12/2015 9E
5208 DWV1 15/12/2015 5D
5209 DWV1 15/12/2015 12B
5210 DWV1 15/12/2015 12F
5211 DWV1 15/12/2015 6B1
5212 DWV1 15/12/2015 1C
5213 DWV1 15/12/2015 12C
5214 DWV1 15/12/2015 10B
5215 DWV1 15/12/2015 10D
5216 DWV1 15/12/2015 14E
5217 DWV1 15/12/2015 3B
5218 DWV1 15/12/2015 10A
5407 DWV1 15/12/2015 3E2
5219 DWV1 15/12/2015 1DE
5220 DWV1 15/12/2015 2B
5221 DWV1 15/12/2015 2A
5409 DWV1 15/12/2015 16F
5222 DWV1 15/12/2015 3D
5223 DWV1 15/12/2015 79/7G
5224 DWV1 15/12/2015 17212
5225 DWV1 15/12/2015 7F
5411 DWV1 15/12/2015 11B1
5226 DWV1 15/12/2015 6B2
5227 DWV1 15/12/2015 10C
224
5228 DWV1 15/12/2015 1E
5229 DWV1 15/12/2015 13A
5230 DWV1 15/12/2015 6A
5231 DWV1 15/12/2015 5E
5232 DWV1 15/12/2015 7A
5234 DWV1 15/12/2015 6D2
5235 DWV1 15/12/2015 3A
5236 DWV1 15/12/2015 9B
5237 DWV1 15/12/2015 7C2
5238 DWV1 12/12/2015 17D1
5239 DWV1 12/12/2015 2C
5403 DWV1 12/12/2015 12F
5400 DWV1 12/12/2015 11B2
5242 DWV1 12/12/2015 15D
5243 DWV1 12/12/2015 6D1
5244 DWV1 12/12/2015 170
5245 DWV1 12/12/2015 13D
5246 DWV1 12/12/2015 300
5247 DWV1 12/12/2015 12E
5248 DWV1 12/12/2015 5C
5249 DWV1 12/12/2015 15L
5250 DWV1 12/12/2015 6A2
5251 DWV1 15/12/2015 7E
5252 DWV1 15/12/2015 1DF
5253 DWV1 12/12/2015 16B
5254 ??? 16/05/2016 1L
5255 ??? 16/05/2016 13L
5256 ??? 16/05/2016 10B
5257 DW 18/12/2015 3F
5258 DW 18/12/2015 17C2
5259 DW 18/12/2015 9A
5260 DW 18/12/2015 7C1
5398 DW 18/12/2015 18A
5261 DW 18/12/2015 4E
5262 Binnington 16/05/2016 19B
5265 Binnington 16/05/2016 3L
5266 Binnington 16/05/2016 8L
5267 Binnington 16/05/2016 7L
5268 Binnington 16/05/2016 10L
5269 Binnington 16/05/2016 4L?
5270 Binnington 16/05/2016 5c
5271 Binnington 16/05/2016 20B
5272 Binnington 16/05/2016 1D
5274 Binnington 16/05/2016 14L
5275 Binnington 16/05/2016 12C
5276 Binnington 16/05/2016 23C
5277 ??? 16/05/2016 9L
5278 ??? 16/05/2016 12b
5279 ??? 16/05/2016 14b
5280 ??? 16/05/2016 1B
225
5281 ??? 16/05/2016 15L
5283 ??? 16/05/2016 2L
5284 LynwoodV3 06/04/2015 15c
5285 LynwoodV3 06/04/2015 17D
5286 LynwoodV3 06/04/2015 3D
5287 LynwoodV3 06/04/2015 25b
5288 LynwoodV3 06/04/2015 6d
5289 LynwoodV3 06/04/2015 6C
5290 LynwoodV3 06/04/2015 21B
5291 LynwoodV3 06/04/2015 27D
5292 LynwoodV3 06/04/2015 4B
5293 LynwoodV3 06/04/2015 16B
5294 LynwoodV3 06/04/2015 25C
5396 LynwoodV3 06/04/2015 16E
5295 LynwoodV3 06/04/2015 24b
5296 LynwoodV3 06/04/2015 4C
5415 LynwoodV3 06/04/2015 12b
5297 LynwoodV3 06/04/2015 17e
5298 LynwoodV3 06/04/2015 1D1
5299 LynwoodV3 06/04/2015 27C
5300 LynwoodV3 06/04/2015 25D
5301 LynwoodV3 06/04/2015 1D2
5303 F2 14/12/2015 14E
5304 F2 14/12/2015 300
5305 F2 14/12/2015 5D
5306 F2 14/12/2015 6E
5307 F2 14/12/2015 8C
5394 F2 14/12/2015 6C
5308 F2 14/12/2015 7L
5309 F2 14/12/2015 19B
5310 F2 14/12/2015 18c
5311 F2 14/12/2015 12A
5312 F2 14/12/2015 16B
5313 F2 14/12/2015 6D
5314 F2 14/12/2015 13?
5315 F2 10/12/2015 12D
5316 F2 10/12/2015 1F
5317 F2 10/12/2015 4D
5318 F2 10/12/2015 5F
5319 F2 10/12/2015 4F
5320 F2 10/12/2015 10D
5321 F2 10/12/2015 20A
5322 F2 10/12/2015 16E
5324 F2 10/12/2015 12C
5325 F2 10/12/2015 7A
5326 F2 10/12/2015 14A
5327 F2 10/12/2015 1E
5328 F2 10/12/2015 13C
5329 F2 10/12/2015 9B
5330 F2 10/12/2015 15C
226
5331 F2 10/12/2015 5E
5332 F2 10/12/2015 10B
5333 F2 10/12/2015 2B
5334 BV3 27/04/2016 9B
5335 BV3 27/04/2016 7B
5336 BV3 27/04/2016 21B
5337 BV3 27/04/2016 24B
5393 BV3 27/04/2016 23C
5339 BV3 27/04/2016 15b
5340 BV3 27/04/2016 17C
5341 BV3 27/04/2016 21C
5342 BV3 27/04/2016 6C
5343 BV3 27/04/2016 13C
5344 BV3 27/04/2016 5b
5345 BV3 27/04/2016 17b
5346 BV3 27/04/2016 16d
5347 BV3 27/04/2016 176
5348 BV3 27/04/2016 24C
5349 BV3 27/04/2016 13C
5350 BV3 27/04/2016 14b
5351 BV3 27/04/2016 6e
5353 BV3 27/04/2016 1B
5354 BV3 27/04/2016 15A
5355 BV3 27/04/2016 14C
5356 BV3 27/04/2016 9C
5358 BV3 27/04/2016 12C
5359 BV3 27/04/2016 11b
5360 BV3 27/04/2016 19b
5361 BV3 27/04/2016 24d
5362 BV3 27/04/2016 4d
5363 BV3 27/04/2016 8C
5364 BV3 27/04/2016 20C
5365 BV3 27/04/2016 7b
5366 BV3 27/04/2016 4C
5367 BV3 27/04/2016 11C
5368 BV3 27/04/2016 15C
5370 BV3 27/04/2016 2e
5371 BV3 27/04/2016 23b
5372 BV3 27/04/2016 10C
5373 BV4 16/05/2016 11C
5374 BV4 16/05/2016 4C
5376 BV4 16/05/2016 17C
5377 BV4 16/05/2016 19C
5379 BV4 16/05/2016 11C
5380 BV4 16/05/2016 10C
5381 BV4 16/05/2016 18C
5382 BV4 16/05/2016 16B
5384 BV4 16/05/2016 6C
5387 Binnington 13/12/2016 13D
5388 Binnington 14/12/2015 2b1
227
5389 Binnington 14/12/2015 2F
5390 Binnington 14/12/2015 20B
5391 Binnington V1 15C
5392 Binnington 14/12/2015 15B
5385 Binnington 14/12/2015 9A
Table. 8.22. Background of UTI isolates used in the characterization
*UTI number **Donation number ***MLST
UTI115 3 ST131
UTI115 6 ST681
UTI115 7 ST131
UTI115 11 ST131
UTI115 12 ST681
UTI138 1 ST131
UTI138 2 ST131
UTI138 3 ST131
UTI138 4 ST677
UTI138 5 ST677
UTI138 6 ST131
UTI138 7 ST677
UTI138 8 ST677
UTI138 9 ST677
UTI138 10 ST677
UTI138 11 ST677
UTI138 12 ST677
UTI139 5 ST131
UTI139 8 ST131
UTI139 9 ST131
UTI218 2 ST73
UTI218 5 ST73
UTI236 4 ST421
UTI337 1 ST73
UTI337 2 ST73
UTI337 3 ST73
UTI337 4 ST73
UTI337 5 ST73
UTI337 6 ST59
UTI337 7 ST73
UTI337 8 ST73
UTI337 9 ST73
UTI337 10 ST73
UTI337 11 ST73
UTI337 12 ST73
UTI343 1 ST144
UTI343 2 ST144
228
UTI343 3 ST144
UTI343 4 ST144
UTI343 5 ST144
UTI343 7 ST12
UTI343 8 ST12
UTI343 9 ST144
UTI343 10 ST144
UTI343 11 ST69
UTI365 2 ST335
UTI365 4 ST404
UTI365 5 ST404
UTI365 6 ST404
UTI365 7 ST404
UTI365 8 ST404
UTI365 9 ST404
UTI365 10 ST404
UTI365 12 ST404
UTI376 9 ST362
UTI376 12 ST362
UTI383 1 ST12
UTI383 2 ST12
UTI383 3 ST12
UTI383 4 ST12
UTI383 5 ST12
UTI383 6 ST12
UTI383 7 ST12
UTI383 8 ST12
UTI383 9 ST12
UTI383 10 ST12
UTI383 12 ST12
UTI414 1 ST91
UTI414 5 ST91
UTI414 7 ST91
UTI414 8 ST91
UTI414 10 ST91
UTI468 1 ST73
UTI468 2 ST73
UTI468 3 ST73
UTI468 4 ST73
UTI468 5 ST73
UTI468 6 ST73
UTI468 7 ST73
UTI468 8 ST73
UTI468 9 ST73
UTI468 10 ST73
UTI468 11 ST73
229
UTI468 12 ST73
UTI524 2 ST73
UTI524 5 ST73
UTI524 7 ST73
UTI524 8 ST38
UTI524 11 ST73
UTI524 12 ST73
UTI531 1 ST420
UTI531 2 ST420
UTI531 3 ST420
UTI531 4 ST420
UTI531 5 ST420
UTI531 6 ST420
UTI531 7 ST583
UTI531 8 ST420
UTI531 9 ST420
UTI531 10 ST420
UTI531 11 ST420
UTI531 12 ST420
UTI536 1 ST73
UTI536 2 ST355
UTI536 3 ST355
UTI536 5 ST73
UTI536 6 ST355
UTI536 7 ST355
UTI536 8 ST355
UTI536 10 ST69
UTI536 12 ST355
UTI562 1 ST625
UTI562 2 ST625
UTI562 11 ST1571
UTI569 5 ST3640
UTI569 6 ST442
UTI569 8 ST3640
UTI569 9 ST442
UTI569 10 ST3640
UTI569 11 ST3640
UTI569 12 ST3640
UTI675 1 ST69
UTI675 2 ST69
UTI675 3 ST69
UTI675 6 ST69
UTI675 7 ST69
UTI675 10 ST69
UTI675 12 ST69
UTI726 2 ST69
230
UTI726 3 ST73
UTI726 5 ST73
UTI726 6 ST73
UTI726 8 ST73
UTI726 9 ST73
UTI726 10 ST73
UTI726 11 ST73
UTI726 12 ST73
UTI755 6 ST95
UTI755 7 ST95
UTI755 8 ST95
UTI755 9 ST95
UTI755 12 ST95
UTI781 1 ST127
UTI781 2 ST127
UTI781 3 ST127
UTI781 4 ST127
UTI781 5 ST127
UTI781 6 ST127
UTI781 7 ST127
UTI781 8 ST127
UTI781 9 ST127
UTI781 12 ST127
UTI840 3 ST354
UTI840 4 ST354
UTI840 5 ST354
UTI840 6 ST354
UTI840 7 ST354
UTI840 8 ST354
UTI840 9 ST354
UTI840 10 ST73
UTI840 11 ST354
UTI840 12 ST354
UTI891 2 ST127
UTI899 1 ST69
UTI899 2 ST602
UTI899 3 ST73
UTI899 4 ST73
UTI899 5 ST73
UTI899 6 ST73
UTI899 7 ST73
UTI899 8 ST73
UTI899 9 ST73
UTI899 10 ST73
UTI899 11 ST73
UTI899 12 ST73
231
UTI924 1 ST12
UTI924 2 ST12
UTI924 3 ST73
UTI924 4 ST73
UTI924 7 ST80
UTI924 10 ST677
UTI966 5 ST69
UTI966 7 ST95
UTI966 10 ST73
* Anonymised patient identifier used during UTI study ** Donation E. coli isolated from. Each patient provided 12 donations over 6 months *** Sequence type defined by Warwick scheme
232
Figure. 8.1. Image showing an example of full motility plates used during the flhDC
promoter replacement of strain MG1655.
A) An example of a full motility plate cropped in figure 4.2C. B) Motility phenotype of
strain MG1655 wild type.
233
Figure. 8.2. The secondary structure of the DNA sequence in figure. 5.4.
The output of mFold and shows the secondary structure of the DNA sequence in
figure. 5.4 if it was single stranded DNA (which impacts PCR reactions).
Figure. 8.3. Alignment of the flgB promoter of E. coli strains used in the work of McNally et al. (2013).
237
Chapter Nine: Bibliography
238
Abberton, C.L., Bereschenko, L., van der Wielen, P.W. and Smith, C.J. (2016) 'Survival, Biofilm Formation, and Growth Potential of Environmental and Enteric Escherichia coli Strains in Drinking Water Microcosms', Appl Environ Microbiol, 82(17), pp. 5320-31.
Agaisse, H. (2016) 'Molecular and Cellular Mechanisms of Shigella flexneri Dissemination', Frontiers in Cellular and Infection Microbiology, 6, p. 29.
Akiyama, Y. (2009) 'Quality control of cytoplasmic membrane proteins in Escherichia coli', J Biochem, 146(4), pp. 449-54.
Albanna, A. (2017) Regulation of flagellar mediated motility in the species Salmonella enterica. Ph.D. thesis. Newcastle University.
Aldick, T., Bielaszewska, M., Zhang, W., Brockmeyer, J., Schmidt, H., Friedrich, A.W., Kim, K.S., Schmidt, M.A. and Karch, H. (2007) 'Hemolysin from Shiga toxin-negative Escherichia coli O26 strains injures microvascular endothelium', Microbes Infect, 9(3), pp. 282-90.
Aldridge, C., Poonchareon, K., Saini, S., Ewen, T., Soloyva, A., Rao, C.V., Imada, K., Minamino, T. and Aldridge, P.D. (2010) 'The interaction dynamics of a negative feedback loop regulates flagellar number in Salmonella enterica serovar Typhimurium', Mol Microbiol, 78(6), pp. 1416-30.
Aldridge, P., Gnerer, J., Karlinsey, J.E. and Hughes, K.T. (2006a) 'Transcriptional and translational control of the Salmonella fliC gene', J Bacteriol, 188(12), pp. 4487-96.
Aldridge, P. and Hughes, K.T. (2001) 'How and when are substrates selected for type III secretion?', Trends Microbiol, 9(5), pp. 209-14.
Aldridge, P. and Hughes, K.T. (2002) 'Regulation of flagellar assembly', Curr Opin Microbiol, 5(2), pp. 160-5.
Aldridge, P., Karlinsey, J. and Hughes, K.T. (2003) 'The type III secretion chaperone FlgN regulates flagellar assembly via a negative feedback loop containing its chaperone substrates FlgK and FlgL', Mol Microbiol, 49(5), pp. 1333-45.
Aldridge, P., Karlinsey, J.E., Becker, E., Chevance, F.F.V. and Hughes, K.T. (2006b) 'Flk prevents premature secretion of the anti-σ factor FlgM into the periplasm', Molecular Microbiology, 60(3), pp. 630-643.
Aldridge, P.D., Karlinsey, J.E., Aldridge, C., Birchall, C., Thompson, D., Yagasaki, J. and Hughes, K.T. (2006c) 'The flagellar-specific transcription factor, σ(28), is the Type III secretion chaperone for the flagellar-specific anti-σ(28) factor FlgM', Genes & Development, 20(16), pp. 2315-2326.
Anderson, G.G., Palermo, J.J., Schilling, J.D., Roth, R., Heuser, J. and Hultgren, S.J. (2003) 'Intracellular bacterial biofilm-like pods in urinary tract infections', Science, 301(5629), pp. 105-7.
Ashida, H., Ogawa, M., Kim, M., Suzuki, S., Sanada, T., Punginelli, C., Mimuro, H. and Sasakawa, C. (2011) 'Shigella deploy multiple countermeasures against host innate immune responses', Curr Opin Microbiol, 14(1), pp. 16-23.
239
Badea, L., Doughty, S., Nicholls, L., Sloan, J., Robins-Browne, R.M. and Hartland, E.L. (2003) 'Contribution of Efa1/LifA to the adherence of enteropathogenic Escherichia coli to epithelial cells', Microb Pathog, 34(5), pp. 205-15.
Barembruch, C. and Hengge, R. (2007) 'Cellular levels and activity of the flagellar sigma factor FliA of Escherichia coli are controlled by FlgM-modulated proteolysis', Mol Microbiol, 65(1), pp. 76-89.
Barker, C.S., Pruss, B.M. and Matsumura, P. (2004) 'Increased motility of Escherichia coli by insertion sequence element integration into the regulatory region of the flhD operon', J Bacteriol, 186(22), pp. 7529-37.
Barnich, N., Carvalho, F.A., Glasser, A.L., Darcha, C., Jantscheff, P., Allez, M., Peeters, H., Bommelaer, G., Desreumaux, P., Colombel, J.F. and Darfeuille-Michaud, A. (2007) 'CEACAM6 acts as a receptor for adherent-invasive E. coli, supporting ileal mucosa colonization in Crohn disease', J Clin Invest, 117(6), pp. 1566-74.
Barrangou, R., Fremaux, C., Deveau, H., Richards, M., Boyaval, P., Moineau, S., Romero, D.A. and Horvath, P. (2007) 'CRISPR provides acquired resistance against viruses in prokaryotes', Science, 315(5819), pp. 1709-12.
Belaaouaj, A., Kim, K.S. and Shapiro, S.D. (2000) 'Degradation of outer membrane protein A in Escherichia coli killing by neutrophil elastase', Science, 289(5482), pp. 1185-8.
Belén, A., Pavón, I. and Maiden, M.C.J. (2009) 'Multilocus Sequence Typing', Methods in molecular biology (Clifton, N.J.), 551, pp. 129-140.
Berg, R.D. (1998) 'Escherichia coli, infection and immunity', in Roitt, I.M. and Delves, P.J. (eds.) Encyclopedia of immunology. 2nd edn. London: Academic Press, pp. 842-845.
Betis, F., Brest, P., Hofman, V., Guignot, J., Kansau, I., Rossi, B., Servin, A. and Hofman, P. (2003) 'Afa/Dr diffusely adhering Escherichia coli infection in T84 cell monolayers induces increased neutrophil transepithelial migration, which in turn promotes cytokine-dependent upregulation of decay-accelerating factor (CD55), the receptor for Afa/Dr adhesins', Infect Immun, 71(4), pp. 1774-83.
Bisercic, M., Feutrier, J.Y. and Reeves, P.R. (1991) 'Nucleotide sequences of the gnd genes from nine natural isolates of Escherichia coli: evidence of intragenic recombination as a contributing factor in the evolution of the polymorphic gnd locus', J Bacteriol, 173(12), pp. 3894-900.
Blank, K., Hensel, M. and Gerlach, R.G. (2011) 'Rapid and highly efficient method for scarless mutagenesis within the Salmonella enterica chromosome', PLoS One, 6(1), p. e15763.
Blattner, F.R., Plunkett, G., 3rd, Bloch, C.A., Perna, N.T., Burland, V., Riley, M., Collado-Vides, J., Glasner, J.D., Rode, C.K., Mayhew, G.F., Gregor, J., Davis, N.W., Kirkpatrick, H.A., Goeden, M.A., Rose, D.J., Mau, B. and Shao, Y. (1997) 'The complete genome sequence of Escherichia coli K-12', Science, 277(5331), pp. 1453-62.
240
Bokranz, W., Wang, X., Tschape, H. and Romling, U. (2005) 'Expression of cellulose and curli fimbriae by Escherichia coli isolated from the gastrointestinal tract', J Med Microbiol, 54(Pt 12), pp. 1171-82.
Boyd, E.F. and Hartl, D.L. (1998) 'Chromosomal regions specific to pathogenic isolates of Escherichia coli have a phylogenetically clustered distribution', J Bacteriol, 180(5), pp. 1159-65.
Brenner, D.J., Fanning, G.R., Skerman, F.J. and Falkow, S. (1972) 'Polynucleotide sequence divergence among strains of Escherichia coli and closely related organisms', J Bacteriol, 109(3), pp. 953-65.
Bringer, M.A., Barnich, N., Glasser, A.L., Bardot, O. and Darfeuille-Michaud, A. (2005) 'HtrA stress protein is involved in intramacrophagic replication of adherent and invasive Escherichia coli strain LF82 isolated from a patient with Crohn's disease', Infect Immun, 73(2), pp. 712-21.
Brodrick, H.J., Raven, K.E., Harrison, E.M., Blane, B., Reuter, S., Torok, M.E., Parkhill, J. and Peacock, S.J. (2016) 'Whole-genome sequencing reveals transmission of vancomycin-resistant Enterococcus faecium in a healthcare network', Genome Med, 8(1), p. 4.
Brombacher, E., Baratto, A., Dorel, C. and Landini, P. (2006) 'Gene expression regulation by the Curli activator CsgD protein: modulation of cellulose biosynthesis and control of negative determinants for microbial adhesion', J Bacteriol, 188(6), pp. 2027-37.
Brown, J., Faulds-Pain, A. and Aldridge, P. (2009) 'The coordination of flagellar gene expression and the flagellar assembly pathway', in Jarrell, K.F. (ed.) Pili and flagella: Current research and future trends. Norfolk: Caister Academic Press, pp. 99-120.
Brown, J.D., Saini, S., Aldridge, C., Herbert, J., Rao, C.V. and Aldridge, P.D. (2008) 'The rate of protein secretion dictates the temporal dynamics of flagellar gene expression', Mol Microbiol, 70(4), pp. 924-37.
Burkart, M., Toguchi, A. and Harshey, R.M. (1998) 'The chemotaxis system, but not chemotaxis, is essential for swarming motility in Escherichia coli', Proceedings of the National Academy of Sciences, 95(5), pp. 2568-2573.
Cai, S.J. and Inouye, M. (2002) 'EnvZ-OmpR interaction and osmoregulation in Escherichia coli', J Biol Chem, 277(27), pp. 24155-61.
Carlos, C., Pires, M.M., Stoppe, N.C., Hachich, E.M., Sato, M.I., Gomes, T.A., Amaral, L.A. and Ottoboni, L.M. (2010) 'Escherichia coli phylogenetic group determination and its application in the identification of the major animal source of fecal contamination', BMC Microbiol, 10, p. 161.
Caza, M. and Kronstad, J.W. (2013) 'Shared and distinct mechanisms of iron acquisition by bacterial and fungal pathogens of humans', Front Cell Infect Microbiol, 3, p. 80.
Cerca, N., Maira-Litran, T., Jefferson, K.K., Grout, M., Goldmann, D.A. and Pier, G.B. (2007) 'Protection against Escherichia coli infection by antibody to the
241
Staphylococcus aureus poly-N-acetylglucosamine surface polysaccharide', Proc Natl Acad Sci U S A, 104(18), pp. 7528-33.
Chadsey, M.S., Karlinsey, J.E. and Hughes, K.T. (1998) 'The flagellar anti-sigma factor FlgM actively dissociates Salmonella typhimurium sigma28 RNA polymerase holoenzyme', Genes Dev, 12(19), pp. 3123-36.
Chang, W.S., Li, X. and Halverson, L.J. (2009) 'Influence of water limitation on endogenous oxidative stress and cell death within unsaturated Pseudomonas putida biofilms', Environ Microbiol, 11(6), pp. 1482-92.
Chassaing, B., Rolhion, N., de Vallee, A., Salim, S.Y., Prorok-Hamon, M., Neut, C., Campbell, B.J., Soderholm, J.D., Hugot, J.P., Colombel, J.F. and Darfeuille-Michaud, A. (2011) 'Crohn disease--associated adherent-invasive E. coli bacteria target mouse and human Peyer's patches via long polar fimbriae', J Clin Invest, 121(3), pp. 966-75.
Chaudhuri, R.R. and Henderson, I.R. (2012) 'The evolution of the Escherichia coli phylogeny', Infect Genet Evol, 12(2), pp. 214-26.
Chen, S.L., Hung, C.-S., Xu, J., Reigstad, C.S., Magrini, V., Sabo, A., Blasiar, D., Bieri, T., Meyer, R.R., Ozersky, P., Armstrong, J.R., Fulton, R.S., Latreille, J.P., Spieth, J., Hooton, T.M., Mardis, E.R., Hultgren, S.J. and Gordon, J.I. (2006) 'Identification of genes subject to positive selection in uropathogenic strains of Escherichia coli: A comparative genomics approach', Proceedings of the National Academy of Sciences, 103(15), pp. 5977-5982.
Chevance, F.F. and Hughes, K.T. (2008) 'Coordinating assembly of a bacterial macromolecular machine', Nat Rev Microbiol, 6(6), pp. 455-65.
Chilcott, G.S. and Hughes, K.T. (2000) 'Coupling of flagellar gene expression to flagellar assembly in Salmonella enterica serovar typhimurium and Escherichia coli', Microbiol Mol Biol Rev, 64(4), pp. 694-708.
Cirl, C., Wieser, A., Yadav, M., Duerr, S., Schubert, S., Fischer, H., Stappert, D., Wantia, N., Rodriguez, N., Wagner, H., Svanborg, C. and Miethke, T. (2008) 'Subversion of Toll-like receptor signaling by a unique family of bacterial Toll/interleukin-1 receptor domain-containing proteins', Nat Med, 14(4), pp. 399-406.
Claret, L. and Hughes, C. (2000a) 'Functions of the subunits in the FlhD2C2 transcriptional master regulator of bacterial flagellum biogenesis and swarming', Journal of Molecular Biology, 303(4), pp. 467-478.
Claret, L. and Hughes, C. (2000b) 'Rapid turnover of FlhD and FlhC, the flagellar regulon transcriptional activator proteins, during Proteus swarming', J Bacteriol, 182(3), pp. 833-6.
Claret, L. and Hughes, C. (2002) 'Interaction of the Atypical Prokaryotic Transcription Activator FlhD2C2 with Early Promoters of the Flagellar Gene Hierarchy', Journal of Molecular Biology, 321(2), pp. 185-199.
Clegg, S. and Hughes, K.T. (2002) 'FimZ is a molecular link between sticking and swimming in Salmonella enterica serovar Typhimurium', J Bacteriol, 184(4), pp. 1209-13.
242
Clermont, O., Bonacorsi, S. and Bingen, E. (2000) 'Rapid and simple determination of the Escherichia coli phylogenetic group', Appl Environ Microbiol, 66(10), pp. 4555-8.
Clermont, O., Christenson, J.K., Denamur, E. and Gordon, D.M. (2013) 'The Clermont Escherichia coli phylo-typing method revisited: improvement of specificity and detection of new phylo-groups', Environ Microbiol Rep, 5(1), pp. 58-65.
Clermont, O., Gordon, D. and Denamur, E. (2015) 'Guide to the various phylogenetic classification schemes for Escherichia coli and the correspondence among schemes', Microbiology, 161(Pt 5), pp. 980-8.
Conway, T., Creecy, J.P., Maddox, S.M., Grissom, J.E., Conkle, T.L., Shadid, T.M., Teramoto, J., San Miguel, P., Shimada, T., Ishihama, A., Mori, H. and Wanner, B.L. (2014) 'Unprecedented high-resolution view of bacterial operon architecture revealed by RNA sequencing', MBio, 5(4), pp. e01442-14.
Costerton, J.W., Stewart, P.S. and Greenberg, E.P. (1999) 'Bacterial biofilms: a common cause of persistent infections', Science, 284(5418), pp. 1318-22.
Cote, J.P. and Mourez, M. (2011) 'Structure-function analysis of the TibA self-associating autotransporter reveals a modular organization', Infect Immun, 79(5), pp. 1826-32.
Craney, A., Hohenauer, T., Xu, Y., Navani, N.K., Li, Y. and Nodwell, J. (2007) 'A synthetic luxCDABE gene cluster optimized for expression in high-GC bacteria', Nucleic Acids Research, 35(6), pp. e46-e46.
Croxen, M.A. and Finlay, B.B. (2010) 'Molecular mechanisms of Escherichia coli pathogenicity', Nat Rev Microbiol, 8(1), pp. 26-38.
Croxen, M.A., Law, R.J., Scholz, R., Keeney, K.M., Wlodarska, M. and Finlay, B.B. (2013) 'Recent Advances in Understanding Enteric Pathogenic Escherichia coli', Clinical Microbiology Reviews, 26(4), pp. 822-880.
Darnton, N.C., Turner, L., Rojevsky, S. and Berg, H.C. (2010) 'Dynamics of Bacterial Swarming', Biophysical Journal, 98(10), pp. 2082-2090.
Datsenko, K.A. and Wanner, B.L. (2000) 'One-step inactivation of chromosomal genes in Escherichia coli K-12 using PCR products', Proc Natl Acad Sci U S A, 97(12), pp. 6640-5.
Day, R.N. and Davidson, M.W. (2009) 'The fluorescent protein palette: tools for cellular imaging', Chemical Society reviews, 38(10), pp. 2887-2921.
De Lay, N. and Gottesman, S. (2012) 'A complex network of small non-coding RNAs regulate motility in Escherichia coli', Mol Microbiol, 86(3), pp. 524-38.
243
Dean, P. and Kenny, B. (2009) 'The effector repertoire of enteropathogenic E. coli: ganging up on the host cell', Current Opinion in Microbiology, 12(1-3), pp. 101-109.
Delalez, N.J., Wadhams, G.H., Rosser, G., Xue, Q., Brown, M.T., Dobbie, I.M., Berry, R.M., Leake, M.C. and Armitage, J.P. (2010) 'Signal-dependent turnover of the bacterial flagellar switch protein FliM', Proc Natl Acad Sci U S A, 107(25), pp. 11347-51.
DePas, W.H., Syed, A.K., Sifuentes, M., Lee, J.S., Warshaw, D., Saggar, V., Csankovszki, G., Boles, B.R. and Chapman, M.R. (2014) 'Biofilm formation protects Escherichia coli against killing by Caenorhabditis elegans and Myxococcus xanthus', Appl Environ Microbiol, 80(22), pp. 7079-87.
DeVinney, R., Stein, M., Reinscheid, D., Abe, A., Ruschkowski, S. and Finlay, B.B. (1999) 'Enterohemorrhagic Escherichia coli O157:H7 produces Tir, which is translocated to the host cell membrane but is not tyrosine phosphorylated', Infect Immun, 67(5), pp. 2389-98.
Dhakal, B.K. and Mulvey, M.A. (2012) 'The UPEC Pore Forming Toxin α-Hemolysin Triggers Proteolysis of Host Proteins to Disrupt Cell Adhesion, Inflammatory and Survival Pathways', Cell host & microbe, 11(1), pp. 58-69.
Diaz, E., Ferrandez, A., Prieto, M.A. and Garcia, J.L. (2001) 'Biodegradation of aromatic compounds by Escherichia coli', Microbiol Mol Biol Rev, 65(4), pp. 523-69, table of contents.
Dobrindt, U., Hochhut, B., Hentschel, U. and Hacker, J. (2004) 'Genomic islands in pathogenic and environmental microorganisms', Nat Rev Microbiol, 2(5), pp. 414-24.
Drage, L. (2016) A longitudinal study of long-term Escherichia coli colonisation of the elderly bladder. Ph.D. thesis. Newcastle University.
Dudley, E.G., Abe, C., Ghigo, J.-M., Latour-Lambert, P., Hormazabal, J.C. and Nataro, J.P. (2006) 'An IncI1 Plasmid Contributes to the Adherence of the Atypical Enteroaggregative Escherichia coli Strain C1096 to Cultured Cells and Abiotic Surfaces', Infection and Immunity, 74(4), pp. 2102-2114.
Dunlap, P. (2014) 'Biochemistry and genetics of bacterial bioluminescence', Adv Biochem Eng Biotechnol, 144, pp. 37-64.
Durfee, T., Nelson, R., Baldwin, S., Plunkett, G., 3rd, Burland, V., Mau, B., Petrosino, J.F., Qin, X., Muzny, D.M., Ayele, M., Gibbs, R.A., Csorgo, B., Posfai, G., Weinstock, G.M. and Blattner, F.R. (2008) 'The complete genome sequence of Escherichia coli DH10B: insights into the biology of a laboratory workhorse', J Bacteriol, 190(7), pp. 2597-606.
Ebel, W., Skinner, M., Dierksen, K., Scott, J. and Trempy, J. (1999) 'A Conserved Domain in Escherichia coli Lon Protease Is Involved in Substrate Discriminator Activity', J Bacteriol, 181(7), pp. 2236-2243.
Escobar-Paramo, P., Clermont, O., Blanc-Potard, A.B., Bui, H., Le Bouguenec, C. and Denamur, E. (2004) 'A specific genetic background is required for acquisition
244
and expression of virulence factors in Escherichia coli', Mol Biol Evol, 21(6), pp. 1085-94.
Estrada-Garcia, T. and Navarro-Garcia, F. (2012) 'Enteroaggregative Escherichia coli pathotype: a genetically heterogeneous emerging foodborne enteropathogen', FEMS Immunol Med Microbiol, 66(3), pp. 281-98.
Fahrner, K.A. and Berg, H.C. (2015) 'Mutations That Stimulate flhDC Expression in Escherichia coli K-12', J Bacteriol, 197(19), pp. 3087-96.
Farfan, M.J., Toro, C.S., Barry, E.M. and Nataro, J.P. (2011) 'Shigella enterotoxin-2 is a type III effector that participates in Shigella-induced interleukin 8 secretion by epithelial cells', FEMS Immunol Med Microbiol, 61(3), pp. 332-9.
Faulds-Pain, A., Birchall, C., Aldridge, C., Smith, W.D., Grimaldi, G., Nakamura, S., Miyata, T., Gray, J., Li, G., Tang, J.X., Namba, K., Minamino, T. and Aldridge, P.D. (2011) 'Flagellin redundancy in Caulobacter crescentus and its implications for flagellar filament assembly', J Bacteriol, 193(11), pp. 2695-707.
Ferens, W.A. and Hovde, C.J. (2011) 'Escherichia coli O157:H7: animal reservoir and sources of human infection', Foodborne Pathog Dis, 8(4), pp. 465-87.
Ferrieres, L., Hancock, V. and Klemm, P. (2007) 'Biofilm exclusion of uropathogenic bacteria by selected asymptomatic bacteriuria Escherichia coli strains', Microbiology, 153(Pt 6), pp. 1711-9.
Field, K.G. and Samadpour, M. (2007) 'Fecal source tracking, the indicator paradigm, and managing water quality', Water Res, 41(16), pp. 3517-38.
Flores-Mireles, A.L., Walker, J.N., Caparon, M. and Hultgren, S.J. (2015) 'Urinary tract infections: epidemiology, mechanisms of infection and treatment options', Nat Rev Microbiol, 13(5), pp. 269-84.
Foxman, B. (2010) 'The epidemiology of urinary tract infection', Nat Rev Urol, 7(12), pp. 653-60.
Francez-Charlot, A., Laugel, B., Van Gemert, A., Dubarry, N., Wiorowski, F., Castanie-Cornet, M.P., Gutierrez, C. and Cam, K. (2003) 'RcsCDB His-Asp phosphorelay system negatively regulates the flhDC operon in Escherichia coli', Mol Microbiol, 49(3), pp. 823-32.
Francis, N.R., Sosinsky, G.E., Thomas, D. and DeRosier, D.J. (1994) 'Isolation, characterization and structure of bacterial flagellar motors containing the switch complex', J Mol Biol, 235(4), pp. 1261-70.
Fraser, G.M., Hirano, T., Ferris, H.U., Devgan, L.L., Kihara, M. and Macnab, R.M. (2003) 'Substrate specificity of type III flagellar protein export in Salmonella is controlled by subdomain interactions in FlhB', Mol Microbiol, 48(4), pp. 1043-57.
Garcia, E.C., Brumbaugh, A.R. and Mobley, H.L. (2011) 'Redundancy and specificity of Escherichia coli iron acquisition systems during urinary tract infection', Infect Immun, 79(3), pp. 1225-35.
245
Garcia, T.A., Ventura, C.L., Smith, M.A., Merrell, D.S. and O'Brien, A.D. (2013) 'Cytotoxic necrotizing factor 1 and hemolysin from uropathogenic Escherichia coli elicit different host responses in the murine bladder', Infect Immun, 81(1), pp. 99-109.
Gay, P., Le Coq, D., Steinmetz, M., Berkelman, T. and Kado, C.I. (1985) 'Positive selection procedure for entrapment of insertion sequence elements in gram-negative bacteria', J Bacteriol, 164(2), pp. 918-21.
Gerlach, R.G., Jäckel, D., Hölzer, S.U. and Hensel, M. (2009) 'Rapid Oligonucleotide-Based Recombineering of the Chromosome of Salmonella enterica', Applied and Environmental Microbiology, 75(6), pp. 1575-1580.
Ghosh, R., Kumar, A. and Vaziri, A. (2014) 'Type-IV Pilus Deformation Can Explain Retraction Behavior', PLoS ONE, 9(12), p. e114613.
Gobert, A.P., Vareille, M., Glasser, A.L., Hindre, T., de Sablet, T. and Martin, C. (2007) 'Shiga toxin produced by enterohemorrhagic Escherichia coli inhibits PI3K/NF-kappaB signaling pathway in globotriaosylceramide-3-negative human intestinal epithelial cells', J Immunol, 178(12), pp. 8168-74.
Goldenfeld, N. and Woese, C. (2007) 'Biology's next revolution', Nature, 445(7126), p. 369.
Goller, C., Wang, X., Itoh, Y. and Romeo, T. (2006) 'The cation-responsive protein NhaR of Escherichia coli activates pgaABCD transcription, required for production of the biofilm adhesin poly-beta-1,6-N-acetyl-D-glucosamine', J Bacteriol, 188(23), pp. 8022-32.
Goodier, R.I. and Ahmer, B.M.M. (2001) 'SirA Orthologs Affect both Motility and Virulence', Journal of Bacteriology, 183(7), pp. 2249-2258.
Gottesman, S. (1999) 'Regulation by proteolysis: developmental switches', Curr Opin Microbiol, 2(2), pp. 142-7.
Guignot, J., Chaplais, C., Coconnier-Polter, M.H. and Servin, A.L. (2007) 'The secreted autotransporter toxin, Sat, functions as a virulence factor in Afa/Dr diffusely adhering Escherichia coli by promoting lesions in tight junction of polarized epithelial cells', Cell Microbiol, 9(1), pp. 204-21.
Gunther, N.W.t., Snyder, J.A., Lockatell, V., Blomfield, I., Johnson, D.E. and Mobley, H.L. (2002) 'Assessment of virulence of uropathogenic Escherichia coli type 1 fimbrial mutants in which the invertible element is phase-locked on or off', Infect Immun, 70(7), pp. 3344-54.
Gustavsson, N., Diez, A. and Nystrom, T. (2002) 'The universal stress protein paralogues of Escherichia coli are co-ordinately regulated and co-operate in the defence against DNA damage', Mol Microbiol, 43(1), pp. 107-17.
Hacker, J., Hentschel, U. and Dobrindt, U. (2003) 'Prokaryotic chromosomes and disease', Science, 301(5634), pp. 790-3.
Haddock, S.H., Moline, M.A. and Case, J.F. (2010) 'Bioluminescence in the sea', Ann Rev Mar Sci, 2, pp. 443-93.
246
Hannan, T.J., Totsika, M., Mansfield, K.J., Moore, K.H., Schembri, M.A. and Hultgren, S.J. (2012) 'Host-pathogen checkpoints and population bottlenecks in persistent and intracellular uropathogenic Escherichia coli bladder infection', FEMS Microbiol Rev, 36(3), pp. 616-48.
Harshey, R.M. (2003) 'Bacterial motility on a surface: many ways to a common goal', Annu Rev Microbiol, 57, pp. 249-73.
Hastings, J.W., Potrikus, C.J., Gupta, S.C., Kurfurst, M. and Makemson, J.C. (1985) 'Biochemistry and physiology of bioluminescent bacteria', Adv Microb Physiol, 26, pp. 235-91.
He, S., Hickman, A.B., Varani, A.M., Siguier, P., Chandler, M., Dekker, J.P. and Dyda, F. (2015) 'Insertion Sequence IS26 Reorganizes Plasmids in Clinically Isolated Multidrug-Resistant Bacteria by Replicative Transposition', mBio, 6(3), pp. e00762-15.
Heermann, R., Weber, A., Mayer, B., Ott, M., Hauser, E., Gabriel, G., Pirch, T. and Jung, K. (2009) 'The universal stress protein UspC scaffolds the KdpD/KdpE signaling cascade of Escherichia coli under salt stress', J Mol Biol, 386(1), pp. 134-48.
Henderson, I.R., Czeczulin, J., Eslava, C., Noriega, F. and Nataro, J.P. (1999) 'Characterization of Pic, a Secreted Protease of Shigella flexneri and Enteroaggregative Escherichia coli', Infection and Immunity, 67(11), pp. 5587-5596.
Hengge, R. (2010) 'Role of Cyclic Di-GMP in the Regulatory Networks of Escherichia coli', in The Second Messenger Cyclic Di-GMP. American Society of Microbiology.
Henrichsen, J. (1972) 'Bacterial surface translocation: a survey and a classification', Bacteriological Reviews, 36(4), pp. 478-503.
Herold, S., Paton, J.C. and Paton, A.W. (2009) 'Sab, a novel autotransporter of locus of enterocyte effacement-negative shiga-toxigenic Escherichia coli O113:H21, contributes to adherence and biofilm formation', Infect Immun, 77(8), pp. 3234-43.
Herzer, P.J., Inouye, S., Inouye, M. and Whittam, T.S. (1990) 'Phylogenetic distribution of branched RNA-linked multicopy single-stranded DNA among natural isolates of Escherichia coli', J Bacteriol, 172(11), pp. 6175-81.
Hirano, T., Minamino, T. and Macnab, R.M. (2001) 'The role in flagellar rod assembly of the N-terminal domain of Salmonella FlgJ, a flagellum-specific muramidase', J Mol Biol, 312(2), pp. 359-69.
Hirano, T., Yamaguchi, S., Oosawa, K. and Aizawa, S. (1994) 'Roles of FliK and FlhB in determination of flagellar hook length in Salmonella typhimurium', J Bacteriol, 176(17), pp. 5439-49.
Ho Sui, S.J., Fedynak, A., Hsiao, W.W., Langille, M.G. and Brinkman, F.S. (2009) 'The association of virulence factors with genomic islands', PLoS One, 4(12), p. e8094.
Homma, M. and Iino, T. (1985) 'Excretion of unassembled hook-associated proteins by Salmonella typhimurium', J Bacteriol, 164(3), pp. 1370-2.
247
Homma, M., Kutsukake, K., Hasebe, M., Iino, T. and Macnab, R.M. (1990) 'FlgB, FlgC, FlgF and FlgG. A family of structurally related proteins in the flagellar basal body of Salmonella typhimurium', J Mol Biol, 211(2), pp. 465-77.
Homma, M., Kutsukake, K., Iino, T. and Yamaguchi, S. (1984) 'Hook-associated proteins essential for flagellar filament formation in Salmonella typhimurium', Journal of Bacteriology, 157(1), pp. 100-108.
Hughes, K.T., Gillen, K.L., Semon, M.J. and Karlinsey, J.E. (1993) 'Sensing structural intermediates in bacterial flagellar assembly by export of a negative regulator', Science, 262(5137), pp. 1277-80.
Humayun, M.Z., Zhang, Z., Butcher, A.M., Moshayedi, A. and Saier, M.H., Jr. (2017) 'Hopping into a hot seat: Role of DNA structural features on IS5-mediated gene activation and inactivation under stress', PLOS ONE, 12(6), p. e0180156.
Hyland, R.M., Sun, J., Griener, T.P., Mulvey, G.L., Klassen, J.S., Donnenberg, M.S. and Armstrong, G.D. (2008) 'The bundlin pilin protein of enteropathogenic Escherichia coli is an N-acetyllactosamine-specific lectin', Cellular microbiology, 10(1), pp. 10.1111/j.1462-5822.2007.01028.x.
Iguchi, A., Thomson, N.R., Ogura, Y., Saunders, D., Ooka, T., Henderson, I.R., Harris, D., Asadulghani, M., Kurokawa, K., Dean, P., Kenny, B., Quail, M.A., Thurston, S., Dougan, G., Hayashi, T., Parkhill, J. and Frankel, G. (2009) 'Complete genome sequence and comparative genome analysis of enteropathogenic Escherichia coli O127:H6 strain E2348/69', J Bacteriol, 191(1), pp. 347-54.
Imada, K., Minamino, T., Kinoshita, M., Furukawa, Y. and Namba, K. (2010) 'Structural insight into the regulatory mechanisms of interactions of the flagellar type III chaperone FliT with its binding partners', Proc Natl Acad Sci U S A, 107(19), pp. 8812-7.
Ishihama, A. (1993) 'Protein-protein communication within the transcription apparatus', J Bacteriol, 175(9), pp. 2483-9.
Ito, K. and Akiyama, Y. (2005) 'Cellular functions, mechanism of action, and regulation of FtsH protease', Annu Rev Microbiol, 59, pp. 211-31.
Jackson, R.W., Vinatzer, B., Arnold, D.L., Dorus, S. and Murillo, J. (2011) 'The influence of the accessory genome on bacterial pathogen evolution', Mob Genet Elements, 1(1), pp. 55-65.
Jaureguy, F., Landraud, L., Passet, V., Diancourt, L., Frapy, E., Guigon, G., Carbonnelle, E., Lortholary, O., Clermont, O., Denamur, E., Picard, B., Nassif, X. and Brisse, S. (2008) 'Phylogenetic and genomic diversity of human bacteremic Escherichia coli strains', BMC Genomics, 9, p. 560.
Jiang, Y., Chen, B., Duan, C., Sun, B., Yang, J. and Yang, S. (2015) 'Multigene editing in the Escherichia coli genome via the CRISPR-Cas9 system', Appl Environ Microbiol, 81(7), pp. 2506-14.
248
Jinek, M., Chylinski, K., Fonfara, I., Hauer, M., Doudna, J.A. and Charpentier, E. (2012) 'A programmable dual-RNA-guided DNA endonuclease in adaptive bacterial immunity', Science, 337(6096), pp. 816-21.
Jonas, K., Edwards, A.N., Simm, R., Romeo, T., Romling, U. and Melefors, O. (2008) 'The RNA binding protein CsrA controls cyclic di-GMP metabolism by directly regulating the expression of GGDEF proteins', Mol Microbiol, 70(1), pp. 236-57.
Juhas, M., van der Meer, J.R., Gaillard, M., Harding, R.M., Hood, D.W. and Crook, D.W. (2009) 'Genomic islands: tools of bacterial horizontal gene transfer and evolution', FEMS Microbiol Rev, 33(2), pp. 376-93.
Justice, S.S., Hung, C., Theriot, J.A., Fletcher, D.A., Anderson, G.G., Footer, M.J. and Hultgren, S.J. (2004) 'Differentiation and developmental pathways of uropathogenic Escherichia coli in urinary tract pathogenesis', Proc Natl Acad Sci U S A, 101(5), pp. 1333-8.
Kader, A., Simm, R., Gerstel, U., Morr, M. and Romling, U. (2006) 'Hierarchical involvement of various GGDEF domain proteins in rdar morphotype development of Salmonella enterica serovar Typhimurium', Mol Microbiol, 60(3), pp. 602-16.
Kaper, J.B., Nataro, J.P. and Mobley, H.L. (2004) 'Pathogenic Escherichia coli', Nat Rev Microbiol, 2(2), pp. 123-40.
Karlinsey, J.E. and Hughes, K.T. (2006) 'Genetic Transplantation: Salmonella enterica Serovar Typhimurium as a Host To Study Sigma Factor and Anti-Sigma Factor Interactions in Genetically Intractable Systems', Journal of Bacteriology, 188(1), pp. 103-114.
Karlinsey, J.E., Lonner, J., Brown, K.L. and Hughes, K.T. (2000) 'Translation/secretion coupling by type III secretion systems', Cell, 102(4), pp. 487-97.
Katayama, E., Shiraishi, T., Oosawa, K., Baba, N. and Aizawa, S. (1996) 'Geometry of the flagellar motor in the cytoplasmic membrane of Salmonella typhimurium as determined by stereo-photogrammetry of quick-freeze deep-etch replica images', J Mol Biol, 255(3), pp. 458-75.
Kenny, B., DeVinney, R., Stein, M., Reinscheid, D.J., Frey, E.A. and Finlay, B.B. (1997) 'Enteropathogenic E. coli (EPEC) transfers its receptor for intimate adherence into mammalian cells', Cell, 91(4), pp. 511-20.
Khan, N.A., Kim, Y., Shin, S. and Kim, K.S. (2007) 'FimH-mediated Escherichia coli K1 invasion of human brain microvascular endothelial cells', Cell Microbiol, 9(1), pp. 169-78.
Kim, K.S. (2008) 'Mechanisms of microbial traversal of the blood-brain barrier', Nat Rev Microbiol, 6(8), pp. 625-34.
Kohler, C.D. and Dobrindt, U. (2011) 'What defines extraintestinal pathogenic Escherichia coli?', Int J Med Microbiol, 301(8), pp. 642-7.
249
Koirala, S., Mears, P., Sim, M., Golding, I., Chemla, Y.R., Aldridge, P.D. and Rao, C.V. (2014) 'A Nutrient-Tunable Bistable Switch Controls Motility in Salmonella enterica Serovar Typhimurium', mBio, 5(5), pp. e01611-14.
Kolenbrander, P.E., Andersen, R.N., Blehert, D.S., Egland, P.G., Foster, J.S. and Palmer, R.J., Jr. (2002) 'Communication among oral bacteria', Microbiol Mol Biol Rev, 66(3), pp. 486-505, table of contents.
Kvint, K., Nachin, L., Diez, A. and Nyström, T. (2003) 'The bacterial universal stress protein: function and regulation', Current Opinion in Microbiology, 6(2), pp. 140-145.
Lahiri, A., Das, P. and Chakravortty, D. (2008) 'Engagement of TLR signaling as adjuvant: towards smarter vaccine and beyond', Vaccine, 26(52), pp. 6777-83.
Lane, M.C., Alteri, C.J., Smith, S.N. and Mobley, H.L. (2007) 'Expression of flagella is coincident with uropathogenic Escherichia coli ascension to the upper urinary tract', Proc Natl Acad Sci U S A, 104(42), pp. 16669-74.
Lane, M.C., Lockatell, V., Monterosso, G., Lamphier, D., Weinert, J., Hebel, J.R., Johnson, D.E. and Mobley, H.L. (2005) 'Role of motility in the colonization of uropathogenic Escherichia coli in the urinary tract', Infect Immun, 73(11), pp. 7644-56.
Le Bouguenec, C. and Servin, A.L. (2006) 'Diffusely adherent Escherichia coli strains expressing Afa/Dr adhesins (Afa/Dr DAEC): hitherto unrecognized pathogens', FEMS Microbiol Lett, 256(2), pp. 185-94.
Ledford, H. (2015) 'CRISPR, the disruptor', Nature, 522(7554), pp. 20-4.
Lehnen, D., Blumer, C., Polen, T., Wackwitz, B., Wendisch, V.F. and Unden, G. (2002) 'LrhA as a new transcriptional key regulator of flagella, motility and chemotaxis genes in Escherichia coli', Mol Microbiol, 45(2), pp. 521-32.
Lehti, T.A., Bauchart, P., Dobrindt, U., Korhonen, T.K. and Westerlund-Wikstrom, B. (2012) 'The fimbriae activator MatA switches off motility in Escherichia coli by repression of the flagellar master operon flhDC', Microbiology, 158(Pt 6), pp. 1444-55.
Leimbach, A., Hacker, J. and Dobrindt, U. (2013) 'E. coli as an all-rounder: the thin line between commensalism and pathogenicity', Curr Top Microbiol Immunol, 358, pp. 3-32.
Lemke, J.J., Durfee, T. and Gourse, R.L. (2009) 'DksA and ppGpp directly regulate transcription of the Escherichia coli flagellar cascade', Mol Microbiol, 74(6), pp. 1368-79.
Liu, X., Fujita, N., Ishihama, A. and Matsumura, P. (1995) 'The C-terminal region of the alpha subunit of Escherichia coli RNA polymerase is required for transcriptional activation of the flagellar level II operons by the FlhD/FlhC complex', J Bacteriol, 177(17), pp. 5186-8.
Liu, X. and Matsumura, P. (1994) 'The FlhD/FlhC complex, a transcriptional activator of the Escherichia coli flagellar class II operons', J Bacteriol, 176(23), pp. 7345-51.
250
Livermore, D.M. and Woodford, N. (2006) 'The beta-lactamase threat in Enterobacteriaceae, Pseudomonas and Acinetobacter', Trends Microbiol, 14(9), pp. 413-20.
Lloyd, S.A., Tang, H., Wang, X., Billings, S. and Blair, D.F. (1996) 'Torque generation in the flagellar motor of Escherichia coli: evidence of a direct role for FliG but not for FliM or FliN', J Bacteriol, 178(1), pp. 223-31.
Lorenz, M.G. and Wackernagel, W. (1994) 'Bacterial gene transfer by natural genetic transformation in the environment', Microbiol Rev, 58(3), pp. 563-602.
Lukjancenko, O., Wassenaar, T.M. and Ussery, D.W. (2010) 'Comparison of 61 sequenced Escherichia coli genomes', Microb Ecol, 60(4), pp. 708-20.
Ma, J., Sun, M., Bao, Y., Pan, Z., Zhang, W., Lu, C. and Yao, H. (2013) 'Genetic diversity and features analysis of type VI secretion systems loci in avian pathogenic Escherichia coli by wide genomic scanning', Infection, Genetics and Evolution, 20, pp. 454-464.
Macnab, R.M. (2003) 'How bacteria assemble flagella', Annu Rev Microbiol, 57, pp. 77-100.
Macnab, R.M. (2004) 'Type III flagellar protein export and flagellar assembly', Biochimica et Biophysica Acta (BBA) - Molecular Cell Research, 1694(1), pp. 207-217.
Mahillon, J. and Chandler, M. (1998) 'Insertion Sequences', Microbiology and Molecular Biology Reviews, 62(3), pp. 725-774.
Maiden, M.C. (2006) 'Multilocus sequence typing of bacteria', Annu Rev Microbiol, 60, pp. 561-88.
Maiden, M.C., Bygraves, J.A., Feil, E., Morelli, G., Russell, J.E., Urwin, R., Zhang, Q., Zhou, J., Zurth, K., Caugant, D.A., Feavers, I.M., Achtman, M. and Spratt, B.G. (1998) 'Multilocus sequence typing: a portable approach to the identification of clones within populations of pathogenic microorganisms', Proc Natl Acad Sci U S A, 95(6), pp. 3140-5.
Marques, S.M. and Esteves da Silva, J.C. (2009) 'Firefly bioluminescence: a mechanistic approach of luciferase catalyzed reactions', IUBMB Life, 61(1), pp. 6-17.
Martinez, J.J. and Hultgren, S.J. (2002) 'Requirement of Rho-family GTPases in the invasion of Type 1-piliated uropathogenic Escherichia coli', Cell Microbiol, 4(1), pp. 19-28.
Mattick, J.S. (2002) 'Type IV Pili and Twitching Motility', Annual Review of Microbiology, 56(1), pp. 289-314.
Maurelli, A.T., Fernández, R.E., Bloch, C.A., Rode, C.K. and Fasano, A. (1998) '“Black holes” and bacterial pathogenicity: A large genomic deletion that enhances the virulence of Shigella spp. and enteroinvasive Escherichia coli', Proceedings of the National Academy of Sciences of the United States of America, 95(7), pp. 3943-3948.
251
McDaniel, T.K., Jarvis, K.G., Donnenberg, M.S. and Kaper, J.B. (1995) 'A genetic locus of enterocyte effacement conserved among diverse enterobacterial pathogens', Proc Natl Acad Sci U S A, 92(5), pp. 1664-8.
McNally, A., Cheng, L., Harris, S.R. and Corander, J. (2013) 'The evolutionary path to extraintestinal pathogenic, drug-resistant Escherichia coli is marked by drastic reduction in detectable recombination within the core genome', Genome Biol Evol, 5(4), pp. 699-710.
Medini, D., Donati, C., Tettelin, H., Masignani, V. and Rappuoli, R. (2005) 'The microbial pan-genome', Curr Opin Genet Dev, 15(6), pp. 589-94.
Meighen, E.A. (1991) 'Molecular biology of bacterial bioluminescence', Microbiol Rev, 55(1), pp. 123-42.
Mercado, E.H., Ochoa, T.J., Ecker, L., Cabello, M., Durand, D., Barletta, F., Molina, M., Gil, A.I., Huicho, L., Lanata, C.F. and Cleary, T.G. (2011) 'Fecal Leukocytes in Children Infected with Diarrheagenic Escherichia coli', Journal of Clinical Microbiology, 49(4), pp. 1376-1381.
Mignot, T. (2007) 'The elusive engine in Myxococcus xanthus gliding motility', Cell Mol Life Sci, 64(21), pp. 2733-45.
Milkman, R. (1973) 'Electrophoretic variation in Escherichia coli from natural sources', Science, 182(4116), pp. 1024-6.
Minamino, T., Chu, R., Yamaguchi, S. and Macnab, R.M. (2000a) 'Role of FliJ in flagellar protein export in Salmonella', J Bacteriol, 182(15), pp. 4207-15.
Minamino, T., Gonzalez-Pedrajo, B., Yamaguchi, K., Aizawa, S.I. and Macnab, R.M. (1999) 'FliK, the protein responsible for flagellar hook length control in Salmonella, is exported during hook assembly', Mol Microbiol, 34(2), pp. 295-304.
Minamino, T., Imada, K. and Namba, K. (2008) 'Mechanisms of type III protein export for bacterial flagellar assembly', Mol Biosyst, 4(11), pp. 1105-15.
Minamino, T. and Macnab, R.M. (1999) 'Components of the Salmonella flagellar export apparatus and classification of export substrates', J Bacteriol, 181(5), pp. 1388-94.
Minamino, T. and Macnab, R.M. (2000) 'FliH, a soluble component of the type III flagellar export apparatus of Salmonella, forms a complex with FliI and inhibits its ATPase activity', Mol Microbiol, 37(6), pp. 1494-503.
Minamino, T., Yamaguchi, S. and Macnab, R.M. (2000b) 'Interaction between FliE and FlgB, a Proximal Rod Component of the Flagellar Basal Body of Salmonella', Journal of Bacteriology, 182(11), pp. 3029-3036.
Molin, S. and Tolker-Nielsen, T. (2003) 'Gene transfer occurs with enhanced efficiency in biofilms and induces enhanced stabilisation of the biofilm structure', Curr Opin Biotechnol, 14(3), pp. 255-61.
Monteiro-Neto, V., Bando, S.Y., Moreira-Filho, C.A. and Giron, J.A. (2003) 'Characterization of an outer membrane protein associated with haemagglutination
252
and adhesive properties of enteroaggregative Escherichia coli O111:H12', Cell Microbiol, 5(8), pp. 533-47.
Morin, N., Tirling, C., Ivison, S.M., Kaur, A.P., Nataro, J.P. and Steiner, T.S. (2010) 'Autoactivation of the AggR regulator of enteroaggregative Escherichia coli in vitro and in vivo', FEMS Immunol Med Microbiol, 58(3), pp. 344-55.
Mounier, J., Popoff, M.R., Enninga, J., Frame, M.C., Sansonetti, P.J. and Van Nhieu, G.T. (2009) 'The IpaC Carboxyterminal Effector Domain Mediates Src-Dependent Actin Polymerization during Shigella Invasion of Epithelial Cells', PLoS Pathogens, 5(1), p. e1000271.
Mulvey, M.A., Schilling, J.D. and Hultgren, S.J. (2001) 'Establishment of a persistent Escherichia coli reservoir during the acute phase of a bladder infection', Infect Immun, 69(7), pp. 4572-9.
Muniyappa, K. and Radding, C.M. (1986) 'The homologous recombination system of phage lambda. Pairing activities of beta protein', J Biol Chem, 261(16), pp. 7472-8.
Murphy, K.C. (1991) 'Lambda Gam protein inhibits the helicase and chi-stimulated recombination activities of Escherichia coli RecBCD enzyme', J Bacteriol, 173(18), pp. 5808-21.
Murphy, K.C. (1998) 'Use of Bacteriophage λ Recombination Functions To Promote Gene Replacement in Escherichia coli', Journal of Bacteriology, 180(8), pp. 2063-2071.
Nachin, L., Nannmark, U. and Nystrom, T. (2005) 'Differential roles of the universal stress proteins of Escherichia coli in oxidative stress resistance, adhesion, and motility', J Bacteriol, 187(18), pp. 6265-72.
Nambu, T. and Kutsukake, K. (2000) 'The Salmonella FlgA protein, a putativeve periplasmic chaperone essential for flagellar P ring formation', Microbiology, 146 ( Pt 5), pp. 1171-8.
Nan, B. and Zusman, D.R. (2016) 'Novel mechanisms power bacterial gliding motility', Molecular microbiology, 101(2), pp. 186-193.
Nataro, J.P. and Kaper, J.B. (1998) 'Diarrheagenic Escherichia coli', Clin Microbiol Rev, 11(1), pp. 142-201.
Navarro-Garcia, F. and Elias, W.P. (2011) 'Autotransporters and virulence of enteroaggregative E. coli', Gut Microbes, 2(1), pp. 13-24.
Neely, M.N. and Friedman, D.I. (1998) 'Functional and genetic analysis of regulatory regions of coliphage H-19B: location of shiga-like toxin and lysis genes suggest a role for phage functions in toxin release', Mol Microbiol, 28(6), pp. 1255-67.
Neuwald, A.F., Aravind, L., Spouge, J.L. and Koonin, E.V. (1999) 'AAA+: A class of chaperone-like ATPases associated with the assembly, operation, and disassembly of protein complexes', Genome Res, 9(1), pp. 27-43.
Noguchi, T. and Golden, S. (2017) Bioluminescent and fluorescent reporters in circadian rhythm studies.
253
Notley-McRobb, L., Death, A. and Ferenci, T. (1997) 'The relationship between external glucose concentration and cAMP levels inside Escherichia coli: implications for models of phosphotransferase-mediated regulation of adenylate cyclase', Microbiology, 143(6), pp. 1909-1918.
Nowicki, B., Selvarangan, R. and Nowicki, S. (2001) 'Family of Escherichia coli Dr adhesins: decay-accelerating factor receptor recognition and invasiveness', J Infect Dis, 183 Suppl 1, pp. S24-7.
O'Hanley, P., Lalonde, G. and Ji, G. (1991) 'Alpha-hemolysin contributes to the pathogenicity of piliated digalactoside-binding Escherichia coli in the kidney: efficacy of an alpha-hemolysin vaccine in preventing renal injury in the BALB/c mouse model of pyelonephritis', Infection and Immunity, 59(3), pp. 1153-1161.
O'Hanley, P., Lark, D., Falkow, S. and Schoolnik, G. (1985) 'Molecular basis of Escherichia coli colonization of the upper urinary tract in BALB/c mice. Gal-Gal pili immunization prevents Escherichia coli pyelonephritis in the BALB/c mouse model of human pyelonephritis', J Clin Invest, 75(2), pp. 347-60.
Ochman, H., Lawrence, J.G. and Groisman, E.A. (2000) 'Lateral gene transfer and the nature of bacterial innovation', Nature, 405(6784), pp. 299-304.
Ochman, H. and Selander, R.K. (1984) 'Standard reference strains of Escherichia coli from natural populations', Journal of Bacteriology, 157(2), pp. 690-693.
Ohnishi, K., Kutsukake, K., Suzuki, H. and Lino, T. (1992) 'A novel transcriptional regulation mechanism in the flagellar regulon of Salmonella typhimurium: an antisigma factor inhibits the activity of the flagellum-specific sigma factor, sigma F', Mol Microbiol, 6(21), pp. 3149-57.
Ohnishi, K., Ohto, Y., Aizawa, S., Macnab, R.M. and Iino, T. (1994) 'FlgD is a scaffolding protein needed for flagellar hook assembly in Salmonella typhimurium', J Bacteriol, 176(8), pp. 2272-81.
Orskov, I., Orskov, F., Jann, B. and Jann, K. (1977) 'Serology, chemistry, and genetics of O and K antigens of Escherichia coli', Bacteriological Reviews, 41(3), pp. 667-710.
Paget, M.S.B. and Helmann, J.D. (2003) 'The σ(70) family of sigma factors', Genome Biology, 4(1), pp. 203-203.
Pallen, M.J. and Matzke, N.J. (2006) 'From The Origin of Species to the origin of bacterial flagella', Nature Reviews Microbiology, 4, p. 784.
Park, S.Y., Lowder, B., Bilwes, A.M., Blair, D.F. and Crane, B.R. (2006) 'Structure of FliM provides insight into assembly of the switch complex in the bacterial flagella motor', Proc Natl Acad Sci U S A, 103(32), pp. 11886-91.
Peirano, G. and Pitout, J.D. (2010) 'Molecular epidemiology of Escherichia coli producing CTX-M beta-lactamases: the worldwide emergence of clone ST131 O25:H4', Int J Antimicrob Agents, 35(4), pp. 316-21.
Klink, S., Boutin, A., Shao, Y., Miller, L., Grotbeck, E.J., Davis, N.W., Lim, A., Dimalanta, E.T., Potamousis, K.D., Apodaca, J., Anantharaman, T.S., Lin, J., Yen, G., Schwartz, D.C., Welch, R.A. and Blattner, F.R. (2001) 'Genome sequence of enterohaemorrhagic Escherichia coli O157:H7', Nature, 409(6819), pp. 529-33.
Pesavento, C., Becker, G., Sommerfeldt, N., Possling, A., Tschowri, N., Mehlis, A. and Hengge, R. (2008) 'Inverse regulatory coordination of motility and curli-mediated adhesion in Escherichia coli', Genes Dev, 22(17), pp. 2434-46.
Pesavento, C. and Hengge, R. (2012) 'The global repressor FliZ antagonizes gene expression by sigmaS-containing RNA polymerase due to overlapping DNA binding specificity', Nucleic Acids Res, 40(11), pp. 4783-93.
Phue, J.N., Lee, S.J., Trinh, L. and Shiloach, J. (2008) 'Modified Escherichia coli B (BL21), a superior producer of plasmid DNA compared with Escherichia coli K (DH5alpha)', Biotechnol Bioeng, 101(4), pp. 831-6.
Plague, G.R., Boodram, K.S., Dougherty, K.M., Bregg, S., Gilbert, D.P., Bakshi, H. and Costa, D. (2017) 'Transposable Elements Mediate Adaptive Debilitation of Flagella in Experimental Escherichia coli Populations', J Mol Evol, 84(5-6), pp. 279-284.
Poggio, T.V., La Torre, J.L. and Scodeller, E.A. (2006) 'Intranasal immunization with a recombinant truncated FimH adhesin adjuvanted with CpG oligodeoxynucleotides protects mice against uropathogenic Escherichia coli challenge', Can J Microbiol, 52(11), pp. 1093-102.
Prüss, B.M. and Matsumura, P. (1996) 'A regulator of the flagellar regulon of Escherichia coli, flhD, also affects cell division', Journal of Bacteriology, 178(3), pp. 668-674.
Qadri, F., Svennerholm, A.M., Faruque, A.S. and Sack, R.B. (2005) 'Enterotoxigenic Escherichia coli in developing countries: epidemiology, microbiology, clinical features, treatment, and prevention', Clin Microbiol Rev, 18(3), pp. 465-83.
Reid, S.D., Herbelin, C.J., Bumbaugh, A.C., Selander, R.K. and Whittam, T.S. (2000) 'Parallel evolution of virulence in pathogenic Escherichia coli', Nature, 406(6791), pp. 64-7.
Ren, C.P., Chaudhuri, R.R., Fivian, A., Bailey, C.M., Antonio, M., Barnes, W.M. and Pallen, M.J. (2004) 'The ETT2 gene cluster, encoding a second type III secretion system from Escherichia coli, is present in the majority of strains but has undergone widespread mutational attrition', J Bacteriol, 186(11), pp. 3547-60.
Riley, L.W., Remis, R.S., Helgerson, S.D., McGee, H.B., Wells, J.G., Davis, B.R., Hebert, R.J., Olcott, E.S., Johnson, L.M., Hargrett, N.T., Blake, P.A. and Cohen, M.L. (1983) 'Hemorrhagic colitis associated with a rare Escherichia coli serotype', N Engl J Med, 308(12), pp. 681-5.
Rogers, T.J., Thorpe, C.M., Paton, A.W. and Paton, J.C. (2012) 'Role of lipid rafts and flagellin in invasion of colonic epithelial cells by Shiga-toxigenic Escherichia coli O113:H21', Infect Immun, 80(8), pp. 2858-67.
255
Rojas-Lopez, M., Monterio, R., Pizza, M., Desvaux, M. and Rosini, R. (2018) 'Intestinal Pathogenic Escherichia coli: Insights for Vaccine Development', Frontiers in Microbiology, 9, p. 440.
Rolhion, N., Barnich, N., Bringer, M.A., Glasser, A.L., Ranc, J., Hebuterne, X., Hofman, P. and Darfeuille-Michaud, A. (2010) 'Abnormally expressed ER stress response chaperone Gp96 in CD favours adherent-invasive Escherichia coli invasion', Gut, 59(10), pp. 1355-62.
Roy, K., Hilliard, G.M., Hamilton, D.J., Luo, J., Ostmann, M.M. and Fleckenstein, J.M. (2009) 'Enterotoxigenic Escherichia coli EtpA mediates adhesion between flagella and host cells', Nature, 457(7229), pp. 594-8.
Roy, K., Kansal, R., Bartels, S.R., Hamilton, D.J., Shaaban, S. and Fleckenstein, J.M. (2011) 'Adhesin degradation accelerates delivery of heat-labile toxin by enterotoxigenic Escherichia coli', J Biol Chem, 286(34), pp. 29771-9.
Ruchaud-Sparagano, M.H., Muhlen, S., Dean, P. and Kenny, B. (2011) 'The enteropathogenic E. coli (EPEC) Tir effector inhibits NF-kappaB activity by targeting TNFalpha receptor-associated factors', PLoS Pathog, 7(12), p. e1002414.
Sahl, J.W., Matalka, M.N. and Rasko, D.A. (2012) 'Phylomark, a tool to identify conserved phylogenetic markers from whole-genome alignments', Appl Environ Microbiol, 78(14), pp. 4884-92.
Saini, S., Brown, J.D., Aldridge, P.D. and Rao, C.V. (2008) 'FliZ Is a posttranslational activator of FlhD4C2-dependent flagellar gene expression', J Bacteriol, 190(14), pp. 4979-88.
Saini, S., Slauch, J.M., Aldridge, P.D. and Rao, C.V. (2010) 'Role of cross talk in regulating the dynamic expression of the flagellar Salmonella pathogenicity island 1 and type 1 fimbrial genes', J Bacteriol, 192(21), pp. 5767-77.
Saitou, N. and Nei, M. (1987) 'The neighbor-joining method: a new method for reconstructing phylogenetic trees', Molecular Biology and Evolution, 4(4), pp. 406-425.
Salinger, N., Kokona, B., Fairman, R. and Okeke, I.N. (2009) 'The plasmid-encoded regulator activates factors conferring lysozyme resistance on enteropathogenic Escherichia coli strains', Appl Environ Microbiol, 75(1), pp. 275-80.
Sambrook, J., Fritsch, E.F. and Maniatis, T. (1989) Molecular cloning: A laboratory manual. 2nd edn. USA: Cold Spring Harbor Laboratory Press.
Satoh, H., Yamakawa, T., Kindaichi, T., Ito, T. and Okabe, S. (2006) 'Community structures and activities of nitrifying and denitrifying bacteria in industrial wastewater-treating biofilms', Biotechnol Bioeng, 94(4), pp. 762-72.
Sauer, R.T., Bolon, D.N., Burton, B.M., Burton, R.E., Flynn, J.M., Grant, R.A., Hersch, G.L., Joshi, S.A., Kenniston, J.A., Levchenko, I., Neher, S.B., Oakes, E.S.C., Siddiqui, S.M., Wah, D.A. and Baker, T.A. (2004) 'Sculpting the Proteome with AAA+ Proteases and Disassembly Machines', Cell, 119(1), pp. 9-18.
256
Schroeder, G.N. and Hilbi, H. (2008) 'Molecular pathogenesis of Shigella spp.: controlling host cell signaling, invasion, and death by type III secretion', Clin Microbiol Rev, 21(1), pp. 134-56.
Selander, R.K., Caugant, D.A. and Whittam, T.S. (1987) 'Genetic structure and variation in natural populations of Escherichia coli. Escherichia coli and Salmonella typhimurium', Cell. Mol. Biol, 2, pp. 1625-1648.
Selander, R.K. and Levin, B.R. (1980) 'Genetic diversity and structure in Escherichia coli populations', Science, 210(4469), pp. 545-7.
Selvarangan, R., Goluszko, P., Singhal, J., Carnoy, C., Moseley, S., Hudson, B., Nowicki, S. and Nowicki, B. (2004) 'Interaction of Dr Adhesin with Collagen Type IV Is a Critical Step in Escherichia coli Renal Persistence', Infection and Immunity, 72(8), pp. 4827-4835.
Serra, D.O., Richter, A.M. and Hengge, R. (2013a) 'Cellulose as an architectural element in spatially structured Escherichia coli biofilms', J Bacteriol, 195(24), pp. 5540-54.
Serra, D.O., Richter, A.M., Klauck, G., Mika, F. and Hengge, R. (2013b) 'Microanatomy at cellular resolution and spatial order of physiological differentiation in a bacterial biofilm', MBio, 4(2), pp. e00103-13.
Servin, A.L. (2005) 'Pathogenesis of Afa/Dr Diffusely Adhering Escherichia coli', Clinical Microbiology Reviews, 18(2), pp. 264-292.
Shaner, N.C., Patterson, G.H. and Davidson, M.W. (2007) 'Advances in fluorescent protein technology', Journal of Cell Science, 120(24), pp. 4247-4260.
Shi, W., Zhou, Y., Wild, J., Adler, J. and Gross, C.A. (1992) 'DnaK, DnaJ, and GrpE are required for flagellum synthesis in Escherichia coli', J Bacteriol, 174(19), pp. 6256-63.
Shimada, T., Fujita, N., Yamamoto, K. and Ishihama, A. (2011) 'Novel roles of cAMP receptor protein (CRP) in regulation of transport and metabolism of carbon sources', PLoS One, 6(6), p. e20081.
Shimomura, O., Johnson, F.H. and Saiga, Y. (1962) 'Extraction, purification and properties of aequorin, a bioluminescent protein from the luminous hydromedusan, Aequorea', J Cell Comp Physiol, 59, pp. 223-39.
Shin, S. and Park, C. (1995) 'Modulation of flagellar expression in Escherichia coli by acetyl phosphate and the osmoregulator OmpR', J Bacteriol, 177(16), pp. 4696-702.
Siguier, P., Filee, J. and Chandler, M. (2006) 'Insertion sequences in prokaryotic genomes', Curr Opin Microbiol, 9(5), pp. 526-31.
Siguier, P., Gourbeyre, E. and Chandler, M. (2014) 'Bacterial insertion sequences: their genomic impact and diversity', FEMS Microbiol Rev, 38(5), pp. 865-91.
Sim, M., Koirala, S., Picton, D., Strahl, H., Hoskisson, P.A., Rao, C.V., Gillespie, C.S. and Aldridge, P.D. (2017) 'Growth rate control of flagellar assembly in Escherichia coli strain RP437', Scientific Reports, 7, p. 41189.
257
Simm, R., Lusch, A., Kader, A., Andersson, M. and Romling, U. (2007) 'Role of EAL-containing proteins in multicellular behavior of Salmonella enterica serovar Typhimurium', J Bacteriol, 189(9), pp. 3613-23.
Singer, H.M., Kühne, C., Deditius, J.A., Hughes, K.T. and Erhardt, M. (2014) 'The Salmonella Spi1 Virulence Regulatory Protein HilD Directly Activates Transcription of the Flagellar Master Operon flhDC', Journal of Bacteriology, 196(7), pp. 1448-1457.
Sivick, K.E. and Mobley, H.L. (2010) 'Waging war against uropathogenic Escherichia coli: winning back the urinary tract', Infect Immun, 78(2), pp. 568-85.
Skerker, J.M. and Berg, H.C. (2001) 'Direct observation of extension and retraction of type IV pili', Proceedings of the National Academy of Sciences, 98(12), pp. 6901-6904.
Skoudy, A., Mounier, J., Aruffo, A., Ohayon, H., Gounon, P., Sansonetti, P. and Tran Van Nhieu, G. (2000) 'CD44 binds to the Shigella IpaB protein and participates in bacterial invasion of epithelial cells', Cell Microbiol, 2(1), pp. 19-33.
Smajs, D., Micenkova, L., Smarda, J., Vrba, M., Sevcikova, A., Valisova, Z. and Woznicova, V. (2010) 'Bacteriocin synthesis in uropathogenic and commensal Escherichia coli: colicin E1 is a potential virulence factor', BMC Microbiol, 10, p. 288.
Smith, N.H. and Selander, R.K. (1991) 'Molecular genetic basis for complex flagellar antigen expression in a triphasic serovar of Salmonella', Proceedings of the National Academy of Sciences, 88(3), pp. 956-960.
Sommerfeldt, N., Possling, A., Becker, G., Pesavento, C., Tschowri, N. and Hengge, R. (2009) 'Gene expression patterns and differential input into curli fimbriae regulation of all GGDEF/EAL domain proteins in Escherichia coli', Microbiology, 155(Pt 4), pp. 1318-31.
Song, J., Bishop, B.L., Li, G., Grady, R., Stapleton, A. and Abraham, S.N. (2009) 'TLR4-mediated expulsion of bacteria from infected bladder epithelial cells', Proc Natl Acad Sci U S A, 106(35), pp. 14966-71.
Sousa, A., Bourgard, C., Wahl, L.M. and Gordo, I. (2013) 'Rates of transposition in Escherichia coli', Biology Letters, 9(6), p. 20130838.
Soutourina, O., Kolb, A., Krin, E., Laurent-Winter, C., Rimsky, S., Danchin, A. and Bertin, P. (1999) 'Multiple control of flagellum biosynthesis in Escherichia coli: role of H-NS protein and the cyclic AMP-catabolite activator protein complex in transcription of the flhDC master operon', J Bacteriol, 181(24), pp. 7500-8.
Soutourina, O.A. and Bertin, P.N. (2003) 'Regulation cascade of flagellar expression in Gram-negative bacteria', FEMS Microbiology Reviews, 27(4), pp. 505-523.
Soutourina, O.A., Krin, E., Laurent-Winter, C., Hommais, F., Danchin, A. and Bertin, P.N. (2002) 'Regulation of bacterial motility in response to low pH in Escherichia coli: the role of H-NS protein', Microbiology, 148(Pt 5), pp. 1543-51.
Sperandio, V., Torres, A.G. and Kaper, J.B. (2002) 'Quorum sensing Escherichia coli regulators B and C (QseBC): a novel two-component regulatory system involved in
258
the regulation of flagella and motility by quorum sensing in E. coli', Mol Microbiol, 43(3), pp. 809-21.
Stafford, G.P., Ogi, T. and Hughes, C. (2005) 'Binding and transcriptional activation of non-flagellar genes by the Escherichia coli flagellar master regulator FlhD(2)C(2)', Microbiology (Reading, England), 151(Pt 6), pp. 1779-1788.
Stanley, T. and Wilson, I.G. (2001) 'Multilocus Enzyme Electrophoresis', in Spencer, J.F.T. and de Ragout Spencer, A.L. (eds.) Food Microbiology Protocols. Totowa, NJ: Humana Press, pp. 369-393.
Stewart, P.S. and Costerton, J.W. (2001) 'Antibiotic resistance of bacteria in biofilms', Lancet, 358(9276), pp. 135-8.
Takaya, A., Erhardt, M., Karata, K., Winterberg, K., Yamamoto, T. and Hughes, K.T. (2012) 'YdiV: a dual function protein that targets FlhDC for ClpXP-dependent degradation by promoting release of DNA-bound FlhDC complex', Mol Microbiol, 83(6), pp. 1268-84.
Tang, Y., Guest, J.R., Artymiuk, P.J., Read, R.C. and Green, J. (2004) 'Post-transcriptional regulation of bacterial motility by aconitase proteins', Molecular Microbiology, 51(6), pp. 1817-1826.
Tenaillon, O., Skurnik, D., Picard, B. and Denamur, E. (2010) 'The population genetics of commensal Escherichia coli', Nat Rev Microbiol, 8(3), pp. 207-17.
Tomoyasu, T., Ohkishi, T., Ukyo, Y., Tokumitsu, A., Takaya, A., Suzuki, M., Sekiya, K., Matsui, H., Kutsukake, K. and Yamamoto, T. (2002) 'The ClpXP ATP-Dependent Protease Regulates Flagellum Synthesis in Salmonella enterica Serovar Typhimurium', Journal of Bacteriology, 184(3), pp. 645-653.
Tomoyasu, T., Takaya, A., Isogai, E. and Yamamoto, T. (2003) 'Turnover of FlhD and FlhC, master regulator proteins for Salmonella flagellum biogenesis, by the ATP-dependent ClpXP protease', Mol Microbiol, 48(2), pp. 443-52.
Trepeta, R.W. and Edberg, S.C. (1984) 'Methylumbelliferyl-beta-D-glucuronide-based medium for rapid isolation and identification of Escherichia coli', J Clin Microbiol, 19(2), pp. 172-4.
Tsilibaris, V., Maenhaut-Michel, G. and Van Melderen, L. (2006) 'Biological roles of the Lon ATP-dependent protease', Res Microbiol, 157(8), pp. 701-13.
Turner, S.M., Chaudhuri, R.R., Jiang, Z.D., DuPont, H., Gyles, C., Penn, C.W., Pallen, M.J. and Henderson, I.R. (2006a) 'Phylogenetic comparisons reveal multiple acquisitions of the toxin genes by enterotoxigenic Escherichia coli strains of different evolutionary lineages', J Clin Microbiol, 44(12), pp. 4528-36.
Turner, S.M., Scott-Tucker, A., Cooper, L.M. and Henderson, I.R. (2006b) 'Weapons of mass destruction: virulence factors of the global killer enterotoxigenic Escherichia coli', FEMS Microbiol Lett, 263(1), pp. 10-20.
Uehling, D.T. and Wolf, L. (1969) 'Enhancement of the bladder defense mechanism by immunization', Invest Urol, 6(5), pp. 520-6.
259
Valiadi, M. and Iglesias-Rodriguez, D. (2013) 'Understanding Bioluminescence in Dinoflagellates—How Far Have We Come?', Microorganisms, 1(1), pp. 3-25.
Waidmann, M.S., Bleichrodt, F.S., Laslo, T. and Riedel, C.U. (2011) 'Bacterial luciferase reporters: The Swiss army knife of molecular biology', Bioengineered Bugs, 2(1), pp. 8-16.
Wang, S., Fleming, R.T., Westbrook, E.M., Matsumura, P. and McKay, D.B. (2006) 'Structure of the Escherichia coli FlhDC complex, a prokaryotic heteromeric regulator of transcription', J Mol Biol, 355(4), pp. 798-808.
Wang, X., Dubey, A.K., Suzuki, K., Baker, C.S., Babitzke, P. and Romeo, T. (2005) 'CsrA post-transcriptionally represses pgaABCD, responsible for synthesis of a biofilm polysaccharide adhesin of Escherichia coli', Mol Microbiol, 56(6), pp. 1648-63.
Watarai M, Funato S and Sasakawa C (1996) 'Interaction of Ipa proteins of Shigella flexneri with alpha5beta1 integrin promotes entry of the bacteria into mammalian cells', J Exp Med, 183(3), pp. 991-9.
Wei, B.L., Brun-Zinkernagel, A.M., Simecka, J.W., Pruss, B.M., Babitzke, P. and Romeo, T. (2001) 'Positive regulation of motility and flhDC expression by the RNA-binding protein CsrA of Escherichia coli', Mol Microbiol, 40(1), pp. 245-56.
Weichart, D., Querfurth, N., Dreger, M. and Hengge-Aronis, R. (2003) 'Global Role for ClpP-Containing Proteases in Stationary-Phase Adaptation of Escherichia coli', Journal of Bacteriology, 185(1), pp. 115-125.
Welch, R.A., Burland, V., Plunkett, G., 3rd, Redford, P., Roesch, P., Rasko, D., Buckles, E.L., Liou, S.R., Boutin, A., Hackett, J., Stroud, D., Mayhew, G.F., Rose, D.J., Zhou, S., Schwartz, D.C., Perna, N.T., Mobley, H.L., Donnenberg, M.S. and Blattner, F.R. (2002) 'Extensive mosaic structure revealed by the complete genome sequence of uropathogenic Escherichia coli', Proc Natl Acad Sci U S A, 99(26), pp. 17020-4.
Wickner, S., Maurizi, M.R. and Gottesman, S. (1999) 'Posttranslational quality control: folding, refolding, and degrading proteins', Science, 286(5446), pp. 1888-93.
Wiedenbeck, J. and Cohan, F.M. (2011) 'Origins of bacterial diversity through horizontal genetic transfer and adaptation to new ecological niches', FEMS Microbiol Rev, 35(5), pp. 957-76.
Winson, M.K., Swift, S., Fish, L., Throup, J.P., Jorgensen, F., Chhabra, S.R., Bycroft, B.W., Williams, P. and Stewart, G.S. (1998a) 'Construction and analysis of luxCDABE-based plasmid sensors for investigating N-acyl homoserine lactone-mediated quorum sensing', FEMS Microbiol Lett, 163(2), pp. 185-92.
Winson, M.K., Swift, S., Hill, P.J., Sims, C.M., Griesmayr, G., Bycroft, B.W., Williams, P. and Stewart, G.S.A.B. (1998b) 'Engineering the luxCDABE genes from Photorhabdus luminescens to provide a bioluminescent reporter for constitutive and promoter probe plasmids and mini-Tn5 constructs', FEMS Microbiology Letters, 163(2), pp. 193-202.
260
Wirth, T., Falush, D., Lan, R., Colles, F., Mensa, P., Wieler, L.H., Karch, H., Reeves, P.R., Maiden, M.C., Ochman, H. and Achtman, M. (2006) 'Sex and virulence in Escherichia coli: an evolutionary perspective', Mol Microbiol, 60(5), pp. 1136-51.
Wolfe, A.J. and Visick, K.L. (2008) 'Get the Message Out: Cyclic-Di-GMP Regulates Multiple Levels of Flagellum-Based Motility', Journal of Bacteriology, 190(2), pp. 463-475.
Wooster, D.G., Maruvada, R., Blom, A.M. and Prasadarao, N.V. (2006) 'Logarithmic phase Escherichia coli K1 efficiently avoids serum killing by promoting C4bp-mediated C3b and C4b degradation', Immunology, 117(4), pp. 482-493.
Wright, K.J. and Hultgren, S.J. (2006) 'Sticky fibers and uropathogenesis: bacterial adhesins in the urinary tract', Future Microbiol, 1(1), pp. 75-87.
Wright, K.J., Seed, P.C. and Hultgren, S.J. (2005) 'Uropathogenic Escherichia coli flagella aid in efficient urinary tract colonization', Infect Immun, 73(11), pp. 7657-68.
Wurpel, D.J., Beatson, S.A., Totsika, M., Petty, N.K. and Schembri, M.A. (2013) 'Chaperone-usher fimbriae of Escherichia coli', PLoS One, 8(1), p. e52835.
Xicohtencatl-Cortes, J., Monteiro-Neto, V., Saldaña, Z., Ledesma, M.A., Puente, J.L. and Girón, J.A. (2009) 'The Type 4 Pili of Enterohemorrhagic Escherichia coli O157:H7 Are Multipurpose Structures with Pathogenic Attributes', Journal of Bacteriology, 191(1), pp. 411-421.
Yakhnin, A.V., Baker, C.S., Vakulskas, C.A., Yakhnin, H., Berezin, I., Romeo, T. and Babitzke, P. (2013) 'CsrA activates flhDC expression by protecting flhDC mRNA from RNase E-mediated cleavage', Molecular microbiology, 87(4), pp. 851-866.
Yanagihara, S., Iyoda, S., Ohnishi, K., Iino, T. and Kutsukake, K. (1999) 'Structure and transcriptional control of the flagellar master operon of Salmonella typhimurium', Genes Genet Syst, 74(3), pp. 105-11.
Yaron, S. and Romling, U. (2014) 'Biofilm formation by enteric pathogens and its role in plant colonization and persistence', Microb Biotechnol, 7(6), pp. 496-516.
Yokoseki, T., Iino, T. and Kutsukake, K. (1996) 'Negative regulation by fliD, fliS, and fliT of the export of the flagellum-specific anti-sigma factor, FlgM, in Salmonella typhimurium', Journal of Bacteriology, 178(3), pp. 899-901.
Yonekura, K., Maki-Yonekura, S. and Namba, K. (2003) 'Complete atomic model of the bacterial flagellar filament by electron cryomicroscopy', Nature, 424, p. 643.
Yonekura, K., Maki, S., Morgan, D.G., DeRosier, D.J., Vonderviszt, F., Imada, K. and Namba, K. (2000) 'The bacterial flagellar cap as the rotary promoter of flagellin self-assembly', Science, 290(5499), pp. 2148-52.
Zhang, Z., Kukita, C., Humayun, M.Z. and Saier, M.H. (2017) 'Environment-directed activation of the Escherichia coli flhDC operon by transposons', Microbiology, 163(4), pp. 554-569.