22


Senate Enquiry Submission
19 March 2007

Hi Fert Pty Ltd Page 2 ABN 76 008 038 962
Contents
INTRODUCTION........................................................................................................ 3
FERTILISER SUPPLY CHAIN................................................................................... 4
KEY FEATURES OF WORLD FERTILISER EXPORTS – MAJOR PRODUCTS ... 12
KEY FEATURES OF THE AUSTRALIAN FERTILISER MARKET ......................... 13
HI FERT BACKGROUND ........................................................................................ 14
TOTAL AUSTRALIAN MARKET VOLUME ............................................................ 15
HI FERT AUSTRALIAN MARKET SHARE ............................................................. 16
WORLD FERTILISER PRICES ............................................................................... 17
WORLD FREIGHT COSTS 2005-2007.................................................................... 19
HI FERT AVAILABLE STOCK POSITION .............................................................. 20
CONCLUDING COMMENTARY.............................................................................. 21

Hi Fert Pty Ltd Page 3 ABN 76 008 038 962
INTRODUCTION Hi Fert’s submission contains information about the fertiliser supply chain with a particular focus on Hi Fert’s position within the Australian market. In summary, Hi Fert is a distributor / wholesaler with no production assets, no manufacturing assets and no raw material assets. Hi Fert buys raw materials on the international market from a number of supply sources. These sources are currently operating in a global environment of unprecedented demand. This demand is likely to continue to increase and outstrip supply for a number of years to come. For background on trends in the global industry, we recommend that the committee refer to a recent report by Rabobank, entitled “Fertiliser – a precious commodity”. This report provides a very good overview of the worldwide market for fertiliser. Summary • Hi Fert is a leading distributor of fertiliser in the Australian market.
o We do not own production facilities. o We do not own manufacturing facilities. o We do not own raw material facilities.
o We operate 9 major distribution centres where we store, blend, bag and despatch
product to retailers and not directly to farmers. • The market in which we operate has prices which are driven by world markets. • Prices since the beginning of 2007 have increased rapidly because of global market
demand and a shortage of supply. • Global suppliers are highly aggregated.

Hi Fert Pty Ltd Page 4 ABN 76 008 038 962
FERTILISER SUPPLY CHAIN • The fertiliser supply chain is illustrated in Slide 1 below. The supply chain essentially
comprises:
o Producers/Manufacturers o Distributors/Wholesalers o Retailers o End customer (Farmers)
• Producers of fertiliser manufacture the finished commercial products from the raw material
inputs.
o The major raw materials for fertiliser manufacture are hydrocarbon sources (mainly natural gas), sulphur, phosphate rock, potassium salts, micro-nutrients, water and air.
o The majority of producers are overseas based, namely in the US, Middle East,
China, Asia, North Africa and Europe.
o There is domestic production / manufacturing in Queensland (Southern Cross International, owned by Incitec Pivot Limited), Tasmania (Impact) and Western Australia (CSBP owned by Wesfarmers). SCI/IPL and CSBP own some or all of the required raw material components for a number of products.
• Distributors/wholesalers of fertiliser buy the finished commercial products from the
producers/manufacturers and on-sell this to the retailers.
o Distributors/wholesalers in the east of Australia buy the finished products from SCI, Impact or CSBP or from overseas.
• The Australian market also has integrated producers/distributors – these are aligned with or
have ownership of domestic production facilities for some finished commercial products.
o These are: SCI/IPL, Impact Fertilisers and CSBP.

Hi Fert Pty Ltd Page 5 ABN 76 008 038 962
Producers / Manufacturers The list below is not meant to be an exhaustive list of global suppliers. It has been put together showing those suppliers that Hi Fert believes are key to the Australian market. SCI (Southern Cross International)
• SCI is the only producer of Ammonium Phosphate Fertilisers in Australia, producing almost one million tonnes per annum.
• SCI is wholly owned by Incitec Pivot Limited.
OCP
• The national Moroccan phosphates company - is a state-owned company established in 1920.
• It is the world's biggest exporter of phosphates and derivatives.
• The company is responsible for the production and the selling of the whole Moroccan
phosphorite resources. Wengfu
• Chinese supplier of phosphate fertilizer and phosphate chemicals for world markets. • Annual production capacity of AP (Ammonium Phosphate) 1.68 million tonnes.
Producer FOB Buying Freight Load Discharge Store Distribute Retail Farmer
PRODUCERS/ MANUFACTURERS Mosaic Agrium
PCS
RETAILERS Landmark Elders
RuralCo GrainCorp
Independents
DISTRIBUTORS/ WHOLESALERS
Hi Fert Summit CSBP1
IncitecPivot1 ABB
Impact1
Note 1. Also aligned with or have ownership of domestic produ ction facilities
Wengfu
Slide 1 Fertiliser Supply Chain
Middle East
OCP
Megafert
Others
ABB Others
Impact
CSBP
Others
SCI
Hi Fert Pty Ltd Page 6 ABN 76 008 038 962
• Part owned by Chinese Government.
Middle East Producers
• The major suppliers are: Sabic (Saudi Arabia), Qafco (Qatar) and PIC (Kuwait/Bahrain). • All are in some form owned by the governments of the Middle East.
PCS
• An integrated producer of fertiliser, industrial and animal feed products. • The world’s largest fertiliser enterprise by capacity, producing the three primary plant
nutrients – potash, nitrogen and phosphate.
• Listed company. Mosaic
• Producer of potash and phosphate crop nutrients. • Involved in mining, manufacturing, marketing and distributing fertiliser around the world.
• Owned by Cargill.
Agrium
• Global producer and distributor of agricultural crop nutrients: nitrogen, phosphate, and potash fertilizers, and other agricultural products and services.
• Has 14 production facilities in North America and Argentina, with capacity to produce,
market and distribute close to 10m tonnes of fertilizer products annually. This includes about 6.1 million tonnes of nitrogen, 2.1 million tonnes of potash and 1.3 million tonnes of phosphate.
• Listed company.
CANPOTEX
• Potash export organisation operating since 1972. • International marketing and distribution company wholly owned by: Agrium Inc., Mosaic
and Potash Corporation of Saskatchewan Inc (PCS).
• Canpotex markets potash principally to countries in Asia, Latin America, and Oceania.

Hi Fert Pty Ltd Page 7 ABN 76 008 038 962
Distributors / Wholesalers IPL (Incitec Pivot Limited)
• Manufacturer and supplier of fertiliser to retailers in Australia's eastern and southern states.
• Owner of Southern Cross International (SCI), which supplies phosphates to local
distributors and is a major exporter internationally.
• Only producer of phosphates in Australia at Mt Isa.
• Has significant Urea production in Brisbane
• Manufactures Nitrogen Gas and Liquid Urea.
• Close to 60% market share of East Australian distribution – source IPL annual report. Hi Fert
• Supplier of fertiliser to retailers in Australia's eastern and southern states. • JV company between Elders and Landmark.
• Has no production or manufacturing assets.
• Does not compete in a significant way in the major pasture market product – SSP.
ABB Fertiliser
• Supplier of fertiliser to farmers in Australia's southern states. • Part of ABB Grain which is an agribusiness with rural services which include fertiliser
and agchem supply, financial services and insurance and wool and livestock activities. CSBP
• Manufacturer and supplier of chemicals and fertilisers to the mining, industrial and agricultural sectors.
• SSP and Prilled Urea Manufacturer in Kwinana. • CSBP Limited is part of the Wesfarmers Limited group. • Operates mainly on the west coast but does supply some manufactured products such
as SSP to east coast distributors.

Hi Fert Pty Ltd Page 8 ABN 76 008 038 962
Impact (Tasmania) and Impact Australia (J/V)
• Impact Australia is a supplier on the eastern seaboard of Australia mainly to independent dealers with a range of high analysis fertilisers as well as single superphosphate (SSP).
• Impact Australia is a joint venture between Impact Fertilisers Pty. Ltd. Tasmania and
Ameropa AG, a private company with fertiliser activities spanning the globe based in Switzerland.
• Impact is a producer of SSP (based in Tasmania) and distributor of other products within
Tasmania. Impact also supplies Impact Australia with SSP and other products. Megafert
• Supplier of fertiliser to farmers in West Australia, South Australia, Victoria and New South Wales.
Summit
• Supplier of fertiliser in Western Australia, from five locations at Kwinana, Geraldton, Bunbury, Albany and Esperance.
Retailers Landmark
• Offers merchandise, fertiliser, farm services, wool, livestock, finance, insurance and real estate to farmers
• Owned by AWB.
Elders
• Provides rural producers with inputs, services, products and support in wool, livestock, rural finance, insurance, merchandise, fertiliser and real estate.
• Owned by Futuris Corporation.
GrainCorp
• Publicly listed Australian agribusiness predominantly involved in grain bulk handling on the east coast of Australia. Operates under the Ag Plus brand for rural merchandise.
Hi Fert Pty Ltd Page 9 ABN 76 008 038 962
RuralCo
• Operates through a national footprint of businesses (CRT, Roberts, Ruralco, Growforce) that specialise in rural merchandise, wool broking and livestock agency, real estate agency, fertiliser, stock feed and grain storage, distribution and handling.
Independents
• Numerous privately owned businesses – generally family owned and operated. The largest part of the retail distribution market.

Hi Fert Pty Ltd Page 10 ABN 76 008 038 962
SLIDE 2 - MAJOR FERTILISER PRODUCERS/MANUFACTURERS • Slide 2 highlights the major sources of bulk fertiliser production globally.
AsiaBangladesh, China, Malaysia, Indonesia
Middle EastSaudi Arabia, QatarBahrain, Kuwait
Red Sea Suppliers
Israel, Egypt
AustraliaQueensland
US GulfUnited States
US West CoastCanada
United StatesNorth AfricaMorocco, Tunisia
EuropeGermany
UREAUREA
PHOSPHATESPHOSPHATESUREAUREA
PHOSPHATESPHOSPHATES

Hi Fert Pty Ltd Page 11 ABN 76 008 038 962
• In Australia the only truly integrated producer is Southern Cross International, which is owned by Incitec Pivot Limited.
• IPL, Impact and CSBP have SSP plants in Australia (where rock is imported, from Morocco,
China and Nauru for the manufacturing process). • CSBP also owns Ammonium Nitrate Manufacturing that can make either mining chemicals
or liquid Urea. CSBP can also produce Prilled Urea. • Hi Fert does not own any production assets. • Hi Fert buys from local producers or imports all our fertiliser products. Circa 80% of our
product is sourced globally. We despatch these in either their finished form or blend them together for bulk or bagged despatch to retailers.
Hi Fert Pty Ltd Page 12 ABN 76 008 038 962
KEY FEATURES OF WORLD FERTILISER EXPORTS – MAJOR PRODUCTS DAP In 2007, DAP production totalled approximately 30 million tonnes. The Australian market uses circa 600,000 per year representing circa 2% of world production. The major global exporters are Mosaic (USA), OCP (Morocco), GCT (Tunisia) and a variety of suppliers in China. MAP In 2007, MAP production totalled approximately 18 million tonnes. The Australian market uses circa 600,000 tonnes per year representing circa 3% of world production. The major global exporters are Mosaic (USA), OCP (Morocco), GCT (Tunisia) and a variety of suppliers in China. Urea In 2007 Urea production totalled approximately 132 million tonnes. The Australian market uses circa 1 million tonnes per year representing less than 1% of world production. The major global exporters are Middle Eastern and European producers. Potash In 2007 Potash production totalled approximately 70 million tonnes. The Australian market uses circa 300,000 tonnes per year representing less than 1% of world production. The major global exporters are Canpotex, Kali & Salz and ICL. Global volume data is sourced from Hi Fert estimates of local demand and CRU, an independent business analysis and consultancy group

Hi Fert Pty Ltd Page 13 ABN 76 008 038 962
KEY FEATURES OF THE AUSTRALIAN FERTILISER MARKET • The Australian fertiliser market relies heavily on imports of fertiliser products, as well as
some local production capacity, to service the domestic market. • Domestic manufacturers include:
o IPL (through SCI for MAP and DAP), SSP, Nitrogen Gas and Urea o Impact Fertilisers for SSP o CSBP for SSP, Prilled Urea and AN (liquid Urea component)
• IPL is the only major exporter of fertiliser product from the Australian market.
o SSP approximately 100 – 200 thousand tonnes in calendar year 2007. (Hi Fert estimate)
o MAP/DAP approximately 200 – 300 thousand tonnes in calendar year 2007. (Hi Fert
estimate) • Hi Fert buys product from overseas suppliers and domestically from SCI (owned by IPL).
80% of our sourcing is done overseas. • Other fertiliser distribution businesses also source product internationally and domestically
(through SCI, CSBP and Impact).

Hi Fert Pty Ltd Page 14 ABN 76 008 038 962
HI FERT BACKGROUND • Hi Fert was established in South Australia in 1984. • Today, Hi Fert has an extensive east cost distribution network. We operate from nine major
distribution centres supplying retailers in Queensland, Australian Capital Territory, The Northern Territory, New South Wales, Victoria and South Australia.
• Hi Fert sells product through a dealer network of rural retailers – outlets owned by
corporates such as Elders, Landmark and RuralCo and numerous family owned dealers. Hi Fert does not sell direct to farmers.
• Hi Fert became a joint venture operation in 2004 when its former owner WMC Resources
sold two-thirds of the company to ELF Australia Pty Limited, formed by Landmark (an AWB Limited Company) and Elders (a subsidiary of Futuris Corporation).
• With the acquisition of WMC Resources by BHP Billiton in 2005, the one third of Hi Fert
owned by WMC Resources moved to BHP Billiton. • In April 2005 Hi Fert announced a substantial expansion in its fertiliser distribution capacity
with the acquisition of the assets of east coast fertiliser supply company Summit Rural Australia Pty Ltd (Summit) from Sumitomo.
• The acquisition of Summit extended the reach of Hi Fert’s distribution network into
Queensland and northern New South Wales giving Hi Fert comprehensive coverage of the east coast of Australia.
• In December 2005, BHPB sold its one third share of Hi Fert to ELF Australia Pty Ltd, thereby
making Hi Fert 100% owned by ELF.

Hi Fert Pty Ltd Page 15 ABN 76 008 038 962
TOTAL AUSTRALIAN MARKET VOLUME Slide 7 – Australian fertiliser sales. Distributors / Wholesalers to Retailers. • Over the last five years the size of the Australian fertiliser market has declined by
approximately 22%. • This is directly attributed to the continued drought conditions across all regions over the
same time frame.
0
1,000,000
2,000,000
3,000,000
4,000,000
5,000,000
6,000,000
Tonn
es
2004 2005 2006 2007*
Solids Liquids
22% market decline over 4 years
Source: FIFA (Fertiliser Industry Federation Australia)
Note: 2007 based on Hi Fert estimates of market size
0
1,000,000
2,000,000
3,000,000
4,000,000
5,000,000
6,000,000
Tonn
es
2004 2005 2006 2007*
Solids Liquids
22% market decline over 4 years
Source: FIFA (Fertiliser Industry Federation Australia)
Note: 2007 based on Hi Fert estimates of market size

Hi Fert Pty Ltd Page 16 ABN 76 008 038 962
HI FERT AUSTRALIAN MARKET SHARE Slide 8 Australian market share % of Distributor / Wholesalers sales • Hi Fert has approximately 15% market share nationally.
0%
20%
40%
60%
80%
100%
2004 2005 2006 2007*
Hi Fert Others
Source: FIFA (Fertiliser Industry Federation Australia)
Note: 2007 based on Hi Fert estimates of market size
0%
20%
40%
60%
80%
100%
2004 2005 2006 2007*
Hi Fert Others
Source: FIFA (Fertiliser Industry Federation Australia)
Note: 2007 based on Hi Fert estimates of market size
Hi Fert Pty Ltd Page 17 ABN 76 008 038 962
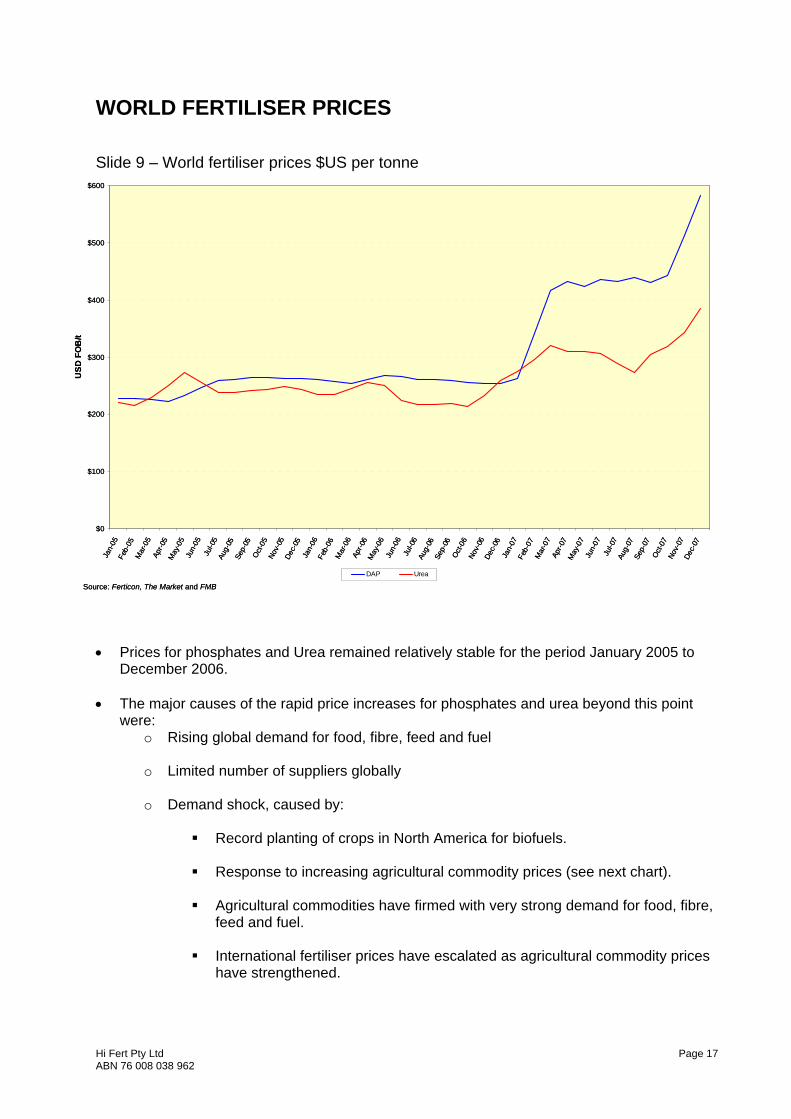
WORLD FERTILISER PRICES Slide 9 – World fertiliser prices $US per tonne • Prices for phosphates and Urea remained relatively stable for the period January 2005 to
December 2006. • The major causes of the rapid price increases for phosphates and urea beyond this point
were: o Rising global demand for food, fibre, feed and fuel o Limited number of suppliers globally
o Demand shock, caused by:
Record planting of crops in North America for biofuels. Response to increasing agricultural commodity prices (see next chart).
Agricultural commodities have firmed with very strong demand for food, fibre,
feed and fuel. International fertiliser prices have escalated as agricultural commodity prices
have strengthened.
$0
$100
$200
$300
$400
$500
$600
Jan-
05Fe
b-05
Mar
-05
Apr-0
5M
ay-0
5Ju
n-05
Jul-0
5Au
g-05
Sep-
05O
ct-0
5No
v-05
Dec-
05Ja
n-06
Feb-
06M
ar-0
6Ap
r-06
May
-06
Jun-
06Ju
l-06
Aug-
06Se
p-06
Oct
-06
Nov-
06De
c-06
Jan-
07Fe
b-07
Mar
-07
Apr-0
7M
ay-0
7Ju
n-07
Jul-0
7Au
g-07
Sep-
07O
ct-0
7No
v-07
Dec-
07
USD
FO
B/t
DAP Urea
Source: Ferticon, The Market and FMB

Hi Fert Pty Ltd Page 18 ABN 76 008 038 962
Slide 10 - World Commodity vs Fertiliser Prices 2006-2007
Source: CBOT, Fertecon, FMB, The Market
Corn (2.37 x)Soybeans(2.28 x)
Wheat (2.59 x)
DAP (3.0 x)
Urea (1.69 x)
Jan06 Ap
rJu
lOc
tJa
n07 Ap
rJu
lOct Ja
n08
0.5
1.5
2.5
3.5
Prices Indexedto Jan 06
Source: CBOT, Fertecon, FMB, The Market
Corn (2.37 x)Soybeans(2.28 x)
Wheat (2.59 x)
DAP (3.0 x)
Urea (1.69 x)
Jan06 Ap
rJu
lOc
tJa
n07 Ap
rJu
lOct Ja
n08
0.5
1.5
2.5
3.5
Prices Indexedto Jan 06

Hi Fert Pty Ltd Page 19 ABN 76 008 038 962
WORLD FREIGHT COSTS 2005-2007 Slide 11 – World freight costs $US per tonne • The continued rise of the cost of dry bulk sea freight since June 2006 is directly attributable
to the increased demand for shipping to supply Asian markets with commodities. • The US Gulf freight cost is indicative of freight costs from other regions.
$0
$20
$40
$60
$80
$100
$120
$140
$160
Jan-
05Fe
b-05
Mar
-05
Apr-0
5M
ay-0
5Ju
n-05
Jul-0
5Au
g-05
Sep-
05Oct-
05No
v-05
Dec-
05Ja
n-06
Feb-
06M
ar-0
6Ap
r-06
May
-06
Jun-
06Ju
l-06
Aug-
06Se
p-06
Oct-06
Nov-
06De
c-06
Jan-
07Fe
b-07
Mar
-07
Apr-0
7M
ay-0
7Ju
n-07
Jul-0
7Au
g-07
Sep-
07Oct-
07No
v-07
Dec-
07
USD
/t
US GulfSource: Braemar Seascope

Hi Fert Pty Ltd Page 20 ABN 76 008 038 962
HI FERT AVAILABLE STOCK POSITION • Hi Fert’s available stock position at the end of 2007 was at a record low level. Hi Fert’s
closing stock position at the end of 2007 was approximately 50% of that at the end of 2005. • This is due to the following factors:
o A lack of demand for 2 years due to drought. o Uncertainty of future demand due to increasing global costs.
o Uncertainty of seasonal conditions for 2008 due to the ongoing drought in most
agricultural areas.

Hi Fert Pty Ltd Page 21 ABN 76 008 038 962
CONCLUDING COMMENTARY • Hi Fert is a leading distributor of fertiliser in the Australian market.
o We do not own production facilities. o We do not own manufacturing facilities. o We do not own raw material facilities.
o We operate 9 major distribution centres where we store, blend, bag and despatch
product to retailers and not directly to farmers. • The market in which we operate has prices which are driven by world markets. • Prices since the beginning of 2007 have increased rapidly because of global market
demand and a shortage of supply. • Global suppliers are highly aggregated.


