53
INTAKE THROTTLE VALVE DESIGN Group # 8 KARTIK SUVARNA KARAN BHAVSAR SPONSOR: NAVISTAR INDUSTRIAL ADVISOR: ADAM LACK INSTRUCTOR: DR. SONG 1
| Date post: | 06-Aug-2015 |
| Category: |
Automotive |
| Upload: | kartik-suvarna |
| View: | 51 times |
| Download: | 2 times |
INTAKE THROTTLE VALVE DESIGN
Group # 8
KARTIK SUVARNA
KARAN BHAVSAR
SPONSOR: NAVISTAR
INDUSTRIAL ADVISOR: ADAM LACK
INSTRUCTOR: DR. SONG
DATE: MAY 1ST 20091

TABLE OF CONTENTS
List of Figures, Tables
Acknowledgement
ABSTRACT
CHAPTER 1: INTRODUCTION
o 1.1 problem topic
o 1.2 general background
o 1.3 Regeneration strategy background
o 1.4 teamwork
CHAPTER 2: DESIGN CONSTRAINS
o 2.1 Functional
o 2.2 Safety
o 2.3 Quality
o 2.4 Manufacturing
o 2.5 Timing
o 2.5 Economin
o 2.6 Social
CHAPTER 3: PROJECT PLANNING
CHAPTER 4: DESIGN SPECIFICATIONS
2

CHAPTER 5: CONCEPT EVALUATION
CHAPTER 6 : CONCEPT EVALUATION
CHAPTER 7: DISCUSSION
REFERENCE S
APPENDIX
o A: CATALYST
o B: AFTERTREATMENT
o C: EGR
o D: NAVISTAR ENGINE SPECS
o E: INTAKE THROTTLE CONFIG
o D: NAVISTAR ENGINE SPECS
Equations
3
FIGURES
Figure 1:3-D Plot Navistar Data
Figure 2: 2-D Plot Navistar Data
Figure 3: Timeline
Figure 4: Design Matrix
Figure 5: Concept 1: Orifice Plate
Figure 6: Concept 2: Oval shaped Valve
Figure 7: Concept 3: Reduced Diameter Valve
Figure 8:Concept Evaluation Table
Additional Figures: APPENDIX
4

CHAPTER 1
Introduction
1.1 Problem Topic:
The 6.4 L V8 Engine at Navistar that is scheduled to go into production in 2010 uses an
Intake Throttle to increase EGR rates and reduce NOx emissions. The Intake Throttle Valve is
used to control the amount of fresh cooled air to be let into the Manifold mixer to mix with
the Exhaust gas that comes in via the EGR cooler. After the Intake throttle valve reaches
about 60% of closure at high mass air flow rates, the delta P across the valve tends to
increase rapidly resulting in suction which causes the valve to close completely resulting in
the Engine to choke. This Project aims at preventing the intake throttle valve from being
closed forcefully due to suction.
5

Figure 1: 3-D Plot; Intake Throttle Valve closure vs MAF vs P
Figure 2: 2-D Plot; Intake Throttle Valve closure (%) vs Delta P
Figure 1 shows a 3-D plot of the data collected from tests that were ran at the test cells in
Navistar. It shows the relationship between the Intake throttle valve closure (%) and the rise
in pressure differential (hPa) across the valve at different Mass Air Flows (Kg/hr). Figure 2 is
the same plot in 2-D format showing only Intake throttle valve closure (%) vs the Delta P
(hPa). The graph clearly shows where the delta P tends to rapidly increase causing a rapid
closure of the valve which results in engine choking. From the graph 0% is considered to be
wide open position of the valve while 100% is considered to be a fully closed position of the
valve. As seen in the plot, there are no data points in the 100 % range. This shows that there
is only a little gap between the valve in closed position and the inner wall of the throttle.
High temperature cause the valve to expand resulting in the valve be in closed positioned
even though technically its only 80% closed. Thus concepts must be designed taking the the
expansion of the valve into consideration. A better understanding of this can be gained in
chapter 5.
1.2 General Background:
6

This project is assigned by the Aftertreatment department at Navistar. The
Aftertreatment department at Navistar deals with trying to achieve high Catalyst Inlet
temperatures in order to meet the EPA requirements. The target exhaust out temperatures
are tried to achieve by playing around with the Injection timings, EGR valve technology,
using the Intake Throttle and a Turbocharger. The target exhaust temperature going into
the Diesel Oxidation Catalyst is 275ºC - 300ºC, where as the target exhaust temperature
going into the Diesel Particulate Filter is 540ºC - 600ºC. The Target Diesel Oxidation
Temperature is needed to oxidize Carbon Monoxide (CO), Hydrocarbons (HC) and organic
fraction of diesel particulates (SOF). The Oxidation takes place as follows:
HC + O2 = CO2 + H2O ……. (I)
CO + 1/2O2 = CO2……….. (II)
2SO2 + O2 = 2SO3……… (III a)
SO3 + H20 = H2SO4……. (III b)
The target temperature going into the Diesel Particulate Filter is required for oxidation of
NOx. To read about the effects of catalysts on NOx refer Appendix [ ].
1.3 Regeneration Strategy Background:
Some of the strategies used by the companies to achieve target Exhaust out temperature for
regeneration are as follows:
1. Post Injection
Entirely new functions are performed by injection systems in engines with integrated
emission aftertreatment systems of Diesel Particulate Filters. These devices require
regeneration to burn all the soot which is provided by high temperatures or by rich
exhaust gas of rich HC content. These are achieved by late fuel injection which is also
called post injection. Thus Post injection provides a certain amount of high exhaust
7

temperature going into the DOC which is further increased by oxidation process taking
place in the DOC.
2. Intake Throttle
The intake throttle valve is an engine component which exhibits a large potential for
exhaust gas temperature optimization. By closing the intake throttle valve less air will
be let into the engine thereby decreasing the air to fuel ratio. With a lower air to fuel
ratio the same amount of fuel is added in the combustion chamber to a lower mass of
air, thereby increasing the temperature rise in the cylinder. The disadvantage to this
approach is that it will decrease the mass air flow rate into the catalysts which may
cause a delay in light off due to the lower absolute energy content in the exhaust gas.
Furthermore, this approach may cause an increase in emissions levels.
3. Turbocharger
The turbocharger is an integral and very dynamic part of the exhaust stream. The V148
turbocharger is highly complex with numerous electronically controlled parameters
including a turbine bypass valve, wastegate, and variable geometry turbine (VGT)Test
Configuration. VGT can be utilized to increase exhaust temperature by raising the
exhaust backpressure and therefore increasing the work done by the firing cylinders. By
closing the VGT a large resistance to flow is created in the turbine thereby raising the
backpressure. Another advantage in terms of exhaust gas temperature maximization
can be achieved by bypassing the turbine entirely to prevent the exhaust gasses from
rejecting energy into the large thermal mass of the turbine housing. During low load
operation the low pressure turbine is not being utilized to create boost, therefore it can
be bypassed through the wastegate to prevent the exhaust from rejecting its heat to the
housing. With the wastegate open the exhaust can bypass the low pressure turbine
housing and take a shorter path through which it will lose less energy. Simultaneously,
the high pressure turbine, equipped with a VGT, can be controlled to shut its vanes and
8

increase backpressure to the combustion chamber which theoretically will increase
exhaust gas temperature exiting the combustion chamber.
1.4 Team Work
Our group consists of two members. The initial stages of the project involved
brainstorming ideas. The next stage involved talking to the employees at Navistar asking
them if they could go over some of the major issues they are facing and if we could help
them improve a design to fix the problem. So the Navistar employees had a huge
contribution to this project assisting us with the topic, details related to the problem,
and providing us with required tests data and schematics and a couple other things. The
Advisor Dr. Song contributed by pushing us to understand the problem more and
understand how the engine operates. He made sure we understand the smallest things
about the engine that might be related in some or the other way with our project.
We as team members worked together by going to Navistar to gather
information and talking to engineers. We worked together on researching journals and
books. We distributed the work of brainstorming ideas. So overall it was a team work
which not only included the team members but also the instructor at Northern Illinois
University and the Advisor at Navistar.
9
CHAPTER 2
DESIGN CONSTRAINTS
2.1 Functional
Operation: Operation of the Throttle needs to be taken into consideration. A great
understanding of how it works and what can be changed in to achieve goal needs to be
understood.
Size: The size of the Throttle Valve needs to be taken into consideration. There must some
limitations as to how big or small the valve can be. One also should consider the fact that the
orifice or the throttle diameter would remain the same. Thus only modifications to the valve
can be made. Changing the throttle altogether would make packaging for the V152 program at
Navistar difficult.
Flow: Fluid flow which includes air and gas needs to be understood. Knowledge acquired from
the Fluid Mechanics class and research on the same must be implemented into the design at
Navistar to go about designing the new product.
Software: I-DEAS would be used to design the product. MATLAB would be used whenever
necessary. CFD analysis would have to be done for flow simulations.
2.2 Safety
Test Cell: We will always make sure that we are assisted by a technician while we are at the test
cell at Navistar. Safety glass would be worn wherever necessary on company property. Other
safety regulations required by the company would be taken into consideration
Enivronmental: This project aims at improving Environmental safety by avoiding exceeding the
EPA NOx limits. Thus this projects aims at reducing NOx emissions.
2.3 Quality
Quality assurance and control: Regulations, standards and testing.
10

Reliability: Parts designed and ordered will be tested for failure. Thus multiple concepts will be
designed to come up with a final product in the future.
2.4 Manufacturing
Supplier: A constant contact will be followed with the Navistar supplier for the Intake Throttle
Valve
2.5 Timing
Product Planning: Planning on what are the initial steps going about the product designed need
to be outlined. Now coming to the end of the semester these initial steps were outlined and
thus a project planning chart was put together which is seen in Chapter 3.
Product Schedule: A timeline of what needs to be when in order to stay within the time period
of designing the product needs to be created. A time line basically defines how many days a
task should last. It helps order and test parts on time. A time line is designed in Chapter 3.
2.6 Economic
Cost Analysis: Cost analysis of the present product used by the company still needs to be looked
at. Costs needs to be kept in mind while designing the new part thus choosing material and
other components needed that stay within company spending limits.
2.7 Social
A relationship is initialized between the team, Navistar and the supplier. This relationship tends
to grow as we go forward with the project.
11

CHAPTER 3
PROJECT PLANNING
A project plan is a list of tasks that need to be completed during the design process. The
objectives for each task are stated and a timeline is defined based on the listed tasks and the time
period to finish project.
The tasks needed to achieve project goal of designing the Intake Throttle Valve are:
1. Design Engineering Specifications
Objective: Make an understanding of who the customers are and what the customer requirements are.
Create a time line based on time period to complete the project and create a QFD chart.
2. Gather Information
Objective: Gather information from the design engineers, aftertreatment department, and calibration
department based on what is needed start up with the project. Example: Test data for the current
throttle valve design.
3. Research
Objective: Research journals, books and internet to gather more information on the project topic. This is
necessary to get a better understanding of the problem and get ideas on what other people are doing to
prevent a similar problem.
4. Recap Fluid Mechanics Knowledge
Objective: Recap knowledge acquired in Fluid Mechanics class by browsing through the text booow k to
get a better understanding of fluid flow equations.
5. Brainstorm Concepts
Objective: Make a list of concepts based on research and fluid mechanics knowledge. Apply equations to
each concept to make a comparison between the concepts.
6. Choose 2 or 3 concepts
12

Objective: Based on calculations done on each brainstormed concept, choose 2 or 3 concepts that would
work best just so that a lot of time is not wasted designing every concept. Determine dimensions of
concepts based on calculations.
7. Design
Objective: Do a cost evaluation on the concepts chosen and design the part.
8. Simulation
Objective: Run CFD analysis to get data that might help verify if the concepts thought of based on
theoretical calculation are correct.
9. Order Part
Objective: Based on design and simulation results order part.
10. Run Tests
Objective: Run DOE’s with the ordered part to get real data that can be verified with theoretical and
simulation results. Verify real data with simulation results.
Timeline:
A timeline is often created to make things organized. It helps determine what needs to be when in order
to complete project in required time period.
April May June Jul
13

yW1
W2
W3
W4
W1
W2
W3
W4
W1
W2
W3
W4
W1
W2
W3
W4
SpecificationsGather
InformationResearch
Recap Fluid MechanicsBrainstorm Concepts
Choose 2 or 3 concepts
Design ConceptsSimulationOrder partRun tests
Will be out of town on vacation.
Figure 3: timeline
A B C D E F G H I JSpecifications A AGather Information B X BResearch C X X CRecap Fluid Mechanics D X DBrainstorm Concepts E X X EChoose 2 or 3 concepts F X X X FDesign Concepts G X X X GSimulation H X X HOrder part I X X IRun tests J X J
Figure 4: Design atrix
14

CHAPTER 4
SPECIFICATIONS
a. Custormers: Aftertreatment Department at Navistar and rest of the design
team.
b. Customer Requirements: Design the Intake Throttle Valve to achieve goal of
having a linear relationship between the Intake Throttle Valve Closure (%) and
Pressure Differential across the valve (P).
c. It is necessary to understand how the Intake Throttle valve works. It is then
necessary to understand how air and exhaust flows through the intake throttle.
d. Talk to engineers to see what the Delta P requirements would be for certain
mass flow rate to avoid suction. Thus brainstorm concepts and apply fluid
mechanics to make sure concept meets requirements.
e. Decide a time line to decide what concept works best, design part and order
part to run data.
15

CHAPTER 5
CONCEPT GENERATION
A. Orifice PlateOrifice is nothing but an opening, and thus a an orifice plate is a valve or a plate with an opening.
Figure 5: Concept 1: Orifice Plate
This is a valve which basically has a hole in it. Where the hole needs to be designed? This
is not determined yet. It can be determined with further calculations.
How does an orifice plate help?
Since the Valve has a hole in the center it allows air increases air speed since it has to pass
through a smaller portion. Since the air has to increase its speed to pass through a smaller gap,
it results in reduced internal pressure which means reduced Delta P. Thus If the Delta P across
the valve is controlled, then this will prevent the valve from closing due to suction. Some of the
calculations that were looked into that would be applied to this design to prove whether it
works or now is as follows. These calculations were based off of the original Fluid equations in
Appendix [].
16
Orifice

The best way to start about going ahead with this concept would be to talk to the
calibration department to check, what the Delta P requirement is at a certain flow rate and at a
certain intake throttle angle. Thus the minimum diameter required to meet the above targets
can be calculated. A number of calculations can be done for different combinations of flow rates
and intake throttle closure. The diameter of the opening can be determined based off of the
different calculations performed.
B. Oval shaped Valve
The present Intake throttle valve is round shaped. The present throttle valve has a
diameter of 68mm as seen in Appendix[]. The orifice around the valve is 69.8mm. Thus there is a
only a 1.8mm gap between the orifice plate in closed position and the throttle orifice. At high
temperatures the valve tends to expand, because of which during a rapid increase in Delta P, the
throttle tends to shut down at 80% valve closure instead of closing completely at 100% closure.
Thus reducing the shape by making it oval might be beneficial. This will not only give the valve a
greater expansion gap. Another thing that needs to be looked into while creating this design is
that dimensions of the valve need to be calculated taking into account that even after expansion
of the valve at high temperatures there will some gap for the air to escape which will prevent a
rapid rise of pressure differential across the valve thus preventing the valve from shutting down
due to suction further preventing the engine from choking.
17

Figure 6: Concept 2: Oval Shaped
The equations in concept A will be used applying it to design this concept with a few changes.
For this design Ai will be the area of the oval shaped valve.
C. Round shaped Valve with a smaller diameter
Applying the similar reason applied to the above concepts, the shape of the valve can be
kept round but reduced in diameter. This will again allow valve to expand at high temperatures.
A diameter of the valve in this case needs to be calculated taking into account the expansion of
the valve and still having a some gap for the air to escape reducing internal pressure.
18

Figure 7: Concept 3: Reduced Diameter
D. Multiple Throttle Valves
This concept is a bit more complicated. This concept requires having a couple throttle
valves may be two designed in series in the throttle valve. This will require opening and closing
each valve trying to control the internal pressure. This will help reduce pressure across each will
keeping the pressure in the throttle under control. This design will require calculating what size
and shape or type the two valves need to be of, how far away from each other they need to be,
which one needs to be open when and which one needs to be closed when. This will require
designing a program based on calculations and intensive research and implementing the
program into the ECU to control the two valves. This will involve a lot of controls.
E. Mechanical or electronic Obstructions on the throttle
Designing mechanical or electronic obstruction was another thing we brainstormed.
Mechanical stop are some kind of obstruction on the throttle that prevent the valve from
complete closure.
The reasons we called it an electronic stop too is that we might have a program designed for it
to control it.
F. By pass passage.
19

By pass across the valve was another idea that we thought of. This basically is a by pass
passage that will create across the valve that will help by passing pressure when it reaches
threshold. The bypass passage length and dimensions need to be designed by working on
intensive calculations. This design will also require a valve to be designed that will open
whenever pressure reaches threshold and close when pressure comes below threshold.
20

CHAPTER 6
CONCEPT EVALUATION
The various benefits from the design were listed. Benefits like the design benefitting the engine and the environment were listed and each of the concepts were rated with respect to how much effect it would have on those benefits. This helps prove what concept would be more beneficial. Thus certain concepts can be given more priority compared to the others. Thus a lot of time is not wasted designing each of the concepts in order to stay within the timeline determined.
The following benefits were concluded further calculating the satisfaction % for each concepts.
The calculations are done as follows:
Belief = p(k)*p( c) + (1 – p(k)) * (1-p( c))
Importance: Assumed and determined based on knowledge
Satisfaction (%) = (Belief*Importance)
ConceptsOrifice Plate p(k) p (c ) belief
Pressure Control 0.9 0.9 0.82NOx Reduction 0.9 0.9 0.82Flow Equations 0.8 0.8 0.68
Engine Life 0.1 0.3 0.66understand parameters 0.5 0.5 0.5
cost limitations 0.5 0.5 0.5
Oval shaped valvePressure Control 0.8 0.8 0.68NOx Reduction 0.8 0.8 0.68Flow Equations 0.7 0.7 0.58
Engine Life 0.1 0.3 0.66understand parameters 0.5 0.5 0.5
cost limitations 0.5 0.5 0.5
Reduced DiameterPressure Control 0.75 0.75 0.625NOx Reduction 0.7 0.7 0.58Flow Equations 0.7 0.7 0.58
Engine Life 0.1 0.3 0.66understand parameters 0.5 0.5 0.5
cost limitations 0.5 0.5 0.5
21

Multiple ValvesPressure Control 0.77 0.7 0.608NOx Reduction 0.7 0.7 0.58Flow Equations 0.7 0.7 0.58
Engine Life 0.1 0.3 0.66understand parameters 0.5 0.5 0.5
cost limitations 0.8 0.8 0.68
Mechanical ObstructionPressure Control 0.4 0.5 0.5NOx Reduction 0.4 0.4 0.52Flow Equations 0 0.1 0.9
Engine Life 0.1 0.3 0.66understand parameters 0.5 0.5 0.5
cost limitations 0.4 0.4 0.52
By passPressure Control 0.4 0.5 0.5NOx Reduction 0.3 0.3 0.58Flow Equations 0 0.1 0.9
Engine Life 0.1 0.3 0.66understand parameters 0.5 0.5 0.5
cost limitations 0.4 0.4 0.52
Alternative 1
Alternative 2
Alternative 3
Alternative 4
Alternative 5
Alternative 6
Critera Importance Orifice Plate
Oval Shaped Valve
reduced diameter
multiple valves
mechanical obstruction by pass
Pressure Control 25 0.82 0.68 0.625 0.608 0.5 0.5NOx Reduction 25 0.82 0.68 0.58 0.58 0.52 0.58Flow Equations 15 0.68 0.58 0.58 0.58 0.9 0.9
Engine Life 8 0.66 0.66 0.66 0.66 0.66 0.66understand parameters 15 0.5 0.5 0.5 0.5 0.5 0.5
cost limitations 12 0.5 0.5 0.5 0.68 0.52 0.52Satisfactions
(%) 69.98 61.48 57.605 59.34 58.02 59.52Figure 8: Concept Evaluation
22

CHAPTER 7
DISCUSSION
The topic has been understood. The concepts have been brainstormed. The team is pretty much
going to work based on the timeline created.
The current status: A list of concepts brainstormed have been undergoing research. We are
trying to research on what other companies are doing and what might be better ideas to fix the
problem. We are not ruling out our current concepts. But we are just trying to research a couple more
concepts before finalizing a particular concept. We will be spending a couple more days or weeks
researching ideas. Then we will list them all and create a decision chart based on the calculations and
flow equations. We have already started implementing flow equations into our current concepts. We
are trying to use real data and data that the calibration department things we need to get a good graph
to check how each of our concepts affect the problem solution. We will do so as we find more concepts
on researching.
Right now, we haven’t really made a lot of progress on the design. But we made good progress
on the proposal and initial stages that were taught in class. We just need to catch up on the research
stage so we could start the design stage and the testing stage as soon as possible.
23

REFERENCE
1.Carberry, B., G. Grasi, S. Guerin, F. Jayat, and R. Konieczny, 2005. “Pre-Turbocharger Catalyst – Fast catalyst light-off evaluation”, SAE Technical Paper 2005-01-2142
2.Kishi N., H. Hashimoto, K. Fujimori, K. Ishii, T. Komatsudu, 1998. “Development of the Ultra Low Heat Capacity and Highly Insulating (ULOC) Exhaust Manifold for ULEV”, SAE Technical Paper 980937
3. Tomazic D., M. Tatur, M. Thornton, 2004. “Development of a Diesel Passenger Car Meeting Tier 2 Emissions Levels”, SAE Technical Paper 2004-01-0581
4. Zhang, X., L. Meda, M. Keck, 2005. “Numerical Study on Skin Temperature and Heat Loss of Vehicle Exhaust System”, SAE Technical Paper 2005-01-1622
5. Jääskeläinen, H., 2008. “Diesel Exhaust Gas”, DieselNet Technology Guide,
http://www.dieselnet.com/tech/diesel_exh.html
6.Makdi K. Khair. , 2008. “EGR & Components”, DieselNet Technology Guide,
http://www.dieselnet.com/tech/diesel_exh.html
7. Robert, Alan, Philip, “Introduction to Fluid Mechanics”
24

APPENDIX A
CATALYST
Chemical Reactions
During the combustion of hydrocarbon fuels, perfect combustion would be characterized by the following reaction.
CnHm+(n+m2
)O2→nCO2+m2H2O
However; due to many factors including incomplete combustion, imperfect combustion, fuel impurities, and the presence of nitrogen in air combined with the high temperatures seen in the combustion chamber, many other compounds are formed. These compounds may include, but are not limited to, oxides of nitrogen (NOx), particulate matter (PM), hydrocarbons (HC), and carbon monoxide (CO).
Due to emissions regulations, catalytic converters are used to convert these undesired compounds into carbon dioxide (CO2), water (H2O), and diatomic nitrogen (N2). In facilitating these reactions catalytic converters use a number of different technologies designed specifically for each application. The vast majority of catalytic converters use platinum group metals (PGM), which include platinum, palladium, and rhodium, to lower the activation energy of each reaction, therefore allowing the reactions to take place quickly and at temperatures typical of combustion gases. Catalytic converters using materials other than these metals do exist, but are uncommon in automotive applications. All catalysts share the basic principle of operation regardless of composition and chemical reaction taking place by lowering the activation energy of the reaction which they facilitate.
Required Conditions
Although catalysts lower the activation energy of the reactions which they facilitate, they are not effective enough to perform their task at temperatures below a certain threshold. This threshold in automotive applications is often referred to as the “light off” temperature.
The light off temperature is defined differently in different applications, but always makes reference to the conversion percentage. That is, a light off temperature will be defined where a certain percentage of the target chemical is converted across the catalyst. Refer to chapter 1 figure 3 for an illustration of this phenomenon.
Exothermic Reactions
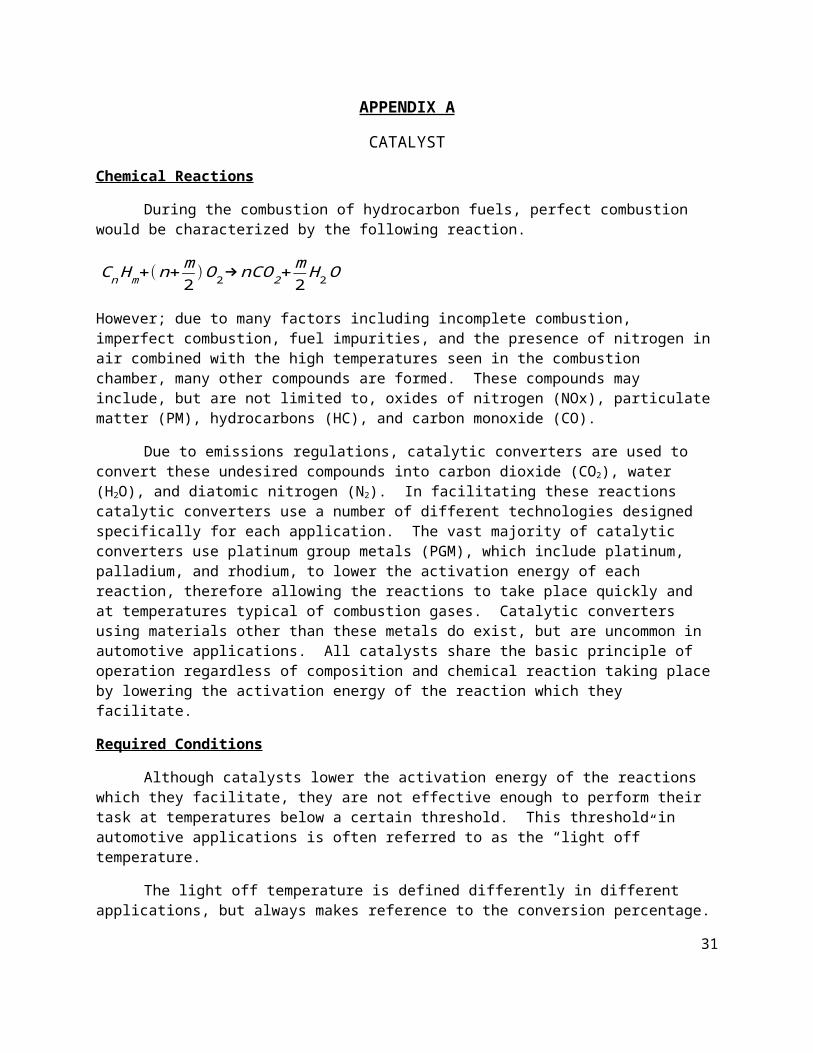
When any reaction takes place, the products of that reaction have a different chemical energy than the reactants. This change in energy is the basis of definition for two types of reactions, exothermic and endothermic. In an endothermic reaction the products have a higher energy than the reactants; therefore heat is consumed in the process. Inversely, in an exothermic reaction the products have a lower energy than the reactants, therefore releasing heat during the reaction. An exothermic catalyzed reaction is shown in Figure A-1. It is important to note that regardless of whether the reaction is catalyzed or not, the energies of the reactants in their beginning state are equal, as are the products in their end state. This means that any reaction, endothermic or exothermic, catalyzed or uncatalyzed, consumes or releases the same amount of heat regardless of the reaction path taken.
25

Figure A-1. Energy diagram for catalyzed reaction. NOTE: From CEIC Catalysis website (http://www.catalysis-ed.org/principles/mechanism.htm)
26

APPENDIX B
AFTERTREATMENT
Aftertreatment Configuration
Two components are in setup for this application of the Aftertreatment department. The first is a Diesel Oxidation Catalyst (DOC) which is designed to convert unburned hydrocarbons in the exhaust stream into CO2 and water. The second component is a Diesel Particulate Filter (DPF) which is designed to trap soot particles during all phases of engine operation. The complete system is shown in figure below.
Diesel Oxidation Catalyst
The main purpose of the oxidation catalyst is to oxidize any remaining hydrocarbons and carbon monoxide in the exhaust into CO2 and water. The DOC is a metallic flow through substrate coated with a platinum and palladium washcoat. Both platinum and palladium act as oxidation catalysts, but the ratio of platinum to palladium varies due to application. Platinum has the tendency to sinter during high temperature operation therefore reducing active catalyst sites and resulting in a decrease in conversion efficiency. Palladium is less expensive, has a lower activation temperature, and is less likely to sinter and is therefore used to stabilize the platinum to prevent a decrease in efficiency over time. Until recently palladium catalysts were not widely used due to their susceptibility to sulfur poisoning. With the adaptation of Ultra Low Sulfur Diesel (ULSD) with a 15ppm maximum sulfur content, palladium catalysts have become more prevalent in diesel applications.
27

Oxidation reactions are chemically identical to the combustion process, as combustion is simply an oxidation reaction. Given this fact it is no surprise that the reaction taking place in the DOC is an exothermic reaction. This exothermic reaction can be of great benefit to both the LNT and the DPF as will be discussed later.
Diesel Particulate Filter
The diesel particulate filter is a catalyzed filter which is used to reduce the amount of soot leaving the tailpipe. The geometry of the filter substrate is such that each channel of the ceramic substrate is blocked on one end and open on the other. Each channel is blocked on either the inlet or outlet side of the substrate, but never both. This forces the exhaust gases to flow into an open channel on the inlet side and pass through the wall of the substrate in order to flow out of an adjacent channel of the substrate which is blocked off at the inlet side, but not the outlet. A comparison of flow through and wall flow designs are shown in figure below. This passage of exhaust gas through the wall of the filter traps any large particles of soot.
Over time the DPF collects soot from the exhaust and becomes “full” meaning that the backpressure caused by the filter becomes too high for the engine to operate properly and needs to be cleaned. The cleaning process is called regeneration. During regeneration of the filter the exhaust gas temperature is raised by engine control in order to bring the DOC up to a high conversion temperature. Once a suitable temperature is reached, fuel is injected after the combustion process in the cylinder is complete. This post injection of fuel provides the DOC with a large quantity of hydrocarbons to oxidize, generating an exotherm. This exotherm causes the filter inlet temperatures to become high enough to catalytically burn the trapped soot and regenerate the filter. This process is referred to as active regeneration.
The process of active regeneration causes a fuel economy penalty due to the post injection of fuel for the DOC to oxidize. It is for this reason that passive regeneration of the filter is desired. Passive regeneration occurs when NO2 is passed through the filter. Due to the fact that NO2 can more readily oxidize soot at lower temperatures than oxygen no extra thermal energy is needed in the exhaust stream. NO2 can be generated from NO and O2 passing over the DOC.
Intake Throttle Valve
The intake throttle valve is an engine component which exhibits a large potential for exhaust gas temperature optimization. By closing the intake throttle valve less air will be let into the engine thereby decreasing the air to fuel ratio. With a lower air to fuel ratio the same amount of fuel is added in the combustion chamber to a lower mass of air, thereby increasing the temperature rise in the cylinder. The disadvantage to this approach is that it will decrease the mass air flow rate into the catalysts which may cause a delay in light off due to the lower absolute energy content in the exhaust gas. The details of engine operation following cold start involving a partially closed intake throttle will need to be studied further in order to determine the validity of this approach.
28
APPENDIX C
EGR
EGR Control Valves
The EGR rate in early EGR systems was controlled using a properly sized rate control orifice, in a design resembling the system in Figure 1. While a very simple solution, the orifice was not able to provide the necessary flexibility in controlling the EGR rate. With time, the orifice was replaced by a control valve, which acts as a variable orifice, thus providing the necessary flexibility.
EGR valves utilize a number of different designs. Some valves are a poppet style, while others have adopted a rotary type design. Because of the mechanism of valve actuation, EGR valves are divided into two categories:
1. Pneumatic valves, and2. Electric valves.
Pneumatic valves were common in EGR systems for light-duty vehicles. Diesel cars in the 1990s utilized almost exclusively pneumatic EGR valves, but newer diesel car models increasingly adopt electric EGR valves. Electric valve actuation was the standard method used in EGR systems for heavy-duty engines since their introduction in the 2000s.
With a pneumatic EGR valve, the electric actuating signal from the engine control module (ECM) is converted by an electro-pneumatic converter into a pneumatic vacuum signal. When the pneumatic EGR valve is exposed to vacuum (produced by a vacuum pump), it results in the required valve position. A disadvantage of the pneumatic valve is a hysteresis in the characteristic curve between valve opening and valve closing [Flaig 2000].
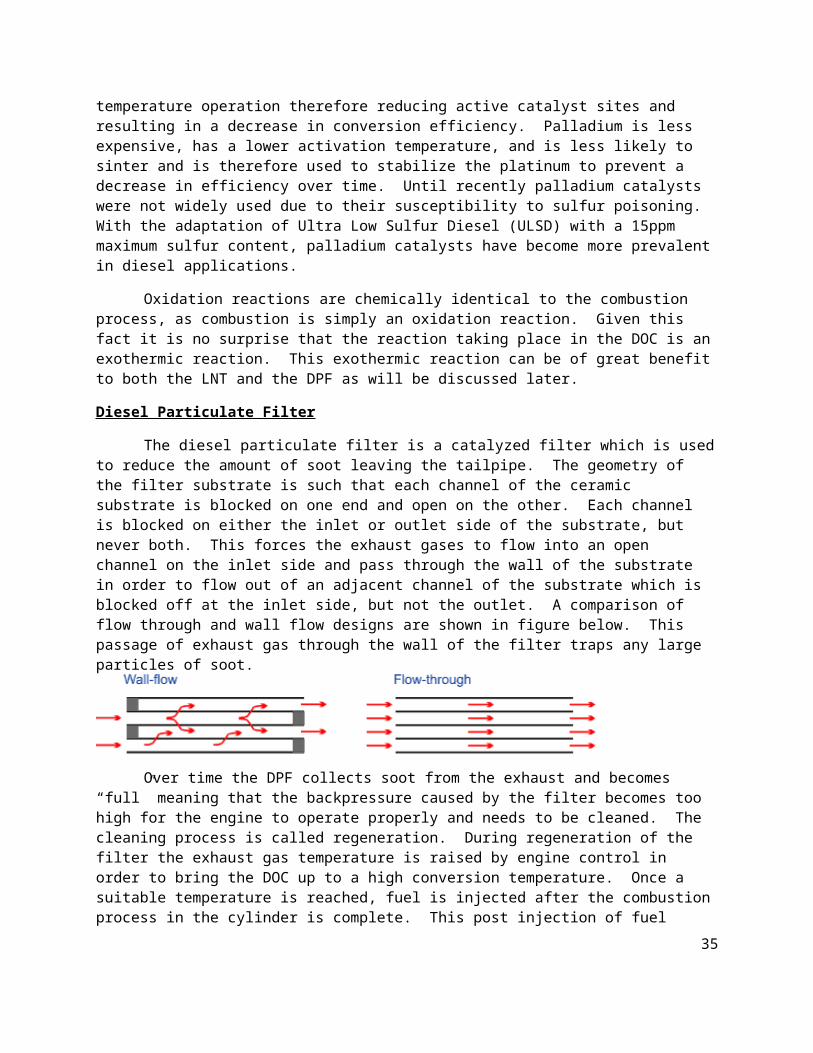
In electric EGR valves, the valve modulation is performed using linear solenoids or stepper motors. An example EGR valve for heavy-duty engines is shown in Figure 2.
Figure 2. Prototype of a Production Style EGR Valve
Lucas Control Systems
29

With the electric EGR valve, the ECM sends a control signal to the electronics integrated in the EGR valve. In some designs, a Hall sensor is used for position feedback for control of the valve, resulting in hysteresis-free opening and closing of the valve and in a linear characteristic curve. Electric EGR valves must meet demanding operational requirements: actuating speeds of less than 50 ms at engine compartment temperatures of up to 140°C were reported in light-duty applications [Flaig 2000].
Controlling the EGR valve is easily accommodated through the ECM. Many functions are shared between engine and EGR valve control. Inputs of engine speed, torque (often substituted for with intake manifold pressure), throttle position, and intake manifold temperature are just a few of the shared signals between both engine and EGR control.
In some applications (e.g., 2004 7.3 liter Navistar engine) an airflow sensor is used to control EGR rates. At a given speed and load condition, the fresh air signal provided by the airflow sensor for the no-EGR condition is reduced by opening the EGR valve. The signal corresponding to the reduced fresh airflow is used as feedback indicating the proper EGR rate or leading to further adjustment in EGR valve position to obtain a predetermined EGR rate. In general, a production EGR system may not need fully dedicated sensors, but may share control signals with existing sensors. We will return to the topic of EGR control later.
The EGR valve is often a separate component installed in the exhaust piping. In some designs, however, the valve can be integrated with various parts of the engine. A valve integrated with the exhaust manifold is shown in Figure 3 [Haerter 1994].
Figure 3. EGR Valve/Intake Manifold Integral Design
EGR Coolers
The heat absorbed from the combustion process is proportional to EGR rate, its specific heat, and the difference between combustion and EGR temperatures. Hence, cooling the EGR stream allows for greater heat absorption from the combustion process which leads to a lower rate of NOx formation. In addition, cooler EGR occupies less volume in the inlet system. Lower EGR volume displaces a smaller fraction of fresh filtered intake air, thus displacing less O2, which helps maintain combustion efficiency.
30
A schematic representation of an EGR cooler is shown in Figure 4. A starting point for many EGR cooler designs has been the shell-and-tube heat exchanger. Exhaust gas flows through the tubes of the heat exchanger while the coolant—jacket water—flows in the shell.
Figure 4. Schematic Diagram of EGR Cooler
Cooler effectiveness is measured by the ratio of the actual heat transfer across the cooler to the maximum heat transfer that would be potentially possible considering the temperatures of the exhaust gas and the coolant (i.e., when the outlet gas temperature becomes equal to the inlet coolant temperature):
(1)ε = Q/Qmax = (Tg,in - Tg,out)/(Tg,in - Tc,in)
Heat exchanger geometry may need to be considered in applying Equation (1). Only counterflow heat exchangers, such as that shown in Figure 4 (but of infinite length or infinitely high heat transfer coefficient), could provide an effectiveness of 1 using this equation. For parallel flow coolers, Tc,in could be replaced by Tc,out to represent the lowest temperature to which the exhaust gas could be cooled. Coolers with mixed flow patterns can be designed, where the minimum possible outlet gas temperature is somewhere between Tc,in and Tc,out.
However, if one considers the heat exchanger to be a black box, then Equation (1) could be applied to any heat exchanger regardless of geometry. It would then compare any given heat exchanger design to the infinite length counterflow arrangement that would in principle provide maximum heat transfer. This approach is often taken for EGR coolers [Hoard 2007][Kowada 2006].
An example temperature profile and the effect of coolant flow rate through a parallel flow shell-and-tube EGR cooler are shown in Figure 5 [Charlton 1998]. In this case, as the coolant flow rate decreases the effectiveness (relative to the infinite length counterflow arrangement) drops from about 81% to 72%.
31
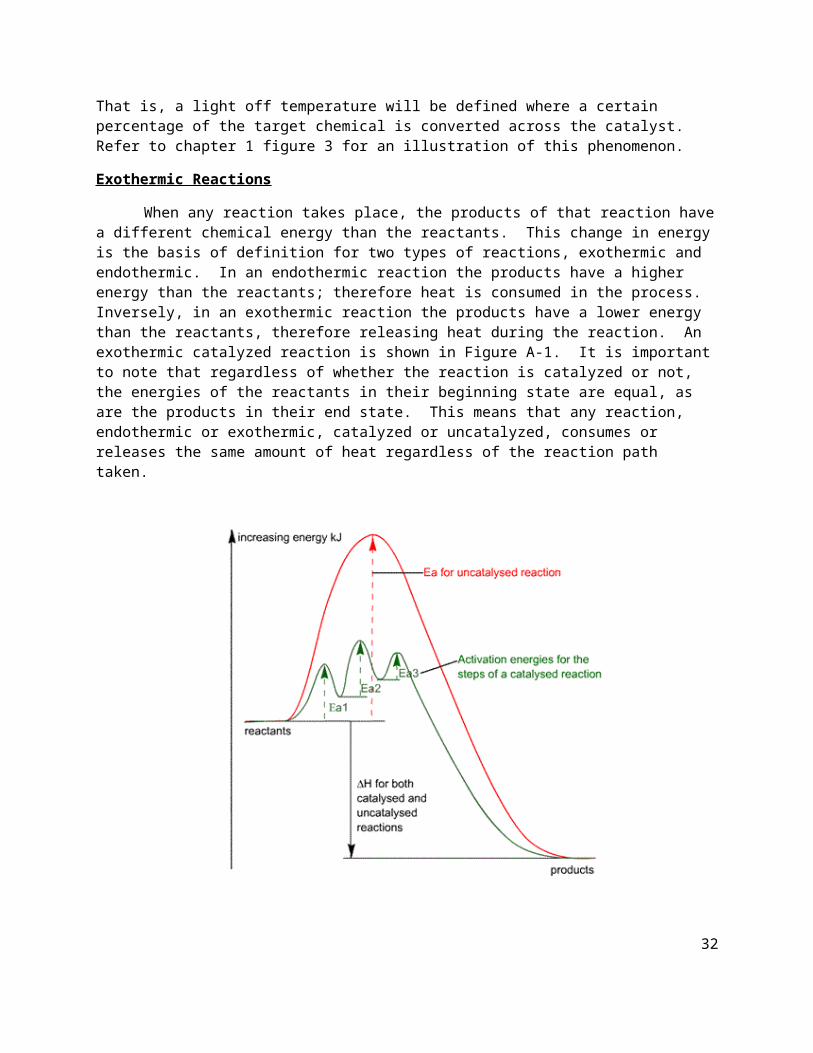
Figure 5. Coolant and EGR Temperatures Through Shell-and-Tube Type EGR Cooler
Details of a shell-and-tube heat exchanger are shown in Figure 6. Segmented baffles are placed in the shell which increase the coolant velocity and turbulence in order to maximize the heat transfer coefficient. Tubes are made of materials selected for high strength and corrosion resistance. Stainless steel with chromium, nickel and molybdenum are popular materials—especially for engines designed to run on fuels containing substantial amounts of sulfur. However, care should be exercised regarding the content of nickel and its susceptibility to the presence of corrosive sulfuric acid in the exhaust. Widespread use of ultra low sulfur diesel fuels (<15 ppm) may provide manufacturers additional flexibility in material choices.
Figure 6. Details of a Shell-and-Tube Heat Exchanger
Heat exchangers may feature one- or multi-pass flow paths in the tubes (e.g., four-pass in Figure 6, as evident from the shape of the header gasket). Selecting a greater number of flow paths increases the linear velocity of gas in tubes, increases the heat transfer coefficient, and results in lower heat transfer surface area requirement (i.e., in a smaller, more compact heat exchanger). Using multi-pass coolers
32

may be dictated by packaging space limitation while desiring large temperature reductions. A major disadvantage of the greater number of flow paths is the associated pressure drop, which is critical in designing EGR systems. Having small pressure differences between the exhaust and intake manifolds does not permit additional pressure losses in the EGR system, such as those experienced in a cooler. An example of the pressure drop associated with one-, two-, and three-pass flow paths through an EGR cooler is given in Figure 7.
Figure 7. Effectiveness and Pressure Drop for One-, Two-, and Three-Pass EGR Cooler Versus Time
EGR coolers have evolved to assume many different configurations. Interest in making components smaller and lighter has resulted in replacing shell-and-tube designs with more compact ones. Figure 8 shows a flat tube style of EGR cooler from a heavy-duty diesel engine designed to meet US 2007 standards.
33

Figure 8. Flat Tube Style EGR Cooler
(Caterpillar 2007 C15 ACERT engine)
Compactness ratio quantifies the heat transfer surface area per unit volume of the heat exchanger. In some EGR coolers, more compact design is achieved through the use of fins on the gas side. Tube and fin designs can have compactness ratios up to about 330 m2/m3. Plate and fin coolers—such as that shown in Figure 9—can have compactness ratios above 1000 m2/m3.
Figure 9. Compact EGR Cooler Assembly for Light-Duty Applications
(Source: Pierburg)
The EGR cooler in Figure 9, intended for light-duty applications, is made from die cast aluminum [Breuer 2007]. The exhaust gas follows a U-shaped flow pattern through the cooler shell and past the fins. The cooler shell is surrounded by engine coolant. This compact design is also very efficient, with heat transfer coefficients on the order of 3000 W/m2K on the coolant side, and on the order of 300 W/m2K in the gas. High heat transfer rates are also stimulated by the use of aluminum, which has a significantly higher heat conductivity than stainless steel.
Two-Stage Cooling. The practical low temperature limit to which an EGR cooler can cool the recirculated exhaust gas will be somewhat higher than the inlet temperature of the cooling medium. For an EGR cooler using engine coolant as a cooling medium, this temperature will be limited by the engine coolant temperature—usually in the range of 70-90°C. If lower EGR temperatures are required, a second cooler that uses ambient air as a cooling medium would be required. This approach—taken by International on some of their US 2007 engines and by Scania for its Euro V engines—presents some challenges such as minimizing the effects of condensed water to prevent corrosion and freezing.
34
Cooler Bypass. Cooling EGR may not always be desirable. For instance, in cold weather conditions where EGR is cooled below the dew point temperature, condensate may form and mix with exhaust containing sulfur and nitrogen compounds. The mixture of condensate and exhaust can produce acids that could be corrosive to components of the EGR system as well as other parts of the engine. Condensation of sulfur species in EGR coolers and the associated corrosion issues have been the subject of a number of studies [McKinley 1997][Kreso 1998b].
Some designs allow for bypassing the EGR cooler in cold temperature as well as at some driving conditions, such as idle or no load. This practice has often improved idle/no load and part load fuel economy, as well as reducing HC and CO emissions. It is also aimed at reducing the formation of acidic condensate that may impair engine components durability. A bypass arrangement also allows better control of EGR temperature by allowing for the mixing of different proportions of cooled and uncooled EGR. A cooler core with an integrated bypass passage is shown in Figure 10 [Beck 2007]. A flap at the inlet of the cooler directs EGR to either flow through the cooling passages or the bypass passage.
Figure 10. EGR Cooler With Integrated Bypass Passage
EGR coolers can be subject to considerable thermal stress from the high heat load. To ensure a long service life, the housing structures of these coolers can be fitted with an expansion joint, such as an expansion bead or a bellows structure, to provide axial compensation.
Fouling. Fouling of the EGR cooler is a major concern because it contributes to lower cooler effectiveness, as well as increased pressure loss. Experiments conducted on prototype coolers have shown that effectiveness degradation is usually limited to the first 20 to 30 hours of use. The most rapid drop of cooler effectiveness occurs with the clean cooler, in the initial hours of operation (this is also apparent from Figure 7 and Figure 11).
Fouling occurs primarily as a result of the deposition of diesel particulate matter, as well as condensed and/or pyrolysed hydrocarbons. Fouling tends to be more severe in the presence of “heavy wet PM”, which is more common at low NOx engine calibrations [Hoard 2007]. The contaminants are deposited on the walls largely due to thermophoretically augmented convective diffusion. Owing to the insulation effect of the deposit layer, the thermophoretic effect levels off when the deposit builds up, leading to a
35

falling rate of deposition. The resistance to heat transfer caused by fouling will usually reach a steady-state value for which empirical correlations exist. One such correlation is [Grillot 1997]:
(2)R = 1.094 Cpart V-1.14 ((Tg - Ts)/Tg)0.7
where:R - steady state fouling heat transfer resistance, m2K/WCpart - particle concentration, g/m3
V - gas flow velocity, m/sTg - gas temperature, KTs - surface temperature, K.
A number of approaches can be taken to minimize the effects of fouling including the selection of appropriate geometries that inhibit excessive accumulation of fouling material and adding extra capacity that is intended to be lost to fouling during service of the cooler. Increasing flow velocity through the cooler and lowering the temperature difference between the gas and the heat exchanger surface—as suggested by Equation (2)—may also be used to minimize fouling.
An effective measure to control fouling is to reduce the concentration of particles and other components in the EGR that may accumulate in the heat exchanger. For engines equipped with a diesel particulate filter (DPF), an LPL EGR configuration can be used, where clean exhaust gas is recirculated from the outlet side of the filter (this approach was taken, for example, in 2007 Caterpillar ACERT onroad engines). However, fouling may remain a problem for engines that recirculate exhaust gas from the exhaust manifold. While a particulate filter could be placed in the EGR line upstream of the cooler, the problems of plugging and keeping the filter clean present a significant challenge.
A more practical approach is to insert a diesel oxidation catalyst (DOC) into the EGR line upstream of the cooler. While not providing the same level of fouling protection as a filter, the catalyst can significantly reduce degradation of heat transfer effectiveness in an EGR cooler, as illustrated in Figure 11 [Tyo 2007][Hoard 2007]. The cooler effectiveness data was collected over an engine cycle specially designed to test EGR cooler fouling. The DOC can also provide an additional benefit of protecting the EGR valve from sticking.
36

Figure 11. Effect of DOC on Effectiveness of EGR Cooler
ECAT: With DOC inserted upstream of the cooler
The DOC approach has been adopted by International in some of its 2007 engines, most notably the 6.4 liter used in such applications as 2007 and later Ford pick-up trucks. The catalyst utilizes a metallic substrate to minimize potential adverse effects to the engine in case of substrate failure.
37
APPENDIX D
NAVISTAR ENGINE SPECIFICATIONS
ENGINE: V8
DISPLACEMENT: 6.4L
MODEL YEAR: 2010
PROGRAM: 152
MAXIMUM POWER: 300hp @ 2600rpm
MAXIMUM TORRQUE: 650 ft-lbs @ 1800rpm
BORE: 98mm
Diameter of holes bored into the engine block for cylinders
STROKE: 105mm
Action of piston travelling a full length of the cylinder in one direction
38

APPENDIX E
V152 INTAKE THROTTLE CONFIGURATION
Figure 3: V152 Intake Throttle view 1
39
Valve EGR

Figure 4: V152 Intake Throttle view 2
• Supplier: Pierburg • Orifice
– Diameter: 69.8mm• Valve
– Electronically controlled– Diameter: 68mm
• Flow Requirements– Max. Flow Air (Throttle Plate in openposition): 57lb/min @ 35KPa– Max. Flow Air (Throttle Plate in closed position): 6 +/- 0.9 g/s @ 60KPa– Max. Charge Air Inlet Temp. : 40ºF over Ambient– Valve Bore Leakage to Ambient: Less than 20cc/min @ 60 Kpa
• Pressure– Max. Differential Pressure to Ambient: 291KPa (Absolute)
• Basic Electrical Requirements– Nominal Operating Voltage: 12V
40
EGR
Air Cooler
Distribution
Thrott
Duct
Manifold Mixer

– Max. Operating Voltage: 16V– Min. Operating Voltage: 9V– Max. Operating Current: 2A
41

APPENDIX F
NAVISTAR V8 ENGINE SCHEMATIC
EGR and Intake Throttle • A portion of the Exhaust is directed through the EGR cooler and then EGR valve towards
the intake Manifold mixer• It is mixed with air that is cooled by the intercooler prior to entering ITH• The mixture is then inducted into the Combustion chamber
Intercooler• Decreases air intake temp which increases density• Higher density is required for more air + fuel to be combusted per engine cycle
Equations42

V :Velocity
A :cross sectional Area
mdot ( th ) : theoreticalmass flow rate
Cd :DischargeCoefficient
43


