including Admissions Data for 2011/12 For University Council on 15 th February 2012 Dr. Patrick Geoghegan Senior Lecturer February 2012 Trinity College Dublin Senior Lecturer’s Annual Report 2010/11
Transcript
including Admissions Data for 2011/12
For University Council on 15th February 2012
Dr. Patrick Geoghegan
Senior Lecturer February 2012
Trinity College Dublin
Senior Lecturer’s Annual Report 2010/11
Senior Lecturer’s Annual Report 2010/11 i
CONTENTS
Page
I. Introduction and Overview 1 Introduction 1 The Role of the Senior Lecturer/Dean of Undergraduate Studies 1 Undergraduate Studies Committee 1 New Course Proposals 2 Student Cases 3 Summary of Admissions Data 3 Nationality of New Entrants 3 Ireland, Northern Ireland and Great Britain 3 Why Students Choose Trinity 4
II. Applications and Admissions 2011 5
Student Applications and Admissions 5 Entry to Medicine 6 Entrance Exhibitions 7 Matriculation Examination 8 Alternative Admission Routes and Access Initiatives 8 Mature Students Office 13 New Entrant CAO Preferences 14 New Entrant Nationality Data 15 Total CAO and Direct entry registered students 2011 16 New Entrants’ Survey 2011 16 School Liaison Activities 18
III. Student Population 22
IV. Academic Staff 25
New Academic Appointments 24 Staff/Student Ratios 24 The Provost’s Teaching Awards Scheme 25
V. Academic Progress 26 Junior Freshman Students successfully Completing the Year 26 Student Cases 26 Students Off-books 27 Examinations 27 Courts of First Appeal and Academic Appeals 28 Foundation Scholarship Examination 29 External Examiners 29 Commencements, Firsts and Gold Medal Awards 30 Distribution of Grades Achieved at Degree Examinations 2010 31 Diploma and Certificate Award Ceremonies 32
Senior Lecturer’s Annual Report 2010/11 ii
VI. Undergraduate Course Developments 33 Undergraduate Courses Approved/Discontinued during 2010/11 33
VII. Undergraduate Academic Developments 34 Academic Year Structure 34 The Broad Curriculum 34 The Bologna Process 36 Undergraduate Student Retention 37
Senior Lecturer’s Annual Report 2010/11 iii
LIST OF FIGURES AND TABLES CONTAINED IN THE MAIN REPORT
FIGURES
Page Figure 1 Ratio of First Preference Applications to Quotas 2011, 2010, 2009 5 Figure 2 First Preference applications and numbers registered 2011, 2010, 2009 6 Figure 3 Entrance Exhibition Awards 2011, 2010, 2009 8 Figure 4 New Entrant Data – analysis of preference of registered course 14 Figure 5 Admissions Preference Data – number of students registered in each faculty according to CAO preference 14 Figure 6 Admissions Preference Data – number in each faculty, according to CAO reference, as percentage of total new entrants in each faculty 15 Figure 7 Survey of undergraduate new entrants 2011, 2010, 2009 17 Figure 8 Geographical distribution of student population 2010/11 22 Figure 9 Gender breakdown of student population 2010/11 22 Figure 10(a) Percentage of students by category 2010/11 23 Figure 10(b) Percentage of postgraduate students by category 2010/11 23 Figure 11 Reasons for students going off-books 2010/11, 2009/10, 2008/09 27 Figure 12 Foundation and Non-Foundation Scholarships Awarded 2011, 2010, 2009 29 Figure 13 First Class Degrees and Gold Medals 2010/11, 2009/10, 2008/09 30 Figure 14 Gold Medals as a percentage of First Class Degrees awarded by each Faculty 2010/11 31
TABLES Table 1 Minimum scores required for Entry to Medicine 2011-2009 7 Table 2 TCD Matriculation Examination 2011-2008 8 Table 3 Number of applicants with a disability, eligible applicants, offers and registered students 2011, 2010, 2009 10 Table 4 Number of admissions to College through Trinity Access Programmes 2011, 2010, 2009 13 Table 5 Total CAO and direct entry registered students 16 Table 6 Profile of new entrant respondents 16 Table 7 Information sources on Trinity College 17 Table 8 Suggested developments 18 Table 9 New academic appointments 2010/11 and 2009/10 24 Table 10 Breakdown of number of decision memoranda issued 26 Table 11 Breakdown of Examination Sittings 27 Table 12(a) Number of cases coming to Courts of First Appeal 28 Table 12(b) Number of cases coming to Academic Appeals Committee 29 Table 13 First Class Degrees & Gold Medals 2010/11, 2009/10, 2008/09 30 Table 14 First Class Degrees & Gold Medals by Faculty 2010/11 30 Table 15 First Class Honor degree distribution per faculty 31 Table 16 Diploma and Certificate Awards 2010 32
Senior Lecturer’s Annual Report 2010/11 iv
Table 17 Undergraduate Courses Approved/Discontinued during 2010/11 33 Table 18 Summary by cohort 2001/02 – 2006/07 cohorts 38 Table 19 Comparison of 2006/07 and 2005/06 new entrant cohorts 38 Table 20 2006/07 and 2005/06 cohorts – Faculty comparison 39
Senior Lecturer’s Annual Report 2010/11 v
APPENDICES
Appendix A Page
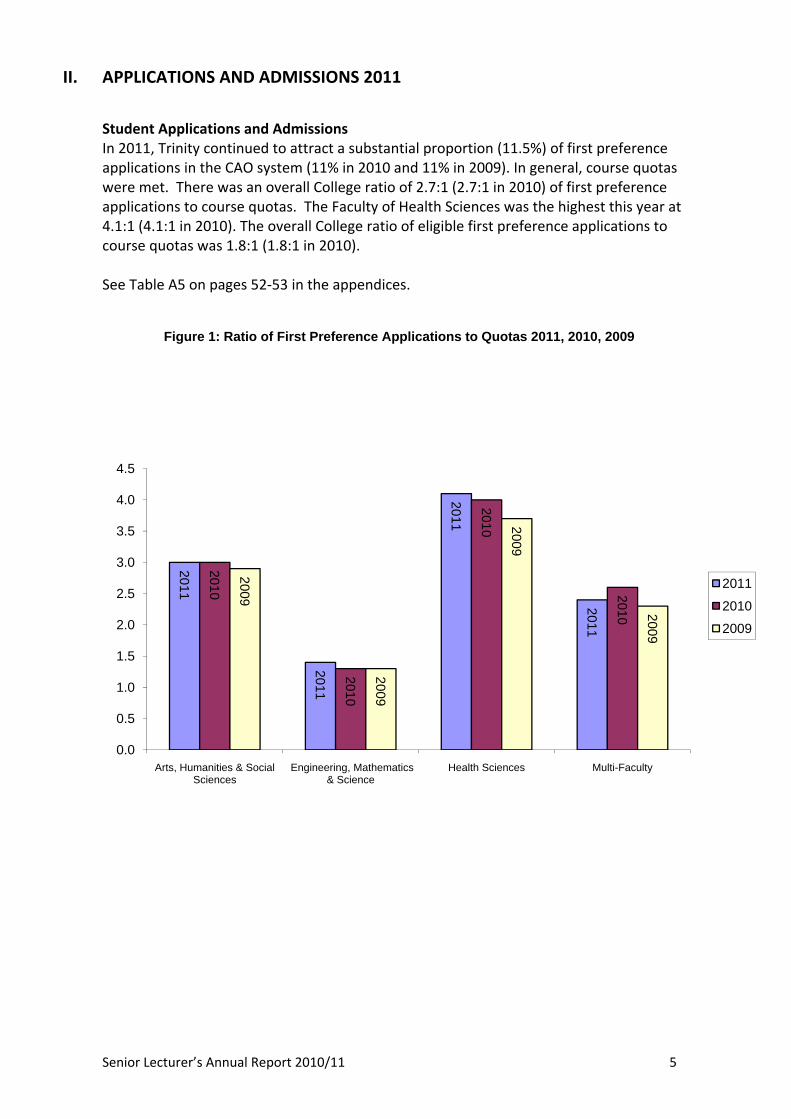
1 Applications Figure A1 Total number of CAO applications to full‐time undergraduate degree Courses in TCD (all preferences and first preferences) 2011, 2010, 2009 43 Figure A2 Total number of CAO applicants to all universities 2011, 2010, 2009 43 Figure A3 Total number of First Preference Applications to Universities 44 Figure A4 Ratio of CAO applications (all preferences) to quota 2011, 2010, 2009 44
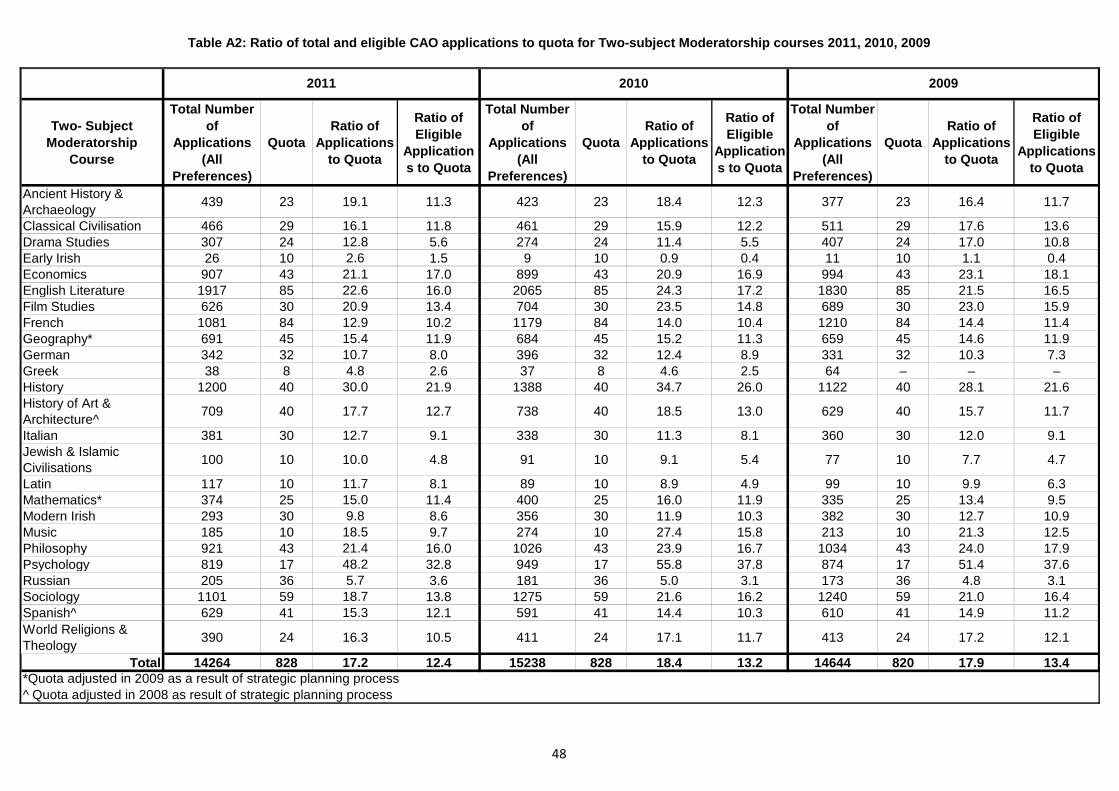
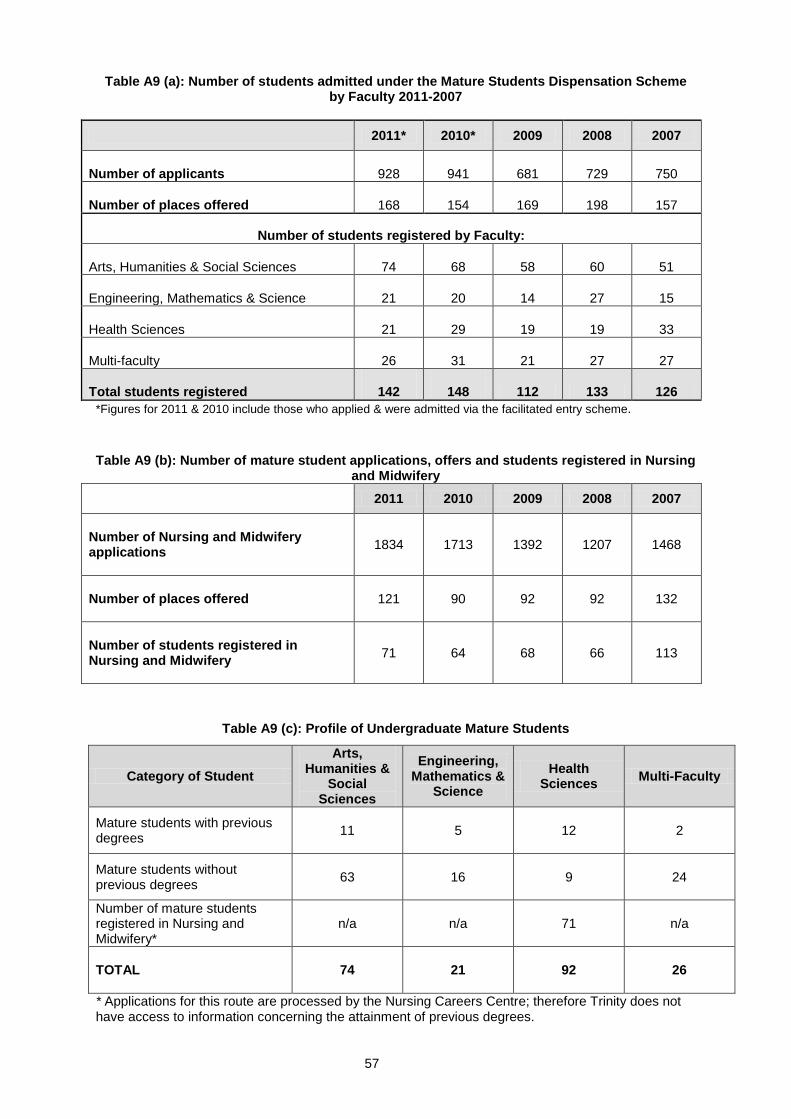
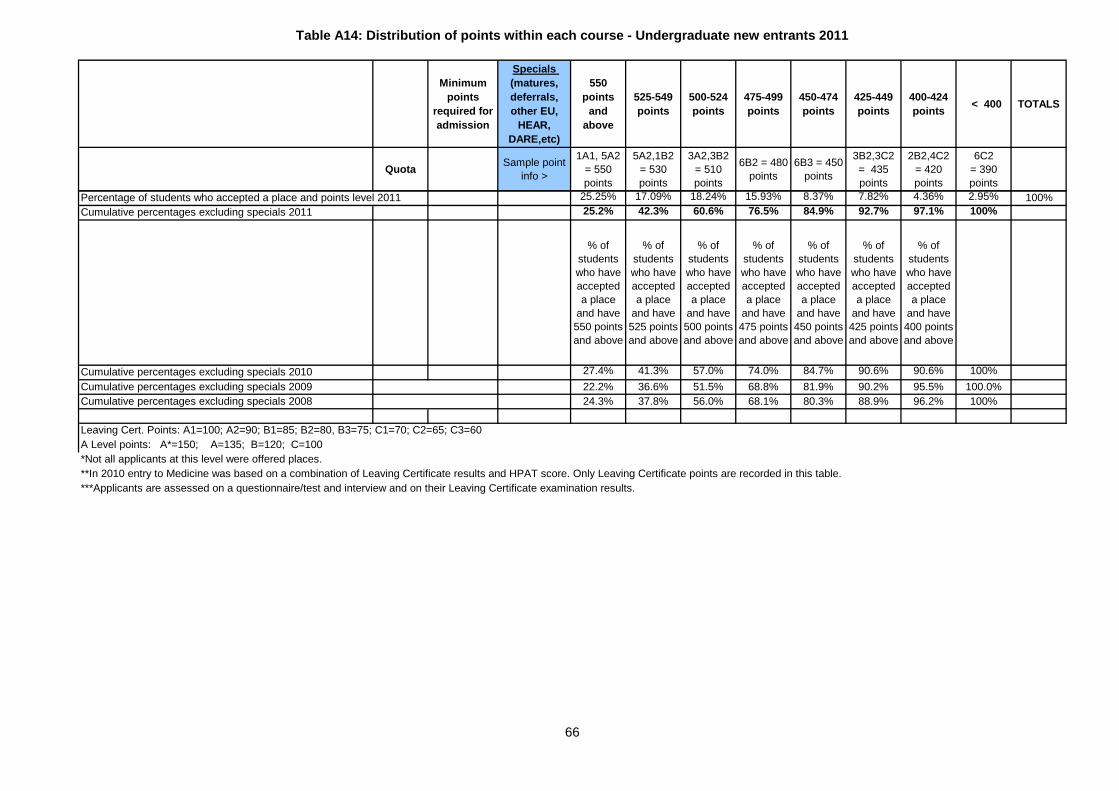
2 Admissions Table A1 Ratio of total and eligible CAO applications to quota for 2011, 2010, 2009 46 Table A2 Ratio of total and eligible CAO applications to quota for Two‐subject Moderatorship courses 2011, 2010, 2009 48 Table A3 Total number of applications: direct entry courses 2011, 2010, 2009 49 Table A4 Analysis of undergraduate new entrants by course preference 2011 50 Table A5 CAO first preference applications: quotas, points number registered 2011, 2010, 2009 52 Table A6 CAO first preference applications: quotas, points, number registered Two‐subject Moderatorship courses 2011, 2010, 2009 54 Table A7 Total number of CAO applicants to universities, DIT, other ITs, Colleges of Education and private colleges (all preferences) 2011, 2010, 2009 55 Table A8 Total number of First Preference applications to Universities 2011, 2010, 2009 56 Table A9(a) Number of students admitted under the Mature Student Dispensation Scheme by faculty 2011‐2007 57 Table A9(b) Number of mature student applications, offers and students registered in Nursing 57 Table A9(c) Profile of Undergraduate Mature Students 57 Table A10(a) Profile of Undergraduate new entrants by key access criteria per Faculty 2011/12 58 Table A10(b) Analysis of new entrants registered with the Disability Service by Faculty 2011/12 58 Table A11(a) Courses not meeting quota in 2011 due to insufficient eligible applications 59 Table A11(b) Courses not meeting quota in 2010 due to insufficient eligible applications 60 Table A12 Percentage rate of acceptances to offers 2011‐2007 (CAO round 1) 61 Table A13 Percentage rate of acceptances to offers TSM courses 2011‐2007 (CAO round 1) 63 Table A14 Distribution of points within each course: undergraduate new entrants 2011 64 Table A15 Distribution of points within each TSM course: undergraduate new entrants 2011 67 Table A16 Two subject Moderatorship course (TR001): 2011 final minimum entry
Senior Lecturer’s Annual Report 2010/11 vi
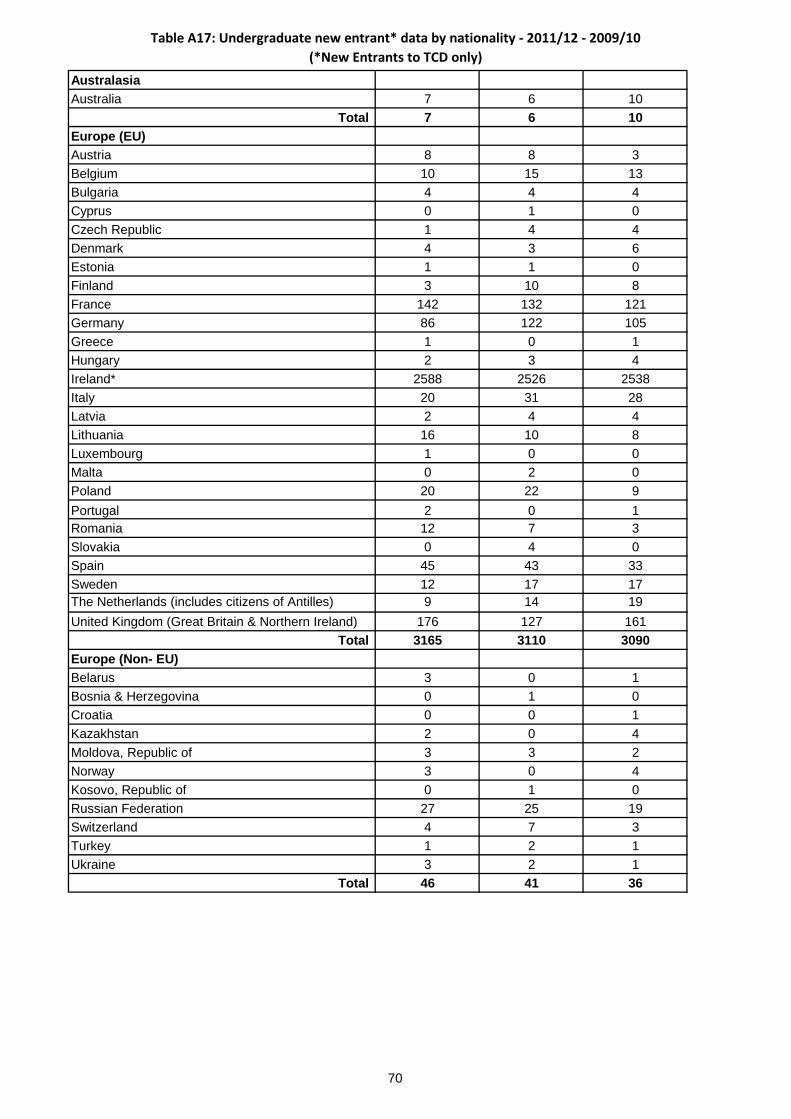
Levels 68 Table A17 Undergraduate new entrant data by nationality: 2011/12 – 2009/10 69 Table A18 Distribution of 2011/12 Undergraduate New Entrants by Province and County of home address 72 Table A19(a) Undergraduate Non EU new Entrant data by course: 2011/12‐2009/10 73 Table A19(b) Undergraduate Non EU new Entrant data by course and Gender: 2011/12 – 2009/10 74 Table A20 Repeated survey of undergraduate new entrants 2011, 2009, 2008 75
Appendix B Student Population Table B1 Geographical distribution of the student body based on nationality 2010/11 76 Table B2 Student Numbers 2010/11 – 2005/06 76
Appendix C Academic Staff Table C1(a) Appointments by faculty 2010/11 77 Table C1(b) Appointments by faculty 2009/10 77 Table C2(a) Appointments by qualification 2010/11 78 Table C2(b) Appointments by qualification 2009/10 78 Table C3(a) Appointments by gender 2010/11 79 Table C3(b) Appointments by gender 2009/10 79 Table C4(a‐d) Staff/student ratios 80
Appendix D Academic Progress Table D1 Junior Freshman full‐time degree students successfully completing The year 2010/11 – 2008/09 85 Table D2 Foundation and Non‐Foundation scholarships awarded by course 2011, 2010, 2009 87 Table D3 External Examiners for undergraduate courses appointed to examine in 2010/11 88 Table D4 Degrees conferred 2010 ‐ 2001 89 Table D5 Summary of grades achieved at undergraduate honors degree Examinations in 2010/11 – 2005/06 90 Table D6 Distribution of grades achieved by course at undergraduate degree examinations in 2010/11 91
Appendix E Broad Curriculum Table E1 Broad Curriculum Cross‐Faculty courses 2010/11 93 Table E2 Broad Curriculum Cross‐Faculty courses Retention Rates 2010/11 – 2007/08 94 Appendix F Academic Year Structure Table F1 Academic Year Structure 2011 / 2012 95
Senior Lecturer’s Annual Report 2010/11 vii
Appendix G Gold Medals Table G1 Recommended Criteria for the Award of a Gold Medal 96 Appendix H Undergraduate Student Retention Table H1 CAO points Irish new entrants who withdrew from 2004/05‐2006/07 cohorts 98 Table H2 2006/07 cohort – Standing and year of withdrawal 98
Senior Lecturer’s Annual Report 2010/11 1
Senior Lecturer’s Annual Report 2010/11
I. INTRODUCTION AND OVERVIEW Introduction This is the sixteenth Senior Lecturer’s Annual Report to the University Council, providing data on applications and the admission of undergraduate students, and developments in the area of undergraduate studies. The report provides the University Council, and the wider College community, with the statistical information needed to make informed policy decisions about undergraduate education in the College. It also assists in the process of review and evaluation. Statistical data covers the period 2010/11, and admissions data covers 2011/12. The Role of the Senior Lecturer/Dean of Undergraduate Studies The Senior Lecturer is the academic officer with responsibility for admissions, as well as for the progression and examination of undergraduate students. The Senior Lecturer is administratively supported by staff in the Office of the Vice‐Provost. Arising out of the review of the Office of the Vice‐Provost, it was agreed at Council in October 2011 that in order to provide clarity about the role and responsibilities, the Senior Lecturer may also be described as the Dean of Undergraduate Studies when exercising functions relating to undergraduate students (CL/11‐12/035). Undergraduate Studies Committee
The Undergraduate Studies Committee (USC) is a sub‐committee of the University Council. It was established in October 2008, and amalgamates the work of the old Undergraduate Teaching and Learning Committee, and the Centre for Academic Practice and Student Learning Committee. The committee is chaired by the Senior Lecturer, following a recommendation of the Review Taskforce which was approved by Council and Board in October 2010. Prior to that it was chaired by the Vice‐Provost/Chief Academic Officer, and the VP/CAO chaired the first meeting of USC in 2010/11. The membership and terms of reference of the committee can be found online at: www.tcd.ie/vpcao/council/undergraduate‐studies.php.
In 2010/11 there were six meetings of the Undergraduate Studies Committee. Minutes of these meetings are available via the Trinity College Local Home Page.1 During 2010/11 the Committee discussed a number of areas of interest to the general College community including:
• Maintaining the Distinctiveness of TCD’s Undergraduate Curriculum (UGS/10‐11/004). The Committee considered ways of safeguarding and promoting the Trinity undergraduate curriculum, and ensuring that it continues to provide a distinctive educational experience to students.
• Foundation Programme for International Students (UGS/10‐11/006). During the year there was discussion of the agreement signed with Study Group International to provide a foundation studies programme for international students.
• Plagiarism (USC/10‐11/031). The Committee discussed ways of raising awareness of what constitutes plagiarism across the student body, perhaps through web‐based tutorials or by developing easy‐to‐understand definitions of what it means and what the consequences are.
• The Academic Year Structure (UGS/10‐11/041). Responses were gathered from Schools and Course Offices during a consultation process, and the Committee then discussed the findings. It was agreed that study week would remain fixed across College, and that the current academic year structure should remain unchanged.
New Course Proposals In 2010/11 the Undergraduate Studies Committee discussed and recommended the following new course proposals, which were subsequently approved by the University Council.
• A specialist diploma in Stage Management and Technical Theatre (UGS/10‐11/012), to be launched 2012/13 (The award title of Professional Diploma was approved at a later date).
• A BSc in Education Studies was validated, to be delivered by Marino Institute of Education (UGS/10‐11/021)
• A five‐year integrated programme in Computer Science (UGS/10‐11/040), leading to the awards of a BA (Mod) and a Master in Computer Science.
• Five‐year integrated programmes in Engineering, and Engineering and Management (UGS/10‐11/049), leading to the awards of BAI and MAI (Studia).
In addition there were changes to some existing courses and programmes:
• The undergraduate programme, Computer Science, Linguistics and a Language, was renamed Computer Science and Language (UGS/10‐11/043).
• The Moderatorship in Philosophy and Political Science was discontinued (UGS/10‐11/024), as students can now take this combination under the Philosophy, Political Science, Economics and Sociology (PPES) programme. The last Junior Freshman cohort entered in 2011/12.
• Council also approved a proposal for graduate entry to the undergraduate degree in pharmacy (CL/10‐11/071).
Senior Lecturer’s Annual Report 2010/11 3
Student Cases The Senior Lecturer has responsibility for deciding on undergraduate student cases. In 2010/11 there were a total of 2,045 decision memoranda issued. This represents an increase of 38% since 2007/08 see Table 10. Summary of Admissions Data In 2011 TCD received 7,770 (or 11.5%) of first preference applications in the CAO system, an increase on recent years of 0.5%. In the mid‐1990s the figure was 17‐18%, although this declined to 12.4% by the end of the decade and has remained at approximately 11‐12% ever since.2 Council and Board was asked to note in 2000 that this decline was due to the removal of overseas applications from the CAO system, and the increase in the number of applications to private colleges. Of the 67,360 people who applied for Level 8 courses in Irish higher education institutions through the CAO in 2011, 18,437 listed TCD for one or more of their CAO course preferences (27%). Nationality of New Entrants In 2011 TCD admitted 3,548 students from Ireland and sixty‐seven other countries around the world (see Table A17). The majority of students are from Ireland (here defined as the Republic of Ireland) with 2,588 students, followed by the United Kingdom (Great Britain and Northern Ireland) with 176 students, the United States with 173 students, France with 142 students, Germany with 86 students, and Spain with 45 students. 577 students are from the EU (excluding Ireland), 383 students from the rest of the world. In percentage terms 73% of new entrants are from the Republic of Ireland, 16% from the rest of the EU, and 11% from the rest of the world. There has been a gradual increase in the international student body over the past fifteen years. In 1997/98 there were 12,736 registered students, of which 6.6% were from other parts of Europe, and 4.5% from the rest of the world. Of the 16 747 registered students in 2010/11, 12.2% were from Europe (not including Ireland) and 9.3% were from the rest of the world. The figures for new entrants correspond with the data for the geographical distribution for the entire student body in TCD (see Figure 8). Ireland, Northern Ireland, and Great Britain In the collection of statistical data it is sometimes difficult to distinguish between Northern Irish and Irish students, and between Northern Irish and British students, because the information collected relies heavily on stated nationality which does not always correspond to the information given for home address. This year an attempt was made to analyse the 2 See p.2 of the Senior Lecturer’s Annual Reports for 1995/96 and 1996/97 (www.tcd.ie/vpcao/council/senior‐lecturer‐reports.php). By 1999/00 the figure had dropped to 12.4% and the decline continued.
Senior Lecturer’s Annual Report 2010/11 4
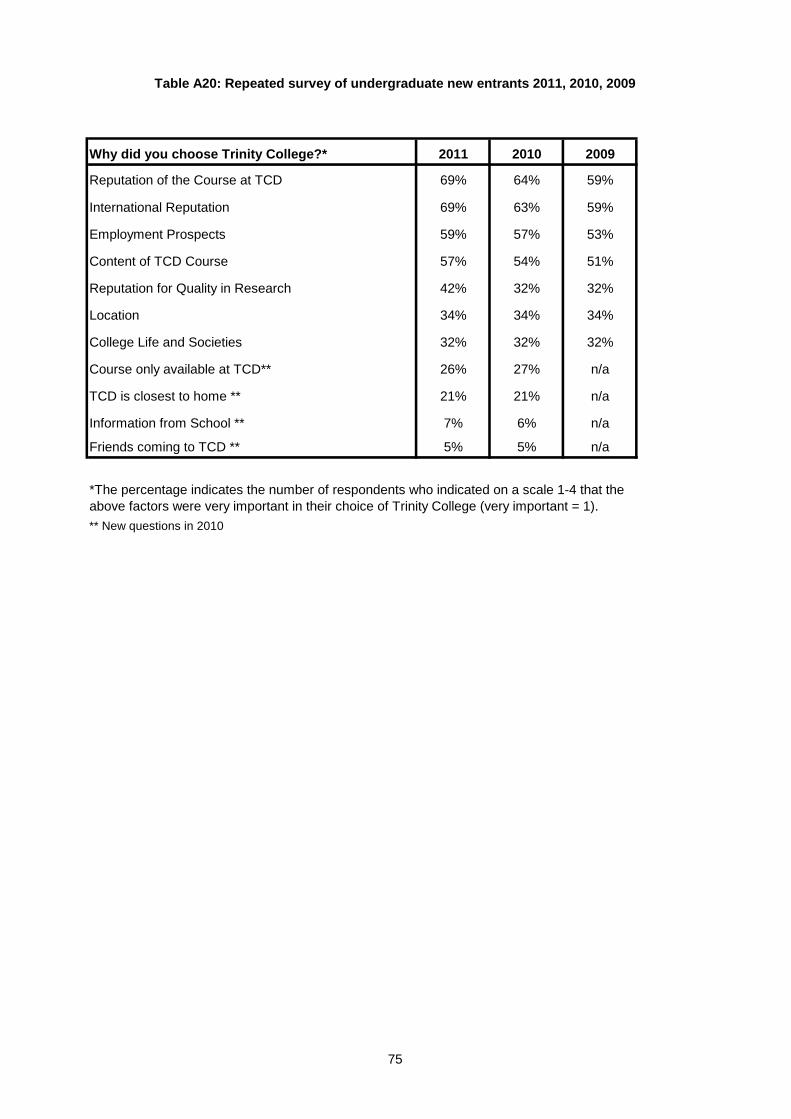
geographical distribution of new entrants from the thirty‐two counties using the information gathered of those who list home addresses on the island. Table A18 shows that of the 2,805 students who list a home address on this island: 1,423 (51%) are from Dublin; 734 (26%) from the rest of Leinster; 288 (10.2%) from Munster; 189 (6.7%) from Connaught; 109 (3.9%) from the Ulster counties of Donegal, Monaghan and Cavan; and 62 (2.2%) from Northern Ireland.3 Why Students Choose Trinity Each year new entrant students are asked to indicate on a scale of 1‐4 the most important factors they considered before choosing to apply to TCD (Figure 7). Once again the reputation of the course at Trinity is the most important factor (69%), alongside Trinity’s international reputation (69%); other factors such as Trinity’s research reputation (42%) are less significant. The TCD website is regarded as the most important source of information (81%), followed by the TCD prospectus (69%) and the TCD Open Day (41%) as shown on Table 7.4 In similar surveys conducted between 2000 and 2010 similar results were found. In 2001 it was noted that 58% of new entrant students indicated that Trinity’s reputation for quality in teaching was the most significant factor, and this remained the single most significant factor in subsequent years (at approximately 58‐59%). The phrasing of some of the questions was changed in 2009/10 but the evidence would suggest that ‘reputation of the course at Trinity’ is comparable to ‘reputation for quality in teaching’.
3 In 1996/97 there were 635 students from Northern Ireland in the entire student population (UG and PG) 4 The internet was identified as a significant factor in the third Senior Lecturer’s Annual Report, for 1997/98. On p. 5 it notes that 32% had consulted ‘Trinity world wide web, a surprisingly high number’ (www.tcd.ie/vpcao/council/senior‐lecturer‐reports.php). This had risen to 54% by 1999/00 and 74% by 2000/01.
Senior Lecturer’s Annual Report 2010/11 5
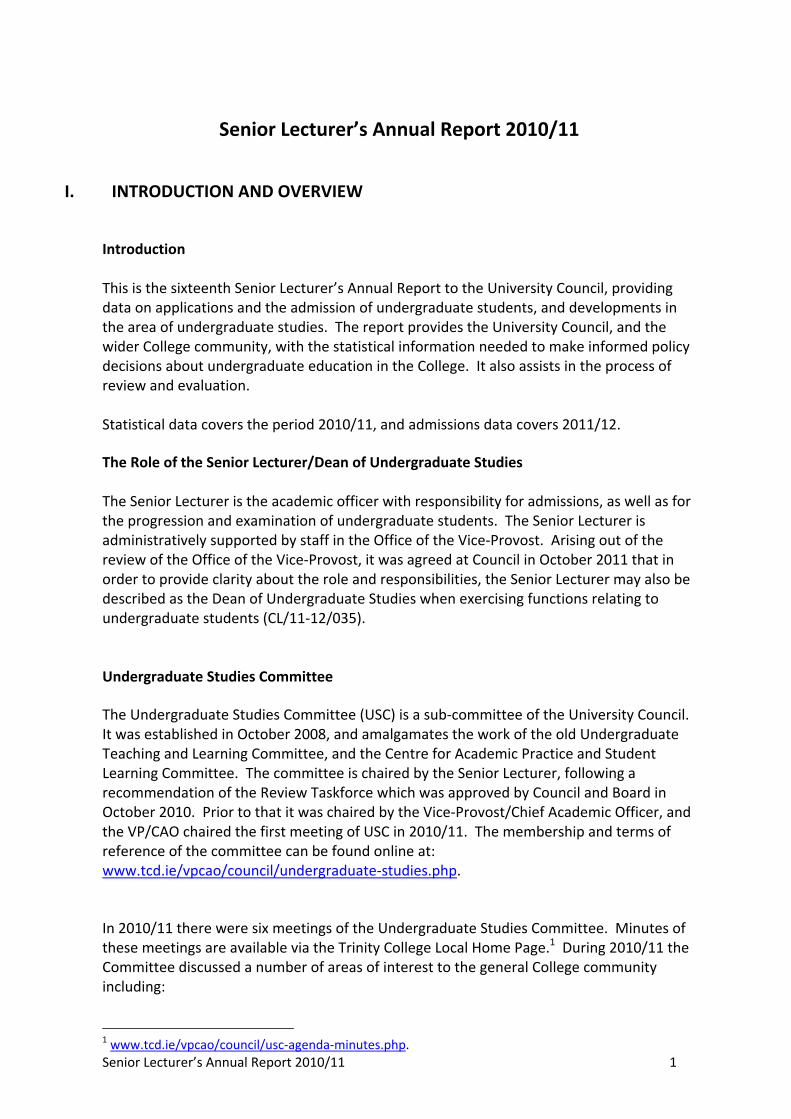
II. APPLICATIONS AND ADMISSIONS 2011 Student Applications and Admissions In 2011, Trinity continued to attract a substantial proportion (11.5%) of first preference applications in the CAO system (11% in 2010 and 11% in 2009). In general, course quotas were met. There was an overall College ratio of 2.7:1 (2.7:1 in 2010) of first preference applications to course quotas. The Faculty of Health Sciences was the highest this year at 4.1:1 (4.1:1 in 2010). The overall College ratio of eligible first preference applications to course quotas was 1.8:1 (1.8:1 in 2010). See Table A5 on pages 52‐53 in the appendices.
Figure 1: Ratio of First Preference Applications to Quotas 2011, 2010, 2009
2011
2011
2011
2011
2010
2010
2010
2010
2009
2009
2009
2009
0.0
0.5
1.0
1.5
2.0
2.5
3.0
3.5
4.0
4.5
Arts, Humanities & Social Sciences
Engineering, Mathematics & Science
Health Sciences Multi-Faculty
2011
2010
2009
Senior Lecturer’s Annual Report 2010/11 6
Figure 2: First Preference applications and numbers registered 2011, 2010, 2009
927 951 955 753 735 733 621 639 629 488 444 446
2879 2844 2795
1115 1026 1024
2533 2526 2338
1243 1283 1135
0
500
1000
1500
2000
2500
3000
3500
4000
2011
2010
2009
2011
2010
2009
2011
2010
2009
2011
2010
2009
Arts, Humanities & Social Sciences
Engineering, Mathematics & Science
Health Sciences Multi-Faculty
Number of registered JF students (excluding repeat year students and non-EU) Number of 1st preferences
Out of a total of 60 undergraduate full‐time single and joint honor CAO courses (excluding TSM), six (10%) did not meet their quota because of insufficient eligible applications, and of 25 TSM subjects, three (12%) did not meet their quota for the same reason (see Table A11 (a) on page 59 in the appendices). For more detailed information on applications and admissions see Appendix A. Entry to Medicine Following a recommendation of the ‘Report of the Working Group on Undergraduate Medical Education and Training 2006’ (the Fottrell Report) an additional admission test was introduced for students seeking admission to undergraduate Medicine. The test, Health Professionals Admissions Test‐Ireland (HPAT‐Ireland), measures a candidate’s logical reasoning and problem solving skills as well as non‐verbal reasoning. The test is held in February each year and is administered by ACER (Australian Council for Educational Research); a company appointed following an international tendering process. The allocation of places for Medicine is determined on the basis of a weighted combination of the Leaving Certificate Examination (LCE) score and the HPAT‐Ireland score. Applicants to Medicine who achieve above 550 LCE points are credited with 550 points, plus an additional 1 point for every 5 LCE points attained, e.g. students who attain 600 LCE points are credited with 560 points. In addition, applicants may attain up to 300 points from the HPAT test, resulting in a combined maximum of 860 points. The scaling down of points in excess of 550 is intended to strike a balance between the perceived pressures on students to achieve maximum grades in the Leaving Certificate Examination while at the same time recognising excellence when it has been achieved.
Senior Lecturer’s Annual Report 2010/11 7
The first HPAT‐Ireland test took place in February 2009. In 2008, students were required to present a minimum of 580 points to gain admission to Medicine. The table below shows the minimum scores required for entry since the introduction of the HPAT.
Table1: Minimum scores required for Entry to Medicine 2011‐2009 2011 2010 2009 No. of Places 123 109 109 Min. Leaving Cert. score 535 540 530 Min. HPAT-Ireland score 181 172 160
Entrance Exhibitions 2011 Four hundred and twenty (420) students were awarded an entrance exhibition in 2011 representing 14.8% of the EU Junior Freshman class for 2011/12. Of this figure, 34 were A‐level students and 8 students held other EU qualifications. A total of 57,532 pupils sat the Leaving Certificate (Established and Vocational Programme) examination in 2011. Of those that applied to the CAO, 1,140 achieved 560 points or more, and 423 (37%) of these students accepted a place at Trinity College. However, not all of these subsequently registered and, therefore, the number of Leaving Certificate students receiving the entrance award is lower than the number who originally accepted a place. Sixty‐one (61%) per cent of entrance exhibitioners were female in 2011 (61% in 2010 and 61% in 2009). Receptions for all entrance exhibitioners, their parents/guardians and school principals were held over three evenings on 28‐30 November 2011. Entrance Exhibitions 2010 On the basis of public examination results, entrance exhibitions are awarded to EU new entrants to full‐time undergraduate degree programmes who achieve a minimum of 560 points. Four hundred and twenty‐nine (429) students were awarded an entrance exhibition in 2010 representing 15.5% of the EU Junior Freshman class for 2010/11. A total of 54,481 pupils sat the Leaving Certificate (Established and Vocational Programme) examination in 2010. Of those that applied to the CAO 1,160 achieved 560 points or more and 458 (39%) of these students accepted a place at Trinity College. Entrance exhibitions were also awarded to 44 A‐level students and 9 students with other EU qualifications. Sixty‐one (61%) per cent of entrance exhibitioners were female in 2010 (61% in 2009 and 57% in 2008). Receptions for all entrance exhibitioners, their parents/guardians and school principals were held over three evenings in November 2010.
See Tables A14 and A15 on pages 64‐67 in the appendices for further information on points at entry by course. Matriculation Examination A matriculation examination is held in Trinity College every year, usually in March or April. Since 2003, only two subjects are examined, namely, Geology and Biblical Studies. Eighteen (18) candidates presented for the Geology examination in 2011 (12 in 2010) and six candidates presented for Biblical Studies this year (5 in 2010). Table 2: TCD Matriculation Examination 2011 ‐ 2008
Alternative Admission Routes and Access Initiatives Alternative admissions and access applications to the university are categorised into three principal types: (a) students with a disability, (b) mature students applying for admission under the mature student dispensation scheme, and (c) socio‐economically disadvantaged students. In addition to applying through the CAO, applicants in these three groups are invited to submit separate applications directly to the university. College’s Strategic Plan is committed to increasing the number of students from under‐represented groups to undergraduate programmes. The Strategic Plan (2009‐2014) makes a commitment to increase the proportion of students targeted from under‐represented groups from 15% to 22% of CAO new entrants by 2013. In May 2009 the University Council approved the recommendations set out in the Access Plan 2009 ‐ 2013. Achieving the set
Senior Lecturer’s Annual Report 2010/11 9
targets is dependent on commitments in the ‘National Plan for Equity of Access to Higher Education 2008‐2013’ and on being able to maintain adequate resourcing of student supports. In 2011, a total of 524 (468 in 2010) students from under represented groups registered on undergraduate degree programmes, representing 18.8% of the CAO intake. Almost forty‐one percent (40.6%) of these are mature students. Further analysis of the breakdown of undergraduate new entrants, by key access criteria, in each Faculty may be found in Table A10(a) on page 58. (a) Students with a Disability
The Disability Access Route to Education (DARE) scheme was formally launched in 2010. Thirteen (13) third‐level institutions currently participate in the scheme. Applicants who disclose that they have a disability on the CAO application form are required to provide additional information and certain documentation to the CAO. Applicants are assessed for eligibility for the scheme and, if deemed eligible, they may be granted a concession on points, if required. It should be noted that many applicants with a disability do not disclose this information on the CAO form and, consequently, the number of registered new entrants with a disability tends to be greater than the numbers stated in this report. Forty‐four (44) students, now registered, either, disclosed a disability via their CAO applications but did not go through the DARE process, or were deemed ineligible under the DARE process and achieved a place on full points. Twenty‐five (25) students whilst eligible for DARE achieved a place on full points. In addition, 31 students declared a disability after College registration, bringing the total to 211 new entrants registered with the Disability Service, as at 26th October 2011.
Details concerning the distribution of undergraduate new entrants with a disability across faculties may be found in Table A10(b) on page 58.
Senior Lecturer’s Annual Report 2010/11 10
Table 3: Number of applicants with a disability, eligible applicants, offers and registered students 2011, 2010, 2009
Applications 2011 % 2010 % 2009 %
Total number of applicants to TCD who disclosed a disability on the CAO application form
990 912 687
Number of applicants who completed ‘DARE supplementary process’
703 71% 568 62% 646 94%
Number of applicants eligible for DARE consideration on grounds of disability
413 59% 271 47% 156 23%
Total number of new entrants with disabilities entering on full points
69 89 91
Number of DARE eligible entrants who entered on full points ^
25 19 31
Number of new entrants entering via DARE 72 45 32
Total number of registered students disclosing through CAO as at 26 October
141 134 123
Number of students who declared disability after college registration as at 26 October 2011*
31 18% 41 23% 88 42%
Total number of students registered with a disability as at 26 October 2011
172 175 211
^ This is a sub‐section of total number of new students entering on full points. *Percentage calculated against the total for 2011 undergraduate students registered with the students registered with the service as at 26 October 2011
(b) Students Applying for Admission under the Mature Student Dispensation Scheme
Applicants under this scheme must be over twenty‐three years of age and are assessed on the basis of their complete academic profile, taking into account work and life experience. In 2011, 928 mature applicants applied under the Mature Student Dispensation Scheme (941 in 2010), of whom 168 (18%) were offered places, and of these 142 (84%) subsequently registered. This figure, of 142, includes entrants progressing via the ‘facilitated entry’ scheme through the Trinity Access Programmes (TAP) Foundation and Partnership Courses for Mature Students. In 2011, there were 27 applications from mature students, through these routes, who were all were offered places and subsequently registered. These figures are also included in data provided by TAP and for further information please see details below provided in relation to the Foundation Course for Higher Education‐Mature Students and the Partnership Foundation Courses.
Mature students are also admitted to the undergraduate degrees in Nursing and Midwifery under the Mature Student Dispensation Scheme. Applicants to these
Senior Lecturer’s Annual Report 2010/11 11
courses are assessed externally by the Nursing Career Centre. Seventy‐one (71) mature students registered on degree courses in Nursing and Midwifery in 2011 (64 in 2010) Further details of students admitted under the Mature Student Dispensation Scheme and by the Nursing Career Centre, together with an indication of the trends in mature student applications and distributions across faculties, are shown in the comparative data in Table A9(b) on page 57.
(c) Socio‐economically disadvantaged students
(i) Post‐entry Progression Programme TAP has developed a range of post‐entry supports in response to recognised student needs. These include a variety of orientation programmes, academic supports including extra tuition, a laptop lending service, a Writing Resource Centre and Mathematics Help Room, and the TAP Studio – a designated study space equipped with IT resources. TAP also provides financial assistance and a supported accommodation scheme, as well as social and personal supports from dedicated TAP advisors. The development of the post‐entry programme means that students can now avail of a range of training sessions including: Child Protection Training, Listening Skills, CV Building and Presentation skills to aid them in their career planning. Students also have the opportunity to attend workshops given by companies such as Hume Brophy, Grant Thornton and Google. TAP also works closely with the Library and other support services in College including the Student Counselling Service, the Disability Service, the College Health Service, the Accommodation Office and the Tutorial Service.
(ii) The School and Community Outreach Links (SCOL) The School and Community Outreach Links initiative enables the involvement of Trinity College with schools and communities where there is little or no tradition of progression to third‐level. TAP is assisted by Schools in College each year in developing and delivering activities to over 40 primary and second‐level schools and a selection of community groups. Primary school activities begin with fifth class pupils and continue throughout the second‐level school cycle.
(iii) Concession on Points Young adults who are assessed through the Higher Education Access Route (HEAR), and are deemed as socio‐economically disadvantaged, are eligible for a concession on points for entry to an undergraduate degree and/or diploma courses. Applicants are assessed for eligibility on the basis of a multi‐indicator model that aims to assess educational disadvantage. These students must satisfy the minimum matriculation requirements for entry to their course of choice.
In 2011, 157 students entered College through this route (126 in 2010). This figure includes students from the TAP Foundation Course (Young Adults) and Liberties College Partnership Foundation Course. An increase in demand was notable this year across courses in the Faculties of Engineering, Mathematics and Science and Health Sciences. In particular, 2011 witnessed the first ever HEAR entrants to Earth Sciences and Nanoscience, Physics and Chemistry of Advanced Materials.
Senior Lecturer’s Annual Report 2010/11 12
Global admissions to HEAR increased by 37% in 2011, approximately 1400 students registered in sixteen higher education institutions. Further information about HEAR can be found at www.accesscollege.ie.
(iv) Foundation Course for Higher Education – Mature Students This one‐year foundation course is aimed at mature students from socio‐economically under‐represented groups who have not yet realised their full educational potential. Students who successfully complete the course are awarded a Certificate in Foundation Studies for Higher Education and are eligible for facilitated entry to College. To be eligible for a place students must achieve a minimum overall grade of 50%, although, for higher demand courses significantly higher grades are required; for example, Social Studies requires a minimum grade of 60%, whereas Law and Physiotherapy require a minimum grade of 65%. Places are allocated on the basis of academic merit and students must select up to five College courses on their CAO preference list.
Twenty‐six (26) students registered in 2010/11. Of these, 18 students completed the course and 16 progressed to undergraduate degree courses in TCD. Twenty‐five (25) students have registered on this foundation course for the 2011/12 academic year.
(v) Foundation Course for Higher Education – Young Adults This is a one‐year foundation course that caters for young adults (17‐21 years old), from under‐represented socio‐economic groups, who have demonstrated academic potential but who require an additional year of education to prepare for third‐level. It is open to applicants from schools linked to higher education access programmes. Twenty‐eight (28) students registered in 2010/11.
Students who successfully complete the course are awarded a Certificate in Foundation Studies for Higher Education and are eligible to compete for a place in College if they achieve a minimum overall grade 50% (65% for Law or 70% for specific courses in Health Sciences). In 2010/11, 25 of the 28 registered students completed the course and 23 progressed to undergraduate degree courses in TCD.
Twenty‐nine (29) students registered in September 2011 for the 2011/12 course.
(vi) Partnership Foundation Courses Originally approved as part of College’s efforts to meet the 15% quota of non‐traditional students in undergraduate courses (now revised upwards to a 22% target), an arrangement was entered into, in 2004/05, with three City of Dublin Vocational Education Committee (CDVEC) colleges, to develop and co‐deliver a Foundation Course in the Liberal Arts for access to a wide range of undergraduate courses. The CDVEC colleges involved are the Liberties College, Dublin 8; Pearse College, Dublin 12; and Plunket College, Dublin 9. The course was run on a pilot basis in 2004/05 and the CDVEC colleges, supported by Trinity College, successfully negotiated with the Further Education and Training Awards Council (FETAC) for accreditation within the National Framework of Qualifications (NFQ). In April 2011, University Council included CDVEC Rathmines in the partnership arrangement so students on their equivalent course can avail of progression opportunities.
Senior Lecturer’s Annual Report 2010/11 13
Twenty‐two (22) students from this scheme progressed to undergraduate courses in Trinity College in 2011 (21 in 2010). Sixty‐two (62) students registered in 2011 for the Partnership Foundation Courses: Liberties College (18) Pearse College (24) and Plunket College (20).
Table 4: Number of admissions to College through the Trinity Access Programmes
2011, 2010, 2009
*The four people cited as HEAR/DARE satisfied entry criteria for HEAR and DARE schemes and are being supported for different reasons by both offices. They were admitted under ‘concession on points’ but as they meet criteria for both schemes, we have noted the number separately. Mature Students Office The Mature Students Office, part of TAP, serves to encourage and support the access and integration of mature students into college life. This year two hundred and thirteen (213) mature students registered across all faculties in Trinity College (this figure includes nursing students). Supports for registered mature students include:
• A financial information morning in July • A four day Welcome Programme in early September • A Mature Student Resource Centre for private study • Drop in clinics providing advice and advocacy • Mid‐term review clinics • Social activities in conjunction with the Mature Student Society
The Mature Students’ Officer engages in extensive external liaison with Vocational Education Committees and Adult Education Centres, particularly in the Dublin, Border, Midlands and Western regions, to promote TCD, to outline the opportunities available to mature learners and to support the application process. One‐to‐one support for applicants is also available. A Mature Student Open Evening took place in January 2011. Due to the introduction of a two day Open Day programme the Mature Student Open Evening was replaced with an evening information seminar held on 12th January 2012.
Entry Route Number of Students 2011
Number of Students 2010
Number of Students 2009
Full points 34 30 17 Concession on points 84 62 44 HEAR / DARE* 4 Foundation Course – Mature Students 17 21 13 Foundation Course – Young Adults 23 23 22 CDVEC Colleges: - Liberties Liberal Arts
12
11
13
- Pearse College 6 4 2 - Plunket College 4 6 3 Total 184 157 114 Percentage Increase/Decrease on previous year: 17.2% 37.7% -17.4%
Senior Lecturer’s Annual Report 2010/11 14
New Entrant CAO Preferences
Analysis shows, in 2011, that 60% of new entrants were registered to their first preference CAO choice, with 14% and 8% registered to their second and third choice respectively. Students registering on courses which represented a lower preference (4‐10), accounted for 18% of new entrants. See Figures 4, 5 and 6 below and Table A4 on page 50 in the appendices. Figure 4: New Entrant Data – analysis of preference of registered course
Figure 5: Admissions Preference Data – number of students registered in each faculty according to CAO preference
0%
10%
20%
30%
40%
50%
60%
70%
Total Preferences
1st Preference
2nd Preference
3rd Preference
All Other Preferences
0%
5%
10%
15%
20%
25%
Faculty of Arts, Humanities & Social
Sciences
Faculty of Engineering, Mathematics
& Science
Faculty of Health Sciences Multi-Faculty
1st Preference
2nd Preference
3rd Preference
All Other Preferences
Senior Lecturer’s Annual Report 2010/11 15
Figure 6: Admissions Preference Data – number in each faculty, according to CAO preference, as a percentage of total new entrants in each faculty
0%
10%
20%
30%
40%
50%
60%
70%
Faculty of Arts, Humanities & Social Sciences
Faculty of Engineering, Mathematics &
Science
Faculty of Health Sciences Multi-Faculty
1st Preference
2nd Preference
3rd Preference
All Other Preferences
New Entrant Nationality Data In 2011, students entering full‐time undergraduate courses and programmes for visiting students came from 68 different countries. With the exception of Ireland the top five home countries, in order of the most student numbers, are United Kingdom (Great Britain and Northern Ireland) the United States, France, Germany and Spain. The top five countries in 2010 were the United States, United Kingdom (Great Britain and Northern Ireland), France, Germany and Spain. In the 2010/11 Senior Lecturer’s Annual Report the total figure of non‐Irish students specified was 902 representing almost 25% of the new entrant population. Given the date of publication of that report, figures for new entrants who registered as new entrants in the Hilary term were not included. When these are included the total number of non‐Irish new entrants in 2010/11 changes to 1,003 representing approximately 27.6% of the new entrant population. So far this year, 960 non‐Irish new entrants have registered, representing 26.8% of the current new entrant cohort. Full data on the year is not yet available but College has received applications from 186 students wishing to visit Trinity in Hilary term 2012 (Non‐EU Visiting: Semester Start‐up Hilary Term 73, Hilary Term (non‐Semester Start‐up) 65; Erasmus: 46 and EU Visiting: 2). The number of new‐entrants, classified as non‐EU for the purposes of fees, registered to full undergraduate degrees has increased from 99 students in 2010/11 to 114 in 2011/12 (Joint degree in Human Nutrition and Dietetics not included). Please see Table A17, A18, A19 (a) and A19 (b) on pages 69 to 74 for more detailed data in relation to new entrant students and their nationality profile.
Senior Lecturer’s Annual Report 2010/11 16
Total CAO and Direct entry registered students 2011 Table 5 below shows all new entrants to undergraduate courses in 2011/12. Table 5: Total CAO and direct entry registered students
New Entrants
2011/12 2010/11 2009/10 2008/09
Arts, Humanities, and Social Sciences (CAO)
927
951
955 844
Engineering, Mathematics and Science (CAO)
753
735 733 720
Health Science (CAO)
621
639 629 614
Multi Faculty CAO 488 444 446
391
Total CAO entry 2,789 2,769 2,763 2,569
Direct entry and Level 7 courses 791 866 790 758
Total CAO and Direct entry registered students
3,580
3,635 3,553 3,327
New Entrants’ Survey 2011 The annual new entrants’ survey is distributed to students of full‐time undergraduate degree programmes. Part‐time students, Erasmus and visiting students were not surveyed and the returns do not differentiate between students starting in the Junior Freshman year and those who were offered advanced entry. A total of 1,957 surveys were received representing approximately 70% of registered students coming through the CAO. Table 5 shows a profile of new entrants surveyed. Table 6: Profile of new entrant respondents
Nationality Category of Student Irish 87% School Leaver 90% Other EU 10% Mature Student 10% Outside EU 3% New entrant students were asked to indicate on a scale of 1 – 4 how important they considered a range of factors to be in choosing Trinity College. As illustrated in Figure 7, the reputation of the course at Trinity (69%), College’s international reputation (69%), employment prospects (59%), the content of the course at Trinity (57%), College’s research reputation (42%), College’s city location (34%), and the social life, sports and societies in Trinity (32%) were listed as the main reasons for choosing Trinity College. The remaining reasons were: The course is only offered at Trinity (26%), Trinity is closest to home (21%), information from the students’ schools (7%) and the student’s friends are coming to Trinity (5%).
Senior Lecturer’s Annual Report 2010/11 17
Figure 7: Survey of undergraduate new entrants, 2011, 2010, 2009
** New questions that were asked in 2010. Please see Table A20 on page 75 in the Appendices. The sources of information most consulted by entrants were the Trinity website (81%), the prospectus (69%) and the Open Day (41%). The majority of new entrants (65%) attended the Trinity College Open Day. Table 7: Information sources on Trinity College
Information Source Percentage of students who used this source
TCD Website 81%
TCD prospectus 69%
TCD Open Day 41%
Guidance Counsellor 30%
A friend 29%
Family 28%
Careers fair 22%
School visit 5%
Other website 4%
Other 3%
TCD Admissions Office 3%
0%
10%
20%
30%
40%
50%
60%
70%2011
2010
2009
Senior Lecturer’s Annual Report 2010/11 18
Students continue to use a variety of sources when researching their third‐level options and the fact that students will often name more than one information source as ‘most important’ suggests that students are extracting different information of equal value from different sources. The TCD website is regarded as the most important source of information about Trinity College (41%), followed by the TCD Prospectus (39%) and the TCD Open Day (27%). Other choices for the most important source were: guidance counsellors (12%), school visits (8%) and career fairs (4%). New entrants were also asked what other information/events Trinity should provide for second‐level students. The most popular new addition would be course specific information evenings (63%). In 2010, the second most popular option was “Open Day on Friday/Saturday instead of Wednesday”. Open Day for 2011 took place over Friday 2nd and Saturday 3rd December. Table 8: Suggested developments
New information source/event Course specific information evenings 63% More school visits 41% Subscribe for information via e-mails 31% Use an SMS to request a prospectus 11% New entrants were asked which websites they most regularly visit. The most popular websites are Facebook (used by 86% of students), Google (82%), YouTube (71%), Hotmail (43%) and Gmail (34%). Despite Twitter’s high profile, it is used by just 10% of new entrants. The most popular radio stations are Spin 103.8FM (41%), FM104 (30%) and 2FM (23%). A large number of respondent’s parents/guardians read The Irish Times at 59%, 41% read the Irish Independent, while 22% read the Sunday Independent. Media that students consider effective for advertising university courses are: websites (74%), radio (41%), posters on buses/Luas/DART (23%), bus shelters (16%) and billboards (13%). Schools Liaison Activities 2010/11 The Admissions Liaison Officer co‐ordinates a wide range of undergraduate student recruitment activities. With one staff member dedicated to promoting College’s undergraduate courses, because of limited resources, Trinity does not attend as many career fairs and schools as institutions such as UCD, DCU and NUIM. However, in order to increase the number of school visits, and with the intention of proactively targeting important feeder schools, the Admissions Liaison Officer initiated a small scale Student Ambassador Scheme in 2010/11, which involved four Ph.D. students from across Colleges faculties to help represent College at more than one fair or school on occasions when events clash. Five ambassadors are in place for 2011/12, which will allow an increase in the number of schools visited. Undergraduate student recruitment activities in 2010/11 included:
(a) Regional Careers Conventions and School Visits A number of major regional student recruitment/career fairs are organised annually by the Institute of Guidance Counsellors (IGC) and some second level schools also organise
Senior Lecturer’s Annual Report 2010/11 19
individual fairs. In 2010/11, College was represented at 27 fairs across the thirty‐two counties and visited 39 secondary schools to give a presentation about College and its undergraduate courses. Some individual Schools/Departments in College were also involved in school liaison activities:
• The School of Computer Science and Statistics has a part‐time Student Recruitment Officer and their academic staff members engage in a range of undergraduate recruitment activities. In 2010/11, staff members visited 45 schools to promote Computer Science, were present at a small number of careers fairs, and hosted over 100 transition year students in their laboratories.
• The Schools of Mathematics and Physics held a specific open day for their courses in November 2010. Approximately 150 students attended.
• The School of Chemistry: o held the annual Salter’s Festival for second‐level students, o held a transition year programme which approximately 80 students
attended, o held an international summer school in association with the University of
Bristol (for 18 Irish students and 10 students from Bristol), o visited several second level schools, and demonstrated experiments to
school students associated with TAP. • The School of Engineering visited 17 second‐level schools. • The School of Nursing and Midwifery held an Open Evening to address the low
first preference choices for Psychiatric and Intellectual Disability Nursing based on initial CAO statistics. The evening was very successful, with over 70 visitors in attendance and it is planned to run this event again on Tuesday 17th January 2012.
• The Schools of Biochemistry and Immunology, Physics, and the Departments of Botany and Zoology hosted groups of transition year students in their laboratories.
(b) Admissions Website Trinity College’s website was ranked as the most important source of information on Trinity’s undergraduate courses by new entrants. The Admissions website contains detailed descriptions of all undergraduate courses which are updated annually, it provides links to Schools’ and Departments’ individual websites, and it offers information on how to apply to Trinity College and course entry requirements. Potential students may also download the undergraduate prospectus and the evening course brochure. A significant amount of additional information about College, student life, support services and learning supports was added to the website in 2011. Potential entrants are now provided with information about Trinity College which may encourage more applicants to choose courses in this institution. A joint project with IS Services and the Web Office led to the podcasting of 120 course presentations from the Open Day on 22nd January 2011. These have been uploaded to College’s YouTube and iTunes websites.
Senior Lecturer’s Annual Report 2010/11 20
The Admissions Office also collaborated with the Communications Office to place banner advertisements on the TCD global homepage in the weeks leading up to CAO deadlines. These banners linked to promotional web pages which provided information encouraging students to choose courses at TCD. (c) Undergraduate Prospectus The undergraduate prospectus was listed as the second most important source of information about Trinity’s courses by new entrants. Fifty thousand (50,000) printed copies were distributed, while many more electronic versions were downloaded from the Admissions Office website. (d) College Open Day The annual College Open Day planned for 1st December 2010 was called off on 31st November due to adverse weather conditions. Following input from the Admissions Office and several Schools and Departments, a decision was taken to re‐schedule Open Day for Saturday, 22nd January 2011.
Guidance counsellors and final year students from all second level schools in Ireland were invited to attend. Based on the quantity of literature distributed, it is estimated that the attendance was in excess of 5,500 (8,000 in 2009). The drop in attendance compared with the previous year was due to the short notice period, proximity to the CAO deadline and fewer schools and guidance counsellors organising visits on non‐school days. However, staff reported that students who chose to attend on the Saturday displayed a very high level of interest, and more parents attended than usual. In addition, approximately 110 prospective mature students attended the mature student presentations (despite the proximity of the mature students evening on the 13th January 2010), and a number of A‐level students visited with their parents.
In total, there were 101 presentations on the day, and a number of research project demonstrations were given in the areas of Engineering, Science, Nursing, Medicine and Computer Science. (e) Links with Guidance Counsellors Guidance Counsellors were ranked as the fourth most important source of information by new entrants. Staff members in the Admissions Office consider guidance counsellors to be a vital link to potential students, and activities related to Guidance Counsellors in 2010/11 included:
• A direct mailing, with enclosed copies of the undergraduate prospectus to all Guidance Counsellors highlighting changes to Trinity’s courses.
• Attendance at the careers events organised by the IGC (see section (a)). • Participation in the six regional autumn meetings for Guidance Counsellors
hosted by the Central Applications Office. • Advertisements in the Guidance Counsellors magazine (Guideline), in the
IGC annual yearbook and diary, and in the literature for the IGC annual conference.
• A representative from the Admissions Office also attended the IGC’s AGM in March 2011.
Senior Lecturer’s Annual Report 2010/11 21
(f) Mobile Device Application The Admissions Office is working with the IS Services group, which is currently developing an updated version of College’s application for mobile devices (such as the iPhone and Android devices). The new version will allow potential students to access information about Admissions and undergraduate courses from mobile devices.
Senior Lecturer’s Annual Report 2010/11 22
III. STUDENT POPULATION
In total, there were 16,747 registered students in 2010/11 (16,807 in 2009/10). Of these, approximately, 78.5% were from the island of Ireland, 11.3% from other EU countries, 4.4% from North and Central America and 5.8% from other parts of the world (this includes students from European non –EU countries). In 2010/11, 59.4% of the student population was female and 40.6% was male. Eleven thousand, eight hundred and forty four (11,844) 70.7% students were registered on undergraduate programmes, and 4,903 (29%), on postgraduate programmes. See Tables B1 and B2 on page 76 for further detail.
Figure 8: Geographical distribution of student population 2010/11
Republic of Ireland 76.4%
Northern Ireland2.1%
Europe (EU) 11.3%
North & Central America
4.4%
Other 5.8%
Figure 9: Gender breakdown of student population 2010/11
UG Male28%
UG Female42.7%
PG Female16.7%
PG Male12.6%
Senior Lecturer’s Annual Report 2010/11 23
FT UG Degree 65%
FT UG Dip/Cert/Occas
3%
PT UG Degree/Dip/Cert/Occa
s 2%
FT PG Degree17%
FT PG Dip/Cert/Occas2%
PT PG Degree/Dip/Cert/Occa
s 10%
Figure 10a: Percentage of students by category 2010/11
Figure 10b: Percentage of postgraduate students by category 2010/11
FT PG Research 39%
PT PG Research 7%FT PG Taught
Masters20%
PT PG Taught Masters
15%
FT PG Diploma 8%
PT PG Diploma7%
FT/PT PG Visiting / In
Service 5%
Senior Lecturer’s Annual Report 2010/11 24
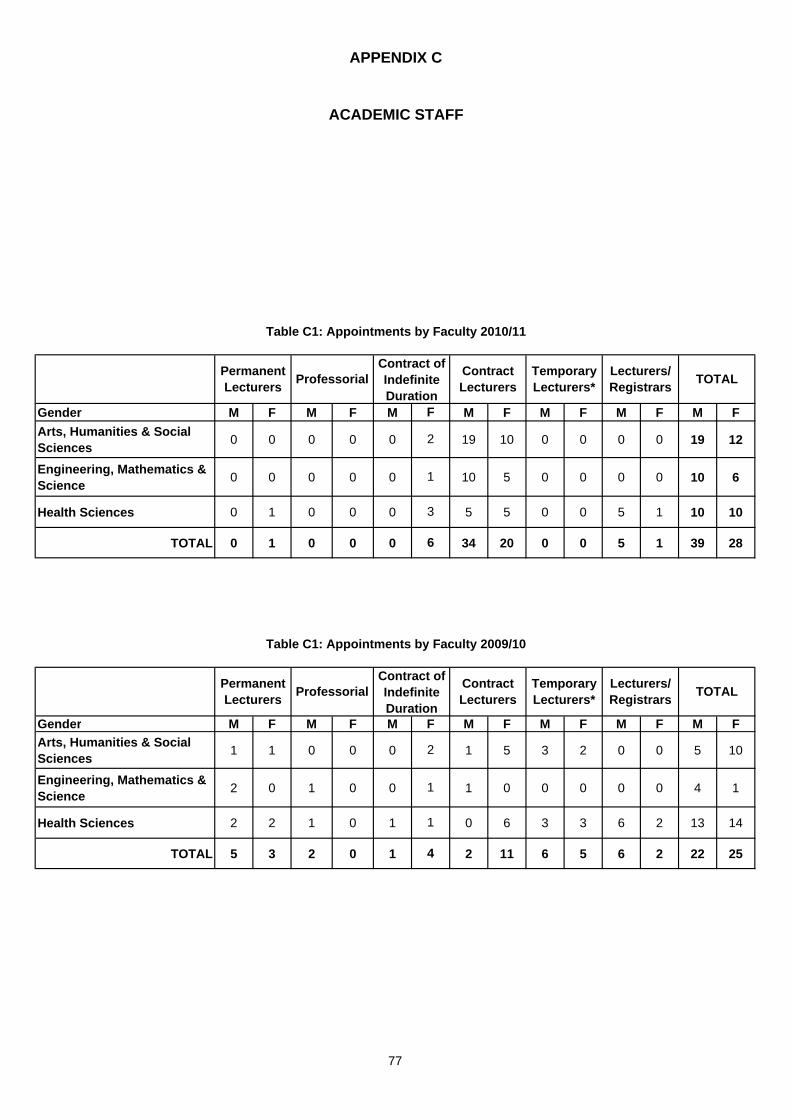
IV. ACADEMIC STAFF New Academic Appointments The College’s Strategic Plan 2009‐2014 identified the quality of academic staff as one of the College’s major strengths. During the academic year 2010/11, 67 new academic appointments were made, as illustrated in Table 9. Of the 67 appointments made, 6 were to the Lecturers/Registrars category and the remaining 61 to Lectureships. Of those appointed, 67% (38% in 2009/10) held doctoral degrees and a further 19% (30% in 2009/10) held at least one postgraduate or professional qualification of equivalent standing below doctoral level. Nine percent (9%) are in Lecturer/Registrar positions and have higher professional medical qualifications. Three percent (3%) held primary degrees only at the date of appointment (9% in 2009/10). In 2010/11, only 1 permanent appointment was made (1%) and a further 6 appointments (9%) were given a contract of indefinite duration (11% in 2009/10). In 2010/11 90% were on a contract basis. See Tables C1 (a), C2 (a) and C3 (a) on pages 77‐79 in the appendices for further data on appointments in 2010/11. (Comparative data available for 2009/10 on table C1(b) – C3 (b)).
Table 9: New academic appointments 2010/11 and 2009/10
Staff / Student Ratios Staff/Student ratios in 2010/11 ranged from 1:15 in the Faculty of Engineering, Mathematics and Science, 1:14 in the Faculty of Health Science, to 1:21 in the Faculty of Arts, Humanities and Social Sciences. The overall College ratio was 1:17 (1:17 in 2009/10). Staff/Student ratio calculations for 2010/11 do not include postgraduate research students who have completed their studies but who were on the register for thesis examination only, and the School of Education’s Continuing Professional Development and Second Level Support Service students. Further details are provided in tables C4(a) – C4(d) on page 80.
Senior Lecturer’s Annual Report 2010/11 25
The Provost’s Teaching Awards Scheme This scheme was established to recognise and reward those who have made an outstanding contribution in the pursuit of teaching excellence, and in delivering a critical part of the core mission of College. The prestige of the award reflects the value which Trinity places on promoting teaching as a scholarly activity, and the importance attached to enriching the learning opportunities of its students. Up to four awards are made annually.
Awards were made on 31st May 2011 to the following members of the academic staff:
• Dr. Áine Kelly (School of Medicine) • Dr. Paula Murphy (School of Natural Science) • Dr. Desmond Ryan (School of Law) • Dr. Janine Stockdale (School of Nursing & Midwifery), early‐career award.
2010/11 was the first year in which candidate’s submitted video evidence alongside a written portfolio of teaching excellence.
Senior Lecturer’s Annual Report 2010/11 26
V. ACADEMIC PROGRESS Junior Freshman Students Successfully Completing the Year The percentage of full‐time Junior Freshman degree students who successfully completed the year in 2010/11 averaged 91% across College. The data is based on annual, supplemental and special examination results and are calculated on the basis of the number of students passing examinations against the number of students registered as at the HEA census date of 1st March 2011, and therefore expected to present for examination in Trinity Term (and includes students off‐books who were taking examinations). In interpreting data on completion rates it should be noted that in courses with low student numbers, a small number of failures produces a very low percentage completion rate. Junior Freshman completion rates of 75% or less are found in eight courses, namely, Classics, Early and Modern Irish, Bachelor in Deaf Studies, Management Science and Information Systems Studies, Engineering with Management, Chemistry with Molecular Modelling, Mathematics, and Business and Computer Science (see Table D1 in the Appendices). It is intended that the Undergraduate Studies Committee will consider the reasons for the low completion rates in these courses. Student Cases Individual student cases involve considerable consultation and interaction with College Tutors, the relevant Course Directors, Directors of Teaching and Learning (UG), Heads of Disciplines and Schools or relevant staff members in academic units. Following full consideration of the case the Senior Lecturer will issue a decision directly to the relevant tutor. There has been a steady increase in the number of student cases, as demonstrated in Table 10 and it should be noted that, on average, each case generates at least six emails.
Table 10: Breakdown of number of decision memoranda issued
Months 2010/11 2009/10 2008/09 2007/08 Sept 227 292 142 113 Oct 158 236 120 144 Nov 189 150 153 203 Dec 93 118 107 93 Jan 51 74 72 83 Feb 124 103 98 95 Mar 88 78 64 41 April 136 173 144 44 May 379 243 296 181 June 337 260 285 276 July 91 95 187 117 Aug 172 174 99 87
Total 2045 1996 1767 1477
Senior Lecturer’s Annual Report 2010/11 27
Students Off‐books In 2010/11, a total of 344 undergraduate students were off‐books, compared to 351 in 2009/10, and 313 in 2008/09. The principal ground for allowing students to go off‐books in 2010/11 was for medical reasons (35%). The principal ground for students going off‐books, in 2009/10, was categorised under academic (31%).
*Includes ad misericordiam reasons Examinations During the 2010/11 academic year the Examinations Office organised approximately 76,144 examination sittings. Table 11: Breakdown of Examination Sittings ^ Examinations 2010/11 2009/10 2008/09 2007/08 Annuals 65,595~ 63,290 60,283 57,022 Supplementals 4,380 4,693 4,100 4,060 Specials 152 129 115 79 Term Tests 3,117 5,517 7,511 8,142 Foundation Scholarship 2,033 1,996 2,351 2,168 Others * 867 783 479 322 Totals 76,144 76,408 74,839 71,793
^ Examination sittings = number of students x number of examination papers sat * Others = Music Entrance Test, Matriculation, HPAT ~Excludes Colleges of Education examinations Two thousand four hundred and sixty one (2,461) examinations (XIDs) were scheduled during the 2010/11 academic year (2,256 in 2009/10). Examinations were scheduled across campus in venues which included the Arts Building, Goldsmith Hall, Graduates’ Memorial Building (GMB), Examination Hall, Regent House, New Sports Centre, Museum Building and the Luce Hall as well as several school‐owned rooms and laboratories. Examinations were held for the eleventh consecutive year in the RDS (Royal Dublin Society). Five hundred and thirty seven (537) students, who registered with the Disability Service, required special arrangements for the annual examination session in 2011 (420 in 2010) which represents a 28% increase. Individual timetables were
7756
12289
344
109
44
99 99
351
82
40
89 102
313
0
50
100
150
200
250
300
350
400
Academic Financial Medical Personal* Total
No.
of S
tude
nts
Figure 11: Reasons for students going off-books 2010/11, 2009/10, 2008/09
2010/11
2009/10
2008/09
Senior Lecturer’s Annual Report 2010/11 28
prepared for each of these students according to their specific requirements as advised by the Disability Service. The increase in the number of students requiring special facilities at examinations necessitated the employment of additional invigilators. Two hundred and ninety four (294) postgraduate students were employed for invigilation duties during the 2011 annual examination session (273 in 2010) representing a 8% increase on 2010 numbers. All invigilators receive detailed instructions on their responsibilities each year and are required to attend a training meeting. The Examinations Office, the Junior Dean, the Director of the Health Service and the Disability Office also provided instructions relevant to examination activities. Based on undergraduate annual examination results for non‐final year students, 939 students were awarded first class book tokens in 2011 (781 in 2010). Courts of First Appeal and Academic Appeals The Courts of First Appeal convenes to consider appeals on matters of academic progress arising out of examinations or other academic circumstances where a student case:
(i) is not adequately covered by the ordinary regulations of the College; or (ii) is based on a claim that the regulations of the College were not properly applied
in the applicant's case; or (iii) represents an ad misericordiam appeal.
If an application to the Courts of First Appeal is unsuccessful, a student may take their case to the College Academic Appeals Committee on the same grounds as listed above. A greater number of appeals are normally processed following the supplemental examination session where Courts of Examiners have prohibited students from proceeding to the next year of their course. There has been a steady increase in the number of courts of first appeal in all faculties over the period 2008/09 to 2010/11 and of academic appeals at college level after supplemental examinations. See tables 12(a) and 12(b) below. Table 12(a): Number of cases coming to Courts of First Appeal
Foundation Scholarship Examination A total of 433 students (out of 696 applicants) presented for the Foundation Scholarship examination in 2011 (410 presented out of 797 applicants in 2010). Eighty‐six (86) Foundation and Non‐Foundation Scholarships were awarded in 2011 (80 in 2010). This represents 20% of those presenting for the examination. Thirty‐one (31) Scholarships were awarded to females (36%) and 55 to males (64%). Details of Scholarships awarded by course are given in Table D2 on page 87 in the appendices.
0
5
10
15
20
25
30
2011
2010
2009
2011
2010
2009
2011
2010
2009
2011
2010
2009
Arts, Humanities & Social Sciences
Engineering, Mathematics & Science
Health Sciences Multi-Faculty
No
. of
Sch
ola
rshi
ps
Figure 12: Total Number of Foundation & Non-Foundation Scholarship's Awarded 2011, 2010, 2009
Female
Male
External Examiners External Examiners play a crucial role in ensuring the quality of degree programmes and best practice in examining. A total of 151 (149 in 2009/10) external examiners were appointed to examine undergraduate programmes in 2010/11, of whom 95 (63%) have submitted their annual report to the Senior Lecturer. Eighty‐seven (87%) percent of external examiners are from Ireland or the United Kingdom. For more detailed data please refer to Table D3 on page 88 in the appendices.
Senior Lecturer’s Annual Report 2010/11 30
Commencements, Firsts and Gold Medal Awards In the 2010 calendar year, 33 commencement ceremonies were held during which 4,339 (4,244 in 2009) degrees were conferred (2,563 primary degrees and 1,776 higher degrees). For more detail see Table D4 on page 89 in the appendices. A total of 388 students received first class honors (primary) degrees in 2010/11 (360 in 2009/10). Of these, 81 were awarded Gold Medals (72 in 2009/10). See Appendix G for the Gold Medal eligibility criteria which was revised during 2010/11 and approved by Board in June 2011. Table 13: First Class Degrees and Gold Medals 2010/11, 2009/10, 2008/09 2010/11 2009/10 2008/09 No. First Class Degrees 388 360 406 No. Gold Medals 81 72 85
050
100150200250300350400450
2010/11 2009/10 2008/09
No.
Aw
arde
d
Figure 13: First class degrees & gold medals 2010/11, 2009/10, 2008/09
No. First Class Degrees
No. Gold Medals
Table 14: First Class Degree and Gold Medals by Faculty 2010/11 Faculty No. First Class Degrees % No. Gold Medals %Arts, Humanities and Social Sciences 151 34 23%Engineering, Mathematics and Science 121 30 25%Health Sciences 73 13 18%Multi-Faculty 43 4 9%
Totals 388 81 100%
Senior Lecturer’s Annual Report 2010/11 31
Figure 14: Gold Medals as a percentage of First Class Degrees awarded by each Faculty 2010/11
23% 25%18%
9%
0%
10%
20%
30%
40%
50%
Arts, Humanities and Social Sciences
Engineering, Mathematics and Science
Health Sciences Multi-Faculty
% A
war
ded
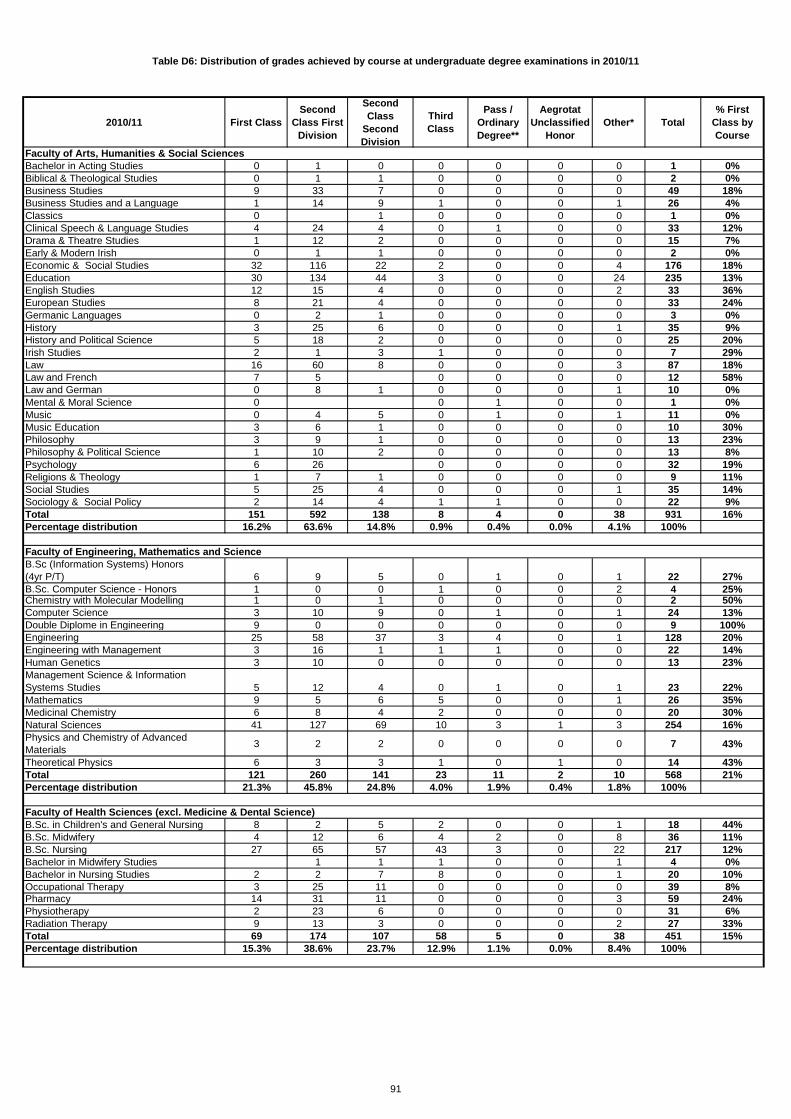
Distribution of Grades Achieved at Degree Examinations 2010 In 2010/11, 16.1% (16% in 2009/10) of students achieved a first class result at their degree examination, 50% (50.1% in 2009/10) achieved a result in the second class first division, and 18.5% (17.5% in 2009/10) obtained a result in the second class, second division. The award of a first class honor degree ranges from 0% to as high as 100% (Double Diploma in Engineering) across courses. Table 15: First Class honor degree distribution per faculty
Faculty
2010/11
2009/10
2008/09
Arts Humanities & Social Sciences 16.2 % 17.1% 18.8%
Table D5 on page 90 gives summary data for the last five years and information by course for the year 2010/11 is given in Table D6 on page 91.
Senior Lecturer’s Annual Report 2010/11 32
Diploma and Certificate Award Ceremonies In the 2010 calendar year, 11 diploma / certificate award ceremonies were held during which 107 certificates, 243 diplomas, 250 higher diplomas, and 778 postgraduate diplomas were awarded (1,378 awards in total). Table 16 below includes certificates of achievement in Contemporary Living and in pre university Foundation Studies. Table 16: Diploma & Certificate Awards 2010
COURSE TYPE AWARD TYPE In person In absentia TOTAL
VI. UNDERGRADUATE COURSE DEVELOPMENTS Table 17: Undergraduate Courses Approved/Discontinued during 2010/11 New Course / Changes Approved Quota EU Non EU Faculty of Arts, Humanities & Social Sciences Professional Diploma in Stage Management and Technical Theatre
15 n/a
Faculty of Engineering, Mathematics and Science TR071 Moderatorship Options: Biochemistry with cell biology and biochemistry with structural biology have been merged to form biochemistry n/a n/a
Biochemistry with immunology has been replace with Immunology n/a n/a
Botany has been renamed Plant Sciences n/a n/a
Five year Integrated Courses:
Integrated course in Engineering n/a n/a
Integrated course in Engineering with Management n/a n/a
Integrated course in Computer Science n/a n/a
Multi ‐ Faculty Computer Science, Linguistics and a Language has been renamed Computer Science and a Language ‐10 n/a
Business and Computing has been renamed Computer Science and Business n/a n/a
Discontinued Courses Faculty of Arts, Humanities and Social Sciences Philosophy and Political Science ‐10 n/a
Validated Courses BSc in Education Studies (delivered in Marino Institute of Education)
n/a n/a
Senior Lecturer’s Annual Report 2010/11 34
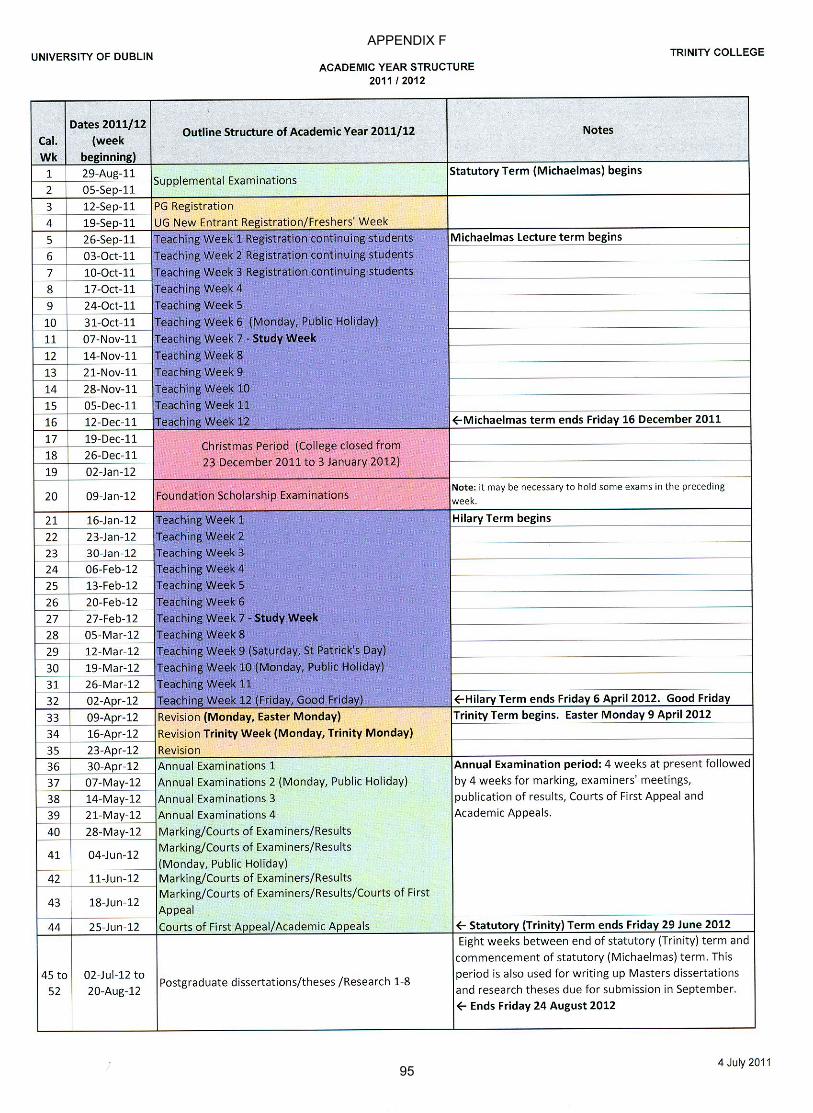
VII. UNDERGRADUATE ACADEMIC DEVELOPMENTS Academic Year Structure On foot of recommendations from the Undergraduate Studies Committee aimed at reducing the workload pressure on students in the second teaching term, Council, in respect of the 2010/11 academic year:
(a) approved the insertion of a third revision week between the end of the Hilary teaching term and the commencement of the annual examinations, and
(b) requested that the Undergraduate Studies Committee review the term structure during the course of 2010/11 with a view to making recommendations for implementation from 2011/12.
A consultation process commenced in February 2011 on the question of introducing examinations at the end of Michaelmas term, and the placement of Study Week within the 12‐week teaching terms. Initial discussions occurred at Undergraduate Schools Committee (USC) and the Graduate Studies Committee (GSC) following which comments were gathered and collated from School and Course offices. Early findings of the analysis were discussed by the Heads of School Committee, and final proposals brought back to USC and GSC. As the majority of Schools were not in favour of introducing examinations following the end of Michaelmas term, both USC and GSC recommended to Council that the current academic year structure remain unchanged for 2011/12; provision of end‐of‐term assessment / class tests might be further explored at a local level with those areas that have expressed a preference for this. As there had been no consensus on the scheduling of study week, the USC recommended that it should continue in Week 7 of each term. Council noted that the divergence of opinion on these questions reflected the divergence of activity across College. It will be important to continue to monitor the impact of the new term structure on teaching, students’ learning, and on assessment processes. The Broad Curriculum (www.tcd.ie/Broad_Curriculum) The academic year 2010/11 saw an increase in the number of students who completed a specialised Broad Curriculum module from 522 (2009/10) to 650. In 2010/11 sixteen modules were offered, spanning a range of subjects in the arts, humanities, social and earth sciences and attracted students from most undergraduate programmes in College. The modules are designed to promote breadth of reading at undergraduate level, are aimed primarily at students in the Senior Freshman and Junior Sophister years, and are taught over the Michaelmas and Hilary terms. Details of the module registrations by ‘home’ faculty of students and retention rates are set out in Table E1 and Table E2 on page 93. All cross‐faculty modules are centrally administered by the Vice‐Provost’s Office (including registrations, module changes and withdrawals, processing and publication of marks), while module content, teaching and assessment are the responsibility of the relevant discipline(s). In 2010/11, 80% of undergraduate degree programmes (including individual subjects within the Two‐Subject Moderatorship) provided for students to gain full academic credit in their
Senior Lecturer’s Annual Report 2010/11 35
end‐of‐year result by substituting a cross‐faculty course for an element of the main study programme. The credit weighting of Broad Curriculum cross‐faculty courses and language modules was revised from 6 down to 5 ECTS credits in 2007/08 in line with the Council decision of June 2006. In addition, the following was approved by Council in May 2008:
Effective from 2008‐09, all students taking a BC course, including the BC language modules, where they are permitted by their home course regulations will obtain the associated credits within their 60 ECTS workload and have their BC mark incorporated within their end‐of‐year overall result, and the School offering the Broad Curriculum course will be assigned the corresponding FTSE/ARAM credit.
This means that all the students taking the Broad Curriculum modules in 2010/11 were doing so on a substitution basis only. In order to accommodate the requirement that these modules could be substituted for credit within the total 60 ECTS credits permitted for each course year; schools provided 5 ECTS‐credit options for students not wishing to take Broad Curriculum modules. Achieving full integration of the Broad Curriculum together with the ECTS credit system in line with College policy has meant that all students’ module choices are factored into the calculation of the annual full‐time student equivalents (FTSE), thereby providing a mechanism for the allocation of resources to disciplines. This should facilitate disciplines in continuing their Broad Curriculum cross‐faculty modules following the end of the seed‐funding period in the academic year 2008/09.
(a) Language Modules The Centre for Language and Communication Studies (CLCS, School of Linguistic, Speech and Communication Sciences) has, since 1993, offered language modules to students who do not study a language as part of their degree course. The CLCS language modules are open to (i) all undergraduate students as an extracurricular option, and (ii) are also available to undergraduate students as part of the Broad Curriculum programme. The CLCS language modules are fully administered and taught by the CLCS, with information available both on CLCS website and on the Broad Curriculum website. Language modules in French, German, Italian, Spanish, Irish, Turkish and Korean were available in 2010/11. The objectives of the modules are (i) to develop students’ communication skills for purposes of study, travel or work experience during their undergraduate years, and (ii) to enhance their academic qualifications, vocational prospects, and potential for future mobility. In 2010/11, 68 students successfully completed a module in French, 32 in German, 42 in Spanish, 26 in Irish, 19 in Italian, 6 in Turkish and 4 in Korean.
(b) Website
Extensive amendments were made to the Broad Curriculum website during 2007/08 to reflect the new substitution regulations and to move towards greater integration of the language modules. All credit regulations listed on the site now give up‐to‐date information for both cross‐faculty modules and language modules.
Senior Lecturer’s Annual Report 2010/11 36
(c) Developments in 2010/11 There were no significant developments in 2010/11.
The Bologna Process
(a) Student Learning Outcomes The process of drafting intended student learning outcomes for taught programmes and modules, which had begun in 2008/09, in accordance with a March 2008 decision of Council, continued throughout the 2010/11 academic year. The activity was facilitated and supported by staff attached to the Bologna Desk and the Centre for Academic Practice and e‐Learning (CAPSL), in cooperation with Directors of Teaching and Learning and Course Directors. Support took the form of documentary information including the development of a ‘checklist’ for the revision of credit weighting and learning outcomes for modules and programmes, detailed structured feedback on individual drafts, and working meetings with individual members and groups of academic staff. By the year’s end, learning outcomes had been written for approximately 95% of the College’s undergraduate and taught postgraduate programmes while the completion rate for module outcomes was in the region of 85%. Learning outcomes documents were published on the College’s website, accessible to all staff and students, and were generally incorporated into course handbooks.
In recognition of the importance of alignment between module learning outcomes and methods of teaching and assessment, Schools were reminded that course documentation provided to external examiners should include the learning outcomes for modules in which students are being assessed/examined, and that comments from external examiners in relation to learning outcomes and assessment should be taken into account in the annual updating process. In the new Student Administration System, learning outcomes will feature as an integral part of module and course data. Staff of the Bologna Desk and CAPSL have been active participants in the Enhancement of Learning (EOL) strand with partner institutions in the Dublin Region Higher Education Alliance (DRHEA). The DRHEA Learning Outcomes Working Group provided several opportunities during 2010/11 for discussion and sharing of experience for staff involved in different aspects of drafting and working with learning outcomes.
(b) Recognition of Prior Learning (RPL) A report on the outcomes of a study into current policy and operational issues relating to the Recognition of Prior Learning (RPL), in Irish higher education, was published in October 2011 by the Framework Implementation Network (FIN). The Network is jointly hosted by the Irish Universities Association and the National Qualifications Authority of Ireland, and provides a forum for the universities and their associated colleges for discussion of current topics of common interest. Trinity College is currently represented on the Network by staff of the Bologna Desk. The introduction of formal mechanisms for recognising prior learning, whether formal (accredited or certified) or informal
Senior Lecturer’s Annual Report 2010/11 37
(non‐accredited or certified), for the purposes of admission to courses or for exemption from elements of courses is a key objective of the National Qualifications Authority in the context of its policies on access, transfer and progression for lifelong learning.
(c) Joint Degrees
September 2010 saw the admission of the second cohort of students who will graduate with a joint University of Dublin and Dublin Institute of Technology (DIT) B.Sc. degree award, with honors classified, in Human Nutrition and Dietetics. Also, the first cohort of students was admitted to the ‘Masters in Development Practice’, a new joint Master’s degree with University College Dublin.
(d) Diploma Supplement
The new student administration system which comes on stream for 2012/13 will have the capacity of generating Diploma Supplement documentation for graduates. The modalities of generation and issue will be considered by the GeneSIS project team as part of the system implementation.
(e) Implementation of the National Framework of Qualifications (NFQ)
In January 2010, Council gave its approval to the commencement of detailed work to develop formal statements in relation to individual degree, diploma and certificate awards, which have been discontinued, but which will need to be placed on the NFQ as ‘legacy awards’. Such awards fall into two categories termed ‘antecedent awards’ and ‘former awards’. Antecedent awards are Major awards which are forerunners of the existing Ordinary Bachelor, Honors Bachelor, Masters’ and Doctoral degrees as well as Higher and Postgraduate Diplomas. Former awards are those which ceased to exist prior to the introduction of the NFQ in 2003. Progress in this area has been slow due to constraints on staffing and high workloads. However, the new student administration system will serve as a repository to hold this data in a structured way to meet future reporting requirements. The formal placement, at Level 7 of the National Framework of Qualifications, of the Certificate in Holocaust Education and the Certificate in Parliamentary and Legislative Studies, has been confirmed following consultation with the National Qualifications Authority.
Undergraduate Student Retention
(a) Overview 2001/02‐2006/07 In 2005, a study commenced that tracked the status of all new entrants to undergraduate degree programmes as they progressed through their studies. Retention refers to all students who are retained within College, and this includes students who internally transfer to another course and students who go off‐ books.
Senior Lecturer’s Annual Report 2010/11 38
Table 18 below provides a summary of withdrawal rates for all six cohorts. Table 18 - Summary by Cohort 2001/02 – 2006/07 Cohorts
The 2006/07 new entrant cohort records the lowest percentage withdrawal rate of 14.6% of all six cohorts analysed to‐date (2001/02 – 2006/07) with a total of 377 new entrant withdrawals. Compared to the 2005/06 new entrant cohort, which recorded the highest withdrawal rate of all six cohorts, 2006/07 recorded an increased intake of just 21 new entrants, totalling 2,574, but with a decrease of 79 students withdrawing and an ensuing decrease of 3.3% in the withdrawal rate. Table 19 below provides a comparative summary of the 2005/06 and 2006/07 new entrant cohorts. Table 19 – Comparison of 2006/07 and 2005/06 new entrant cohorts
Total no. of New Entrants
intake by cohort
Total no. of students withdrawn over four years
student withdrawn over four years as a % of intake
2006/07
2005/06 2006/07 2005/06 2006/07 2005/06
2,574
2,553 377 456 14.6% 17.9%
2006/07 cohort intake
increased by 21 students
2006/2007 cohort - withdrawals decreased by 79 students
2006/07 cohort - withdrawals decreased by 3.3%
Of the 377 withdrawals, 58% notified College of their withdrawal and the balance of 42% were withdrawn by College as they did not register (41.9%) or were excluded from their course based on their end of year examination results. Irish students accounted for 86.5% of all withdrawals from the 2006/07 new entrant cohort, followed by the UK at 5.3% and USA at 2.4%. CAO points data for Irish students who withdrew from the 2006/07 cohort is comparatively similar to the previous two cohorts. Please see Tables H1 and H2 on page 98.
Senior Lecturer’s Annual Report 2010/11 39
(c) 2006/07 cohort over view by Faculty All Faculties recorded a reduction in the number and percentage of new entrant withdrawals and a summary by Faculty is outlined in Table 20 below.
*For the purposes of this study, multi‐faculty courses are categorised as a separate faculty. Faculty of Arts, Humanities and Social Sciences has the highest intake of new entrants in College. Overall the intake and withdrawal rates do not vary considerably from the 2005/06 cohort or indeed over the six cohorts (2001/02 – 2006/07) with an average withdrawal rate of 12%. Faculty of Engineering, Mathematics and Science has the second highest Faculty intake of new entrants in College in 2006/07, the highest number and the second highest percentage of withdrawals for the cohort. The new entrant intake was the same as in 2005/06 but there was a reduction in the number of withdrawals (by 20 students) which consequently reduces the rate of withdrawal by 3%. Faculty of Health Sciences has the third highest intake of the four Faculties in College but in 2006/07 recorded the lowest number of student withdrawals (55 students) and rate of withdrawal at 9.7%. This is a marked improvement for the Faculty, not only when compared to the 2005/06 cohort but also when compared to preceding cohort analyses since 2003/04 (2003/04 ‐ 14.7%; 2004/05 ‐ 15.3%; 2005/06 – 16.0%).
Senior Lecturer’s Annual Report 2010/11 40
Multi‐Faculty Courses have the lowest intake by Faculty with just three courses comprising 372 new entrants in 2006/07 but has the highest percentage withdrawals of all four Faculties at 21%. TSM accounts for 94% of multi‐faculty new entrant intake (348 students) and 94% of all multi‐faculty withdrawals (73 students) for the 2006/07 cohort. The Faculty has, however, recorded a 4.4% reduction in its withdrawal rate compared to the 2005/06 cohort and this can be attributed primarily to a 3% reduction for TSM.
41
APPENDICES
Senior Lecturer’s Annual Report 2010/11 42
APPENDIX A – APPLICATIONS AND ADMISSIONS 2011
1. APPLICATIONS
In reviewing 2011 admissions data, Council is invited to note the following points: • A total of 67,360 applicants applied for Level 8 courses in Irish higher education
institutions through the CAO, representing a decrease of 1.2% on the 2010 application figures.
• Trinity continued to attract a substantial proportion (11.5%) of first preference applications in the CAO system.
• In 2011, 18,437 applicants mentioned TCD as one or more of their CAO course preferences (18,275 in 2010) ‐ an increase of almost 1%.
• The number of first preference applications to Trinity College was 7,770 representing an increase of 1.2% on the 2010 figures (7,679 in 2010). The College’s overall ratio of first preference applications to quota was 2.7:1 (2.7:1 in 2010).
• The term ‘eligible applications’ refers to applications that satisfy the matriculation requirements of the university, and, where appropriate, course requirements. There is a significant difference in the ratio of eligible applications to quota and the ratio of all applications to quota. The data shown in Tables A3‐A6 provide this information. The overall ratio of eligible first preference applications to quota was 1.8:1.
• Courses in Science (TR071) and Business, Economic and Social Studies (BESS) which have large quotas (340 and 236 respectively) continued to maintain a strong sectoral position. Points for BESS remained similar to 2010 levels but the minimum entry level for Natural Sciences rose to 470 points from 455 in 2010. Some courses in the Arts area fell as more students applied for science related courses which resulted in points rises in those areas.
• Entry to medicine continues to be a topical issue. The revised selection criteria was introduced in 2009 and uses a combination of Leaving Certificate points and the HPAT‐Ireland admission test result. A research project being conducted under the auspices of the Deans of Irish Medical Schools is expected to publish their findings in 2012.
• Four hundred and twenty (420) EU new entrants to Trinity College achieved 560 points or higher in the Leaving Certificate or equivalent examination and were awarded an Entrance Exhibition. They represent 14.7% of the 2011/12 Junior Freshman class entering through the CAO (15.5% in 2010).
• In 2011 there were 928 applications for admission under the Mature Student Dispensation Scheme (941 in 2010) and 142 mature students registered (148 in 2010).
• Tables A12 and A13 show the percentage trend of acceptances to Round 1 offers from 2007 to 2011. The percentages range from 0% to 100% and can show substantial variance from year to year. Thus, this is only one of several factors taken into account when determining the numbers of offers to be made.
• 76.5% of registered CAO students achieved 475+ points, and 42% achieved 525+ (Table A14 on pages 64 – 66).
Senior Lecturer’s Annual Report 2010/11 43
Figure A1: Total number of CAO applications to full-time undergraduate degree courses in TCD (all preferences and first preferences) 2011, 2010, 2009,
40364 40043 38217
7770 7679 72920
50001000015000200002500030000350004000045000
2011 2010 2009
No.
of p
refe
renc
es
All preferencesFirst preferences
Figure A2: Total number of CAO applicants to all universities 2011, 2010, 2009
18,4
37
15,8
71
24,8
48
17,1
57
13,9
01
14,1
57
17,6
0518,2
75
15,9
33 26,0
23
17,1
43
12,0
20
13,9
98
16,7
39
17,2
88
15,4
05
24,6
91
16,0
37
11,3
53 13,9
32
14,7
870
5,000
10,000
15,000
20,000
25,000
30,000
TCD UCC UCD NUI Galway NUI Maynooth UL DCU
No
of a
pplic
ants
2011
2010
2009
In 2011 the total number of CAO applicants to Trinity College was 18,437 compared to 18,275 in 2010 and 17,288 in 2009. There are up to 10 preferences on each application form and applicants may apply to more than one institution. Therefore, the figure 18,437 refers to the number of applicants who indicated a preference for one or more courses in Trinity College.
Senior Lecturer’s Annual Report 2010/11 44
The total number of applications to courses (all preferences) in Trinity College was 40,364 compared to 40,043 in 2010 and 38,217 in 2009. In 2011, the ratio of applications (all preferences) to quotas ranged from 2.6:1 in TSM Early Irish and Computer Science, Linguistics and Irish to 48.2:1 in TSM Psychology. The overall College ratio was 14:1 (14:1 in 2010).
Figure A3: Total Number of First Preference Applications to Universities
7,77
0
6,10
2
7,87
9
5,47
9
3,38
1
4,38
7
4,35
4
7,67
9
6,27
3 8,13
4
5,68
5
3,13
7
4,54
1
4,30
6
7,29
2
6,56
4 7,94
1
5,43
5
3,02
2
4,69
5
3,94
8
01,0002,0003,0004,0005,0006,0007,0008,0009,000
TCD UCC UCD NUI Galway NUI Maynooth UL DCU
No
of a
pplic
ants
201120102009
Figure A4: Ratio of CAO applications (all preferences) to quota 2011, 2010, 2009
0
2
4
6
8
10
12
14
16
18
20
Arts, Humanities & Social Sciences
Engineering, Mathematics & Science
Health Sciences Multi-Faculty
Rat
io
2011
2010
2009
Senior Lecturer’s Annual Report 2010/11 45
Further detail is given on Tables A1 and A2 on pages 46‐48. The ratio of first preference applications to quota, a more revealing indication of demand for College places, is shown in Figure 1, page 5 in the main text and Tables A5 and A6 on pages 50‐54. 2. ADMISSIONS The Admissions Office processes all applications to undergraduate courses in the university. These are categorised as (a) CAO applications, (b) direct entry applications, (c) applications from visiting students, and (d) non‐EU direct entry applications to full‐time degree programmes.
a) CAO Applications Tables A5 and A6 on pages 50‐54 portray the relationships between course quotas, first preference applications and numbers registering for CAO courses. In comparing the numbers of students registered with course quotas it must be noted that achieving an exact match through several rounds of CAO offers and acceptances is a delicate and indeterminate process. b) Direct Entry Applications Table A1(a) on page 46 details the number of EU and non‐EU direct applications to the Admissions Office, together with the ratio of applications to quota and number of registered students for direct entry courses. SOCRATES students are included in this category. c) Applications from Visiting Students The Admissions Office processed 324 applications from one‐year and one‐term SOCRATES/Visiting students (see Table A3 on page 48) in 2011. These applications are from EU students. d) Non‐EU Direct Entry Applications Seven hundred and thirty seven (737) non‐EU direct applications were processed from students seeking admission to Medicine (512 in 2010) and seventy‐eight (78) from students seeking admission to Dental Science (71 in 2010). In addition, the Admissions Office processed 247 non‐EU applications for full‐time undergraduate degree programmes other than Medicine and Dental Science (259 in 2010).
In 2011, a total of 3,580 new entrants registered on undergraduate courses in Trinity College, compared to 3,635 in 2010.
Table A1: Ratio of total and eligible CAO applications to quota for 2011, 2010, 2009
#Quota adjusted in 2010 as a result of the strategic planning process*Quota adjusted in 2009 as a result of the strategic planning process
^^^ Quota adjusted as part of the implementation of the Fottrell Report^^ The overall quota for nursing in 2009 was deccreased due to national cutbacks from 233 to 214.
Table A2: Ratio of total and eligible CAO applications to quota for Two-subject Moderatorship courses 2011, 2010, 2009
48
Two- Subject Moderatorship
Course
Total Number of
Applications (All
Preferences)
QuotaRatio of
Applications to Quota
Ratio of Eligible
Applications to Quota
Total Number of
Applications (All
Preferences)
QuotaRatio of
Applications to Quota
Ratio of Eligible
Applications to Quota
Total Number of
Applications (All
Preferences)
QuotaRatio of
Applications to Quota
Ratio of Eligible
Applications to Quota
Ancient History & Archaeology 439 23 19.1 11.3 423 23 18.4 12.3 377 23 16.4 11.7
Non-EU: Medicine 737 45 16.4 45 512 44 11.6 43 587 44 13.3 44 Dental Science 78 8 9.8 8 71 8 8.9 8 54 8 6.8 8 Other Full Degree 247 57 259 45 286 46One Year Visiting Students 59 48 90 71 106 94
One Term Students 95 79 149 124 67 65
Total 4219 791 3939 866 4003 790
# The Bachelor in Deaf Studies was approved during the 2008/09 academic year; all students admitted to the Diploma course via CAO were automatically transferred to the degree programme which commenced in October 2009
No intake 2011
20102011
No intake 2010
No intake 2010
2009
***New programme with first intake 2007/08
Application to these Level 7 courses is via CAO. This results in a high level of applications but a lower number of genuine applicants.* Random selection
No intake 2011
No intake 2011
No intake 2011
**New programme with first intake 2011/2012. Application are made directly to The Lir National Academy of Dramatic Art. Students register with Trinity College Dublin.
Table A4: Analysis of undergraduate new entrants** by course preference 2011**New entrants to TCD
^ BSc (Human Nutrition & Dietetics) - Joint Degree: applicants apply directly to associated college
51
Table A5: CAO first preference applications: quotas, points, number registered 2011, 2010, 2009
Course Quota
Number of first
preference applications
Ratio of 1st pref applcns to quota
Minimum points
Ratio of 1st pref applcns
to no. regd
Number regd at
28.10.2011
Ratio of Eligible 1st pref
applcns to quota
Quota
Number of first
preference applications
Ratio of 1st pref applcns to quota
Minimum points
Ratio of 1st pref applcns
to no. regd
Number regd at
29.10.2010
Ratio of Eligible 1st pref applcns to quota
Quota
Number of first
preference applications
Ratio of 1st pref applcns to quota
Minimum points
Ratio of 1st pref applcns
to no. regd
Number regd at
30.10.09
Ratio of Eligible 1st pref applcns to quota
Faculty of Arts & Humanities and Social SciencesAncient & Medieval History and Culture # (New in 2009) 15 32 2.1 415 2.0 16 1.4 15> 28 1.9 395* 1.6 18 #VALUE! 15 22 1.5 385* 1.0 21 0.9
TOTAL 828 2142 2.6 2.8 758 1580 1.9 828 2366 2.9 3.1 760 1786 2.2 820 2108 2.6 2.7 780 1612 2.0# Quota adjusted in 2010 as a result of the strategic planning process.*Quota adjusted in 2009 as a result of the strategic planning process.Minimum Points:
* Random selection: not all students with this number of points were offered a place.***Entrance test/Interview required .
2009
^^ The points shown are the minimum for the subject but not for all combinations, see Table 15 on page A26
20102011
Table A7: Total number of CAO applicants* to universities, DIT, other ITs, Colleges of Education and private colleges
(all preferences) 2011, 2010, 2009
2011 2010 2009Universities
TCD 18,437 18,275 17,288
UCC 15,871 15,933 15,405
UCD 24,848 26,023 24,691
NUI Galway 17,157 17,143 16,037
NUI Maynooth 13,901 12,020 11,353
UL 14,157 13,998 13,932
DCU 17,605 16,739 14,787
Total 121,976 120,131 113,493
Dublin Institute of Technology 18,783 18,504 16,368
Other Institutes of Technology (ITs) 63,612 58,805 52,438
National College of Art and Design 808 791 820
Colleges of Education 11,611 14,970 15,289
Private and other Colleges** 15,177 12,651 12,846
Source: Central Applications Office*There are up to 10 preferences on each application form and applicants may apply to more than one institution.
** This category includes Colleges with some courses eligible for the Government undergraduate fee remission scheme
55
Table A8: Total number of First Preference applications to Universities
2011 2010 2009Universities
Trinity College Dublin (TCD) 7,770 7,679 7,292
University College Cork (UCC) 6,102 6,273 6,564
University College Dublin (UCD) 7,879 8,134 7,941
NUI Galway 5,479 5,685 5,435
NUI Maynooth 3,381 3,137 3,022
University of Limerick (UL) 4,387 4,541 4,695
Dublin City University (DCU) 4,354 4,306 3,948
Total 39,352 39,755 38,897
Dublin Institute of Technology 5,081 4,871 4,334
Other Institutes of Technology (ITs) 16,518 16,754 15,054
National College of Art and Design 482 518 479
Colleges of Education 3263 3,570 3,675
Private and other Colleges** 2,661 2,753 2,648
Source: Central Applications Office*There are up to 10 preferences on each application form and applicants may apply to moone institution.
** This category includes Colleges with some courses eligible for the Government undergfee remission scheme
Number of First Preference Applications to Universities 2011, 2010, 2009
56
57
Table A9 (a): Number of students admitted under the Mature Students Dispensation Scheme by Faculty 2011-2007
2011* 2010* 2009 2008 2007
Number of applicants
928 941 681 729 750
Number of places offered
168 154 169 198 157
Number of students registered by Faculty:
Arts, Humanities & Social Sciences
74
68 58 60 51
Engineering, Mathematics & Science
21
20 14 27 15
Health Sciences
21
29 19 19 33
Multi-faculty
26
31 21 27 27
Total students registered
142
148 112 133 126 *Figures for 2011 & 2010 include those who applied & were admitted via the facilitated entry scheme. Table A9 (b): Number of mature student applications, offers and students registered in Nursing
and Midwifery
2011 2010 2009 2008 2007 Number of Nursing and Midwifery applications
1834 1713 1392 1207 1468
Number of places offered
121 90 92 92 132
Number of students registered in Nursing and Midwifery
71 64 68 66 113
Table A9 (c): Profile of Undergraduate Mature Students
* Applications for this route are processed by the Nursing Careers Centre; therefore Trinity does not have access to information concerning the attainment of previous degrees.
Category of Student
Arts, Humanities &
Social Sciences
Engineering, Mathematics &
Science Health
Sciences Multi-Faculty
Mature students with previous degrees 11 5 12 2
Mature students without previous degrees 63 16 9 24
Number of mature students registered in Nursing and Midwifery*
n/a n/a 71 n/a
TOTAL 74 21 92 26
58
Category of Student Arts, Humanities & Social Sciences
Engineering, Mathematics &
ScienceHealth Sciences Multi-Faculty Totals
Total CAO Entrants 927 753 621 488 2789
Socio-economically disadvantaged 60 27 53 17 157
Mature students 74 21 92 26 213
Students with a disability 89 30 32 3 154
Totals 223 78 177 46 524
Total as a % of Faculty new entrants - CAO 24.1% 10.4% 28.5% 9.4% 18.8%
Category of Student Arts, Humanities & Social Sciences
Engineering, Mathematics &
ScienceHealth Sciences Multi-Faculty Totals
Specific Learning Difficulty 50 15 13 2 80
Non Specific Learning Difficulty 39 15 19 1 74
Totals 89 30 32 3 154
Table A10 (a): Profile of undergraduate new entrants by key access criteria per faculty 2011/12
Table A10 (b): Analysis of new entrants registered with the Disability Service by Faculty 2011/12*
* There is no close of registration date, students may register all year round. Student may disclose a disability later, and some students acquire a disability whilst at College.
59
Table A11 (a): Courses not meeting quota in 2011 due to insufficient eligible applications
Course Quota First preferences
Cut-off points level
Number registered as at
28/10/2011
Applications made via CAO
Business Studies and Polish 5 6 390 1
Classics^ 15 16 405 4
Computer Science 80 109 385 68 Computer Science, Linguistics and a Language 25 23 435 19
Engineering with Management 20 13 380 14 Management Science and Information System Studies 40 34 385 30
TSM*
Early Irish 10 0 465 1
Modern Irish 30 32 390 19
Russian 36 18 405 7
TOTALS 261 251 163 ^ It should be noted that in addition to the single honor programme in Classics, four subjects are offered within the Two Subject Moderatorship programme (i.e. Ancient History and Archaeology, Classical Civilisation, Greek and Latin). * Table A13 on page A22 provides the points cut-off levels against different variations of TSM courses.
60
Table A11 (b): Courses not meeting quota in 2010 due to insufficient eligible applications
Course Quota First preferences
Cut-off points level
Number registered as at
29/10/2010
Applications made via CAO
Business Studies & Polish 5 9 420 2
Classics ^ 15 20 425 7
Computer Science 80 90 355 44 Computer Science, Linguistics & a Language 25 12 430 9
Early & Modern Irish 15 12 345 9
Engineering with Management 20 17 390 12
MSISS 45 19 380 33
TSM*
Early Irish 10 0 415 0
Greek 8 5 470 1
Jewish & Islamic Civilisations 10 3 425 7
Russian 36 25 425 4
TOTALS 269 212 128 ^ It should be noted that in addition to the single honor programme in Classics, four subjects are offered within the Two Subject Moderatorship programme (i.e. Ancient History and Archaeology, Classical Civilisation, Greek and Latin). * Table A13 on page A22 provides the points cut-off levels against different variations of TSM courses.
Table A12: Percentage rate of acceptances to offers 2011 - 2007 (CAO round 1)
61
Course 2011 2010* 2009^ 2008* 2007* % % % % % Faculty of Arts, Humanities and Social Sciences Ancient & Medieval History and Culture (new in 2009) 68 52 94 Business Studies & French 81 94 93 100 87 Business Studies & German 88 100 94 94 85 Business Studies & Russian 29 100 77 86 87 Business Studies and Polish 100 0 100 67 n/a Business Studies and Spanish 100 93 55 67 n/a Business, Economic & Social Studies 88 89 93 90 82 Classics 43 55 100 20 55 Clinical Speech & Language Studies 86 94 94 79 74 Deaf Studies (new in 2010) 75 76 n/a n/a n/a Drama & Theatre Studies 88 93 100 100 87 Early & Modern Irish 86 67 86 75 67 English Studies 67 80 80 67 70 European Studies 85 83 82 88 76 Germanic Languages n/a n/a n/a 50 50 History 52 69 85 56 72 History & Political Science 70 81 85 73 95 Irish Studies 87 82 90 87 90 Law 77 81 89 87 81 Law & French 75 70 83 78 78 Law & German 82 88 100 78 77 Law and Business (new in 2009) 83 81 95 n/a n/a Law and Political Science (new in 2009) 86 86 90 n/a n/a Music 86 95 85 89 77 Music Education 100 90 100 100 100 Philosophy (formerly Mental & Moral Science) 44 48 93 68 44 Philosophy & Political Science 55 76 77 60 67 Philosophy, Political Science, Economics and Sociology 66 76 100 75 Psychology 77 94 88 67 89 Social Studies 83 89 91 91 96 Sociology & Social Policy 92 86 93 71 67 World Religions & Theology (formerly Religions and Theology)
64 59 78 53 63
Faculty of Engineering, Mathematics and Science % % % % Computer Science 91 82 86 91 75 Earth Sciences (New in 2009) 75 86 80 n/a n/a Engineering 83 80 92 86 86 Engineering with Management (formerly Manufacturing Engineering & Management Science
92 85 87 71 93
Table A12: Percentage rate of acceptances to offers 2011 - 2007 (CAO round 1)
62
Course 2011 2010* 2009^ 2008* 2007* Human Genetics 79 78 72 74 56 Management Science & Information Systems Studies 91 94 91 97 91 Chemistry with Molecular Medicine 63 80 100 50 67 Mathematics 63 60 87 67 57 Medicinal Chemistry 66 77 86 59 60 Nanoscience, Physics & Chemistry of Advanced Materials
73 83 93 83 67
Science 84 82 87 78 77 Theoretical Physics 79 93 89 93 76 Faculty of Health Sciences % % % % Children’s and General Integrated Nursing 75 87 94 89 83 Children’s and General Integrated Nursing – Mature (Round A)
80 100 60 80 100
Dental Science 63 78 89 58 64 General Nursing 84 80 83 82 87 General Nursing - Mature (Round A) 83 76 100 91 87 General Nursing Adelaide 93 100 100 100 90 General Nursing Adelaide - Mature (Round A) 100 100 100 100 100 Intellectual Disability Nursing 76 85 94 72 83 Intellectual Disability Nursing- Mature (Round A) 79 87 88 100 93 Medicine 84 91 89 72 74 Midwifery 82 85 88 62 65 Midwifery- Mature (Round A) 78 83 83 100 87 Occupational Therapy 84 79 79 83 79 Pharmacy 87 80 91 78 78 Physiotherapy 80 83 89 77 69 Psychiatric Nursing 75 83 82 86 60 Psychiatric Nursing - Mature (Round A) 87 100 95 100 Radiation Therapy 82 86 86 70 79 Multi-Faculty % % % % Business and Computing (New in 2009) 91 88 100 Computer Science, Linguistics & French 100 100 100 100 100 Computer Science, Linguistics & German 100 100 100 100 100 Computer Science, Linguistics & Irish 100 100 0 0 0 Human Health and Disease (New in 2009) 80 78 86 n/a n/a Political Science and Geography (New in 2009) 88 68 89 n/a n/a Two Subject Moderatorship 74 79 86 77 74 ^ 2009 data is based on offers to Leaving Certificate applicants only. * Other years are based on offers to Leaving Certificate and A Level applicants.
Table A13: Percentage rate of acceptances to offers, TSM courses 2011 – 2007 (CAO round 1)
63
^2009 data is based on offers to Leaving Certificate applicants only. *Other years based on offers to Leaving Certificate and A Level applicants.
Two Subject Moderatorship Course
2011 2010* 2009^ 2008*
2007*
% % % % Ancient History & Archaeology 65 75 80 71 74 Classical Civilisation 72 81 82 76 72 Drama Studies 89 87 78 89 91 Early Irish 100 0 100 100 0 Economics 81 73 86 75 77 English Literature 75 90 90 77 79 Film Studies 83 77 86 80 80 French 70 72 78 84 68 Geography 85 78 92 80 61 German 77 84 90 75 72 Greek 100 33 75 50 66 History 84 78 89 85 84 History of Art & Architecture 72 84 85 74 68 Italian 59 69 70 75 62 Jewish & Islamic Civilisations 100 100 75 25 60 Latin 20 75 88 75 90 Mathematics 80 74 82 82 67 Modern Irish 85 96 93 87 87 Music 89 90 100 92 83 Philosophy 62 67 83 64 74 Psychology 81 94 100 85 84 Russian 45 36 90 60 69 Sociology 81 90 91 80 74 Spanish 62 72 83 70 69 World Religions & Theology 64 72 81 52 61
Table A14: Distribution of points within each course - Undergraduate new entrants 2011
64
Minimum points
required for admission
Specials (matures, deferrals, other EU,
HEAR, DARE,etc)
550 points
and above
525-549 points
500-524 points
475-499 points
450-474 points
425-449 points
400-424 points < 400 TOTALS
Quota Sample point info >
1A1, 5A2 = 550 points
5A2,1B2 = 530 points
3A2,3B2 = 510 points
6B2 = 480 points
6B3 = 450 points
3B2,3C2 = 435 points
2B2,4C2 = 420 points
6C2 = 390 points
Ancient and Medieval History and Culture 15 415 3 1 1 1 6 4 16Business, Economic and Social Studies 236 480 32 21 40 67 76 236Business Studies and French 15 510* 4 9 2 15Business Studies and German 15 450 3 1 4 7 15Business Studies and Polish 5 390 1 1Business Studies and Russian 7 410* 1 1 1 1 4Business Studies and Spanish 10 475 1 3 7 11Classics 15 405 1 2 1 4Clinical Speech and Language Studies 34 520* 5 13 16 2 36Deaf Studies 20 385 6 1 1 3 2 5 2 20Drama and Theatre Studies 16 455*** 1 1 2 3 3 3 13Early and Modern Irish 15 350 1 1 1 1 1 6 11English Studies 40 495* 6 6 7 16 3 38European Studies 45 530 8 23 14 45History 38 445* 8 2 5 5 5 10 4 39History and Political Science 24 505* 7 3 9 6 25Irish Studies 20 375 5 2 2 1 4 2 16Law 90 505* 16 15 37 21 89Law and Business 25 555* 4 23 27Law and French 15 550* 15 15Law and German 15 495 1 2 4 7 2 16Law and Political Science 20 560 4 17 21Music 20 420*** 1 2 1 4 5 1 5 1 20Music Education 15 450*** 2 2 2 3 1 5 15Philosophy 17 430 4 1 3 6 3 17Philosophy and Political Science 10 505* 3 2 5 10Philosophy, Political Science, Economics & Sociology 25 525* 3 12 9 24Psychology 31 545* 6 21 3 30Social Studies 45 465 18 1 4 12 12 47Sociology and Social Policy 28 435 10 1 1 2 5 9 28World Religions & Theology 29 345 3 1 5 14 23
Leaving Cert. Points: A1=100; A2=90; B1=85; B2=80, B3=75; C1=70; C2=65; C3=60A Level points: A*=150; A=135; B=120; C=100*Not all applicants at this level were offered places.**In 2010 entry to Medicine was based on a combination of Leaving Certificate results and HPAT score. Only Leaving Certificate points are recorded in this table.***Applicants are assessed on a questionnaire/test and interview and on their Leaving Certificate examination results.
Table A15: Distribution of points within each Two-subject Moderatorship course: undergraduate new entrants* 2011
Table A16: Two Subject Moderatorship (TR001): 2011 Final minimum entry levels AH BT CC DR*** EI EC EN FR FS GG GE GK HS AR JS MI IT LT MT MU** PH PS RU SC SP
* Not all applicants at this level were offered places. ** Applicants are assessed on a music test and interview and on their Leaving Certificate examination results. *** Applicants are assessed on a questionnaire and interview and on their Leaving Certificate examination results. AH: Ancient history and archaeology BT: World religions and theology CC: Classical civilisation DR: Drama studies EI: Early Irish EC: Economics EN: English Literature FS: Film studies FR: French GG: Geography GE: German GK: Greek HS: History AR: History of art and architecture IT: Italian JS: Jewish and Islamic civilisations LT: Latin MT: Mathematics MI: Modern Irish MU: Music PH: Philosophy PS: Psychology RU: Russian SC: Sociology SP: Spanish
Table A17: Undergraduate new entrant* data by nationality - 2011/12 - 2009/10(*New Entrants to TCD only)
Table A17: Undergraduate new entrant* data by nationality - 2011/12 - 2009/10(*New Entrants to TCD only)
71
North and Central America Bahamas 0 1 0Barbados 0 0 1Bermuda 1 0 0Canada 24 31 20Cayman Islands 0 0 1Mexico 1 0 0Trinidad & Tobago 1 1 1United States of America 173 233 179
* This may include students from Northern Ireland who stated Irish as nationality.
Table A18: Distribution of 2011/12 Undergraduate New Entrants by province and county of home address*
72 2nd November 2011
County/City of home address No. students
GALWAY CITY 19GALWAY COUNTY 41LEITRIM 15MAYO 40ROSCOMMON 37SLIGO 37DUBLIN CITY 1032DUBLIN COUNTY 391CARLOW 23KILDARE 157KILKENNY 47LAOIS 19LONGFORD 16LOUTH 56MEATH 145OFFALY 25WESTMEATH 43WEXFORD 70WICKLOW 133CLARE 39CORK CITY 20CORK COUNTY 76KERRY 38LIMERICK CITY 10LIMERICK COUNTY 22TIPPERARY 49WATERFORD CITY 16WATERFORD COUNTY 18ANTRIM 8ARMAGH 1BELFAST CITY 15DERRY 8DOWN 17FERMANAGH 4TYRONE 9CAVAN 32DONEGAL 52MONAGHAN 25
2805*For those who have Irish city/county home addresses only, Nationality of students may not necessarily be Irish
Total
Leinster
Province
Connaught
Munster
Northern Ireland
Ulster (3 counties in the Republic)
Dublin
Rest of Leinster
Table A19(a):Undergraduate Non EU New Entrant* data by course - 2011/12 - 2009/10
73
Course Ft/Pt 2011/12 2010/11 2009/2010
Bachelor in Acting F 1Business Studies and a Language F 1 1Classics F 1Clinical Speech and Language Studies FDeaf Studies F 1Drama and Theatre Studies FEconomic and Social Studies F 10 5 8Education F 1English Studies F 1 2European Studies F 2 1History F 1History and Political Science F 4 2 3Law F 3 3 3Law and Business F 3 1 2Law and French F 1 1Law and Political Science F 2Music F 1Philosophy F 2Philosophy, Political Science, Economics & Sociology F 5 3 1Psychology F 2 2Sociology and Social Policy F 1One Term (AHSS) P 84 81 62Semester Start-up Program + Michaelmas Term (AHSS) P 42 43 26Semester Start-up Program + Hilary Term (AHSS) P 37 34Semester Start-up Program + One Year (AHSS) P 13 7 14
TOTAL 170 195 159Faculty of Engineering, Mathematics & ScienceComputer Science F 2 1 4Diploma in Information System P 1Earth Sciences F 1Engineering FHuman Genetics F 1Management Science and Information Systems Studies F 2Mathematics FMedicinal Chemistry F 1Natural Sciences F 7 4 1Physics and Chemistry of Advanced Materials F 1Theoretical Physics F 2Semester Start-up Program + One Year (Science) F
TOTAL 14 7 7Faculty of Health SciencesB.Sc. (Human Nutrition & Dietetics) - Joint F 2 1Dental Science F 8 8 7Medicine (5-year) F 45 43 38Physiotherapy F 2
TOTAL 55 52 47Multi-FacultyBusiness and Computing F 2Two Subject Moderatorship F 14 10 6One Year Students F 28 37 40Part Year, One-Term and Two-Term Students (AHSS/EMS/HS) P 2 9 4Semester Start-up Program + Michaelmas Term (AHSS+EMS/HS) P 10 6Semester Start-up Program + Hilary Term (AHSS+EMS+HS) P 5 3Semester Start-up Program + Michaelmas Term (EMS+HS) P 3 1 2Semester Start-up Program + Hilary Term (EMS+HS) P 2Semester Start-up Program + Hilary Term (AHSS+EMS+HS) P 1Semester Start-up Program + One Year (AHSS+EMS+HS) P 1
TOTAL 59 70 57
GRAND TOTAL 298 324 270
Faculty of Arts, Humanities and Social Sciences
Table A19 (b): Undergraduate Non EU New Entrant data* by course and Gender - 2011/12 - 2009/10
74
Course Ft / Pt Female Male Female Male Female Male
Bachelor in Acting F 1Business Studies and a Language F 1 1Classics F 1Clinical Speech and Language Studies FDeaf Studies F 1Drama and Theatre Studies FEconomic and Social Studies F 7 3 3 2 6 2Education F 1English Studies F 1 2European Studies F 2 1History F 1History and Political Science F 3 1 2 1 2Law F 2 1 1 2 1 2Law and Business F 1 2 1 2Law and French F 1 1Law and Political Science F 1 1Music F 1Philosophy F 1 1Philosophy and Political Science FPhilosophy, Political Science, Economics & Sociology F 3 2 3 1Psychology F 1 1 2One Term (AHSS) P 55 29 52 29 47 15Semester Start-Up + Michaelmas Term (AHSS) P 33 9 32 11 17 9Semester Start-up Program + Hilary Term (AHSS) P 28 9 23 11Semester Start-up Program + One Year (Arts) P 9 4 6 1 9 5Sociology and Social Policy F 1
TOTAL 116 54 134 61 108 51
Computer Science F 1 1 1 1 3Diploma in Information Systems P 1Earth Sciemces F 1Engineering FHuman Genetics F 1Management Science and Information Systems Studies F 1 1Mathematics FMedicinal Chemistry F 1Natural Sciences F 3 4 1 3 1Physics and Chemistry of Advanced Materials F 1Theoretical Physics F 2
TOTAL 6 8 3 4 1 6Faculty of Health SciencesB.Sc. (Human Nutrition & Dietetics) - Joint F 2 1Dental Science F 4 4 5 3 6 1Medicine (5-year) F 26 19 20 23 18 20Physiotherapy F 1 1
TOTAL 32 23 26 26 25 22
Two Subject Moderatorship F 9 5 4 6 3 3Business and Computing F 2One Year Student F 20 8 29 8 29 11Part Year, One-Term and Two-Term Students (AHSS, EMS, HS) P 1 1 4 5 3 1Semester Start-up Program + Michaelmas Term (AHSS+EMS/HS) P 7 3 3 3Semester Start-up Program + Hilary Term (AHSS +EMS+HS) P 5 1 2Semester Start-up Program + Michaelmas Term (EMS+HS) P 1 2 1 2Semester Start-up Program + Hilary Term (EMS+HS) P 1 1 1Semester Start-up Program +One Year (AHSS, EMS+HS) P 1
TOTAL 38 21 47 23 37 20GRAND TOTAL 192 106 210 114 171 99
Faculty of Engineering, Mathematics & Science
Multi Faculty
Faculty of Arts, Humanities & Social Sciences
2009/20102010/112011/12
Table A20: Repeated survey of undergraduate new entrants 2011, 2010, 2009
75
Why did you choose Trinity College?* 2011 2010 2009
Reputation of the Course at TCD 69% 64% 59%
International Reputation 69% 63% 59%
Employment Prospects 59% 57% 53%
Content of TCD Course 57% 54% 51%
Reputation for Quality in Research 42% 32% 32%
Location 34% 34% 34%
College Life and Societies 32% 32% 32%
Course only available at TCD** 26% 27% n/a
TCD is closest to home ** 21% 21% n/a
Information from School ** 7% 6% n/a
Friends coming to TCD ** 5% 5% n/a
** New questions in 2010
*The percentage indicates the number of respondents who indicated on a scale 1-4 that the above factors were very important in their choice of Trinity College (very important = 1).
76
APPENDIX B - STUDENT POPULATION The number of registered students for 2010/11 was 16,747. The geographical distribution of the student body is detailed in Table B1 below. Table B1: Geographical distribution of the student body, based on nationality, 2010/11
Number of Students 2010/11
% Distribution
2010/11
% Distribution
2009/10 Ireland: 13,149* 78.5% 79.8 Europe (EU): 1892 11.3% 11.0 Europe (Non EU): 152 0.9% 0.8 Africa: 241 1.4% 1.5 Asia: 535 3.2% 2.9 Australasia: 28 0.2% 0.1 North & Central America: 731 4.4% 3.9 South America: 19 0.1% 0.1 TOTAL: 16,747 100.0% 100% * Which includes 352 from Northern Ireland based on home address details. Comparative figures for the years 2010/11 – 2005/06 are detailed in Table B2 below.
Total 2009/10 18 11 14 4 47% of total 38% 23% 30% 9% 100%Total 2008/09 82 (80%) 6 (6%) 13 (13%) 1 (1%) 102 (100%)
Table C2: Appointments by qualification 2010/11
Table C2: Appointments by qualification 2009/10
*Please note that the reduction in the number of appointments of Lecturers with Ph.Ds can be partly explained by the high amount of appointments in the Faculty of Health Sciences. The majority of these lecturers are medical doctors and have higher professional medical qualifications.
* With effect from 1994/95, all full-time postgraduate degree students were calculated as equivalents to 1 FTE (rather than equivalent to 3 FTEs).
Engineering, Mathematics and Science 786.00281.94 2858.51 498.96
Student FTE 2010-11
15
2010/11 - 2007/08
Staff FTE 2010-11
* The calculation of staff/student ratios in 2010/11 does not include those postgraduate research students made live on College systems for thesis examination only
Summary of Analysis
Arts, Humanities & Social Sciences 812.91 216973.504967.84330.47
80
STAFF/STUDENT RATIOS 2010/11Faculty of Arts, Humanities and Social Sciences Table C4 (b)
STAFF/STUDENT RATIOS 2010/11Faculty of Arts, Humanities and Social Sciences Table C4 (b)
Staff figures include:History Professors figure includes Chair of Contemporary Irish History. Lecturers figure includes one Lecturer funded from self-financing MPhil programme in Modern Irish History, and one Lecturer funded from an external benefactionClassics Lecturers figure includes Walsh Family LectureshipHistory of Art Includes one Senior Lecturer for the Centre for Research in Irish Art History and 1 Ussher Lecturer. Includes one Lecturer for the Centre for Research in Irish Art History
Language and Communication Professors figure excludes Stokes Professor, funded by SFI. Senior Lecturers figure Includes Dr. Jeffrey Kallen, transferred from CSLS, and one Senior Lecturer transferred from ITEStudies Includes 2 Lecturers and 1 Full-time Tutor for self-financing programme in Deaf Studies and 2 Lecturers transferred from the ITE. Also includes 1 Lecturer funded from SIF monies, and 2 x 0.5 FTE Lecturers in respect of Deaf Studies
one of whom, now deceased, was in post at 1/01/2011.
Drama Chair funded from a benefaction, vacant at 1/01/2011. Includes one Temporary Lecturer in lieu of vacancy in the Chair of DramaMusic Includes 2 Lecturers each at 0.5 FTE (Andrew Johnstone and Orla Flanagan) and 1 Ussher Lecturer
English Senior Lecturer figure includes Dr.Crawford Gribben as 1 FTE (previously 0.5 FTE). Includes 1 Lecturer for self-financing course in Children’s Literature and 1 Ussher Lecturer
Germanic Studies Excludes one temporary Lecturer, 50% supporting former Head of School and 50% replacing Professor Barkhoff during his tenure of the office of RegistrarIrish & Celtic Languages Chair of Early Irish, part-funded from a benefactionRussian & Slavonic Studies Includes Thomas Brown Lecturer, funded from a benefaction. Excludes 0.5 Lecturer for Head of School support - Head of School included as I FTE under Senior LecturersFrench Includes 1 Ussher Lecturer
Business Studies Includes Chair of International Business and Chair in International Business & Development, and 0.7 FTE Visiting Professorship. Also includes 0.41 Adjunct Professor (E.P.O’Neill)Includes one Associate Professor now funded from MBA Programme (L. Brennan). Senior Lecturers figure Includes 0.2 FTE of retired staff member (Dr. P. McCabe) on post-retirement buy-back.Includes 1 Lecturer funded from MBA Programme (M. Brady), Director, MBA Programme, and 3 Lecturers funded from self-financing courses.
Psychology Professors figure includes 0.5 FTE for Chair of Childhood Research, held in Children’s Research Centre and funded from a benefaction (0.5 FTE attributed to the School of Social Work and Social Policy)Includes 2 Senior Lecturers funded from self-financing coursesIncludes 8 Lecturers and 1 Lecturer/Clinical Coordinator funded from self-financing courses
Politcial Science Includes 2 Lecturers funded from self-financing courses, one SIF-funded Lecturer and one Ussher Lecturer.and 0.2 FTE of Lecturer on post-retirement buy-backEconomics Includes 2 FTE Lecturers in respect of Teaching Assistants. Includes two Lecturers funded from benefaction, one Lecturer funded from self-financing M.Sc. programme and one SIF-funded Lecturer
Excludes Lecturers paid from self-financing activity accounts.
Social Work & Social Policy Professor figure includes 0.5 FTE Chair of Childhood Research. Senior Lecturers figure includes one Senior Lecturer in each of self-financing programmes Addiction Studies and Child Protection & Welfare.Includes 2 Lecturers for self-financing MSW Programme and one Lecturer for self-financing Addiction Studies Programme. Also includes one Lecturer funded by Department of Health, 0.5 Lecturer invoiced in from Department of Justice, 0.5 Lecturer funded by M.Sc in Applied Social Studies and 0.4 Lecturer (Paula Mayock – balance from CRC). Excludes supernumerary Lecturer B. Cullen
Law Lecturers figure includes DAAD-sponsored Fachlektor at 0.62 FTE
Staff figures include:Statistics Includes 0.09 FTE in respect of retired Senior Lecturer on post-retirement buy-back. Excludes 1 full-time Lectureship previously filled on a 0.5 FTE basis, currently vacant following retirement of Dr. Remenyi in
September 2009.Computer Science Professors figure includes FTE of Professor Grimson reduced to take account of external secondment. Includes 0.2 FTE in respect of retired Senior Lecturer on post-retirement buy-back
Excludes two Research Lecturers funded from research income. Includes 0.8 FTE in respect of Dr. Marie Redmond, and 0.6 FTE each in respect of Ms. Paula Roberts, Ms. Gaye Stephens, Mr. Alexis Donnelly and Dr. Declan O’Sullivan. Includes 0.7 FTE in respect of Dr. Ken Dawson-Howe. Includes 1 Ussher Lecturers.
Civil Engineering Includes McNamara Chair. Includes one Lecturer funded from Departmental Pay Account, and two x 0.5 FTE (Drs. McElvaney and Harty) for self-financing coursesMechanical Engineering Includes 1 Ussher Lecturer and 3 Lecturers for self-financing MEMS Programme joint with Statistics. Electronic & Electrical Includes Chair of Neural Engineering. Excludes one Associate Professor funded from SFI Stokes Award. Excludes one Lecturer funded from SFI Stokes award. Includes 1 Ussher Lecturer. Engineering Includes Dr. Fionnuala Conway as 0.26 FTE
Biochemistry & Immunology Includes 1 Senior Lecturer for Neuroscience and 1 Senior Lecturer for Immunology. Includes 1 Lecturer for Immunology, 1 Ussher Lecturer and 0.05 FTE in respect of post-retirement buy-back Figure for Demonstrators includes 0.14 FTE in respect of Biology Teaching Centre, and 0.08 FTE in respect of Neuroscience Demonstrators
Chemistry Includes 1 Ussher Lecturer. Includes 0.07 FTE in respect of Science of Materials
Mathematics Includes 0.06 FTE in respect of Maths Methods
Botany Includes Professor Nicholas Grey as 1 FTE in Botany. Senior Lecturer figure includes 0.17 FTE in respect of Director of Biology Teaching CentreGeography Senior Lecturers figure includes 0.5 FTE Dr. Robin Edwards. Remaining 0.5 FTE included under Senior Lecturers in Geology. Includes 2 Lecturers in respect of self-financing courses.Geology Includes 1 Ussher LecturerZoology Senior Lecturer figure includes 0.34 FTE in respect of Director of Biology Teaching Centre
83
STAFF/STUDENT RATIOS 2010/2011
Faculty of Health Sciences
Table C4(d)
RATIOS 2007/08
RATIOS 2008/09
RATIOS 2009/10 SCHOOLS & DEPARTMENTS STAFF FTE
STUDENT FTE RATIOS 2010/11
Professors FTE
Associate Professors
FTE
Senior Lecturers
FTE
Lecturers FTE
Part-time Lecturers
FTE
Demonstrators FTE Undergraduate Postgraduate
TaughtPostgraduate
Research Total
9 10 10 School of Dental Science 4.5 1 13 8 1.5 0 28.00 246.62 18.00 33.00 297.62 11School of Medicine
Pharmacy & Lecturers figure includes Dr. Sheridan as 0.5 FTE. Excludes Dr. Mariusz Kamionka, wholly funded from external sourcesPharmaceutical Sciences
Includes 0.25 Lecturer/Registrar charged in from AMiNCH, and 0.5 Lecturer/Registrar joint with Coombe Women’s HospitalIncludes one Lecturer in AMiNCH, funded by School of Medicine fee income account, and one Lecturer on 3-year contract replacing vacancy occurring in Associate Professor post in Clinical Nutrition
Includes one Associate Professor funded from SIF II and one Associate Professsor funded from HEA Expert Skills Programme. Includes one Lecturer in Neuroscience, funded from HEA Expert Skills programmeIncludes one Senior Lecturer fully funded by HSE. Includes 1 Ussher Lecturer, 0.5 FTE joint with St. Patrick’s Hospital and 0.5 FTE joint with, and fully funded by, the CMH and 0.4 Lecturer funded from self-financing course income
Lecturers figure excludes Lecturers currently absent on Career Breaks. Includes 10.66 FTE of Clinical Nurse Tutors. Includes 1 FTE Lecturer invoiced in from HSE (Central Mental Hospital)(M. Brennan), 0.5 FTE Lecturer invoiced in from St. Francis’s Hospice (K. Connaire) and 0.5 FTE Lecturer joint appointment with, and invoiced in from, St. James’s Hospital (Anna Ayton, nee Watson)
Includes 1 Professor for M.Sc in Global Health (Kennedy Chair). Includes 1 Senior Lecturer for M.Sc in Health Services Management. Includes two Lecturers funded from external sources and one Lecturer/Co-Ordinators for M.Sc in Health Services Management. Includes 1 Ussher Lecturer. Excludes 0.5 FTE Senior Lecturer joint with HSE and vacant since Professor Joe Barry’s appointment to a Chair in October 2009.Includes one Lecturer in AMiNCH funded by School of Medicine accountIncludes one Lecturer funded by School of Medicine account Lecturers figure includes 2 FTE Fieldwork Co-Ordinators (1 Full-time, 2 x 0.5 FTE).
84
APPENDIX D - ACADEMIC PROGRESSTable D1: Junior Freshman full-time degree students successfully completing the year 2010/11-2007/08
Pass rates are based on annual, supplemental and special examination results and are calculated on the basis of the number of students passing examinations compared to students registered at the end of Trinity term.
Faculty of Health Sciences
Multi-Faculty
87
2011 2011 2011 2010 2010 2010 2009
Faculty / CourseTotal Number of
Scholarships awarded
Total number of SF students
% of SF students who received a
Scholarship
Total Number of Scholarships
awarded
Total number of SF students
% of SF students who received a
Scholarship
Total Number of Scholarships
awarded
Faculty of Arts, Humanities and Social SciencesAncient and Medieval History and Culture 0 16 0% 0 0 0 0Bachelor in Education 0 203 0% 0 203 0% 0Bachelor in Music Education 1 11 9% 0 10 0% 0Business Studies and a Language 0 38 0% 0 43 0% 1Classics 0 6 0% 0 4 0% 0Clinical Speech and Language Studies 0 32 0% 1 28 4% 0Drama and Theatre Studies 0 15 0% 2 18 11% 0Early and Modern Irish 0 2 0% 0 7 0% 0Economic and Social Studies 7 258 3% 5 241 2% 10English Studies 2 46 4% 2 43 5% 0European Studies 2 41 5% 1 42 2% 2Germanic Languages 0 0 0% 0 1 0% 0History 0 38 0% 0 43 0% 0History and Political Science 1 28 4% 2 24 8% 2Irish Studies 1 19 5% 0 15 0% 0Law 3 99 3% 3 95 3% 3Law and Business 1 24 4% 0 0 0%Law and French 1 14 7% 1 10 10% 4Law and German 0 19 0% 0 14 0% 0Law and Political Science 1 23 4% 0 0 0% 0Music 2 24 8% 1 24 4% 1
Philosophy (formerly Mental and Moral Science) 0 19 0% 2 23 9% 2
As at 10 October 2011: Data will be revised to reflect reports received 'late'/ during the academic year
Table D3 - External Examiners for undergraduate courses appointed to examine in 2010/11
2010/11
Table D4: Degrees conferred 2010 - 2001
89
2010 2009 2002 2001
In Person In Absentia In Person In Absentia In Person In Absentia In Person In Absentia In Person In Absentia In Person In Absentia In Person In Absentia In Person In Absentia In Person In Absentia In Person In Absentia
*'Other' includes the following returns: Absent, Awaiting Result, Deferred, Excluded, Fail, Incomplete, Medical Certificate, Repeat Year, Withdrawn, Withheld, Not Satisfactory, NQP, No Result, No Result Available
Table D6: Distribution of grades achieved by course at undergraduate degree examinations in 2010/11
*Numbers on these courses increased after the October/November period due to late registrations. 1Students registered at 18th October 20102Students registered at 27th January 2011
Recommended Criteria for the Award of a Gold Medal
Senior Lecturer's Annual Report 2010/11 96
Course
Minimum overall percentage required to be recommended for the award of a Gold Medal
Category
FACULTY OF ARTS, HUMANITIES AND SOCIAL SCIENCESAncient and Medieval History and Culture 73% or 75% Category 5Biblical and Theological Studies 73% or 75% Category 5Business Studies 73% Category 3Business Studies and a Language 73% Category 3Classics 73% or 75% Category 5Clinical Speech and Language Studies 75% Category 2Computer Science, Linguistics and a Language 73% Category 4Deaf Studies 73% Category 3Drama and Theatre Studies 73% or 75% Category 5Early and Modern Irish 73% or 75% Category 5Economic and Social Studies 73% Category 3Education (honors 4th year) 73% Category 3English Studies 73% or 75% Category 5European Studies 73% Category 3Germanic Languages 73% Category 3History 73% Category 3History and Political Science (course taken as a two part Moderatorship) 73% or 75% Category 5History and Political Science (course taken equally for 4 years) 73% Category 3Irish Studies 73% or 75% Category 5Law 73% Category 3Law and Business 73% Category 3Law and French 73% Category 3Law and German 73% Category 3Law and Political Science 73% Category 3Mental and Moral Science 73% or 75% Category 5Music 73% or 75% Category 5Music Education 70% Category 6Philosophy 73% or 75% Category 5Philosophy and Political Science (course taken as a two part Moderatorship) 73% or 75% Category 5Philosophy and Political Science (course taken equally for four years) 73% Category 3Philosophy, Political Science, Economics and Sociology 73% Category 3Political Science and Geography 73% Category 3Psychology 73% or 75% Category 5Religions and Theology 73% or 75% Category 5Social Studies 73% Category 3Sociology and Social Policy 73% Category 3Theology (honors 4th year) 73% Category 3World Religions and Theology 73% or 75% Category 5
FACULTY OF ENGINEERING, MATHEMATICS AND SCIENCEBusiness and Computing 73% Category 3Chemistry with Molecular Modelling 75% Category 2Computer Science (BA) 80% Category 1Computer Science (BSc) 80% Category 1Earth Sciences 75% Category 2Engineering 80% Category 1Engineering - Double Diploma 80% Category 1Engineering with Management 80% Category 1Human Genetics 75% Category 2Information Systems (BSc) (hons) 80% Category 1Management Science and Information Systems Studies 75% Category 2Mathematics 80% Category 1Medicinal Chemistry 75% Category 2Nanoscience, Physics and Chemistry of Advanced Materials 75% Category 2Physics and Chemistry of Advanced Materials 75% Category 2Natural Sciences 75% Category 2Theoretical Physics 80% Category 1
Table G1
Appendix GGold Medals
Recommended Criteria for the Award of a Gold Medal
Senior Lecturer's Annual Report 2010/11 97
Course
Minimum overall percentage required to be recommended for the award of a Gold Medal
Category
FACULTY OF HEALTH SCIENCESChildren's and General Nursing 75% Category 8Dental Science 70% Category 6Human Health and Disease 75% Category 2Human Nutrition and Dietetics 80% Category 7Medicince (5-year) 70% Category 6Medicine 70% Category 6Midwifery (BSc) 75% Category 8Nursing (BSc) 75% Category 8Occupational Therapy 75% Category 2Pharmacy 75% Category 2Physiotherapy 75% Category 2Radiation Therapy 75% Category 2
MULTI-FACULTYTwo Subject Moderatorship - Pattern A 73% Category 3Two Subject Moderatorship - Pattern B 73% or 75% Category 5Two Subject Moderatorship - Pattern C 73% or 75% Category 5
New Criteria, as approved by Board on 1 June 2011
Category 1: Overall mark of 80% and aboveCategory 2: Overall mark of 75% and above
Category 6: Overall mark of 70% and aboveCategory 7: Overall mark of 80% and above (first class degree awarded at 75%)
Category 3: Overall mark of 73% and above where all modules have a mark of 70% and above
Category 5: Courses which have a two part Moderatorship. Moderatorship Part 1 = 70% and above (overall); Moderatorship Part 2 = 73% and above (overall) where all modules have a mark of 70% and above, OR 75% and above (overall)
Category 4: Overall mark of 73% and above, OR a first class result in each component of the degree
Category 8: Overall mark of 75% and above in SS year, and overall mark of 70% and above in JS year, and must pass all clinical placements on first attempt in JS and SS years
98
APPENDIX H
Table H1* – CAO points Irish new entrants who withdrew from 2004/05 – 2006/07 cohorts
*Excludes Specials i.e. mature, mature Nursing, Access LC and Access Foundation etc. Table H2 below outlines the standing and year of withdrawn for the 2006/07 cohort and is generally in line with the other five cohorts analysed since 2001/02. Table H2 – 2006/07 cohort - Standing and Year of Withdrawal
Year JF SF JS SS Total 2006/07 125 0 0 0 125 2007/08 93 40 0 0 133 2008/09 31 39 11 0 81 2009/10 7 21 9 1 38