This document is intended for the sole use of the party to whom it is addressed and may contain information that is privileged and/or confidential. If you have received this in error, please notify us immediately. ® RWDI name and logo are registered trademarks in Canada and the United States of America Reputation Resources Results Canada | USA | UK | India | China | Hong Kong | Singapore www.rwdi.com Tel: 519.823.1311 Fax: 519.823.1316 RWDI AIR Inc. 650 Woodlawn Road West Guelph, Ontario, Canada N1K 1B8 West Carleton Environmental Centre Landfill Ottawa, Ontario Final Report Emission Summary & Dispersion Modelling Report RWDI # 1302177 July 30, 2014 SUBMITTED TO Wayne Jenken Landfill Engineer – Southwest Landfills [email protected]Rémi Godin, P.Eng Landfill Project Engineer [email protected]Waste Management of Canada Corporation West Carleton Environmental Centre Landfill 2301 Carp Road, Ottawa, ON K0A 1L0 P: (613) 831-5363 F: (613) 831-8928 SUBMITTED BY Brad Bergeron, A.Sc.T., d.E.T Senior Project Manager / Principal [email protected]John DeYoe, B.A. d.E.T Project Director / Associate [email protected]Brian Sulley, B.A.Sc., P.Eng. Senior Specialist [email protected]Claire Finoro, B.Sc. (Eng) Project Scientist [email protected]
Transcript
This document is intended for the sole use of the party to whom it is addressed and may contain information that is privileged and/or confidential. If you have received this in error, please notify us immediately.
® RWDI name and logo are registered trademarks in Canada and the United States of America
Reputation Resources Results Canada | USA | UK | India | China | Hong Kong | Singapore www.rwdi.com
Tel: 519.823.1311 Fax: 519.823.1316 RWDI AIR Inc. 650 Woodlawn Road West Guelph, Ontario, Canada N1K 1B8
West Carleton Environmental Centre Landfill Ottawa, Ontario
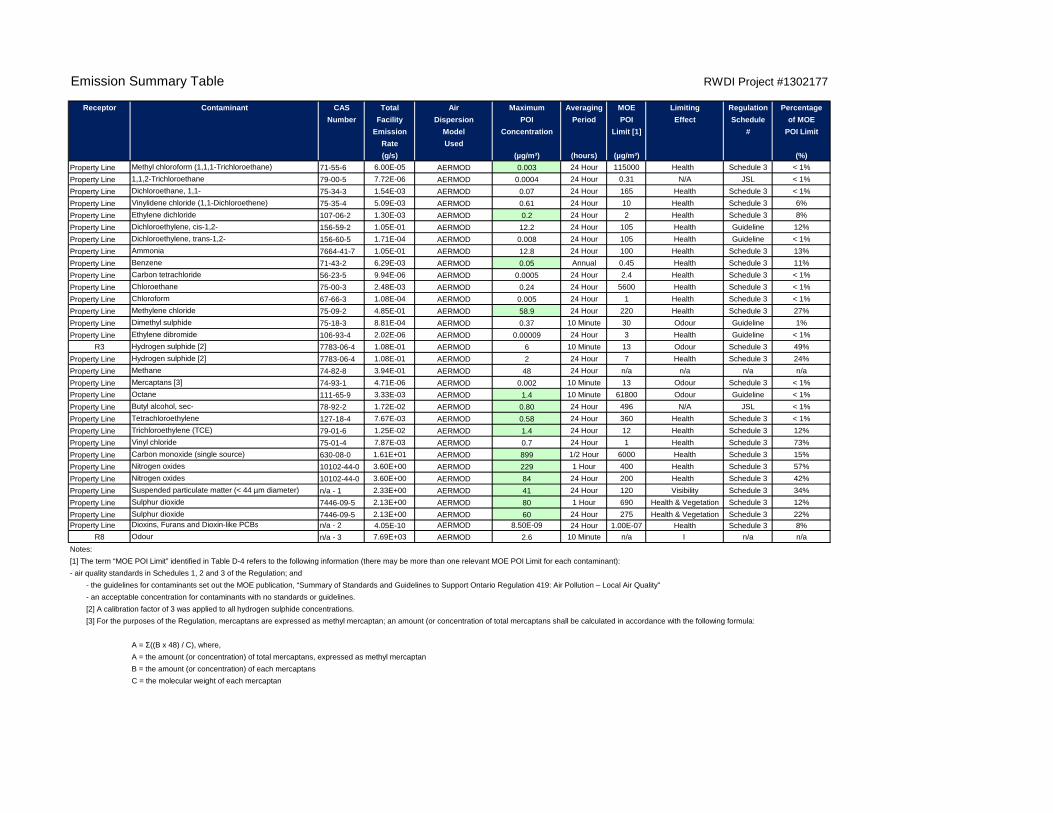
[1] The term “MOE POI Limit” identified in Table D-4 refers to the following information (there may be more than one relevant MOE POI Limit for each contaminant):
- air quality standards in Schedules 1, 2 and 3 of the Regulation; and
- the guidelines for contaminants set out the MOE publication, “Summary of Standards and Guidelines to Support Ontario Regulation 419: Air Pollution – Local Air Quality"
- an acceptable concentration for contaminants with no standards or guidelines.
[2] A calibration factor of 3 was applied to all hydrogen sulphide concentrations.
[3] For the purposes of the Regulation, mercaptans are expressed as methyl mercaptan; an amount (or concentration of total mercaptans shall be calculated in accordance with the following formula:
A = Ʃ((B x 48) / C), where,
A = the amount (or concentration) of total mercaptans, expressed as methyl mercaptan
B = the amount (or concentration) of each mercaptans
C = the molecular weight of each mercaptan
Reputation Resources Results Canada | USA | UK | India | China | Hong Kong | Singapore www.rwdi.com
WCEC Landfill Emission Summary & dispersion Modelling Report Waste Management of Canada Corporation RWDI#1302177 July 30, 2014
TABLE OF CONTENTS
1. INTRODUCTION AND FACILITY DESCRIPTION ............................................................................... 1
1.1 Purpose and Scope of ESDM Report ........................................................................................... 1
1.2 Description of Process & NAICS Code(S) .................................................................................... 1
1.3 Description of Products and Raw Materials .................................................................................. 1
1.3.1 Fugitive Landfill Emissions from Existing Landfill Mound ................................................. 1
1.3.2 Fugitive Landfill Emissions from Proposed Landfill Mound ............................................... 2
Estimates of the particulate matter emission rates from landfilling and construction operations were
obtained using the relevant chapters from AP-42. These documents provide a reasonable general
estimate of emission rates in dry conditions. Formulae and emission factors for calculating particulate
matter emission rates are presented below.
Reputation Resources Results Canada | USA | UK | India | China | Hong Kong | Singapore www.rwdi.com
WCEC Landfill Emission Summary & dispersion Modelling Report Waste Management of Canada Corporation RWDI#1302177 July 30 2014
Page 18
4.2.6.2 Material Handling Emission Rates
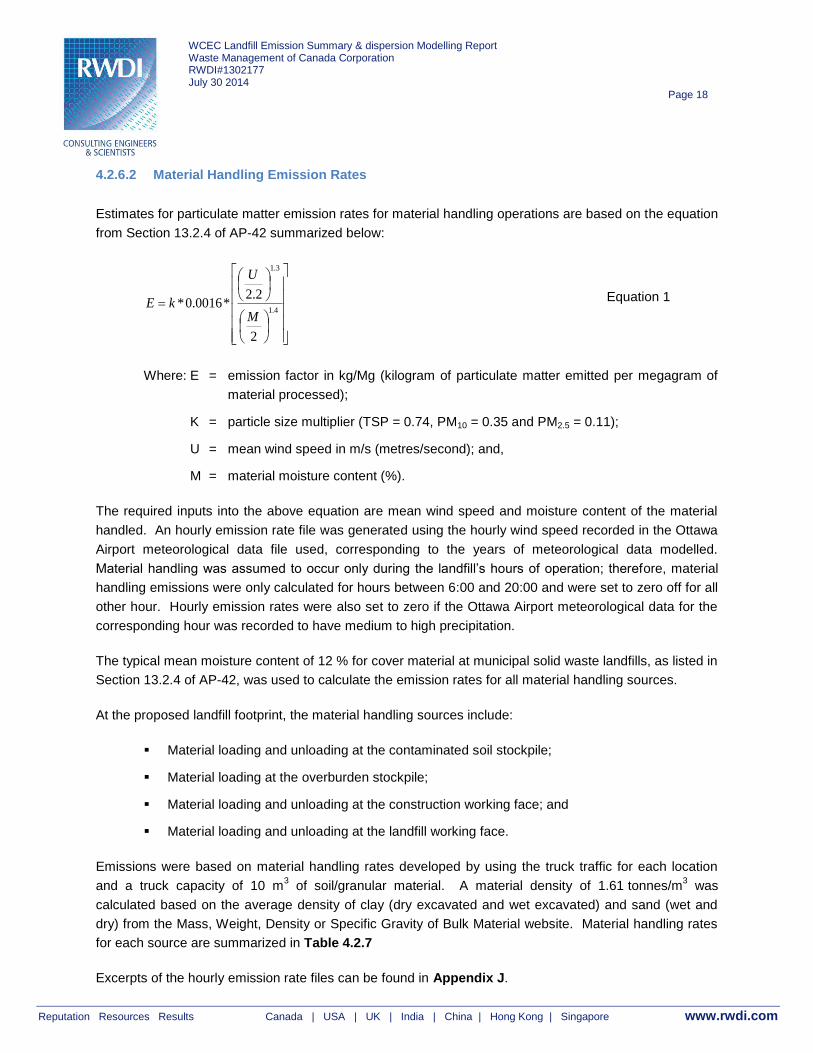
Estimates for particulate matter emission rates for material handling operations are based on the equation
from Section 13.2.4 of AP-42 summarized below:
4.1
3.1
2
2.2*0016.0*
M
U
kE Equation 1
Where: E = emission factor in kg/Mg (kilogram of particulate matter emitted per megagram of
material processed);
K = particle size multiplier (TSP = 0.74, PM10 = 0.35 and PM2.5 = 0.11);
U = mean wind speed in m/s (metres/second); and,
M = material moisture content (%).
The required inputs into the above equation are mean wind speed and moisture content of the material
handled. An hourly emission rate file was generated using the hourly wind speed recorded in the Ottawa
Airport meteorological data file used, corresponding to the years of meteorological data modelled.
Material handling was assumed to occur only during the landfill’s hours of operation; therefore, material
handling emissions were only calculated for hours between 6:00 and 20:00 and were set to zero off for all
other hour. Hourly emission rates were also set to zero if the Ottawa Airport meteorological data for the
corresponding hour was recorded to have medium to high precipitation.
The typical mean moisture content of 12 % for cover material at municipal solid waste landfills, as listed in
Section 13.2.4 of AP-42, was used to calculate the emission rates for all material handling sources.
At the proposed landfill footprint, the material handling sources include:
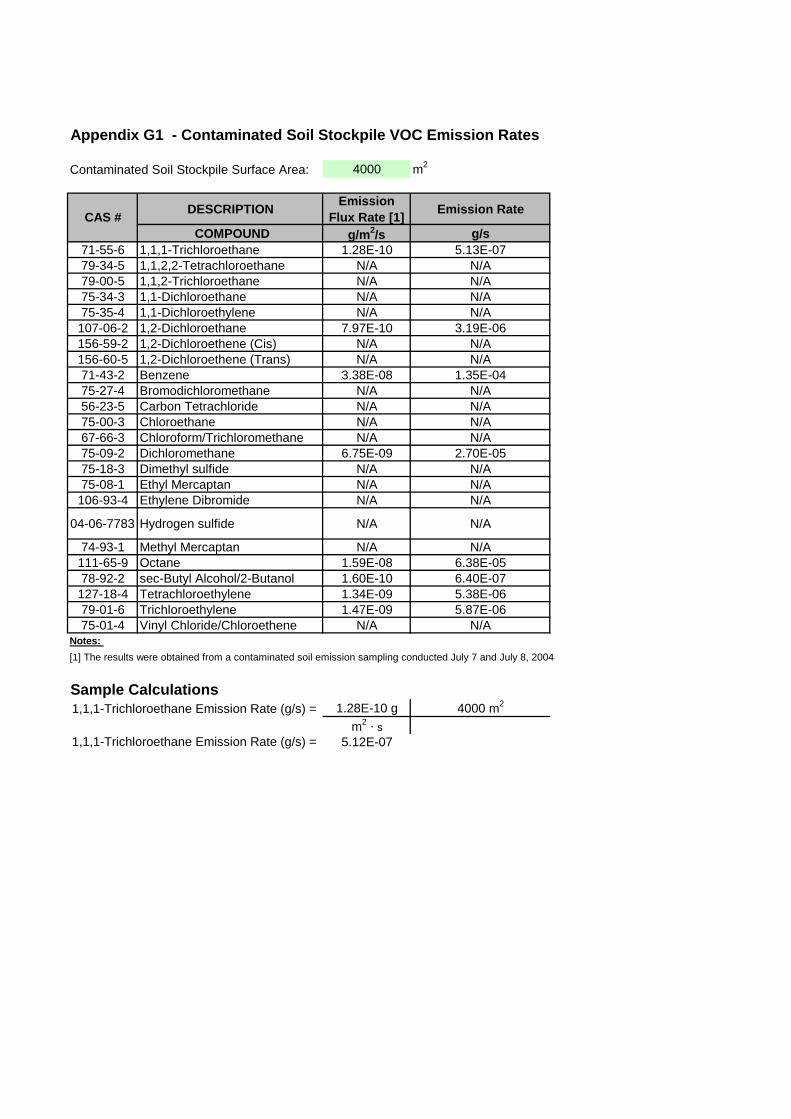
Material loading and unloading at the contaminated soil stockpile;
Material loading at the overburden stockpile;
Material loading and unloading at the construction working face; and
Material loading and unloading at the landfill working face.
Emissions were based on material handling rates developed by using the truck traffic for each location
and a truck capacity of 10 m3 of soil/granular material. A material density of 1.61 tonnes/m
3 was
calculated based on the average density of clay (dry excavated and wet excavated) and sand (wet and
dry) from the Mass, Weight, Density or Specific Gravity of Bulk Material website. Material handling rates
for each source are summarized in Table 4.2.7
Excerpts of the hourly emission rate files can be found in Appendix J.
Reputation Resources Results Canada | USA | UK | India | China | Hong Kong | Singapore www.rwdi.com
WCEC Landfill Emission Summary & dispersion Modelling Report Waste Management of Canada Corporation RWDI#1302177 July 30 2014
Page 19
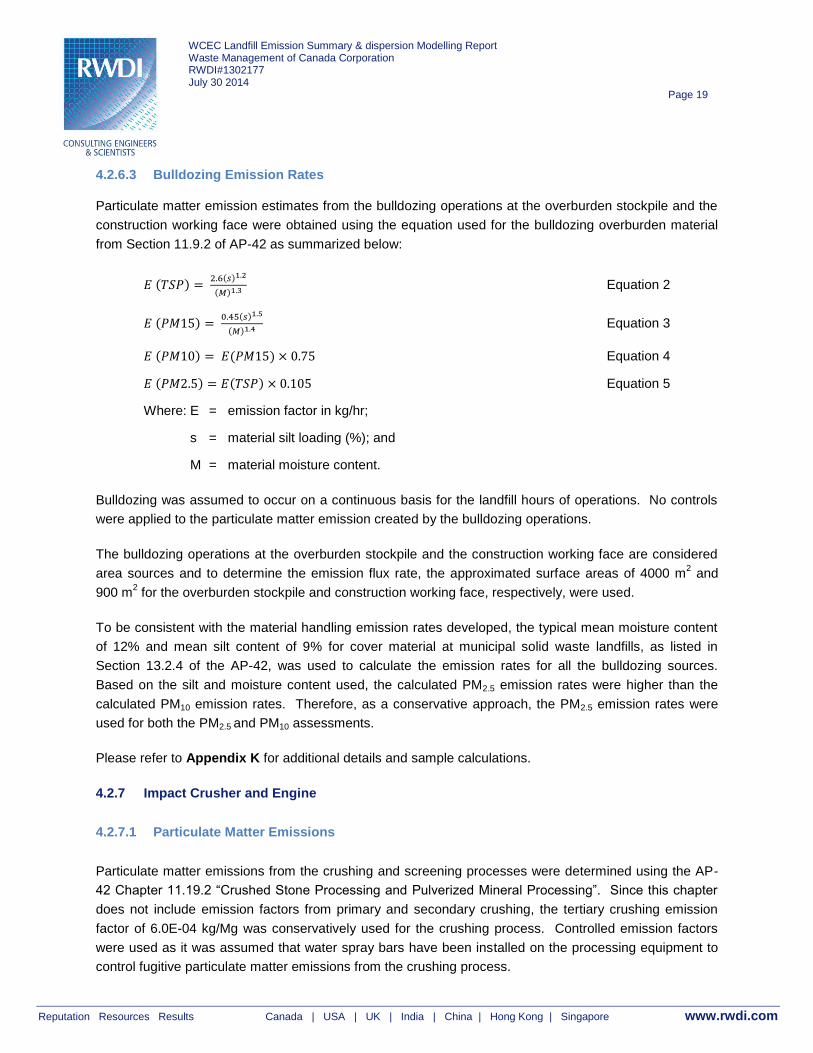
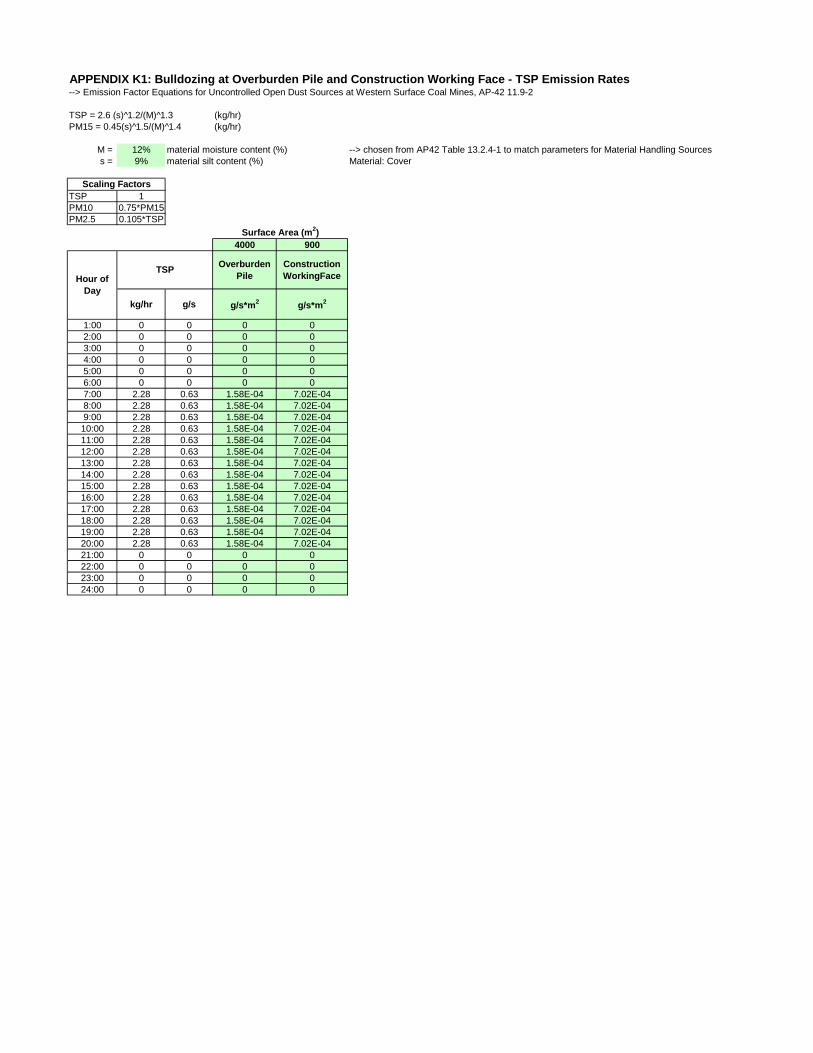
4.2.6.3 Bulldozing Emission Rates
Particulate matter emission estimates from the bulldozing operations at the overburden stockpile and the
construction working face were obtained using the equation used for the bulldozing overburden material
from Section 11.9.2 of AP-42 as summarized below:
( ) ( )
( ) Equation 2
( ) ( )
( ) Equation 3
( ) ( ) Equation 4
( ) ( ) Equation 5
Where: E = emission factor in kg/hr;
s = material silt loading (%); and
M = material moisture content.
Bulldozing was assumed to occur on a continuous basis for the landfill hours of operations. No controls
were applied to the particulate matter emission created by the bulldozing operations.
The bulldozing operations at the overburden stockpile and the construction working face are considered
area sources and to determine the emission flux rate, the approximated surface areas of 4000 m2 and
900 m2 for the overburden stockpile and construction working face, respectively, were used.
To be consistent with the material handling emission rates developed, the typical mean moisture content
of 12% and mean silt content of 9% for cover material at municipal solid waste landfills, as listed in
Section 13.2.4 of the AP-42, was used to calculate the emission rates for all the bulldozing sources.
Based on the silt and moisture content used, the calculated PM2.5 emission rates were higher than the
calculated PM10 emission rates. Therefore, as a conservative approach, the PM2.5 emission rates were
used for both the PM2.5 and PM10 assessments.
Please refer to Appendix K for additional details and sample calculations.
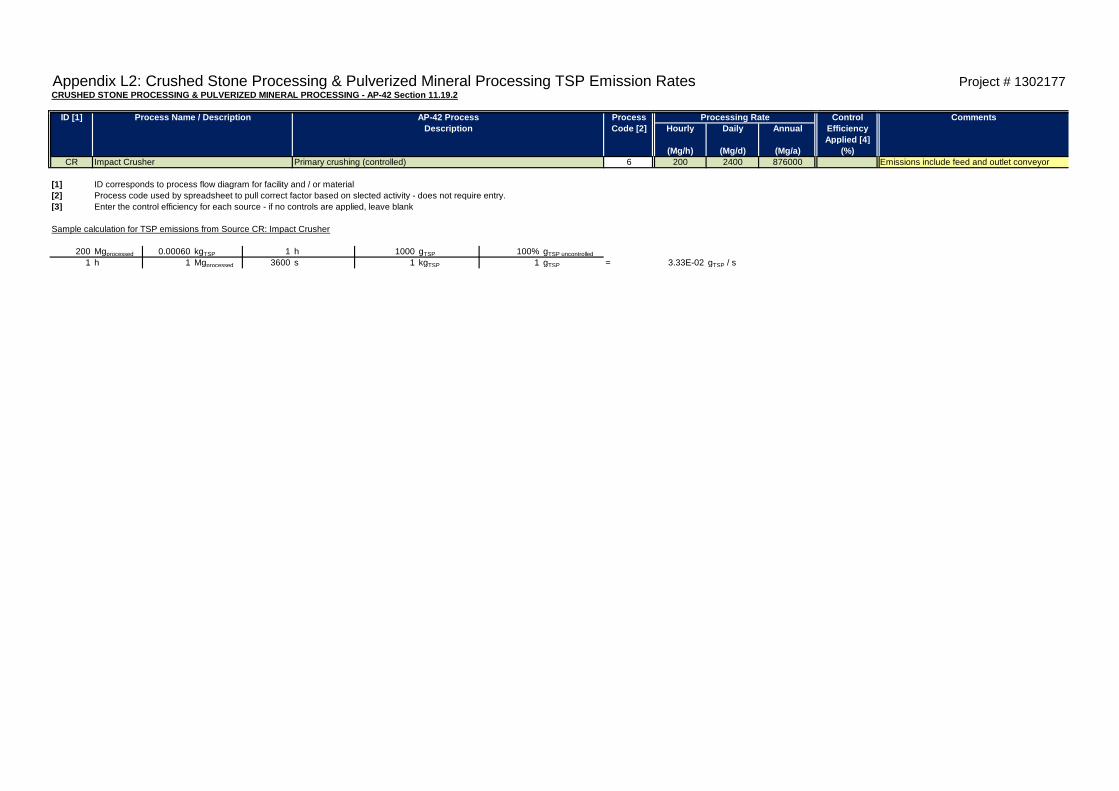
4.2.7 Impact Crusher and Engine
4.2.7.1 Particulate Matter Emissions
Particulate matter emissions from the crushing and screening processes were determined using the AP-
42 Chapter 11.19.2 “Crushed Stone Processing and Pulverized Mineral Processing”. Since this chapter
does not include emission factors from primary and secondary crushing, the tertiary crushing emission
factor of 6.0E-04 kg/Mg was conservatively used for the crushing process. Controlled emission factors
were used as it was assumed that water spray bars have been installed on the processing equipment to
control fugitive particulate matter emissions from the crushing process.
Reputation Resources Results Canada | USA | UK | India | China | Hong Kong | Singapore www.rwdi.com
WCEC Landfill Emission Summary & dispersion Modelling Report Waste Management of Canada Corporation RWDI#1302177 July 30 2014
Page 20
As no data on the proposed crusher system was available at the time of this assessment, the amount of
material handled the processing operations was determined by using the processing capacity of 200
Mg/hour based on another typical impact crusher previously evaluated by RWDI.
Please refer to Appendix L for additional details and sample calculations.
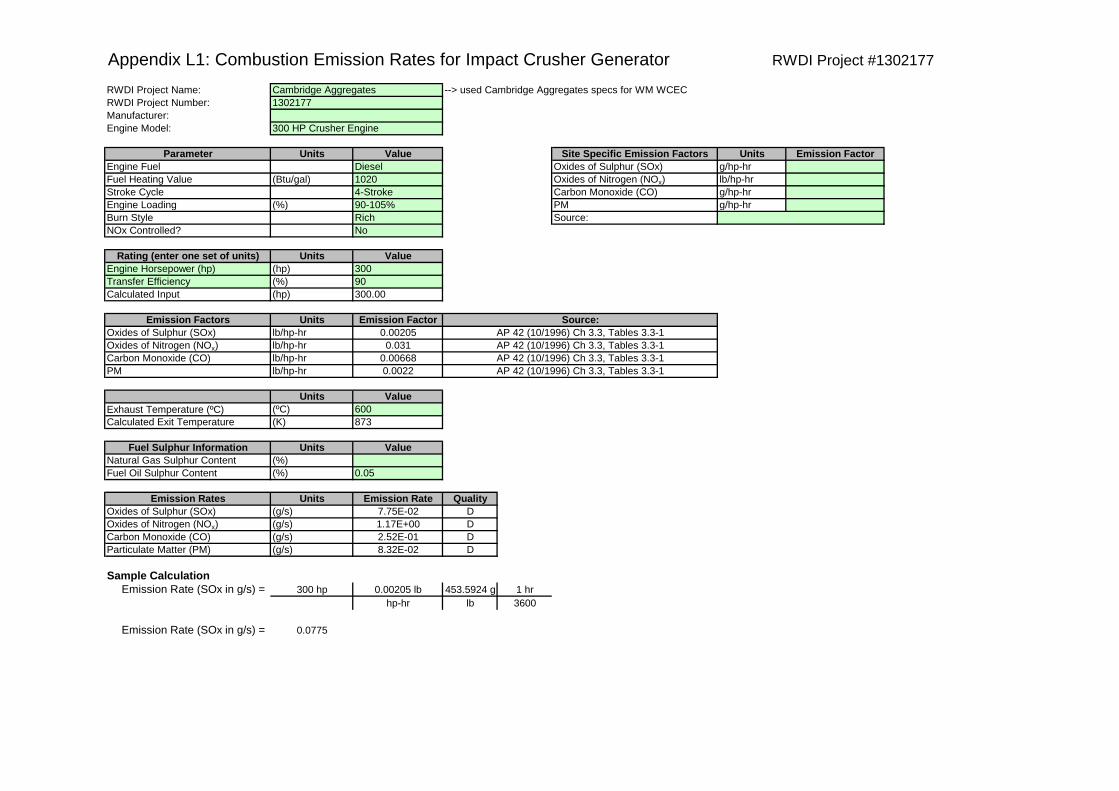
4.2.7.2 Combustion By-Products
One 300 horsepower diesel engine powers the impact crusher. Specifications for the specific unit to be
used at the WCEC were not available, since the equipment has not yet been selected. Emission rates for
the engine was based on emission factors from AP-42 Chapter 3.3, Gasoline and Diesel Industrial
Engines, with exhaust parameters assumed based on typical units.
Please refer to Appendix L for additional details and sample calculations.
4.3 Sample Calculation for each Method
Sample calculations are provided in the appendix associated with each source.
4.4 Assessment of Data Quality for Each Emission Rate
The assessment of data quality for each emission rate is provided in the Source Summary Table.
The emission rates for the landfill gas-fired engines were based on engineering calculations, AP-42
emission factors and validated source testing program; therefore, depending on the contaminant, they
were assigned an “above-average” or “marginal” data quality rating. The emission rates for the landfill
gas flares were based on LANDGEM calculations, source testing and AP-42 emission factors; therefore,
dependant on the contaminant, they were assigned an “above-average” or “average” data quality rating.
The emission rates for the landfill mounds were based on LANDGEM calculations and source testing;
therefore, they were assigned “above-average” data quality ratings. The fugitive emissions from the
contaminated soil stockpile were based on validated source testing program; therefore, they were
assigned “above-average” data quality ratings.
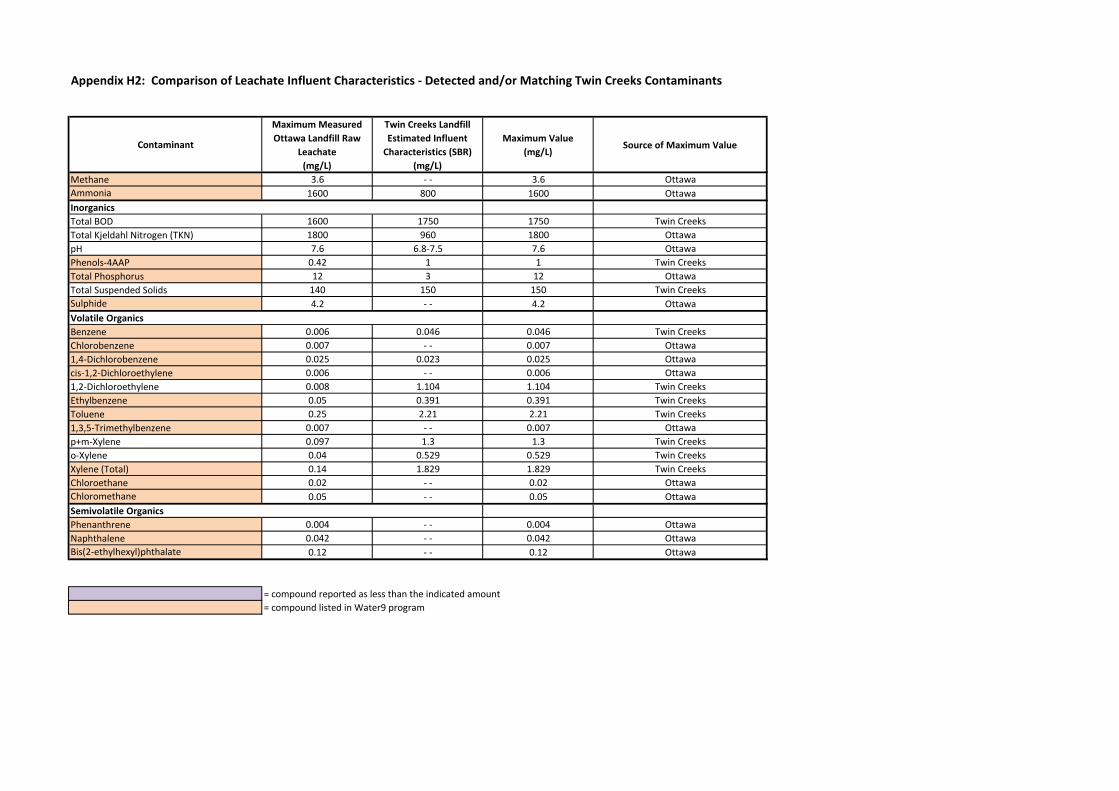
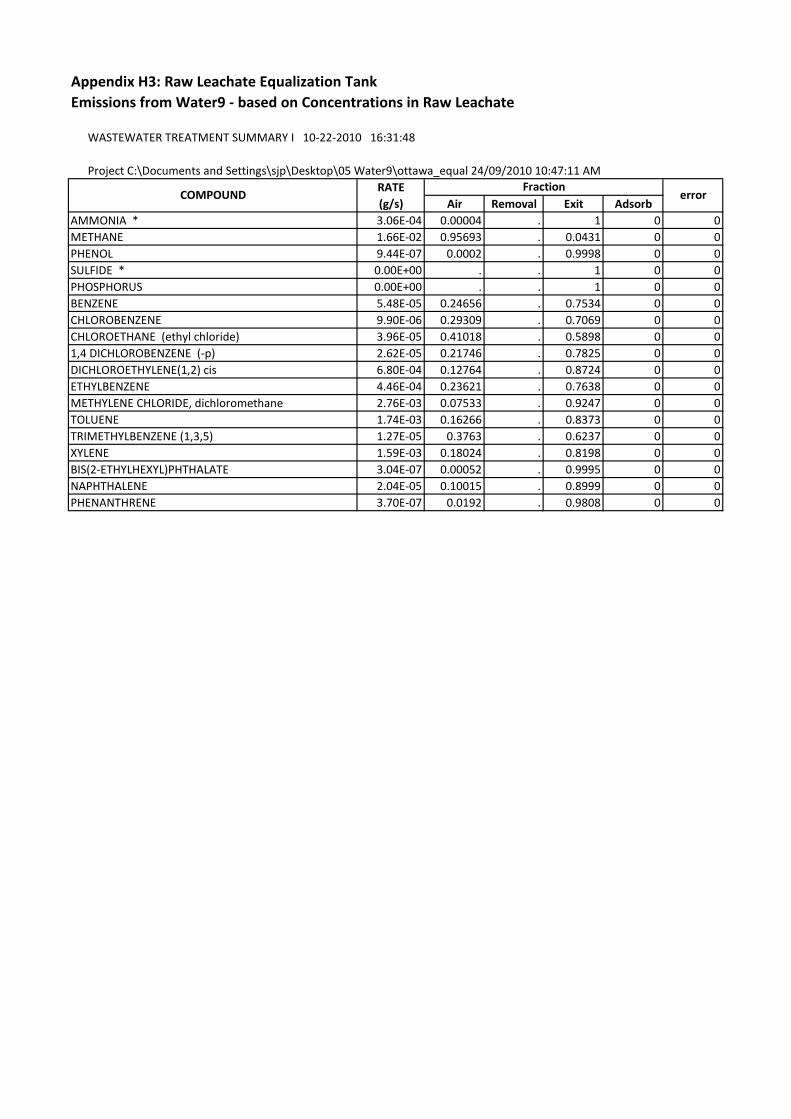
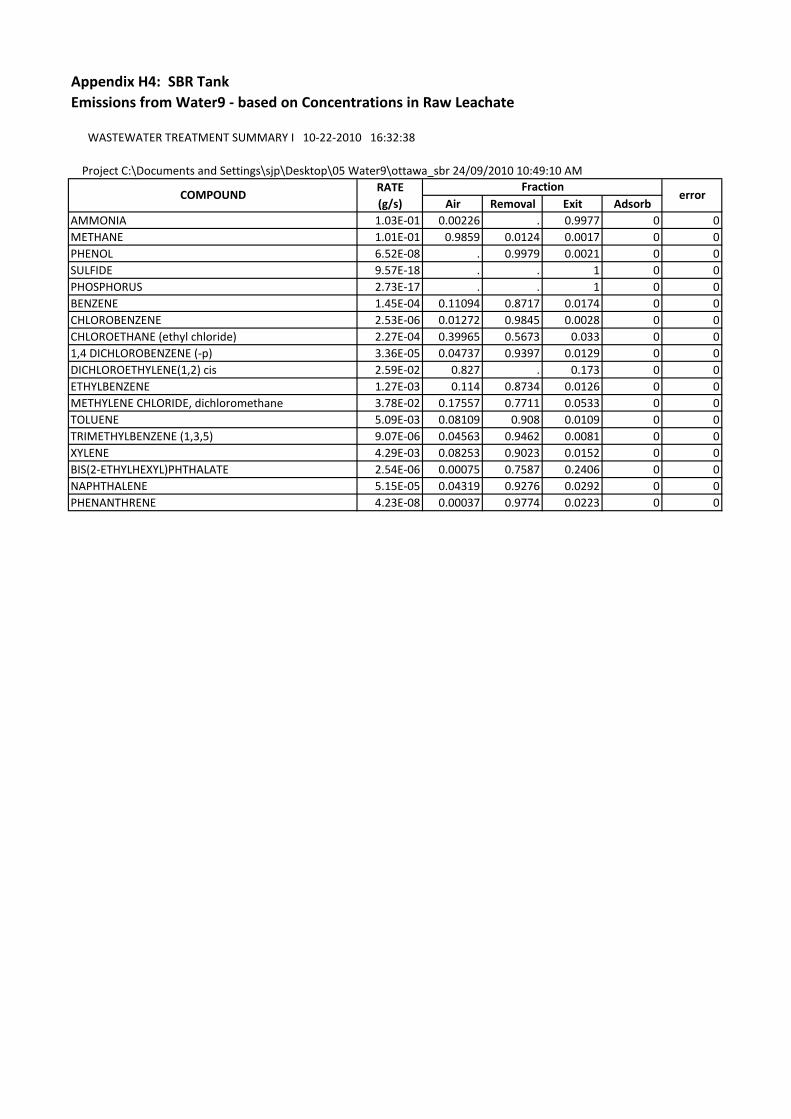
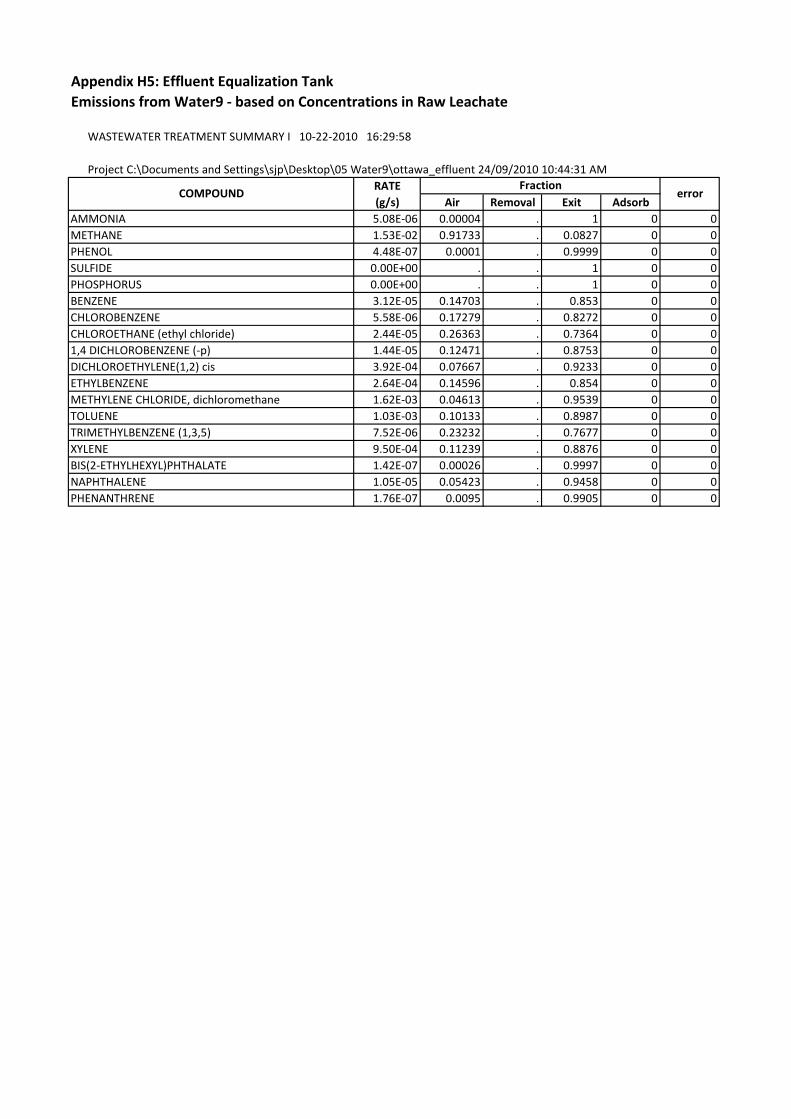
The leachate treatment emission rates estimated using WATER9 were assigned “average” data quality
ratings. The emission rates for the leachate treatment system emergency diesel generator are based on
AP-42 emission factors with “A” ratings; therefore, they were assigned “above-average” data quality
ratings.
The emission rates for the material loading activities are based on an AP-42 emission factor equation with
an “A” rating; therefore, they were assigned “above-average” data quality ratings. The emission rates for
the bulldozing activities are based on an AP-42 emission factor with a “C” rating; therefore, they were
assigned “average” data quality ratings. The emission rates for the crushing activities and diesel
generator are based on an AP-42 emission factor with an “E” rating; therefore, they were assigned
“marginal” data quality ratings.
Reputation Resources Results Canada | USA | UK | India | China | Hong Kong | Singapore www.rwdi.com
WCEC Landfill Emission Summary & dispersion Modelling Report Waste Management of Canada Corporation RWDI#1302177 July 30 2014
Page 21
5. SOURCE SUMMARY TABLE & PROPERTY PLAN
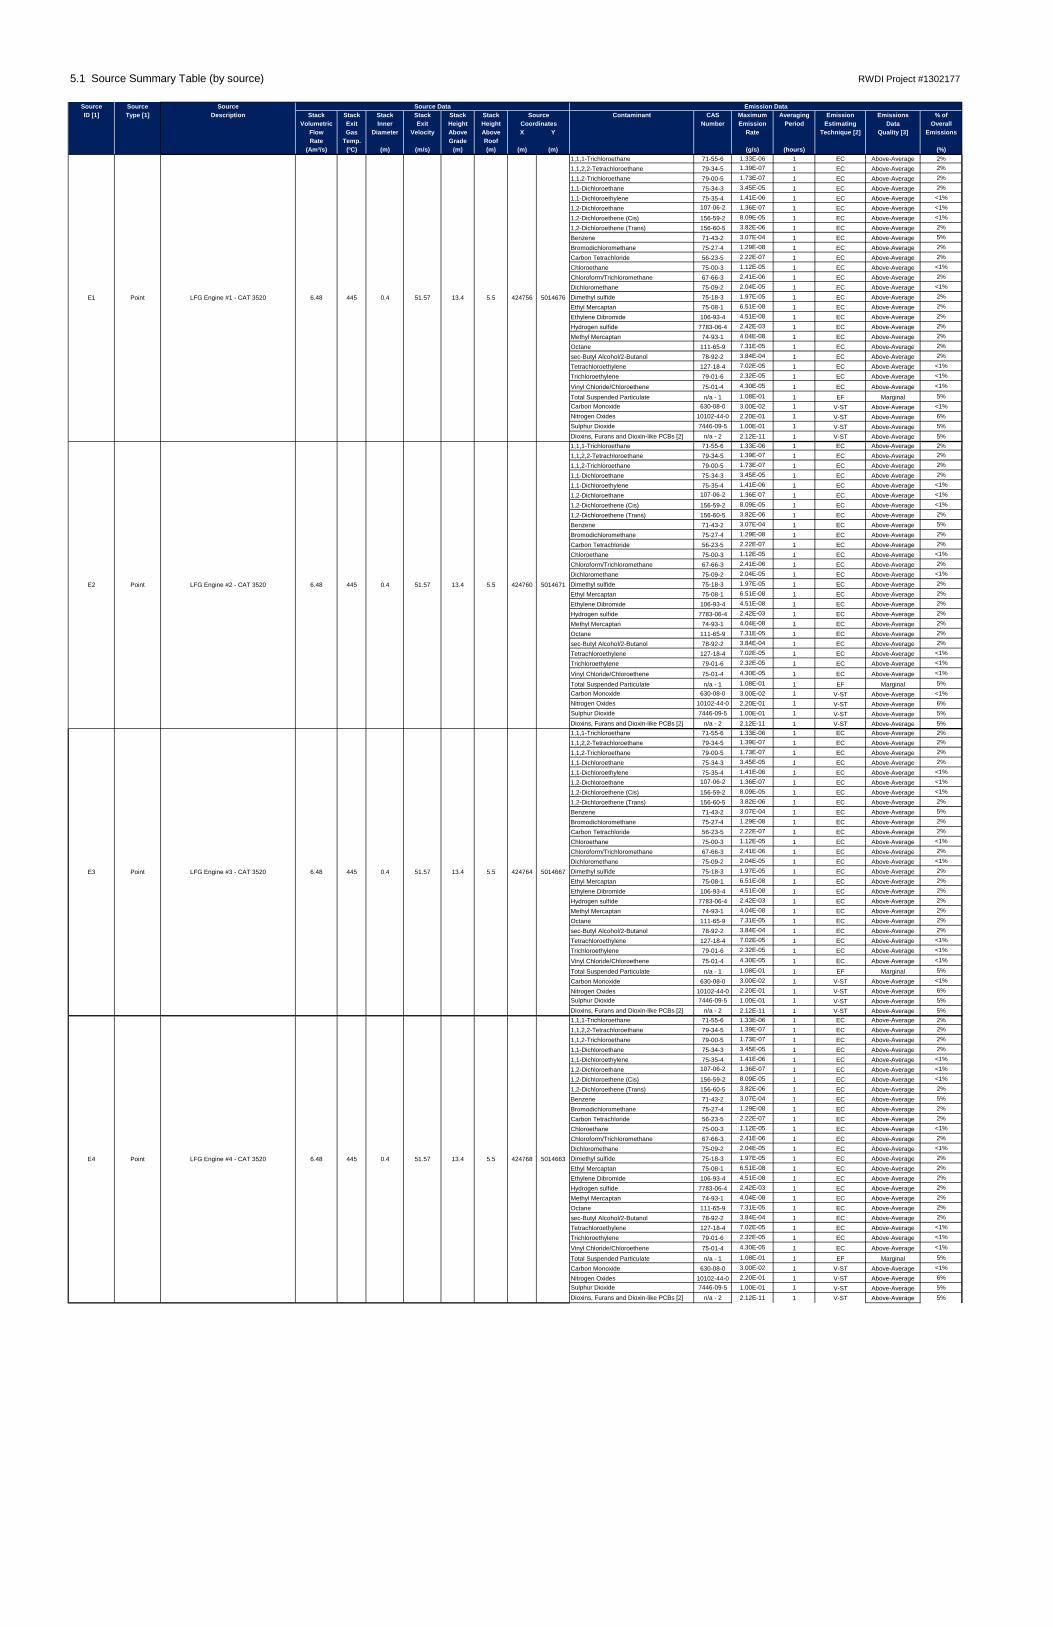
5.1 Source Summary Table
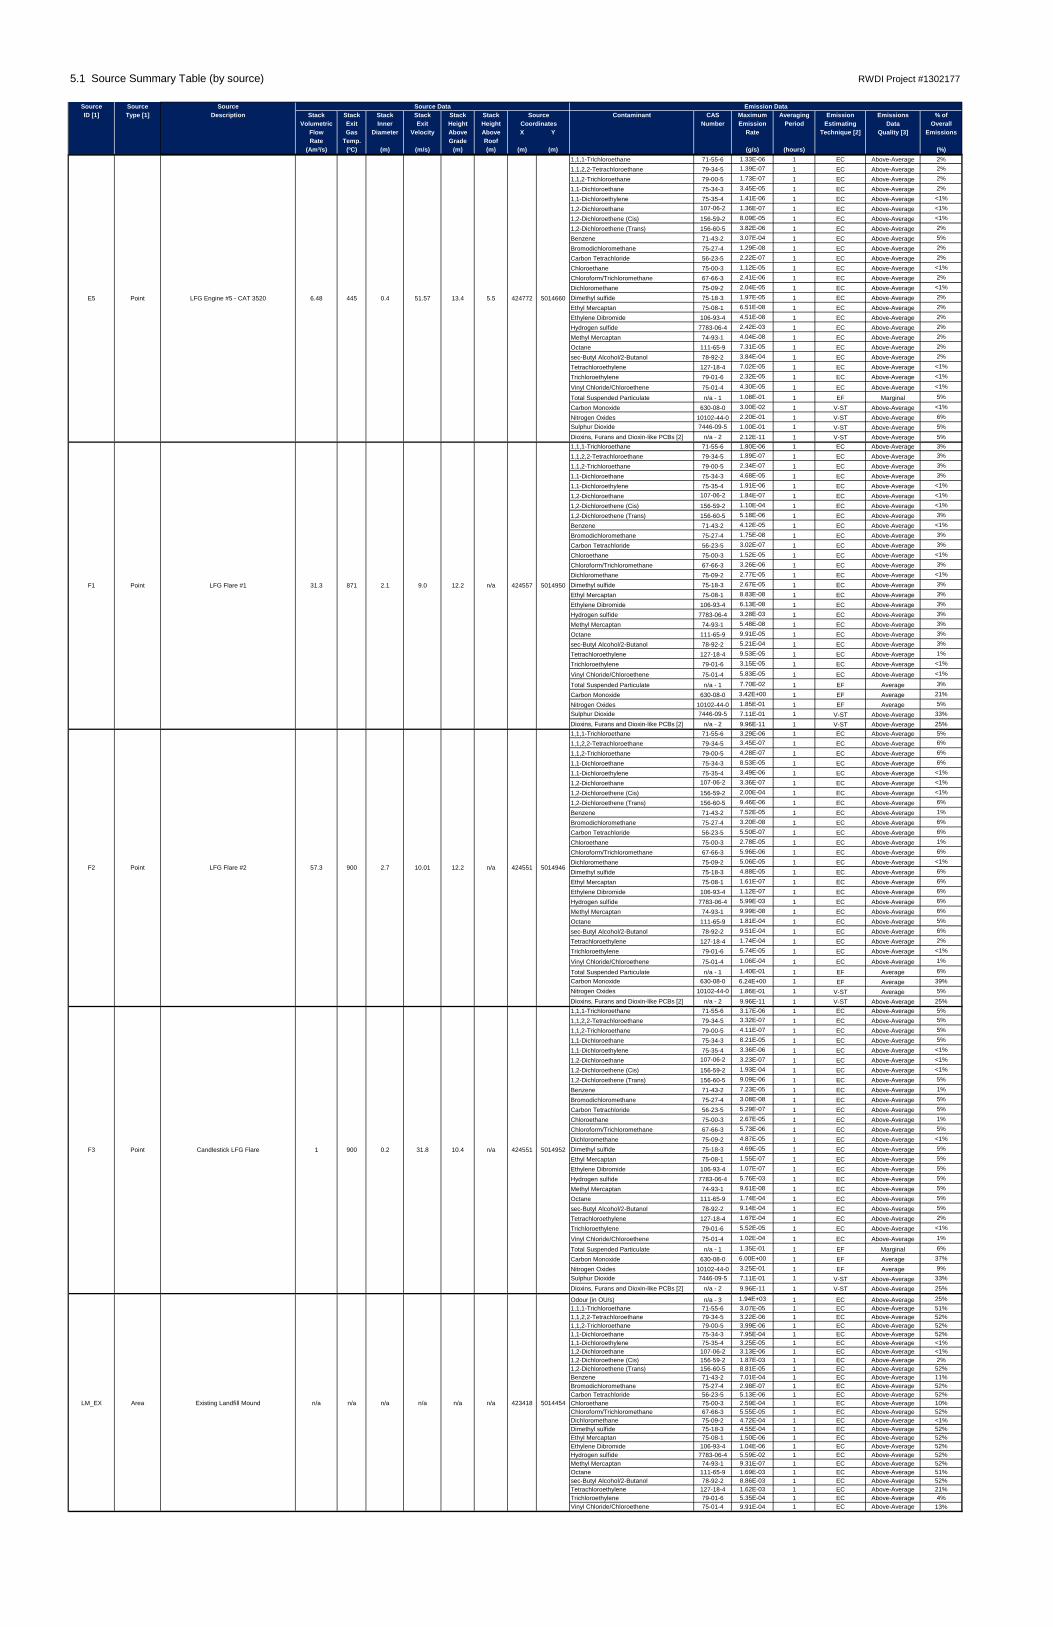
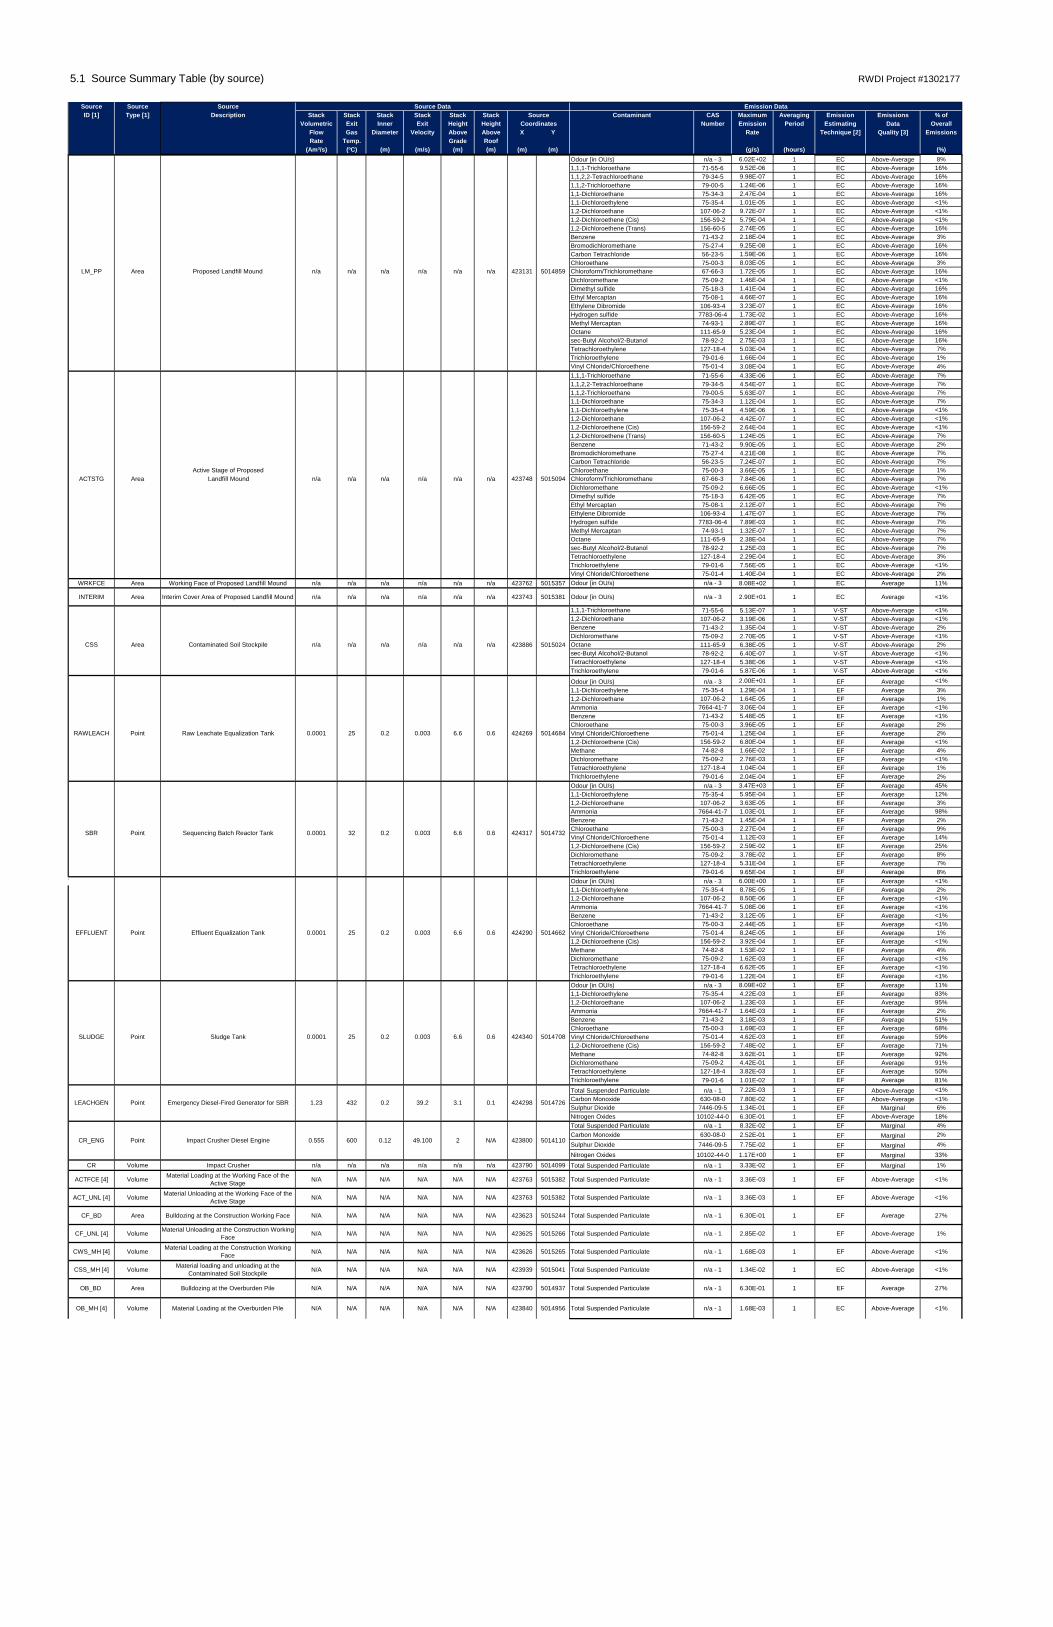
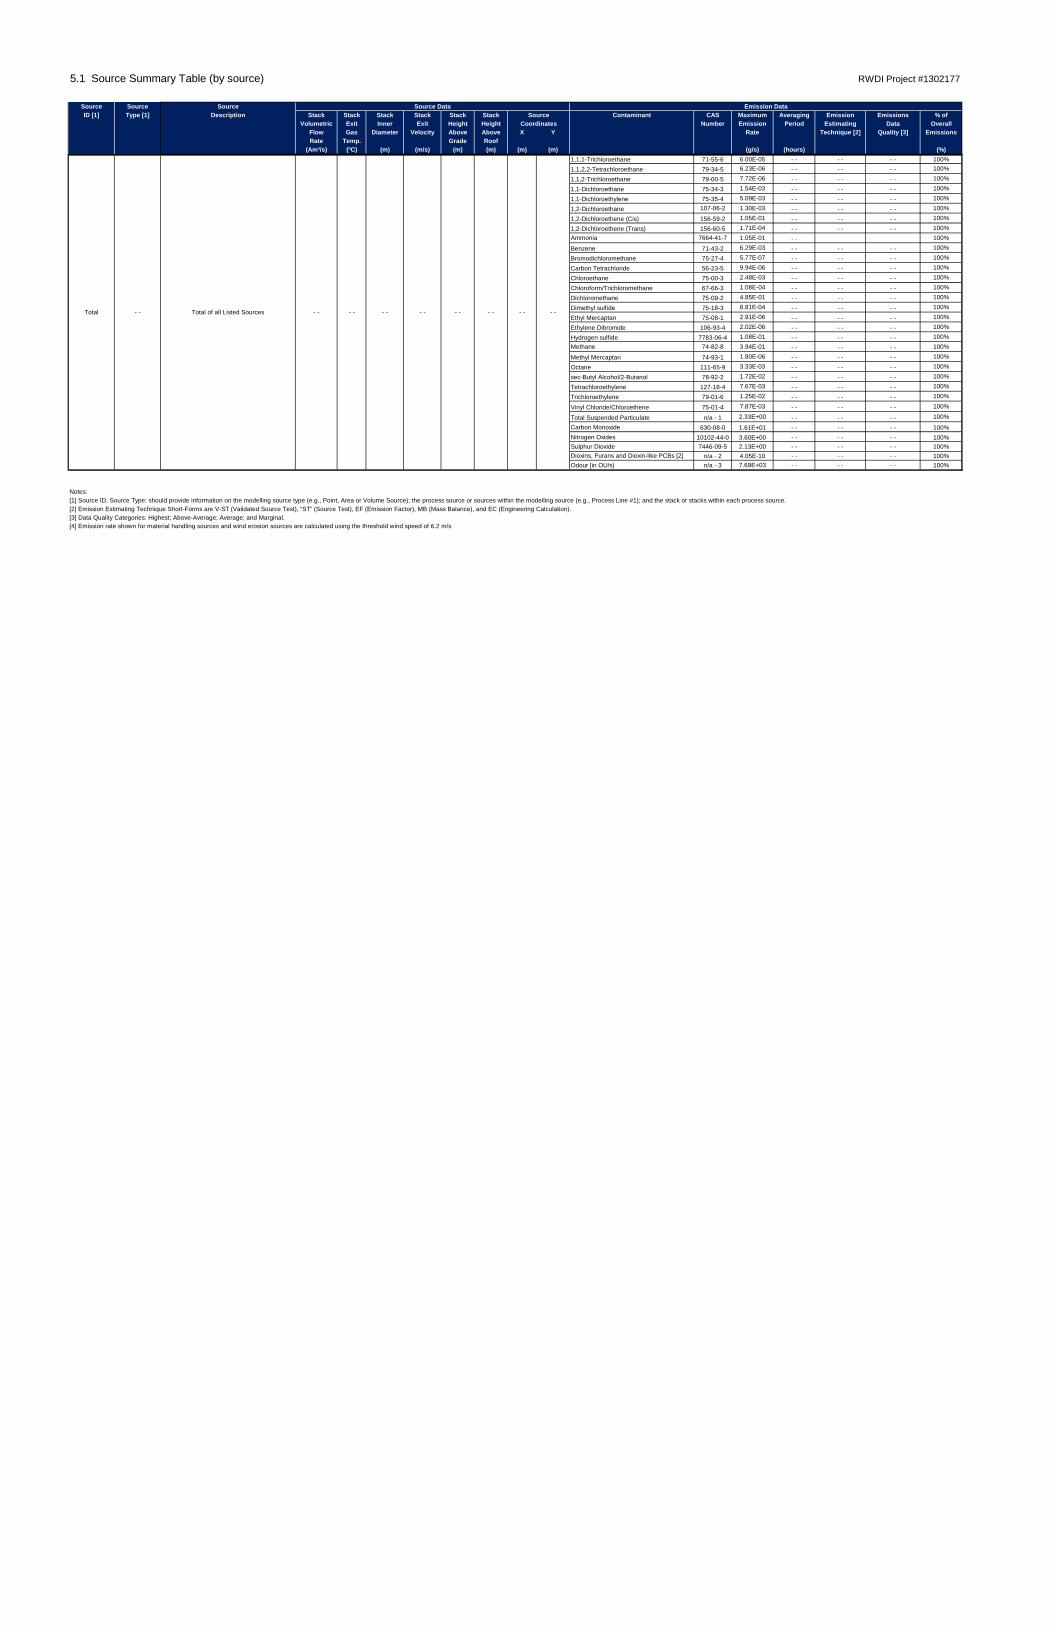
Table 5.1 in the Tables Section provides the Source Summary Table for the facility.
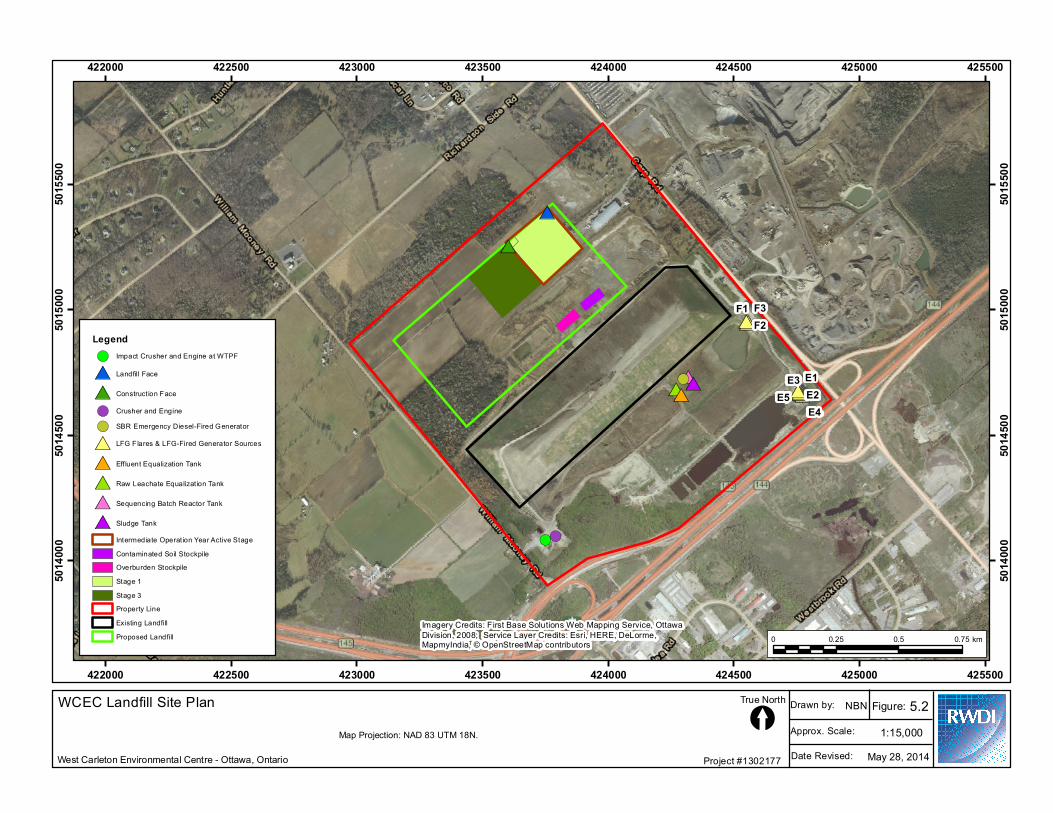
5.2 Site Plan (Scaleable)
Figure 5.2 in the Figures Section provides the site plan for the facility.
6. DISPERSION MODELLING
6.1 Dispersion Modelling Input Summary Table
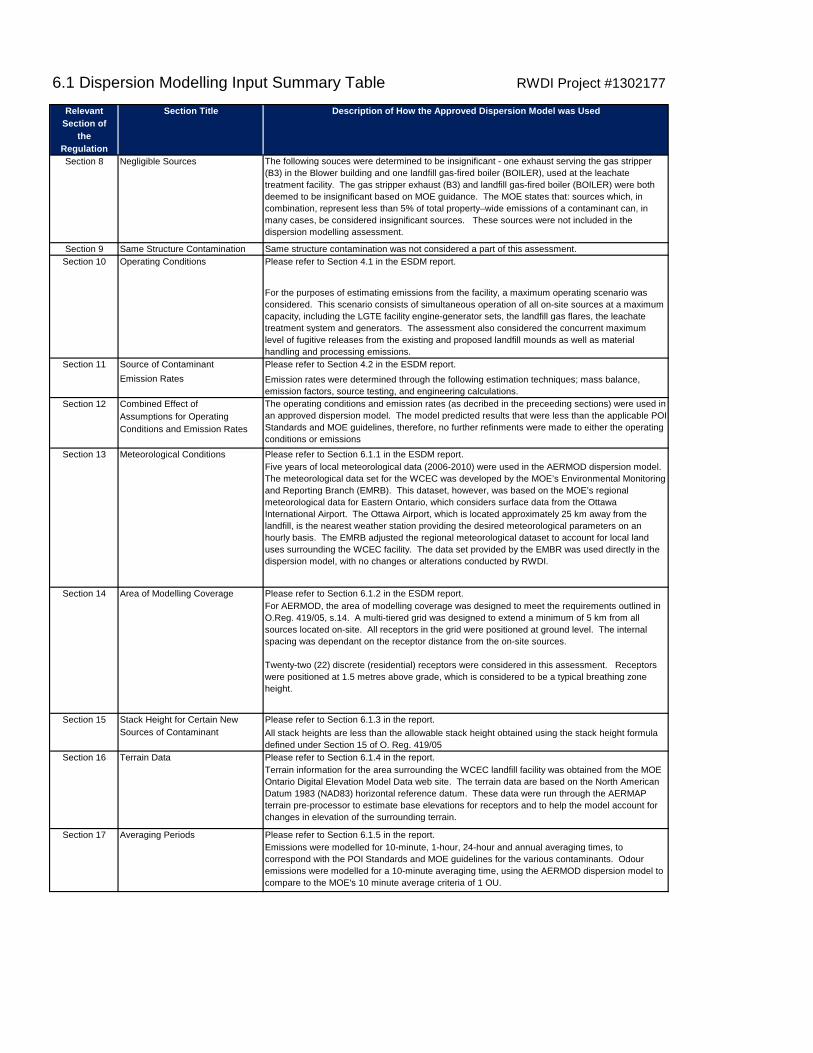
Table 6.1 in the Tables Section provides the Dispersion Modelling Input Summary Table for the facility.
Additional information on specific elements of the modelling analysis is provided in the following sections.
The U.S. EPA’s AERMOD dispersion model was used to predict maximum concentrations resulting from
emissions from the WCEC facility. AERMOD is a steady-state Gaussian model that is capable of
handling multiple emission sources. Within the model, receptor grids as well as discrete receptor
locations of interest can be considered.
Separate model runs were conducted for each of the thirty-three (33) significant contaminants emitted
from the WCEC landfill facility. All sources in the assessment were modelled either as a point, area or
volume sources.
6.1.1 Meteorological Conditions
Five years of local meteorological data (2006-2010) were used in the AERMOD dispersion model. The
meteorological data set for the WCEC was developed by the MOE’s Environmental Monitoring and
Reporting Branch (EMRB). This dataset, however, was based on the MOE’s regional meteorological data
for Eastern Ontario, which considers surface data from the Ottawa International Airport. The Ottawa
Airport, which is located approximately 25 km away from the landfill, is the nearest weather station
providing the desired meteorological parameters on an hourly basis. The EMRB adjusted the regional
meteorological dataset to account for local land uses surrounding the WCEC facility. The data set
provided by the EMBR was used directly in the dispersion model, with no changes or alterations
conducted by RWDI.
Consultation on the meteorological dataset was conducted with Jinliang (John) Liu from the EMRB. A
request for approval under Section 13(1) of O. Reg. 419/05 for the use of site-specific meteorological data
is included in the ECA application.
Reputation Resources Results Canada | USA | UK | India | China | Hong Kong | Singapore www.rwdi.com
WCEC Landfill Emission Summary & dispersion Modelling Report Waste Management of Canada Corporation RWDI#1302177 July 30 2014
Page 22
6.1.2 Area of Modelling Coverage
The area of modelling coverage was designed to meet the requirements outlined in Section 14 of
O. Reg. 419/05. A multi-tiered receptor grid was developed with reference to Section 7.2 of the Air
Dispersion Modelling Guideline for Ontario, Version 2.0, March 2009; therefore, interval spacing was
dependent on the receptor distance from on-site sources.
Typically when modelling odour (or any contaminant with a 10-minute averaging standard), impacts are
assessed only at odour sensitive receptor locations and not at the property line. In the MOE’s
“Methodology for Modelling Assessments of Contaminants with 10-minute Average Standards and
Guidelines under O. Reg. 419/05”, April 2008, odour sensitive receptors are defined as “any locations
where and when human activities regularly occur”. Receptors were positioned at 1.5 metres above grade,
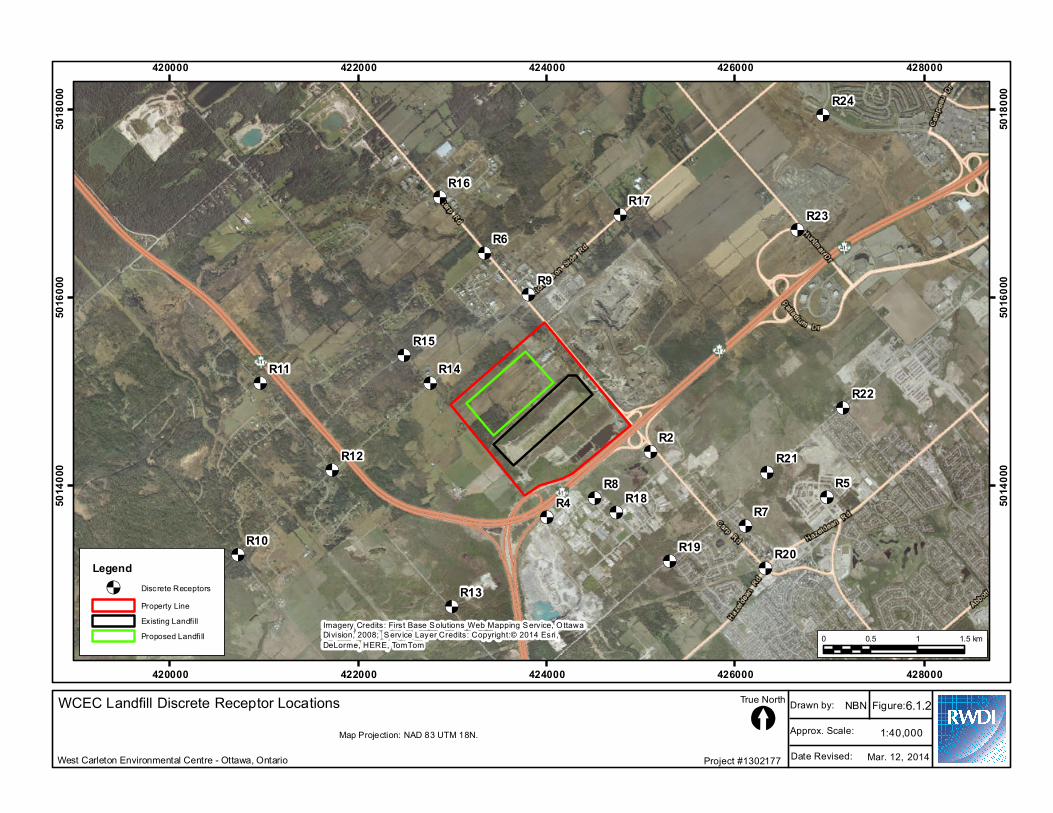
which is considered to be a typical breathing zone height. Twenty-two (22) discrete (residential)
receptors were considered in this assessment. The receptor locations are shown in Figure 6.1.2.
R1and R3, which were assessed in the Detailed Impact Assessment, are not assessed as part of this
ECA assessment, as WM has purchased the lands on which R1and R3 are located, no longer making
them sensitive receptors.
6.1.3 Stack Height for Certain New Sources of Contaminant
All stack heights are less than the allowable stack height obtained using the stack height formula defined
under Section 15 of O. Reg. 419/05. As such, building downwash effects have been considered in the
dispersion modelling by using the US-EPA’s Building Profile Input Program (BPIP) associated with the
AERMOD model.
The Building Profile Input Program (BPIP) was used to calculate the effects of building downwash on
point sources, such as stacks. The landfill-gas-to-energy building and the flare building were included in
the modelling, as these structures have the potential to affect emissions from the engines and flares. The
SBR system tanks were also included in the modelling as buildings, as the tanks have the potential to
affect emission from the tank vent sources. The BPIP model was run prior to running the AERMOD
model to incorporate the potential building downwash effects.
The potential building downwash effects were only evaluated for the point sources within the dispersion
model. Although the existing and proposed landfill mounds may be considered “structures”, dispersion
modelling tests were completed including these landfill mound “structures” and it was found that the
effects of mound downwash have insignificant impacts on the maximum off-site concentrations. The
effects of the mound downwash are insignificant as the sloping features of the mound do not act as a
solid block building.
Reputation Resources Results Canada | USA | UK | India | China | Hong Kong | Singapore www.rwdi.com
WCEC Landfill Emission Summary & dispersion Modelling Report Waste Management of Canada Corporation RWDI#1302177 July 30 2014
Page 23
6.1.4 Terrain Data
Terrain information for the area surrounding the WCEC landfill facility was obtained from the MOE Ontario
Digital Elevation Model Data web site. The terrain data are based on the North American Datum 1983
(NAD83) horizontal reference datum. These data were run through the AERMAP terrain pre-processor to
estimate base elevations for receptors and to help the model account for changes in elevation of the
surrounding terrain.
6.1.5 Averaging Periods Used
10-minute, ½-hour, 1-hour and 24-hour averaging times were used with the AERMOD model to compare
to Schedule 3 Standards and other guidelines listed in the Ministry document "Summary of
O. Reg. 419/05 Standards and Point Of Impingement Guidelines and Ambient Air Quality Criteria
(AAQC's)" dated April 2012. 10-minute average values were calculated from the 1-hour predicted
concentrations using a factor of 1.65, as given in Table 4.1 of the Ministry document “Guideline A11: Air
Dispersion Modelling Guideline for Ontario” dated March 2009. ½-hour average values were calculated
from the 1-hour predicted concentrations using a factor of 1.2, as given in Table 4.1 of Guideline A11.
6.2 Land Use Designation Plan
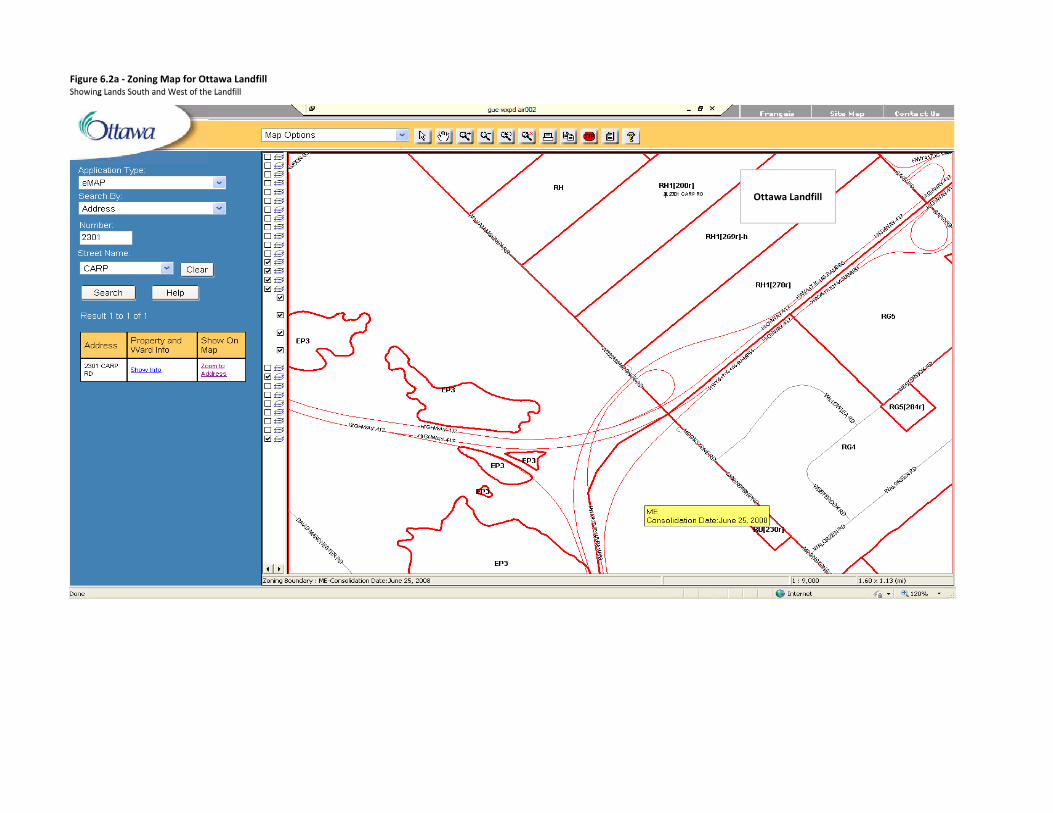
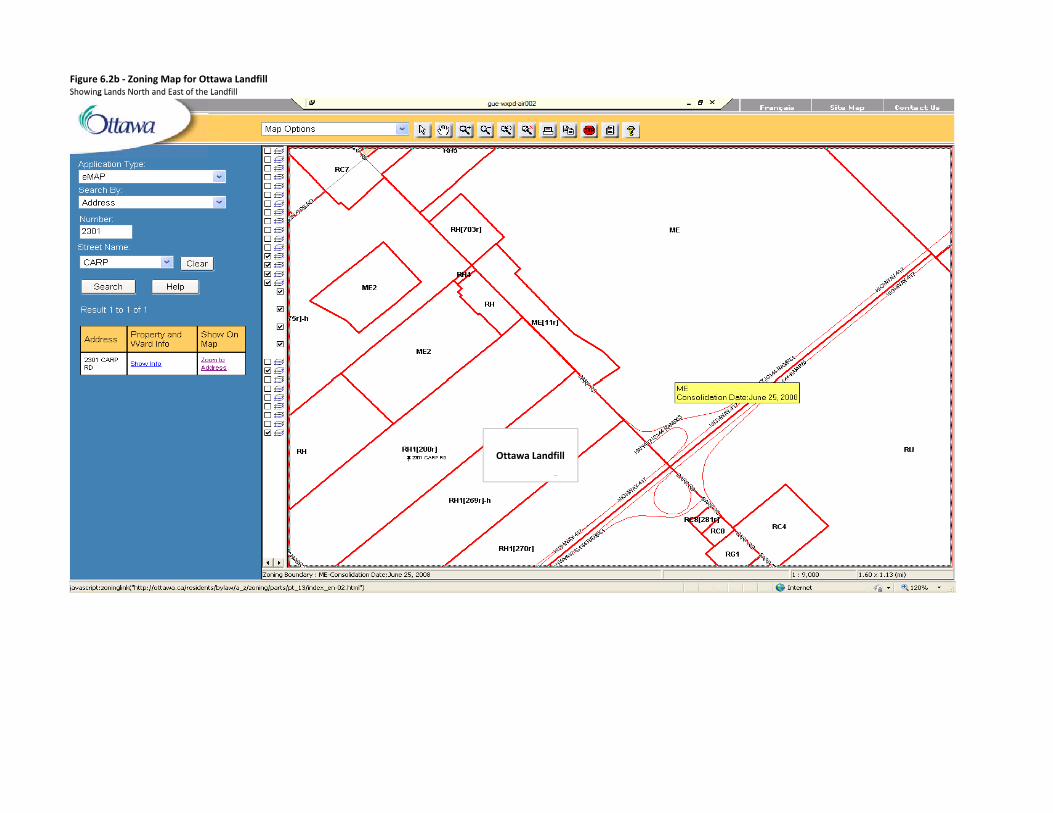
Figure 6.2 in the Figures Section provides the zoning documentation. The WCEC landfill facility is
located adjacent to Highway 417. It is bounded by Carp Road on the east and William Mooney Road on
the west. An active quarry is situated immediately east of the site across Carp Road. The land within 1
km of the landfill is largely industrial and agricultural. The landfill itself is zoned as “rural heavy industrial”
and is bordered by “mineral extraction” areas to the east and north, “rural general industrial” areas to the
north and south, “rural commercial” areas to the south, and “environmental protection” areas to the west.
6.3 Dispersion Modelling Input and Output Files
Modelling input and output files have been provided on a compact disc included in Appendix A
Reputation Resources Results Canada | USA | UK | India | China | Hong Kong | Singapore www.rwdi.com
WCEC Landfill Emission Summary & dispersion Modelling Report Waste Management of Canada Corporation RWDI#1302177 July 30 2014
Page 24
7. EMISSION SUMMARY TABLE & CONCLUSIONS
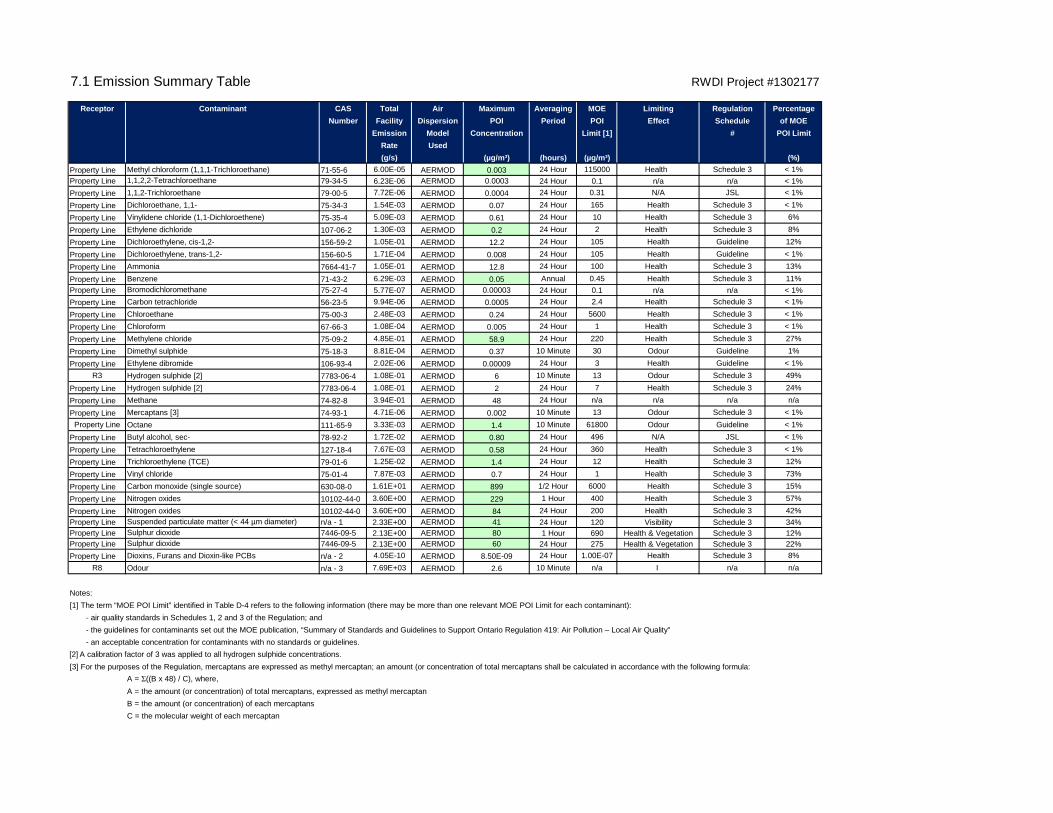
7.1 Emission Summary Table
Table 7.1 in the Tables Section provides the Emission Summary Table for the facility.
7.2 Contaminants without Standards or Guidelines under O. Reg. 419/05
The following contaminants do not have standards or guidelines under O. Reg. 419/05, but have
Jurisdictional Screening Levels (JSL):
1,1,2-Trichloroethane (CAS# 79-00-5); and
Butyl alcohol, sec- (CAS# 78-92-2).
The predicted concentrations of these contaminants are below their respective JSL, and therefore do not
require a maximum ground-level concentration acceptability request.
The following contaminants do not have Standards or guidelines under O. Reg. 419/05, nor do they have
relevant JSL values, and will also require a maximum ground-level concentration acceptability request:
1,1,2,2-Tetrachloroethane (CAS# 79-34-5);
Bromodichloromethane (CAS# 75-27-4); and
Methane (CAS# 74-82-8).
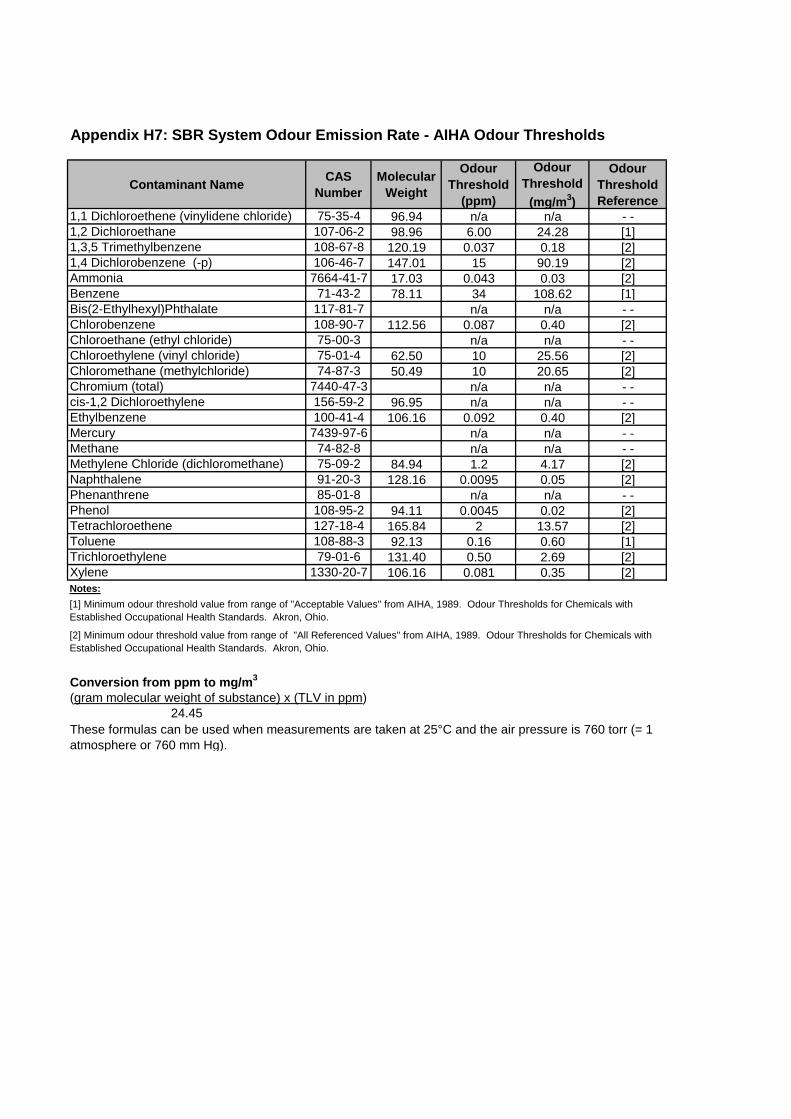
7.3 Odour Criteria
In March, 2005, the Ontario Ministry of the Environment published a position paper in which it proposed to
develop an odour policy framework. As part of this position paper, the Ministry recognized the need to
review odour-based limits. Historically, the odour threshold most commonly reported was the detection
threshold, which is defined as the level at which 50% of a group of normal observers say they detect the
odour. The Ministry recognized that complaint thresholds are typically 3 to 5 times the detection
threshold. Odour levels are expressed in terms of odour units (OU), where a value of 1 OU corresponds
to the 50% detection threshold. Expressed in these units, the complaint threshold for an odour is typically
3 to 5 OU.
Historically, the Ministry’s requirements with respect to odours have varied from one facility to another.
The Ministry had no requirement in cases where there was no history of odour complaints or no other
evidence of potential concerns. When there was evidence of a legitimate concern, the Ministry
sometimes required the facility to stay within 1 OU at sensitive impact locations at all times. In other
cases, a frequency of values above 1 OU was permitted if it was below 0.5% annually and, in other cases,
a higher odour threshold was adopted (e.g., 5 OU).
Reputation Resources Results Canada | USA | UK | India | China | Hong Kong | Singapore www.rwdi.com
WCEC Landfill Emission Summary & dispersion Modelling Report Waste Management of Canada Corporation RWDI#1302177 July 30 2014
Page 25
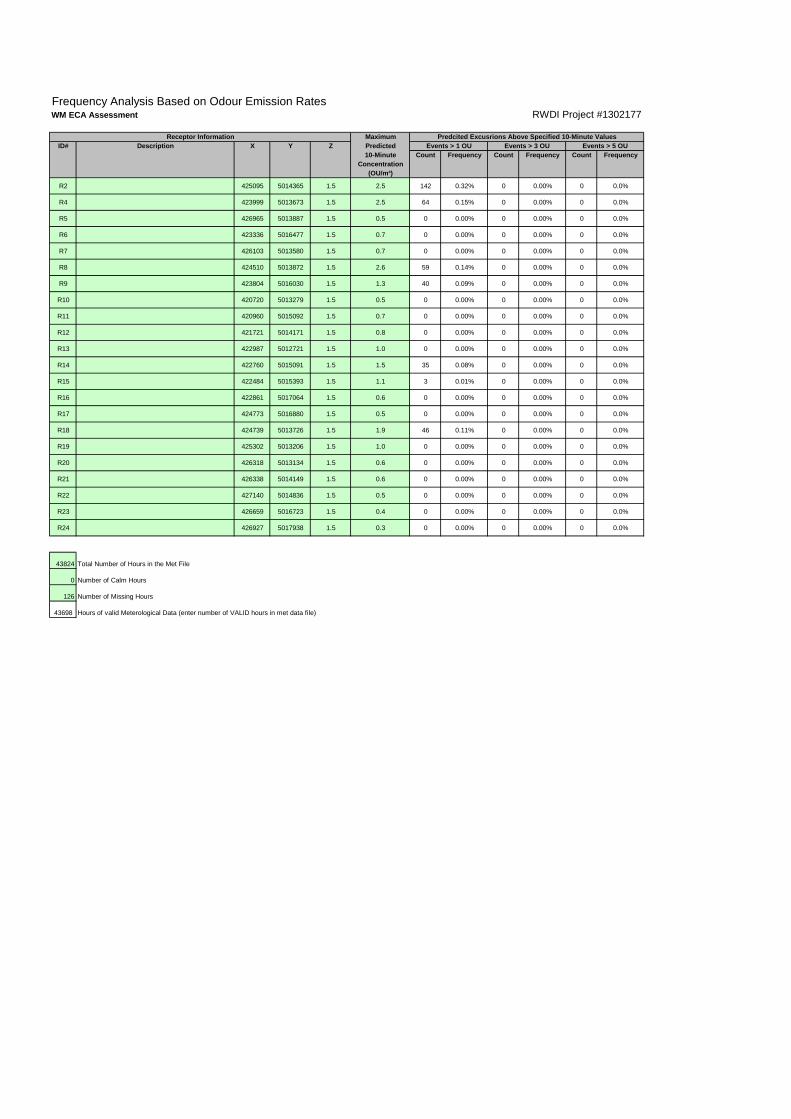
In the case of the WCEC odour emissions, concentrations exceed the 1 OU criterion at several of the
twenty-three discrete receptors locations evaluated. The frequency of exceedance was conducted. The
modeled frequency of exceedance is 0.33%, below the acceptable 0.5% annual frequency of exceedance.
Frequency analysis results are shown in Appendix M.
7.4 Landfill Gas Calibration Factor
The LANDGEM Model has been developed as a LFG generation model and is not a LFG emission model.
The approaches taken in this assessment also produce an estimate of LFG generation rather than LFG
emission. This is a very critical distinction when assessing air quality. The effect of LFG passing through
several feet of moistened soil, full of microbes and reactive minerals, greatly reduces the amount of many
LFG compounds. This is particularly true for reduced sulphur compounds such as hydrogen sulphide.
As referred to in the Amended LFG (VOC) Baseline Assessment Report, dated November 2011, a
Combined Assessment of Modelled and Monitored (CAMM) results indicated that it is reasonable that the
hydrogen sulphide emission rate be adjusted using a calibration factor. The emission factors for the
hydrogen sulphide sources (only LFG related sources) in this assessment were divided by a value of 3,
the reduction factor used to obtain an adjusted emission rate. The CAMM study has been reviewed and
accepted by the MOE, with the documentation included in Appendix N.
None of the other contaminant emission rates were adjusted through the use of a calibration factor.
7.5 Conclusions
Concentrations at points of impingement were predicted using the AERMOD. Modelling input and output
files have been provided on a compact disc included in Appendix A.
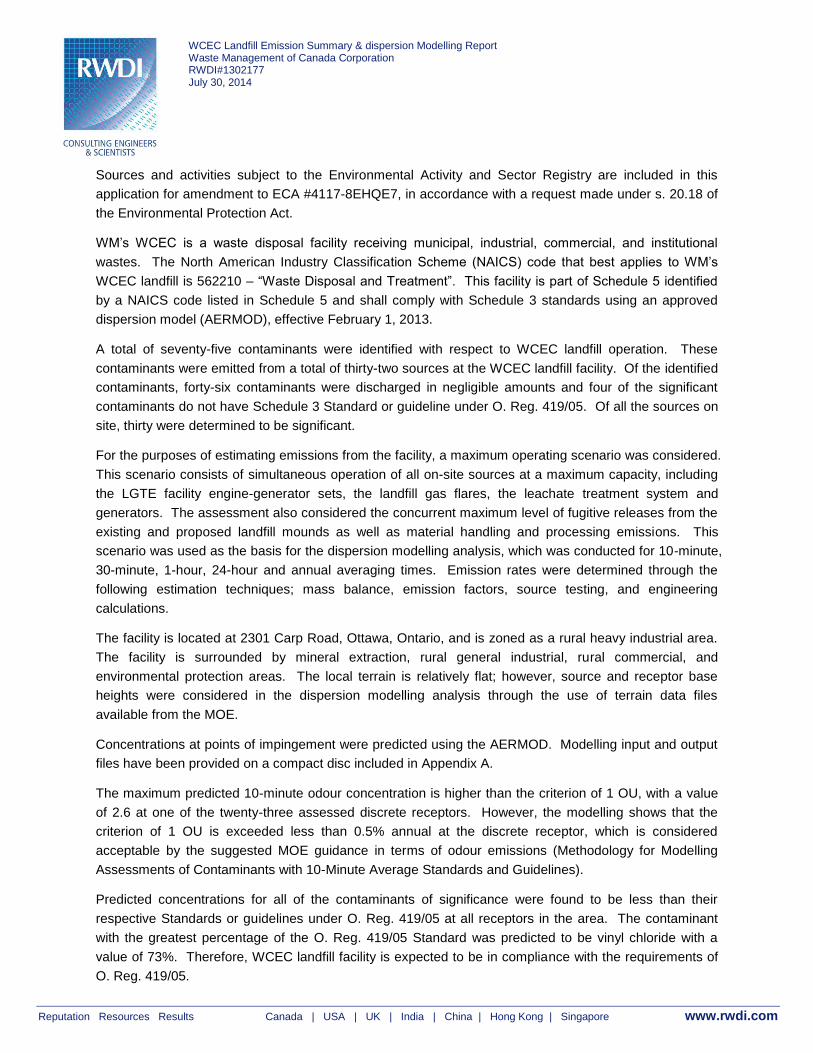
The maximum predicted 10-minute odour concentration is higher than the criterion of 1 OU, with a value
of 2.6 at one of the twenty-three assessed discrete receptors. However, the modelling shows that the
criterion of 1 OU is exceeded less than 0.5% annual at the discrete receptor, which is considered
acceptable by the suggested MOE guidance in terms of odour emissions (Methodology for Modelling
Assessments of Contaminants with 10-Minute Average Standards and Guidelines).
Predicted concentrations for all of the contaminants of significance were found to be less than their
respective Standards or guidelines under O. Reg. 419/05 at all receptors in the area. The contaminant
with the greatest percentage of the O. Reg. 419/05 Standard was predicted to be vinyl chloride with a
value of 73%. Therefore, WCEC landfill facility is expected to be in compliance with the requirements of
O. Reg. 419/05.
Employee Job Title
TABLES
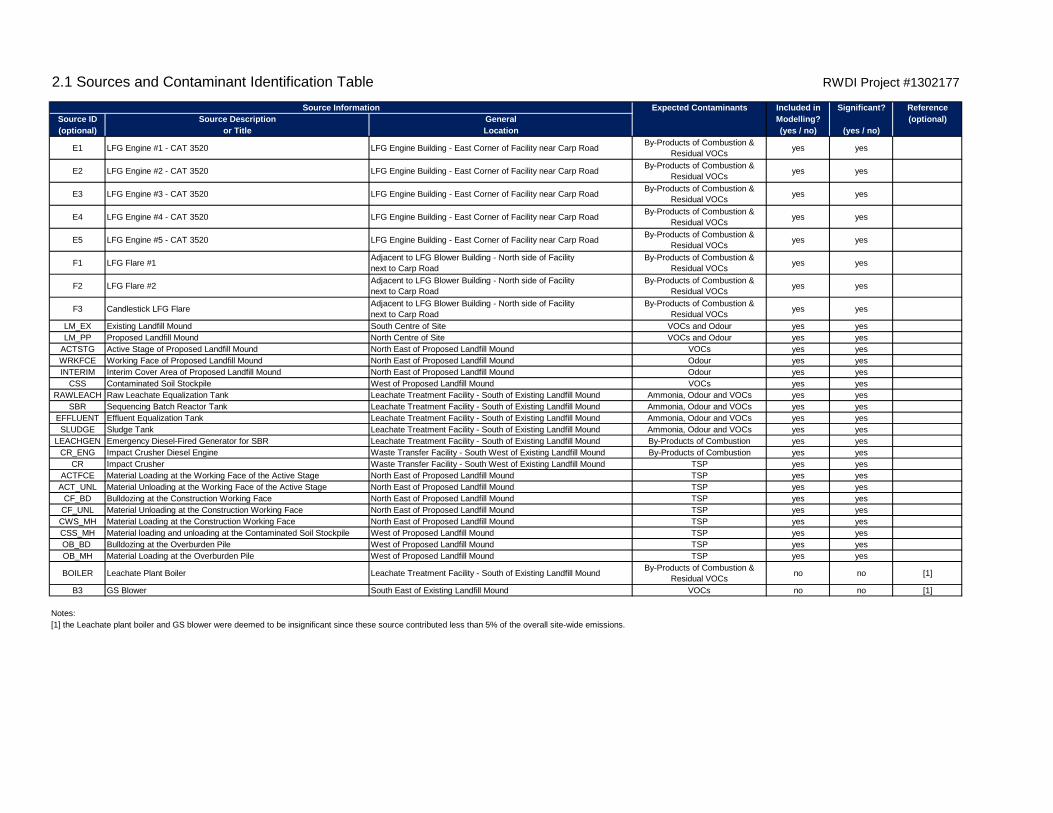
2.1 Sources and Contaminant Identification Table RWDI Project #1302177
Source Information Expected Contaminants Included in Significant? ReferenceSource ID Source Description General Modelling? (optional)(optional) or Title Location (yes / no) (yes / no)
E1 LFG Engine #1 - CAT 3520 LFG Engine Building - East Corner of Facility near Carp RoadBy-Products of Combustion &
Residual VOCsyes yes
E2 LFG Engine #2 - CAT 3520 LFG Engine Building - East Corner of Facility near Carp RoadBy-Products of Combustion &
Residual VOCsyes yes
E3 LFG Engine #3 - CAT 3520 LFG Engine Building - East Corner of Facility near Carp RoadBy-Products of Combustion &
Residual VOCsyes yes
E4 LFG Engine #4 - CAT 3520 LFG Engine Building - East Corner of Facility near Carp RoadBy-Products of Combustion &
Residual VOCsyes yes
E5 LFG Engine #5 - CAT 3520 LFG Engine Building - East Corner of Facility near Carp RoadBy-Products of Combustion &
Residual VOCsyes yes
F1 LFG Flare #1Adjacent to LFG Blower Building - North side of Facilitynext to Carp Road
By-Products of Combustion & Residual VOCs
yes yes
F2 LFG Flare #2Adjacent to LFG Blower Building - North side of Facilitynext to Carp Road
By-Products of Combustion & Residual VOCs
yes yes
F3 Candlestick LFG FlareAdjacent to LFG Blower Building - North side of Facilitynext to Carp Road
By-Products of Combustion & Residual VOCs
yes yes
LM_EX Existing Landfill Mound South Centre of Site VOCs and Odour yes yesLM_PP Proposed Landfill Mound North Centre of Site VOCs and Odour yes yes
ACTSTG Active Stage of Proposed Landfill Mound North East of Proposed Landfill Mound VOCs yes yesWRKFCE Working Face of Proposed Landfill Mound North East of Proposed Landfill Mound Odour yes yesINTERIM Interim Cover Area of Proposed Landfill Mound North East of Proposed Landfill Mound Odour yes yes
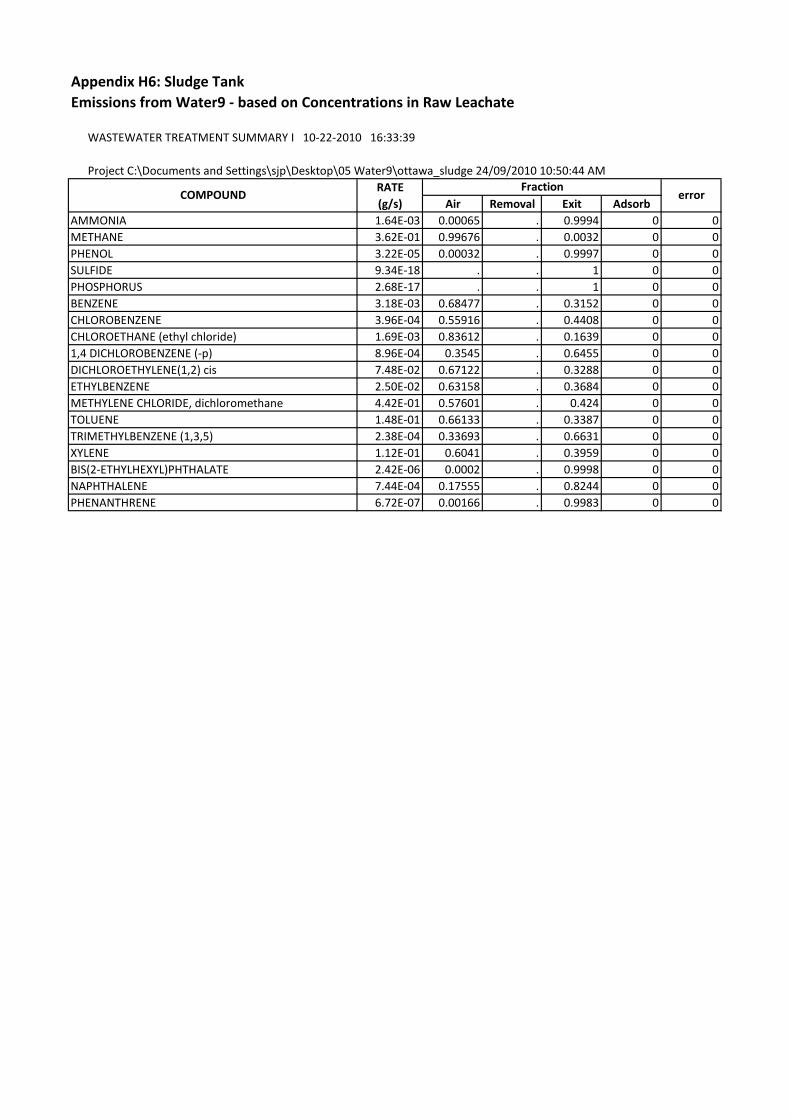
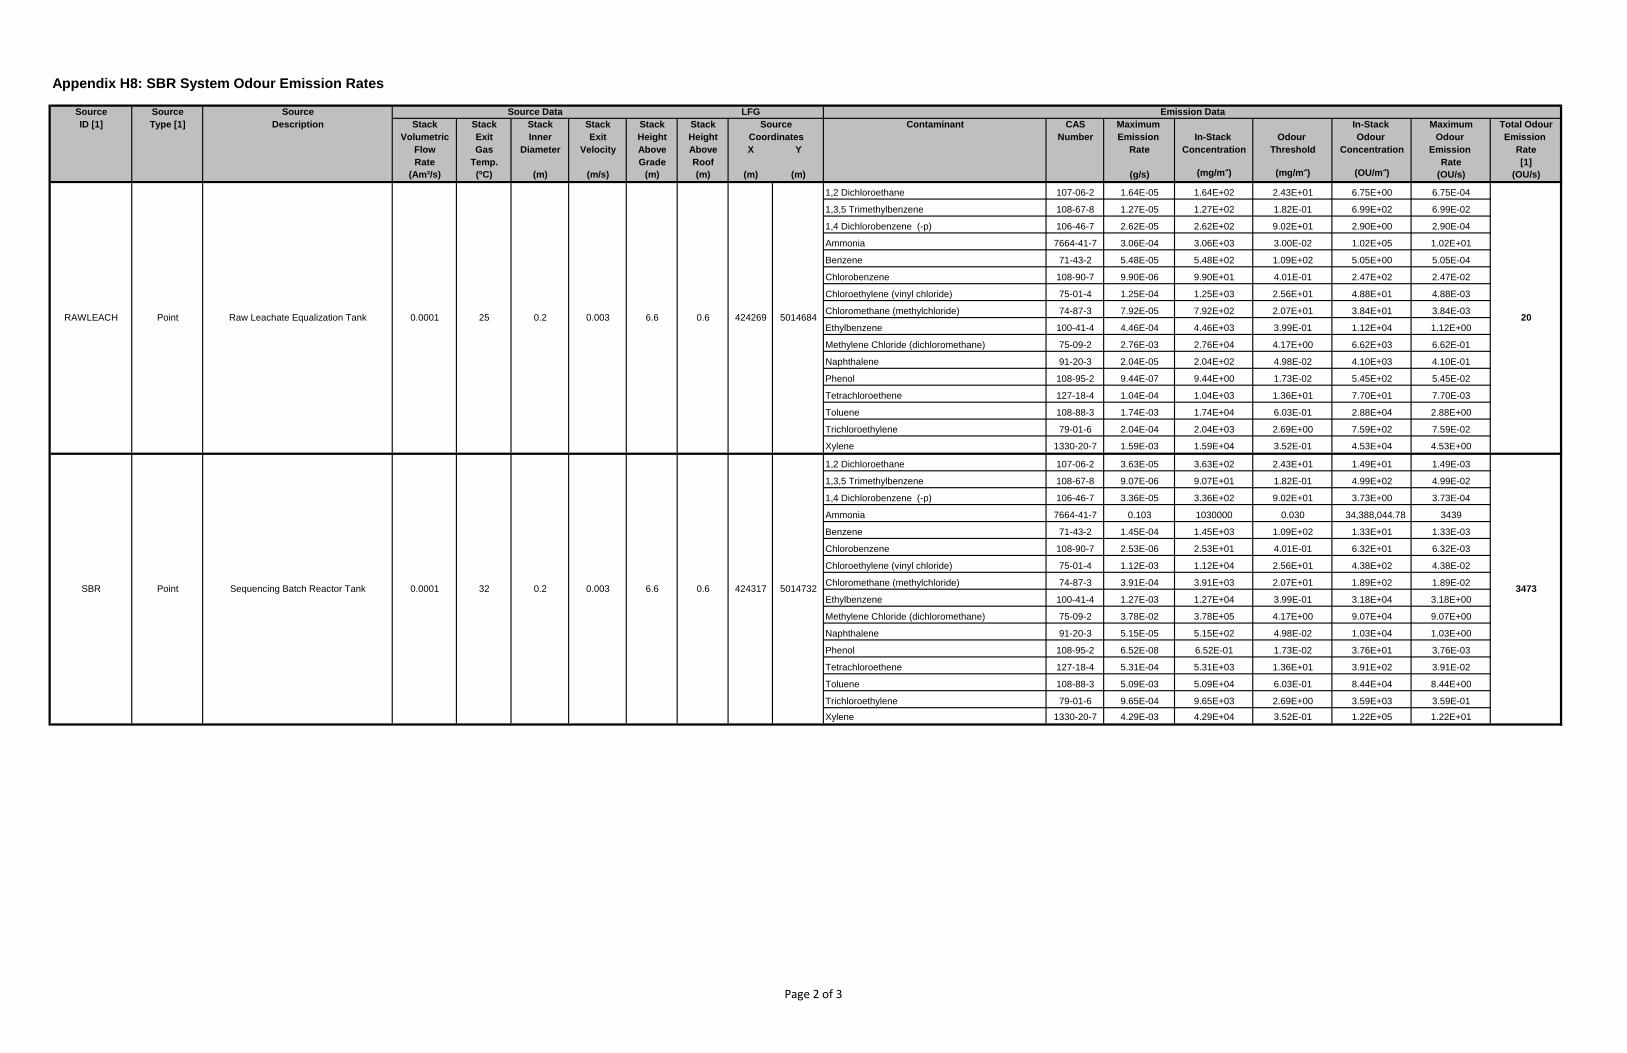
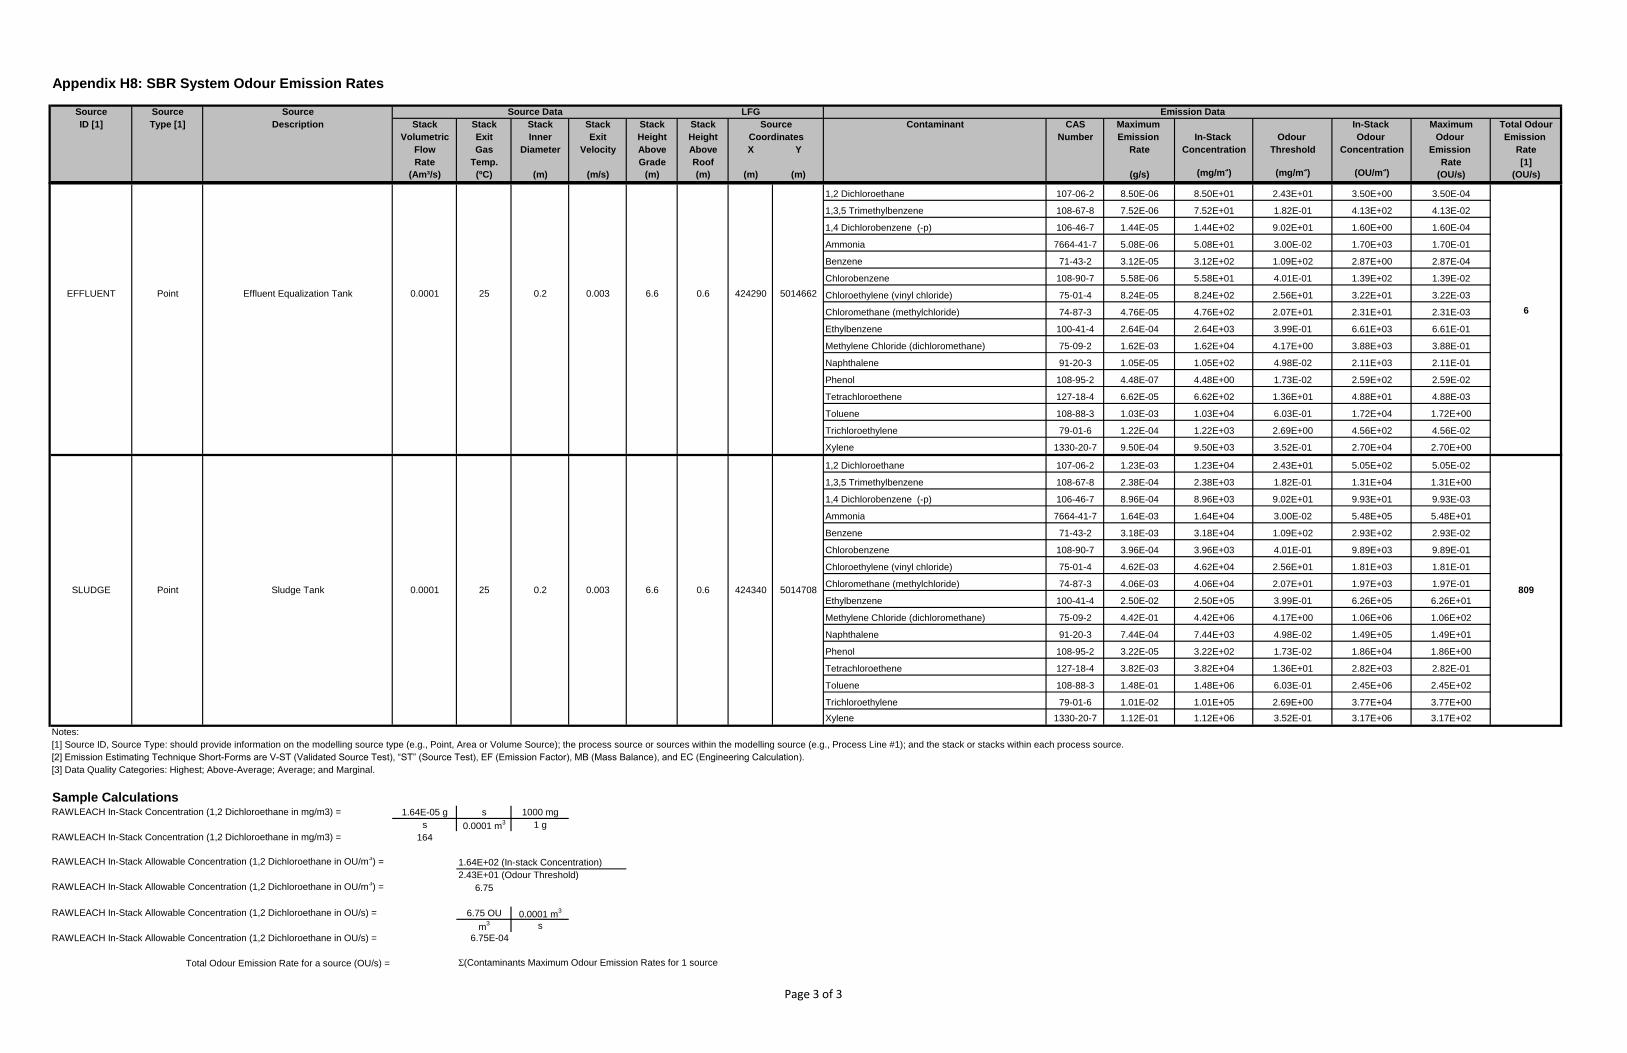
CSS Contaminated Soil Stockpile West of Proposed Landfill Mound VOCs yes yesRAWLEACH Raw Leachate Equalization Tank Leachate Treatment Facility - South of Existing Landfill Mound Ammonia, Odour and VOCs yes yes
SBR Sequencing Batch Reactor Tank Leachate Treatment Facility - South of Existing Landfill Mound Ammonia, Odour and VOCs yes yesEFFLUENT Effluent Equalization Tank Leachate Treatment Facility - South of Existing Landfill Mound Ammonia, Odour and VOCs yes yesSLUDGE Sludge Tank Leachate Treatment Facility - South of Existing Landfill Mound Ammonia, Odour and VOCs yes yes
LEACHGEN Emergency Diesel-Fired Generator for SBR Leachate Treatment Facility - South of Existing Landfill Mound By-Products of Combustion yes yesCR_ENG Impact Crusher Diesel Engine Waste Transfer Facility - South West of Existing Landfill Mound By-Products of Combustion yes yes
CR Impact Crusher Waste Transfer Facility - South West of Existing Landfill Mound TSP yes yesACTFCE Material Loading at the Working Face of the Active Stage North East of Proposed Landfill Mound TSP yes yes
ACT_UNL Material Unloading at the Working Face of the Active Stage North East of Proposed Landfill Mound TSP yes yesCF_BD Bulldozing at the Construction Working Face North East of Proposed Landfill Mound TSP yes yes
CF_UNL Material Unloading at the Construction Working Face North East of Proposed Landfill Mound TSP yes yesCWS_MH Material Loading at the Construction Working Face North East of Proposed Landfill Mound TSP yes yesCSS_MH Material loading and unloading at the Contaminated Soil Stockpile West of Proposed Landfill Mound TSP yes yesOB_BD Bulldozing at the Overburden Pile West of Proposed Landfill Mound TSP yes yesOB_MH Material Loading at the Overburden Pile West of Proposed Landfill Mound TSP yes yes
BOILER Leachate Plant Boiler Leachate Treatment Facility - South of Existing Landfill MoundBy-Products of Combustion &
Residual VOCsno no [1]
B3 GS Blower South East of Existing Landfill Mound VOCs no no [1]
Notes:[1] the Leachate plant boiler and GS blower were deemed to be insignificant since these source contributed less than 5% of the overall site-wide emissions.
Source Source Source Source Data Emission DataID [1] Type [1] Description Stack Stack Stack Stack Stack Stack Source Contaminant CAS Maximum Averaging Emission Emissions % of
Volumetric Exit Inner Exit Height Height Coordinates Number Emission Period Estimating Data OverallFlow Gas Diameter Velocity Above Above X Y Rate Technique [2] Quality [3] EmissionsRate Temp. Grade Roof
1,1-Dichloroethylene 75-35-4 1.29E-04 1 EF Average 3%1,2-Dichloroethane 107-06-2 1.64E-05 1 EF Average 1%Ammonia 7664-41-7 3.06E-04 1 EF Average <1%Benzene 71-43-2 5.48E-05 1 EF Average <1%Chloroethane 75-00-3 3.96E-05 1 EF Average 2%Vinyl Chloride/Chloroethene 75-01-4 1.25E-04 1 EF Average 2%1,2-Dichloroethene (Cis) 156-59-2 6.80E-04 1 EF Average <1%Methane 74-82-8 1.66E-02 1 EF Average 4%Dichloromethane 75-09-2 2.76E-03 1 EF Average <1%Tetrachloroethylene 127-18-4 1.04E-04 1 EF Average 1%Trichloroethylene 79-01-6 2.04E-04 1 EF Average 2%
Odour [in OU/s) n/a - 3 3.47E+03 1 EF Average 45%1,1-Dichloroethylene 75-35-4 5.95E-04 1 EF Average 12%1,2-Dichloroethane 107-06-2 3.63E-05 1 EF Average 3%Ammonia 7664-41-7 1.03E-01 1 EF Average 98%Benzene 71-43-2 1.45E-04 1 EF Average 2%Chloroethane 75-00-3 2.27E-04 1 EF Average 9%Vinyl Chloride/Chloroethene 75-01-4 1.12E-03 1 EF Average 14%1,2-Dichloroethene (Cis) 156-59-2 2.59E-02 1 EF Average 25%Dichloromethane 75-09-2 3.78E-02 1 EF Average 8%Tetrachloroethylene 127-18-4 5.31E-04 1 EF Average 7%Trichloroethylene 79-01-6 9.65E-04 1 EF Average 8%
EFFLUENT Odour [in OU/s) n/a - 3 6.00E+00 1 EF Average <1%1,1-Dichloroethylene 75-35-4 8.78E-05 1 EF Average 2%1,2-Dichloroethane 107-06-2 8.50E-06 1 EF Average <1%Ammonia 7664-41-7 5.08E-06 1 EF Average <1%Benzene 71-43-2 3.12E-05 1 EF Average <1%Chloroethane 75-00-3 2.44E-05 1 EF Average <1%Vinyl Chloride/Chloroethene 75-01-4 8.24E-05 1 EF Average 1%1,2-Dichloroethene (Cis) 156-59-2 3.92E-04 1 EF Average <1%Methane 74-82-8 1.53E-02 1 EF Average 4%Dichloromethane 75-09-2 1.62E-03 1 EF Average <1%Tetrachloroethylene 127-18-4 6.62E-05 1 EF Average <1%Trichloroethylene 79-01-6 1.22E-04 1 EF Average <1%
Odour [in OU/s) n/a - 3 8.09E+02 1 EF Average 11%1,1-Dichloroethylene 75-35-4 4.22E-03 1 EF Average 83%1,2-Dichloroethane 107-06-2 1.23E-03 1 EF Average 95%Ammonia 7664-41-7 1.64E-03 1 EF Average 2%Benzene 71-43-2 3.18E-03 1 EF Average 51%Chloroethane 75-00-3 1.69E-03 1 EF Average 68%Vinyl Chloride/Chloroethene 75-01-4 4.62E-03 1 EF Average 59%1,2-Dichloroethene (Cis) 156-59-2 7.48E-02 1 EF Average 71%Methane 74-82-8 3.62E-01 1 EF Average 92%Dichloromethane 75-09-2 4.42E-01 1 EF Average 91%Tetrachloroethylene 127-18-4 3.82E-03 1 EF Average 50%Trichloroethylene 79-01-6 1.01E-02 1 EF Average 81%
Total Suspended Particulate n/a - 1 7.22E-03 1 EF Above-Average <1%
Carbon Monoxide 630-08-0 7.80E-02 1 EF Above-Average <1%Sulphur Dioxide 7446-09-5 1.34E-01 1 EF Marginal 6%Nitrogen Oxides 10102-44-0 6.30E-01 1 EF Above-Average 18%
Total Suspended Particulate n/a - 1 8.32E-02 1 EF Marginal 4%
Carbon Monoxide 630-08-0 2.52E-01 1 EF Marginal 2%
Sulphur Dioxide 7446-09-5 7.75E-02 1 EF Marginal 4%
Nitrogen Oxides 10102-44-0 1.17E+00 1 EF Marginal 33%
ACTFCE [4] VolumeMaterial Loading at the Working Face of the
Active Stage N/A N/A N/A N/A N/A N/A 423763 5015382 Total Suspended Particulate n/a - 1 3.36E-03 1 EF Above-Average <1%
ACT_UNL [4] VolumeMaterial Unloading at the Working Face of the
Active Stage N/A N/A N/A N/A N/A N/A 423763 5015382 Total Suspended Particulate n/a - 1 3.36E-03 1 EF Above-Average <1%
CF_BD Area Bulldozing at the Construction Working Face N/A N/A N/A N/A N/A N/A 423623 5015244 Total Suspended Particulate n/a - 1 6.30E-01 1 EF Average 27%
CF_UNL [4] VolumeMaterial Unloading at the Construction Working
FaceN/A N/A N/A N/A N/A N/A 423625 5015266 Total Suspended Particulate n/a - 1 2.85E-02 1 EF Above-Average 1%
CWS_MH [4] VolumeMaterial Loading at the Construction Working
FaceN/A N/A N/A N/A N/A N/A 423626 5015265 Total Suspended Particulate n/a - 1 1.68E-03 1 EF Above-Average <1%
CSS_MH [4] VolumeMaterial loading and unloading at the
Source Source Source Source Data Emission DataID [1] Type [1] Description Stack Stack Stack Stack Stack Stack Source Contaminant CAS Maximum Averaging Emission Emissions % of
Volumetric Exit Inner Exit Height Height Coordinates Number Emission Period Estimating Data OverallFlow Gas Diameter Velocity Above Above X Y Rate Technique [2] Quality [3] EmissionsRate Temp. Grade Roof
Notes:[1] Source ID, Source Type: should provide information on the modelling source type (e.g., Point, Area or Volume Source); the process source or sources within the modelling source (e.g., Process Line #1); and the stack or stacks within each process source.[2] Emission Estimating Technique Short-Forms are V-ST (Validated Source Test), “ST” (Source Test), EF (Emission Factor), MB (Mass Balance), and EC (Engineering Calculation).[3] Data Quality Categories: Highest; Above-Average; Average; and Marginal.[4] Emission rate shown for material handling sources and wind erosion sources are calculated using the threshold wind speed of 6.2 m/s
- - - - - - - - - -Total - - Total of all Listed Sources - - - - - -
Relevant Section Title Description of How the Approved Dispersion Model was UsedSection of
theRegulationSection 8 Negligible Sources
Section 9 Same Structure Contamination Same structure contamination was not considered a part of this assessment. Section 10 Operating Conditions Please refer to Section 4.1 in the ESDM report.
Section 11 Source of Contaminant Please refer to Section 4.2 in the ESDM report.
Emission Rates
Section 12 Combined Effect ofAssumptions for OperatingConditions and Emission Rates
Section 13 Meteorological Conditions Please refer to Section 6.1.1 in the ESDM report.
Section 14 Area of Modelling Coverage Please refer to Section 6.1.2 in the ESDM report.
Section 15 Stack Height for Certain New Please refer to Section 6.1.3 in the report.Sources of Contaminant
Section 16 Terrain Data Please refer to Section 6.1.4 in the report.
Section 17 Averaging Periods Please refer to Section 6.1.5 in the report.Emissions were modelled for 10-minute, 1-hour, 24-hour and annual averaging times, to correspond with the POI Standards and MOE guidelines for the various contaminants. Odour emissions were modelled for a 10-minute averaging time, using the AERMOD dispersion model to compare to the MOE's 10 minute average criteria of 1 OU.
The following souces were determined to be insignificant - one exhaust serving the gas stripper (B3) in the Blower building and one landfill gas-fired boiler (BOILER), used at the leachate treatment facility. The gas stripper exhaust (B3) and landfill gas-fired boiler (BOILER) were both deemed to be insignificant based on MOE guidance. The MOE states that: sources which, in combination, represent less than 5% of total property–wide emissions of a contaminant can, in many cases, be considered insignificant sources. These sources were not included in the dispersion modelling assessment.
The operating conditions and emission rates (as decribed in the preceeding sections) were used in an approved dispersion model. The model predicted results that were less than the applicable POI Standards and MOE guidelines, therefore, no further refinments were made to either the operating conditions or emissions
Five years of local meteorological data (2006-2010) were used in the AERMOD dispersion model. The meteorological data set for the WCEC was developed by the MOE’s Environmental Monitoring and Reporting Branch (EMRB). This dataset, however, was based on the MOE’s regional meteorological data for Eastern Ontario, which considers surface data from the Ottawa International Airport. The Ottawa Airport, which is located approximately 25 km away from the landfill, is the nearest weather station providing the desired meteorological parameters on an hourly basis. The EMRB adjusted the regional meteorological dataset to account for local land uses surrounding the WCEC facility. The data set provided by the EMBR was used directly in the dispersion model, with no changes or alterations conducted by RWDI.
For AERMOD, the area of modelling coverage was designed to meet the requirements outlined in O.Reg. 419/05, s.14. A multi-tiered grid was designed to extend a minimum of 5 km from all sources located on-site. All receptors in the grid were positioned at ground level. The internal spacing was dependant on the receptor distance from the on-site sources.
Twenty-two (22) discrete (residential) receptors were considered in this assessment. Receptors were positioned at 1.5 metres above grade, which is considered to be a typical breathing zone height.
All stack heights are less than the allowable stack height obtained using the stack height formula defined under Section 15 of O. Reg. 419/05
Terrain information for the area surrounding the WCEC landfill facility was obtained from the MOE Ontario Digital Elevation Model Data web site. The terrain data are based on the North American Datum 1983 (NAD83) horizontal reference datum. These data were run through the AERMAP terrain pre-processor to estimate base elevations for receptors and to help the model account for changes in elevation of the surrounding terrain.
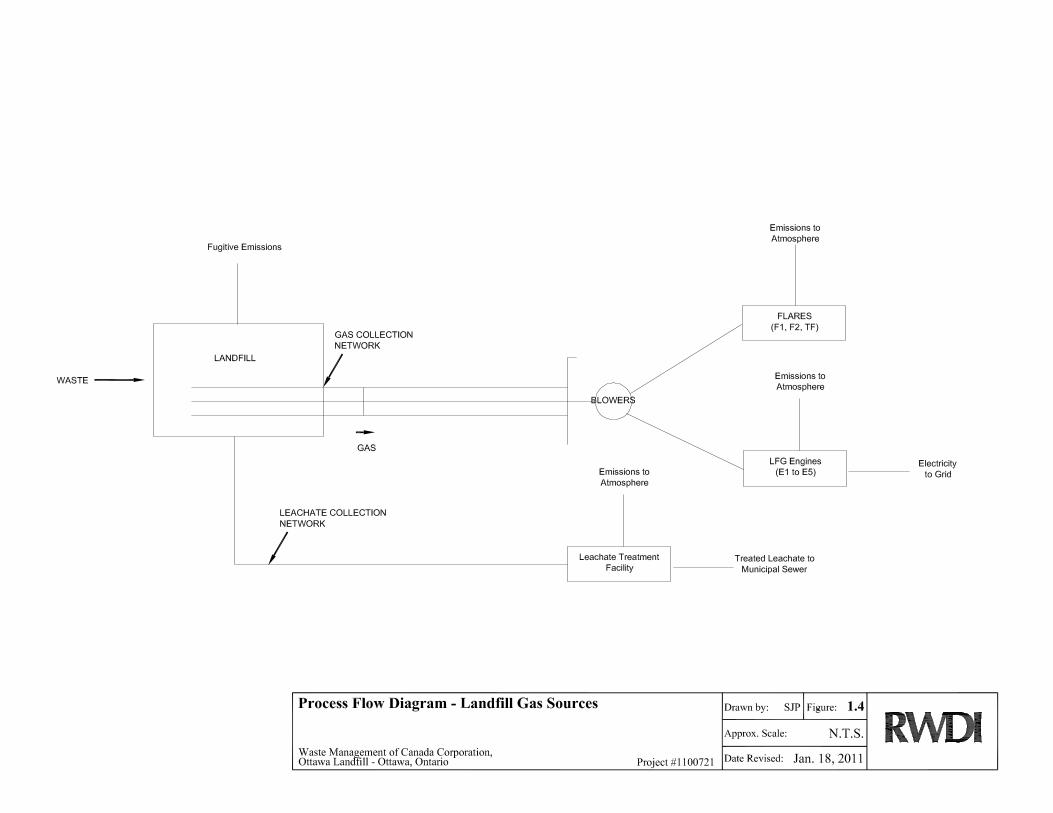
For the purposes of estimating emissions from the facility, a maximum operating scenario was considered. This scenario consists of simultaneous operation of all on-site sources at a maximum capacity, including the LGTE facility engine-generator sets, the landfill gas flares, the leachate treatment system and generators. The assessment also considered the concurrent maximum level of fugitive releases from the existing and proposed landfill mounds as well as material handling and processing emissions.
Emission rates were determined through the following estimation techniques; mass balance, emission factors, source testing, and engineering calculations.
7.1 Emission Summary Table RWDI Project #1302177
Receptor Contaminant CAS Total Air Maximum Averaging MOE Limiting Regulation Percentage
Number Facility Dispersion POI Period POI Effect Schedule of MOE
Emission Model Concentration Limit [1] # POI Limit
Rate Used
(g/s) (µg/m³) (hours) (µg/m³) (%)
Property Line Methyl chloroform (1,1,1-Trichloroethane) 71-55-6 6.00E-05 AERMOD 0.003 24 Hour 115000 Health Schedule 3 < 1%
[1] The term “MOE POI Limit” identified in Table D-4 refers to the following information (there may be more than one relevant MOE POI Limit for each contaminant):
- air quality standards in Schedules 1, 2 and 3 of the Regulation; and
- the guidelines for contaminants set out the MOE publication, “Summary of Standards and Guidelines to Support Ontario Regulation 419: Air Pollution – Local Air Quality"
- an acceptable concentration for contaminants with no standards or guidelines.
A = Ʃ((B x 48) / C), where,
A = the amount (or concentration) of total mercaptans, expressed as methyl mercaptan
B = the amount (or concentration) of each mercaptans
C = the molecular weight of each mercaptan
[3] For the purposes of the Regulation, mercaptans are expressed as methyl mercaptan; an amount (or concentration of total mercaptans shall be calculated in accordance with the following formula:
[2] A calibration factor of 3 was applied to all hydrogen sulphide concentrations.
Employee Job Title
FIGURES
#*#*#*#*
#*#*#*#*#*
#*#*#*
!(
!(
#*
#*
!(
F3F2
F1
E1E2
E3
E4E5
422000
422000
422500
422500
423000
423000
423500
423500
424000
424000
424500
424500
425000
425000
425500
425500
5014
000
5014
000
5014
500
5014
500
5015
000
5015
000
5015
500
5015
500
WCEC Landfill Site Plan
West Carleton Environmental Centre - Ottawa, Ontario Project #1302177
RESIDENTIAL ZONES (1) Residential First Density Zone R1 (2) Residential Second Density Zone R2 (3) Residential Third Density Zone R3 (4) Residential Fourth Density Zone R4 (5) Residential Fifth Density Zone R5 (6) Mobile Home Park Zone RM INSTITUTIONAL ZONES (7) Minor Institutional Zone I1 (8) Major Institutional Zone I2 OPEN SPACE AND LEISURE ZONES (9) Parks and Open Space Zone O1 (10) Community Leisure Facility Zone L1 (11) Major Leisure Facility Zone L2 (12) Central Experimental Farm Zone L3 ENVIRONMENTAL ZONE (13) Environmental Protection Zone EP COMMERCIAL/MIXED USE ZONES (14) Local Commercial Zone LC (15) General Mixed Use Zone GM (16) Traditional Mainstreet Zone TM (17) Arterial Mainstreet Zone AM (18) Mixed Use Centre Zone MC (19) Mixed Use Downtown Zone MD
INDUSTRIAL ZONES (20) Business Park Industrial Zone IP (21) Light Industrial Zone IL (22) General Industrial Zone IG (23) Heavy Industrial Zone IH TRANSPORTATION ZONES (24) Air Transportation Facility Zone T1 (25) Ground Transportation Facility Zone
T2
RURAL ZONES (26) Agricultural Zone AG (27) Mineral Extraction Zone ME (28) Mineral Aggregate Reserve Zone MR (29) Rural Commercial Zone RC (30) Rural General Industrial Zone RG (31) Rural Heavy Industrial Zone RH (32) Rural Institutional Zone RI (33) Rural Residential Zone RR (34) Rural Countryside Zone RU (35) Village Mixed Use Zone VM (36) Village Residential First Density Zone
V1
(37) Village Residential Second Density Zone
V2
(38) Village Residential Third Density Zone
V3
OTHER ZONES (39) Development Reserve Zone DR
Figure 6.2a ‐ Zoning Map for Ottawa LandfillShowing Lands South and West of the Landfill Showing Lands South and West of the Landfill
Ottawa Landfill
Figure 6.2b ‐ Zoning Map for Ottawa LandfillShowing Lands North and East of the Landfill Showing Lands North and East of the Landfill
Ottawa Landfill
APPENDIX A Please See Attached CD
Employee Job Title
APPENDIX B
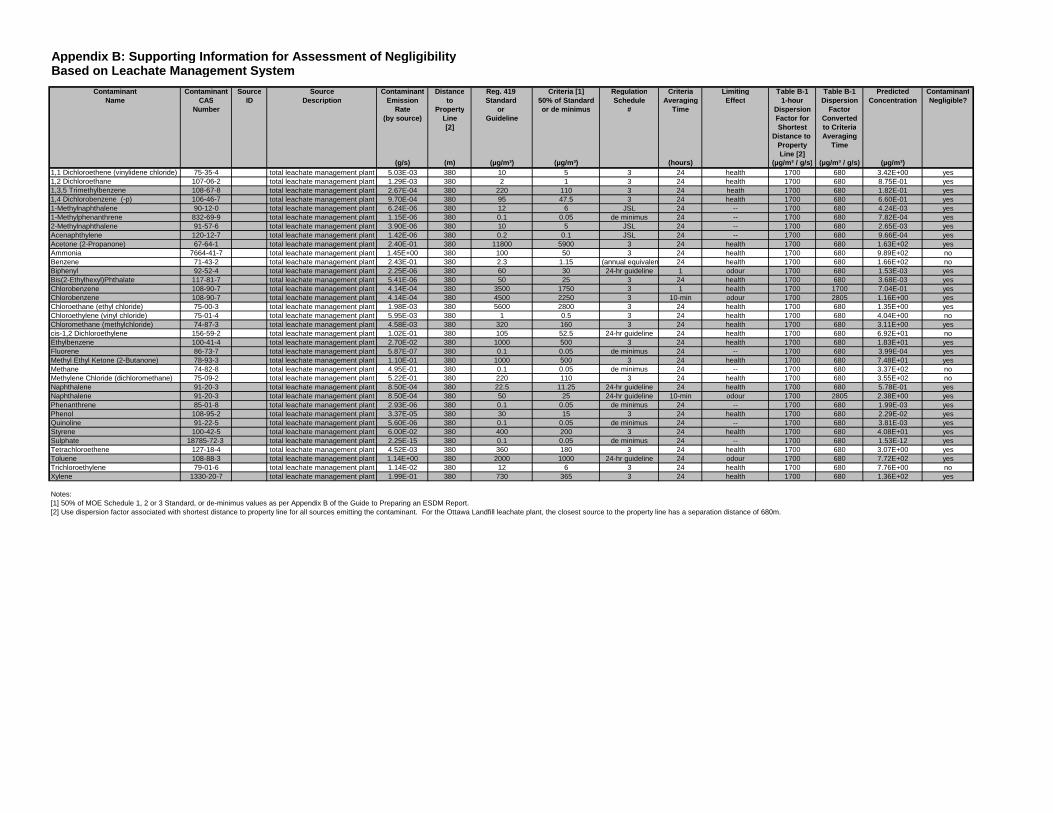
Appendix B: Supporting Information for Assessment of NegligibilityBased on Leachate Management System
Contaminant Contaminant Source Source Contaminant Distance Reg. 419 Criteria [1] Regulation Criteria Limiting Table B-1 Table B-1 Predicted ContaminantName CAS ID Description Emission to Standard 50% of Standard Schedule Averaging Effect 1-hour Dispersion Concentration Negligible?
Number Rate Property or or de minimus # Time Dispersion Factor(by source) Line Guideline Factor for Converted
[2] Shortest to CriteriaDistance to Averaging
Property TimeLine [2]
(g/s) (m) (µg/m³) (µg/m³) (hours) (µg/m³ / g/s) (µg/m³ / g/s) (µg/m³)1,1 Dichloroethene (vinylidene chloride) 75-35-4 total leachate management plant 5.03E-03 380 10 5 3 24 health 1700 680 3.42E+00 yes1,2 Dichloroethane 107-06-2 total leachate management plant 1.29E-03 380 2 1 3 24 health 1700 680 8.75E-01 yes1,3,5 Trimethylbenzene 108-67-8 total leachate management plant 2.67E-04 380 220 110 3 24 heath 1700 680 1.82E-01 yes1,4 Dichlorobenzene (-p) 106-46-7 total leachate management plant 9.70E-04 380 95 47.5 3 24 health 1700 680 6.60E-01 yes1-Methylnaphthalene 90-12-0 total leachate management plant 6.24E-06 380 12 6 JSL 24 -- 1700 680 4.24E-03 yes1-Methylphenanthrene 832-69-9 total leachate management plant 1.15E-06 380 0.1 0.05 de minimus 24 -- 1700 680 7.82E-04 yes2-Methylnaphthalene 91-57-6 total leachate management plant 3.90E-06 380 10 5 JSL 24 -- 1700 680 2.65E-03 yesAcenaphthylene 120-12-7 total leachate management plant 1.42E-06 380 0.2 0.1 JSL 24 -- 1700 680 9.66E-04 yesAcetone (2-Propanone) 67-64-1 total leachate management plant 2.40E-01 380 11800 5900 3 24 health 1700 680 1.63E+02 yesAmmonia 7664-41-7 total leachate management plant 1.45E+00 380 100 50 3 24 health 1700 680 9.89E+02 noBenzene 71-43-2 total leachate management plant 2.43E-01 380 2.3 1.15 3 (annual equivalent) 24 health 1700 680 1.66E+02 noBiphenyl 92-52-4 total leachate management plant 2.25E-06 380 60 30 24-hr guideline 1 odour 1700 680 1.53E-03 yesBis(2-Ethylhexyl)Phthalate 117-81-7 total leachate management plant 5.41E-06 380 50 25 3 24 health 1700 680 3.68E-03 yesChlorobenzene 108-90-7 total leachate management plant 4.14E-04 380 3500 1750 3 1 health 1700 1700 7.04E-01 yesChlorobenzene 108-90-7 total leachate management plant 4.14E-04 380 4500 2250 3 10-min odour 1700 2805 1.16E+00 yesChloroethane (ethyl chloride) 75-00-3 total leachate management plant 1.98E-03 380 5600 2800 3 24 health 1700 680 1.35E+00 yesChloroethylene (vinyl chloride) 75-01-4 total leachate management plant 5.95E-03 380 1 0.5 3 24 health 1700 680 4.04E+00 noChloromethane (methylchloride) 74-87-3 total leachate management plant 4.58E-03 380 320 160 3 24 health 1700 680 3.11E+00 yescis-1,2 Dichloroethylene 156-59-2 total leachate management plant 1.02E-01 380 105 52.5 24-hr guideline 24 health 1700 680 6.92E+01 noEthylbenzene 100-41-4 total leachate management plant 2.70E-02 380 1000 500 3 24 health 1700 680 1.83E+01 yesFluorene 86-73-7 total leachate management plant 5.87E-07 380 0.1 0.05 de minimus 24 -- 1700 680 3.99E-04 yesMethyl Ethyl Ketone (2-Butanone) 78-93-3 total leachate management plant 1.10E-01 380 1000 500 3 24 health 1700 680 7.48E+01 yesMethane 74-82-8 total leachate management plant 4.95E-01 380 0.1 0.05 de minimus 24 -- 1700 680 3.37E+02 noMethylene Chloride (dichloromethane) 75-09-2 total leachate management plant 5.22E-01 380 220 110 3 24 health 1700 680 3.55E+02 noNaphthalene 91-20-3 total leachate management plant 8.50E-04 380 22.5 11.25 24-hr guideline 24 health 1700 680 5.78E-01 yesNaphthalene 91-20-3 total leachate management plant 8.50E-04 380 50 25 24-hr guideline 10-min odour 1700 2805 2.38E+00 yesPhenanthrene 85-01-8 total leachate management plant 2.93E-06 380 0.1 0.05 de minimus 24 -- 1700 680 1.99E-03 yesPhenol 108-95-2 total leachate management plant 3.37E-05 380 30 15 3 24 health 1700 680 2.29E-02 yesQuinoline 91-22-5 total leachate management plant 5.60E-06 380 0.1 0.05 de minimus 24 -- 1700 680 3.81E-03 yesStyrene 100-42-5 total leachate management plant 6.00E-02 380 400 200 3 24 health 1700 680 4.08E+01 yesSulphate 18785-72-3 total leachate management plant 2.25E-15 380 0.1 0.05 de minimus 24 -- 1700 680 1.53E-12 yesTetrachloroethene 127-18-4 total leachate management plant 4.52E-03 380 360 180 3 24 health 1700 680 3.07E+00 yesToluene 108-88-3 total leachate management plant 1.14E+00 380 2000 1000 24-hr guideline 24 odour 1700 680 7.72E+02 yesTrichloroethylene 79-01-6 total leachate management plant 1.14E-02 380 12 6 3 24 health 1700 680 7.76E+00 noXylene 1330-20-7 total leachate management plant 1.99E-01 380 730 365 3 24 health 1700 680 1.36E+02 yes
Notes:[1] 50% of MOE Schedule 1, 2 or 3 Standard, or de-minimus values as per Appendix B of the Guide to Preparing an ESDM Report.[2] Use dispersion factor associated with shortest distance to property line for all sources emitting the contaminant. For the Ottawa Landfill leachate plant, the closest source to the property line has a separation distance of 680m.
Employee Job Title
APPENDIX C
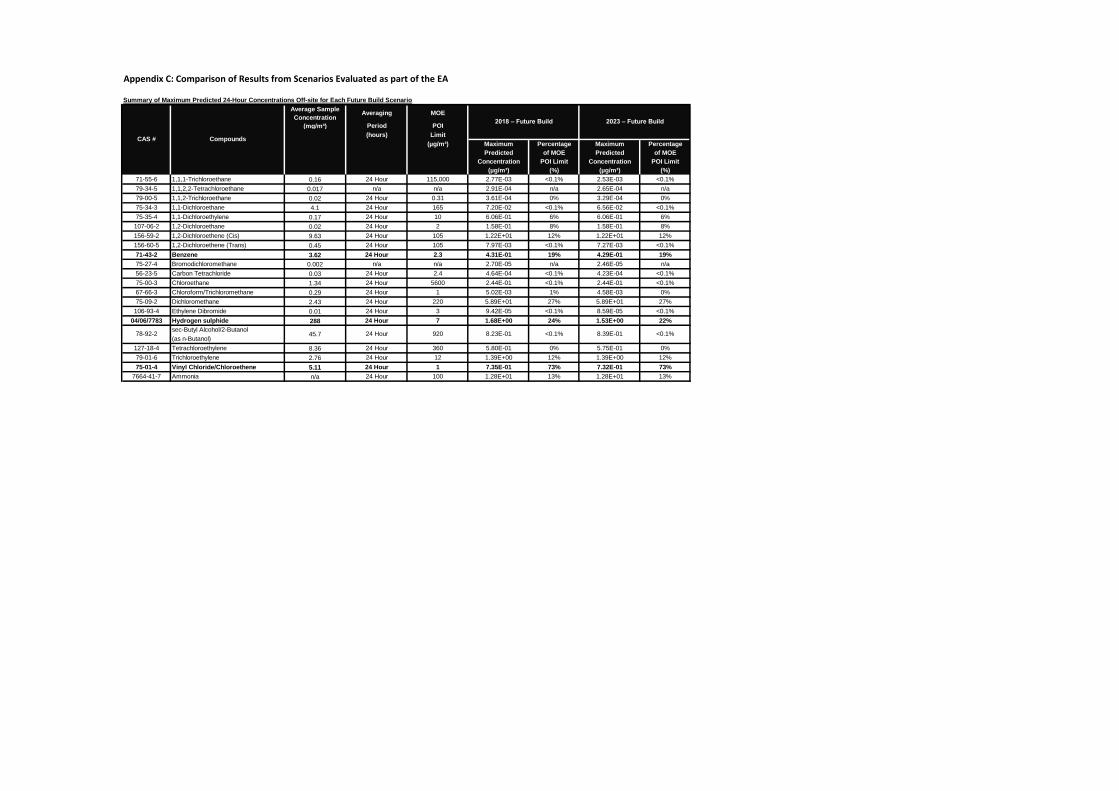
Appendix C: Comparison of Results from Scenarios Evaluated as part of the EA
Summary of Maximum Predicted 24-Hour Concentrations Off-site for Each Future Build Scenario
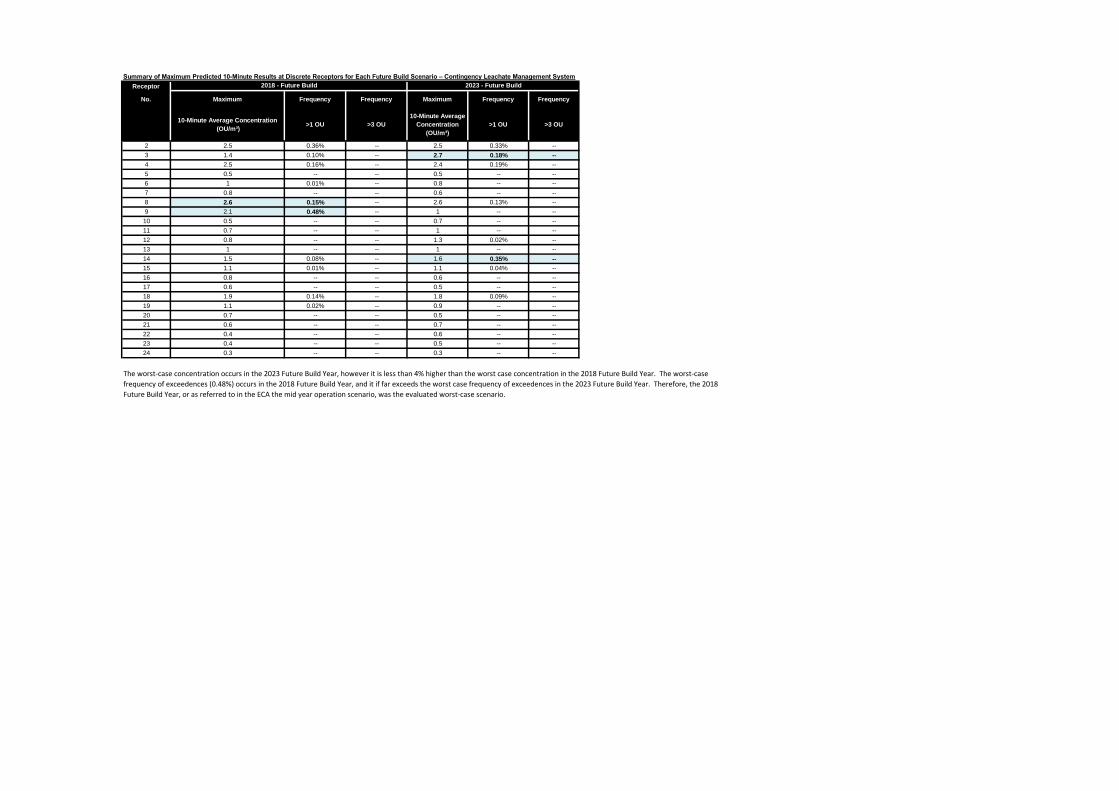
Summary of Maximum Predicted 10-Minute Results at Discrete Receptors for Each Future Build Scenario – Contingency Leachate Management System
Receptor
No. Maximum Frequency Frequency Maximum Frequency Frequency
10-Minute Average Concentration
(OU/m³)>1 OU >3 OU
10-Minute Average
Concentration
(OU/m³)
>1 OU >3 OU
2 2.5 0.36% -- 2.5 0.33% --
3 1.4 0.10% -- 2.7 0.18% --
4 2.5 0.16% -- 2.4 0.19% --
5 0.5 -- -- 0.5 -- --
6 1 0.01% -- 0.8 -- --
7 0.8 -- -- 0.6 -- --
8 2.6 0.15% -- 2.6 0.13% --
9 2.1 0.48% -- 1 -- --
10 0.5 -- -- 0.7 -- --
11 0.7 -- -- 1 -- --
12 0.8 -- -- 1.3 0.02% --
13 1 -- -- 1 -- --
14 1.5 0.08% -- 1.6 0.35% --
15 1.1 0.01% -- 1.1 0.04% --
16 0.8 -- -- 0.6 -- --
17 0.6 -- -- 0.5 -- --
18 1.9 0.14% -- 1.8 0.09% --
19 1.1 0.02% -- 0.9 -- --
20 0.7 -- -- 0.5 -- --
21 0.6 -- -- 0.7 -- --
22 0.4 -- -- 0.6 -- --
23 0.4 -- -- 0.5 -- --
24 0.3 -- -- 0.3 -- --
2018 - Future Build 2023 - Future Build
The worst-case concentration occurs in the 2023 Future Build Year, however it is less than 4% higher than the worst case concentration in the 2018 Future Build Year. The worst-case
frequency of exceedences (0.48%) occurs in the 2018 Future Build Year, and it if far exceeds the worst case frequency of exceedences in the 2023 Future Build Year. Therefore, the 2018
Future Build Year, or as referred to in the ECA the mid year operation scenario, was the evaluated worst-case scenario.
Employee Job Title
APPENDIX D
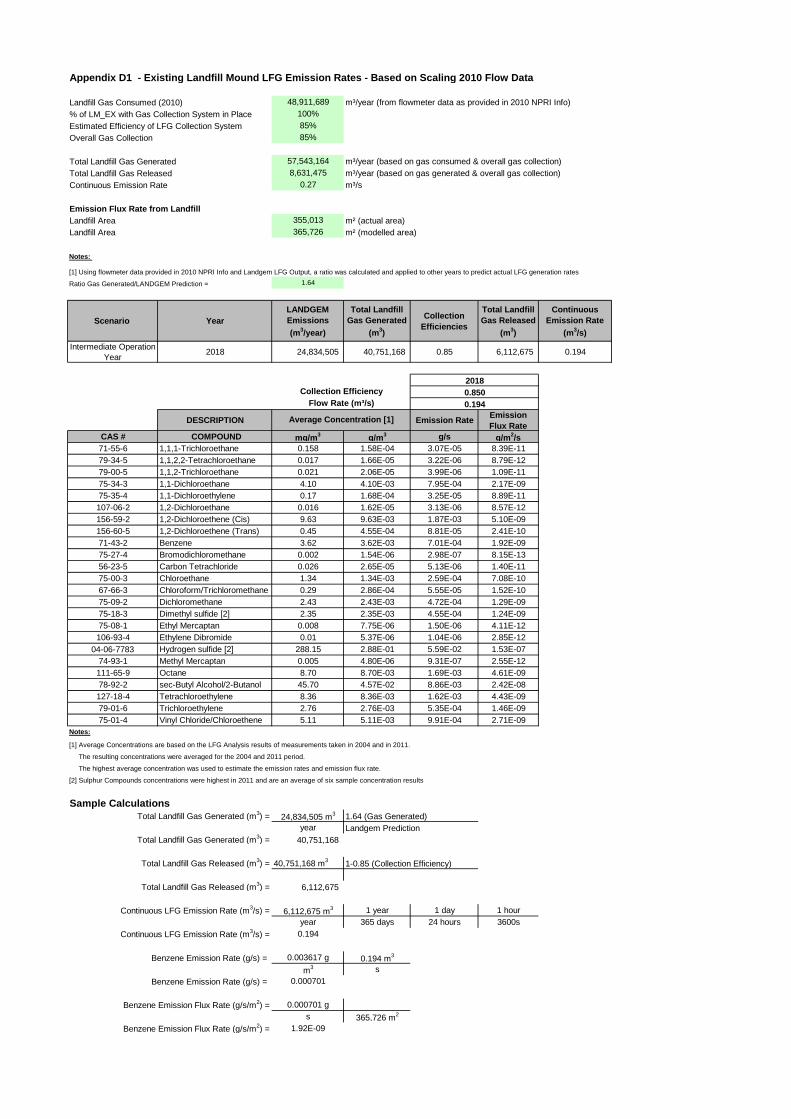
Appendix D1 - Existing Landfill Mound LFG Emission Rates - Based on Scaling 2010 Flow Data
Landfill Gas Consumed (2010) 48,911,689 m³/year (from flowmeter data as provided in 2010 NPRI Info)
% of LM_EX with Gas Collection System in Place 100%
Estimated Efficiency of LFG Collection System 85%
Overall Gas Collection 85%
Total Landfill Gas Generated 57,543,164 m³/year (based on gas consumed & overall gas collection)
Total Landfill Gas Released 8,631,475 m³/year (based on gas generated & overall gas collection)
Continuous Emission Rate 0.27 m³/s
Emission Flux Rate from Landfill
Landfill Area 355,013 m² (actual area)
Landfill Area 365,726 m² (modelled area)
Notes:
[1] Using flowmeter data provided in 2010 NPRI Info and Landgem LFG Output, a ratio was calculated and applied to other years to predict actual LFG generation rates
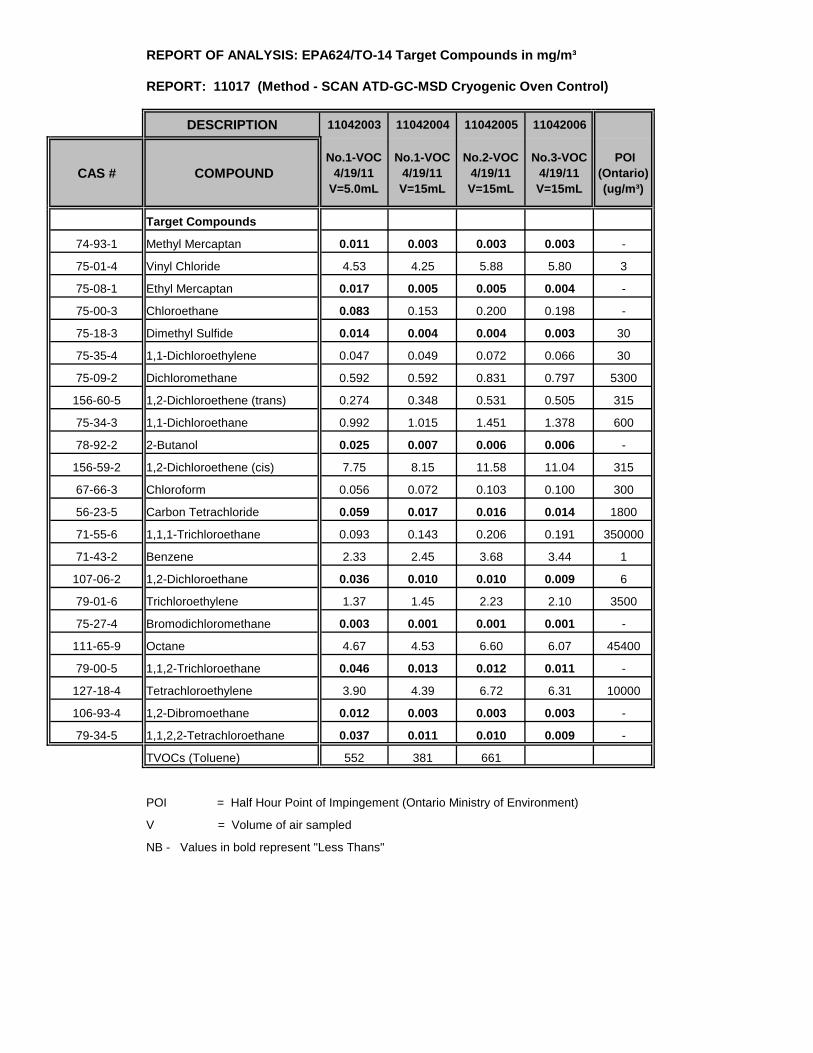
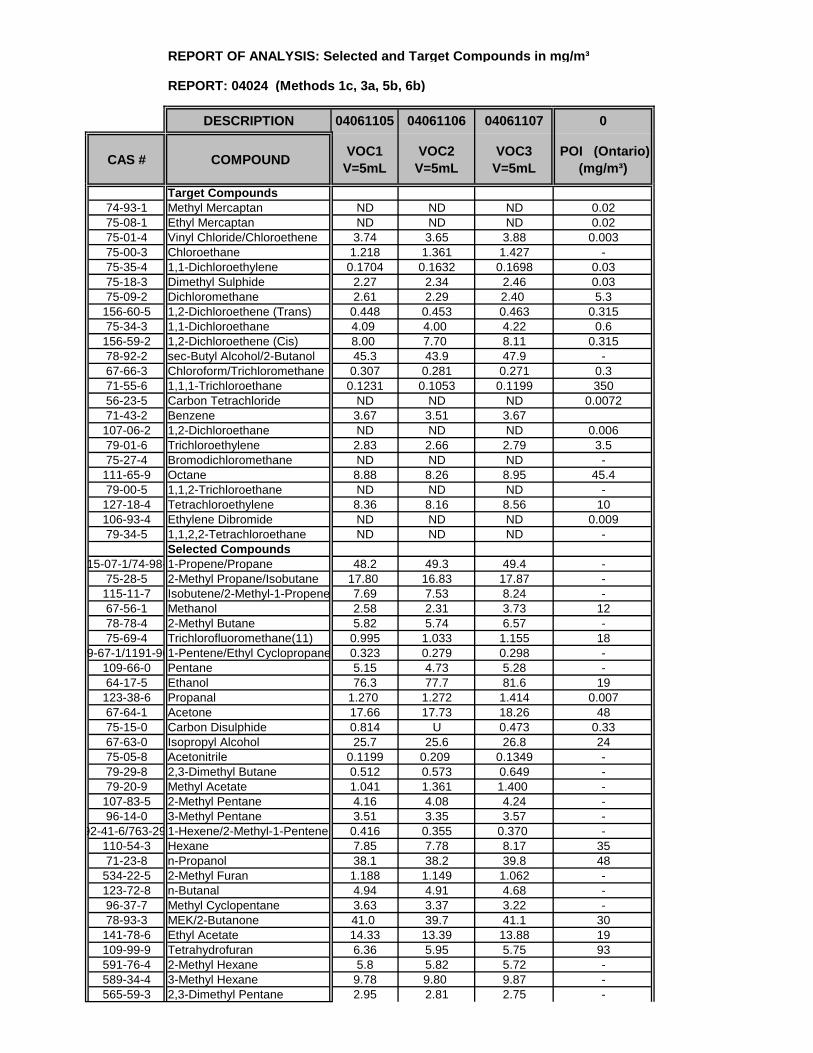
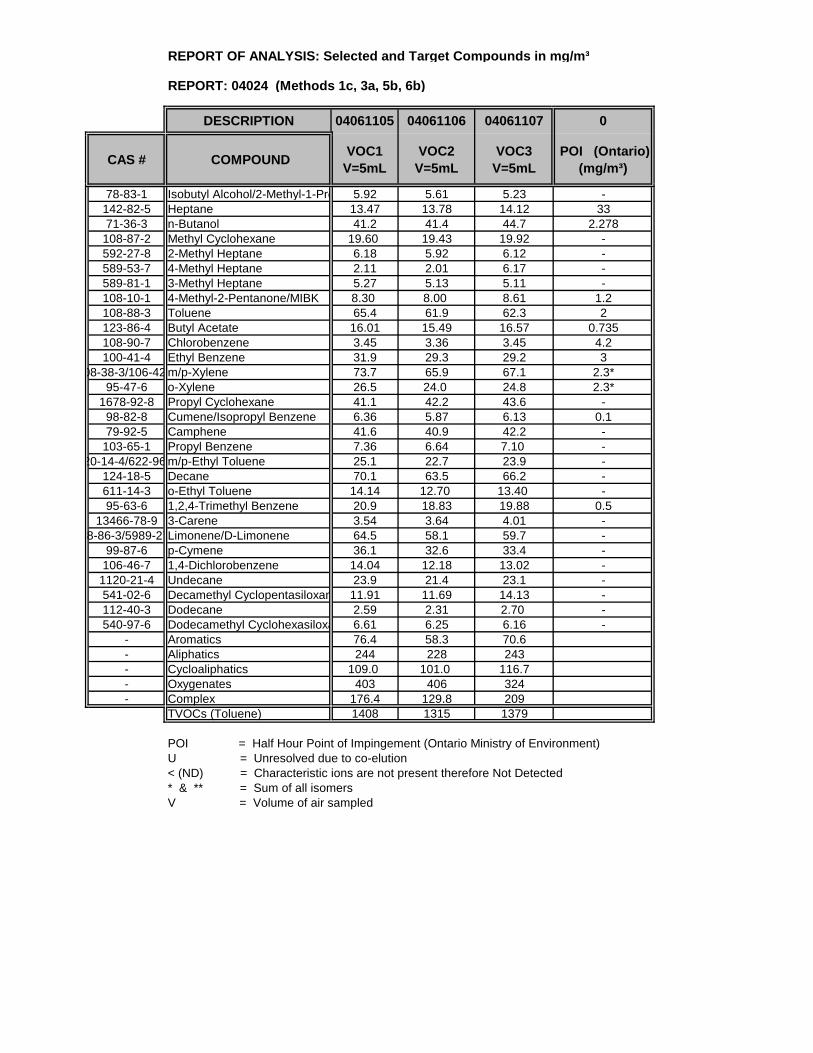
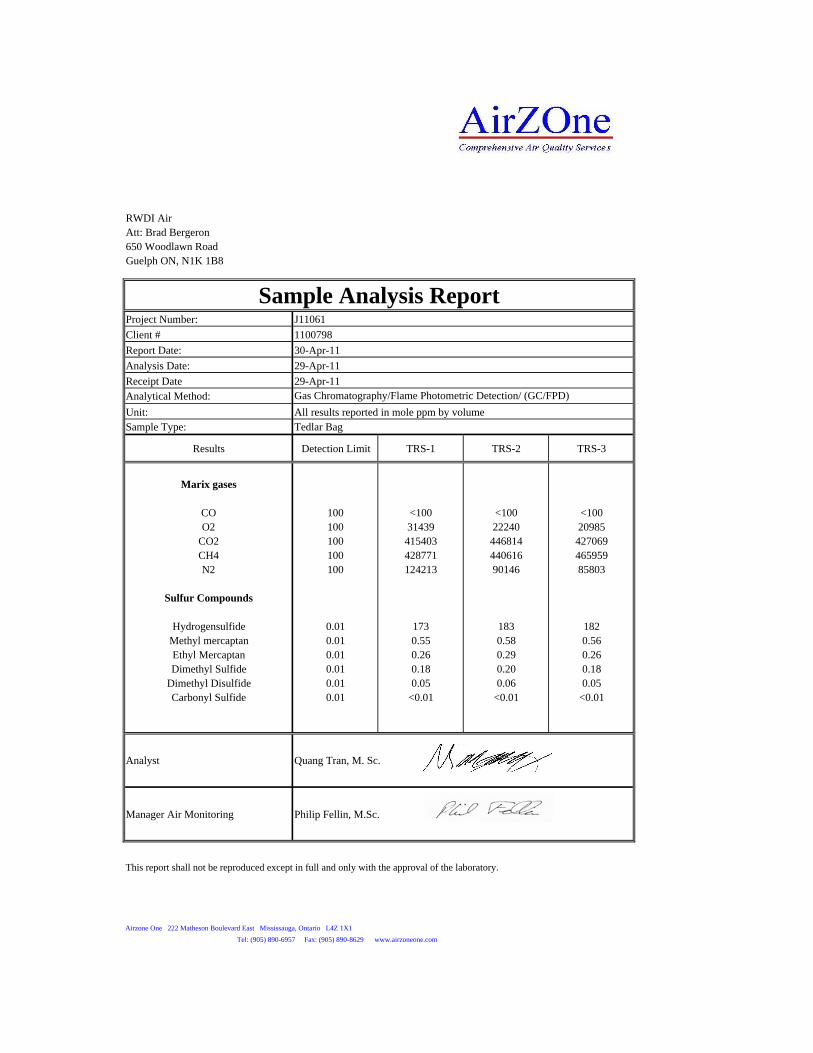
POI = Half Hour Point of Impingement (Ontario Ministry of Environment)U = Unresolved due to co-elution< (ND) = Characteristic ions are not present therefore Not Detected* & ** = Sum of all isomersV = Volume of air sampled
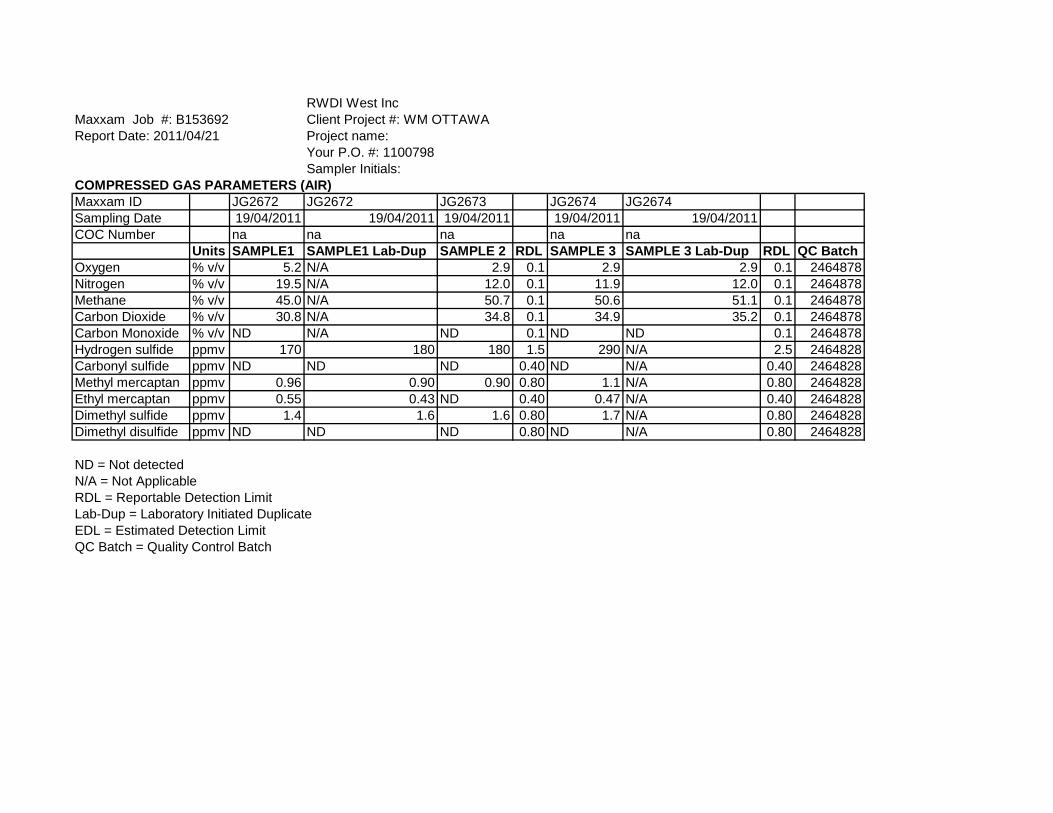
COMPRESSED GAS PARAMETERS (AIR)Maxxam ID JG2672 JG2672 JG2673 JG2674 JG2674Sampling Date 19/04/2011 19/04/2011 19/04/2011 19/04/2011 19/04/2011COC Number na na na na na
ND = Not detectedN/A = Not ApplicableRDL = Reportable Detection LimitLab-Dup = Laboratory Initiated DuplicateEDL = Estimated Detection LimitQC Batch = Quality Control Batch
RWDI AirAtt: Brad Bergeron650 Woodlawn RoadGuelph ON, N1K 1B8
Project Number: J11061Client # 1100798Report Date: 30-Apr-11Analysis Date: 29-Apr-11Receipt Date 29-Apr-11Analytical Method:Unit: All results reported in mole ppm by volumeSample Type: Tedlar Bag
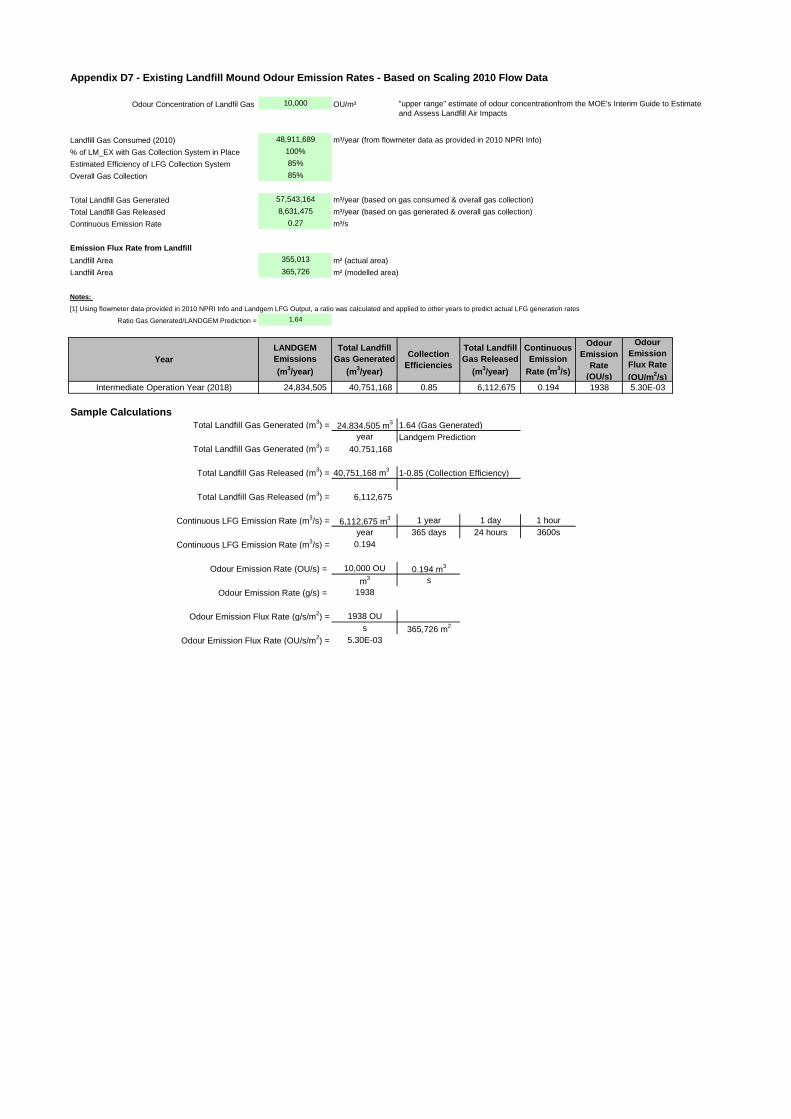
Appendix D7 - Existing Landfill Mound Odour Emission Rates - Based on Scaling 2010 Flow Data
Odour Concentration of Landfil Gas 10,000 OU/m³
Landfill Gas Consumed (2010) 48,911,689 m³/year (from flowmeter data as provided in 2010 NPRI Info)
% of LM_EX with Gas Collection System in Place 100%
Estimated Efficiency of LFG Collection System 85%
Overall Gas Collection 85%
Total Landfill Gas Generated 57,543,164 m³/year (based on gas consumed & overall gas collection)
Total Landfill Gas Released 8,631,475 m³/year (based on gas generated & overall gas collection)
Continuous Emission Rate 0.27 m³/s
Emission Flux Rate from Landfill
Landfill Area 355,013 m² (actual area)
Landfill Area 365,726 m² (modelled area)
Notes:
[1] Using flowmeter data provided in 2010 NPRI Info and Landgem LFG Output, a ratio was calculated and applied to other years to predict actual LFG generation rates
"upper range" estimate of odour concentrationfrom the MOE's Interim Guide to Estimate
and Assess Landfill Air Impacts
Employee Job Title
APPENDIX E
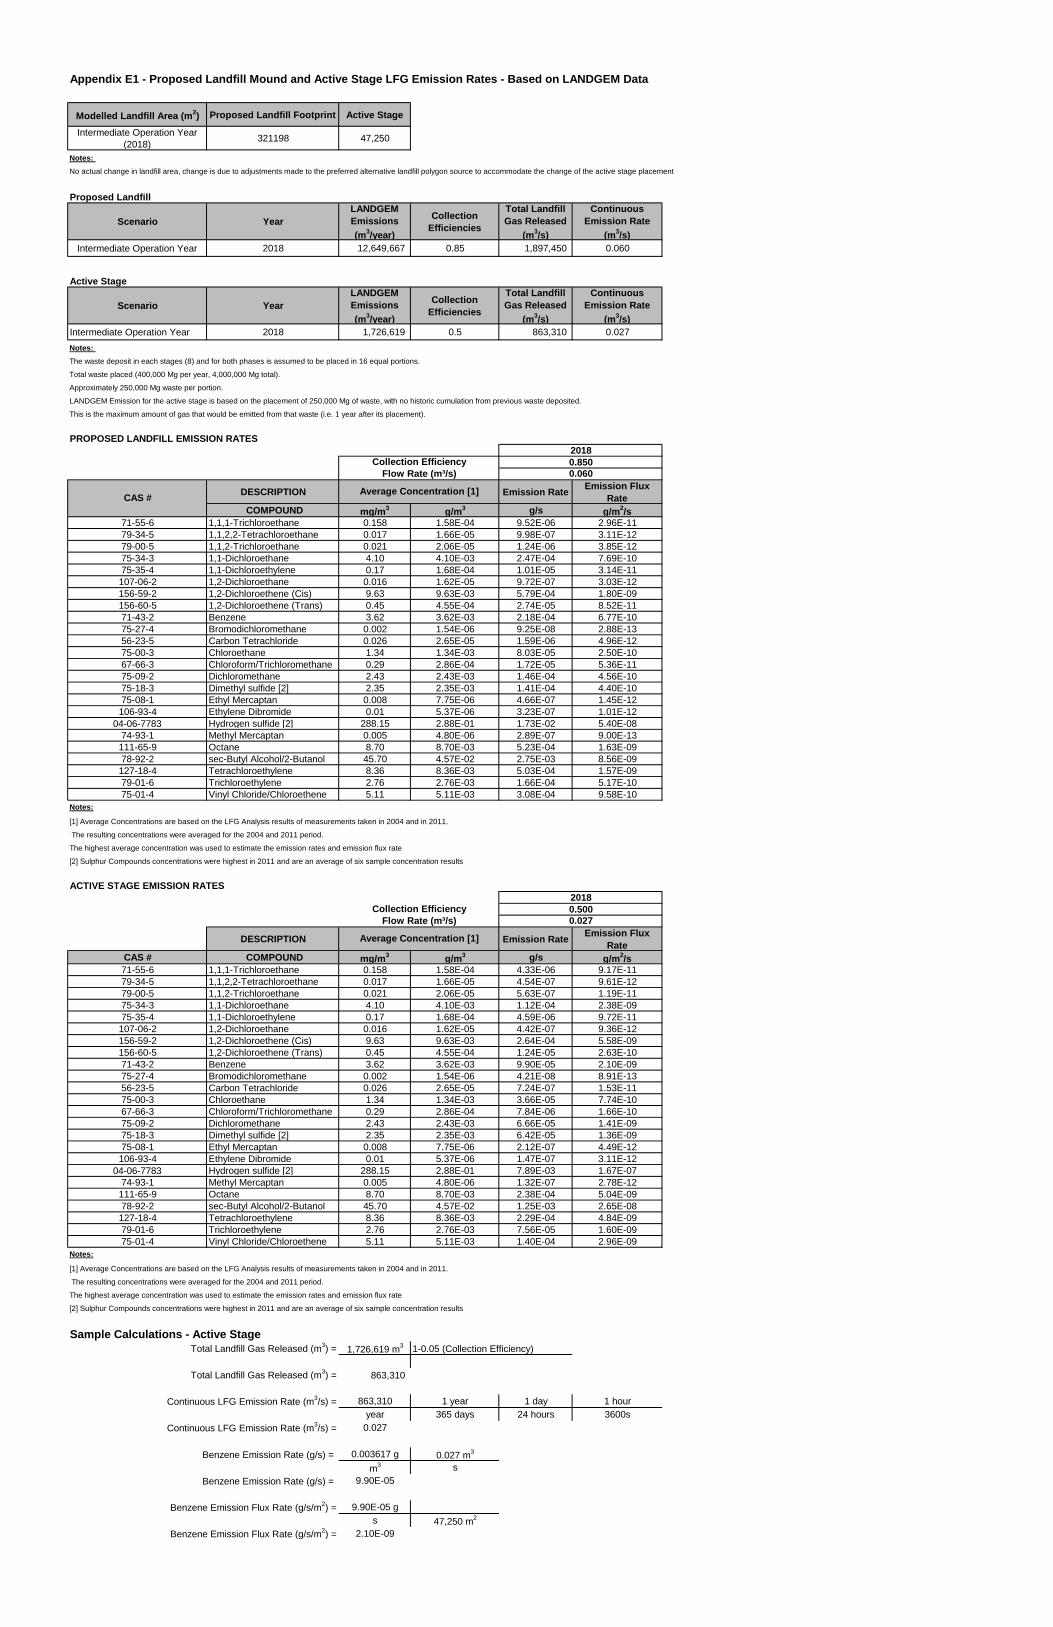
Appendix E1 - Proposed Landfill Mound and Active Stage LFG Emission Rates - Based on LANDGEM Data
Modelled Landfill Area (m2) Proposed Landfill Footprint Active Stage
Intermediate Operation Year
(2018)321198 47,250
Notes:
No actual change in landfill area, change is due to adjustments made to the preferred alternative landfill polygon source to accommodate the change of the active stage placement
Proposed Landfill
Scenario Year
LANDGEM
Emissions
(m3/year)
Collection
Efficiencies
Total Landfill
Gas Released
(m3/s)
Continuous
Emission Rate
(m3/s)
Intermediate Operation Year 2018 12,649,667 0.85 1,897,450 0.060
Active Stage
Scenario Year
LANDGEM
Emissions
(m3/year)
Collection
Efficiencies
Total Landfill
Gas Released
(m3/s)
Continuous
Emission Rate
(m3/s)
Intermediate Operation Year 2018 1,726,619 0.5 863,310 0.027
Notes:
The waste deposit in each stages (8) and for both phases is assumed to be placed in 16 equal portions.
Total waste placed (400,000 Mg per year, 4,000,000 Mg total).
Approximately 250,000 Mg waste per portion.
LANDGEM Emission for the active stage is based on the placement of 250,000 Mg of waste, with no historic cumulation from previous waste deposited.
This is the maximum amount of gas that would be emitted from that waste (i.e. 1 year after its placement).
[1] Average Concentrations are based on the LFG Analysis results of measurements taken in 2004 and in 2011.
The resulting concentrations were averaged for the 2004 and 2011 period.
The highest average concentration was used to estimate the emission rates and emission flux rate
[2] Sulphur Compounds concentrations were highest in 2011 and are an average of six sample concentration results
Sample Calculations - Active Stage
Total Landfill Gas Released (m3) = 1,726,619 m
3 1-0.05 (Collection Efficiency)
Total Landfill Gas Released (m3) = 863,310
Continuous LFG Emission Rate (m3/s) = 863,310 1 year 1 day 1 hour
year 365 days 24 hours 3600s
Continuous LFG Emission Rate (m3/s) = 0.027
Benzene Emission Rate (g/s) = 0.003617 g 0.027 m3
m3 s
Benzene Emission Rate (g/s) = 9.90E-05
Benzene Emission Flux Rate (g/s/m2) = 9.90E-05 g
s 47,250 m2
Benzene Emission Flux Rate (g/s/m2) = 2.10E-09
CAS #
Flow Rate (m³/s) 0.060
Average Concentration [1]
Collection Efficiency
Flow Rate (m³/s) 0.027
Average Concentration [1]
Collection Efficiency 0.500
2018
0.850
2018
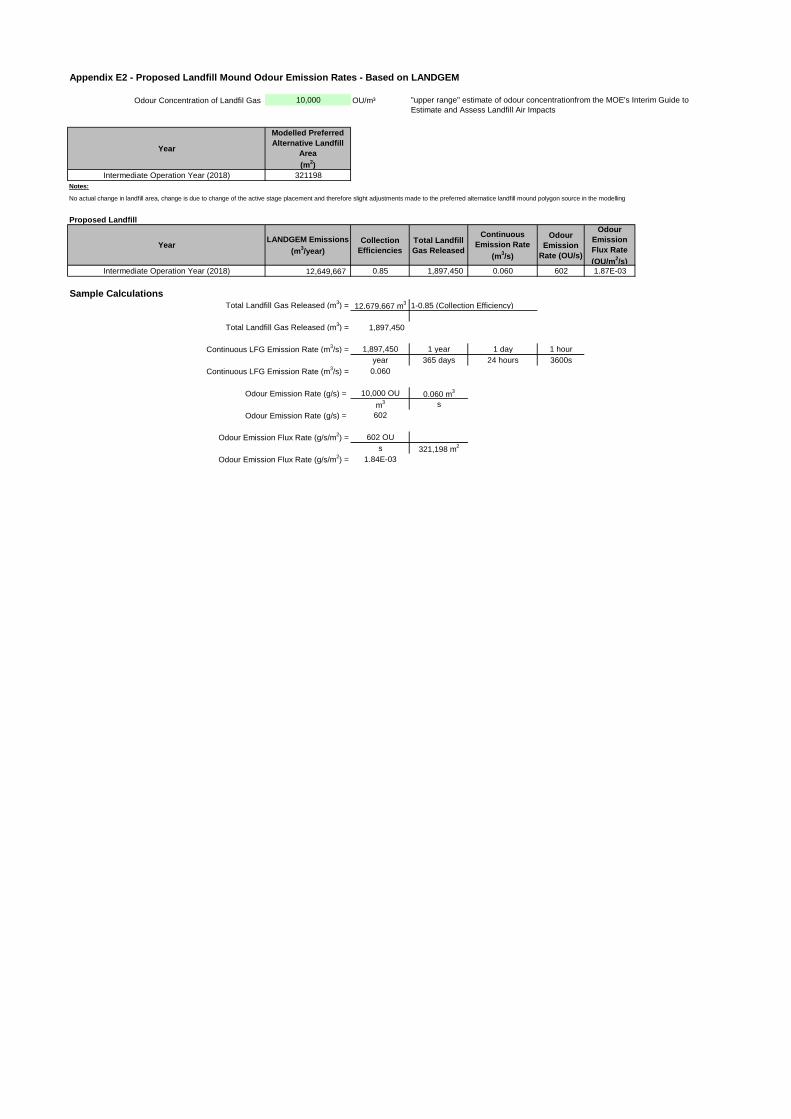
Appendix E2 - Proposed Landfill Mound Odour Emission Rates - Based on LANDGEM
Odour Concentration of Landfil Gas 10,000 OU/m³
Year
Modelled Preferred
Alternative Landfill
Area
(m2)
Intermediate Operation Year (2018) 321198
Notes:
No actual change in landfill area, change is due to change of the active stage placement and therefore slight adjustments made to the preferred alternatice landfill mound polygon source in the modelling
Proposed Landfill
YearLANDGEM Emissions
(m3/year)
Collection
Efficiencies
Total Landfill
Gas Released
Continuous
Emission Rate
(m3/s)
Odour
Emission
Rate (OU/s)
Odour
Emission
Flux Rate
(OU/m2/s)
Intermediate Operation Year (2018) 12,649,667 0.85 1,897,450 0.060 602 1.87E-03
Sample Calculations
Total Landfill Gas Released (m3) = 12,679,667 m
3 1-0.85 (Collection Efficiency)
Total Landfill Gas Released (m3) = 1,897,450
Continuous LFG Emission Rate (m3/s) = 1,897,450 1 year 1 day 1 hour
year 365 days 24 hours 3600s
Continuous LFG Emission Rate (m3/s) = 0.060
Odour Emission Rate (g/s) = 10,000 OU 0.060 m3
m3 s
Odour Emission Rate (g/s) = 602
Odour Emission Flux Rate (g/s/m2) = 602 OU
s 321,198 m2
Odour Emission Flux Rate (g/s/m2) = 1.84E-03
"upper range" estimate of odour concentrationfrom the MOE's Interim Guide to
Estimate and Assess Landfill Air Impacts
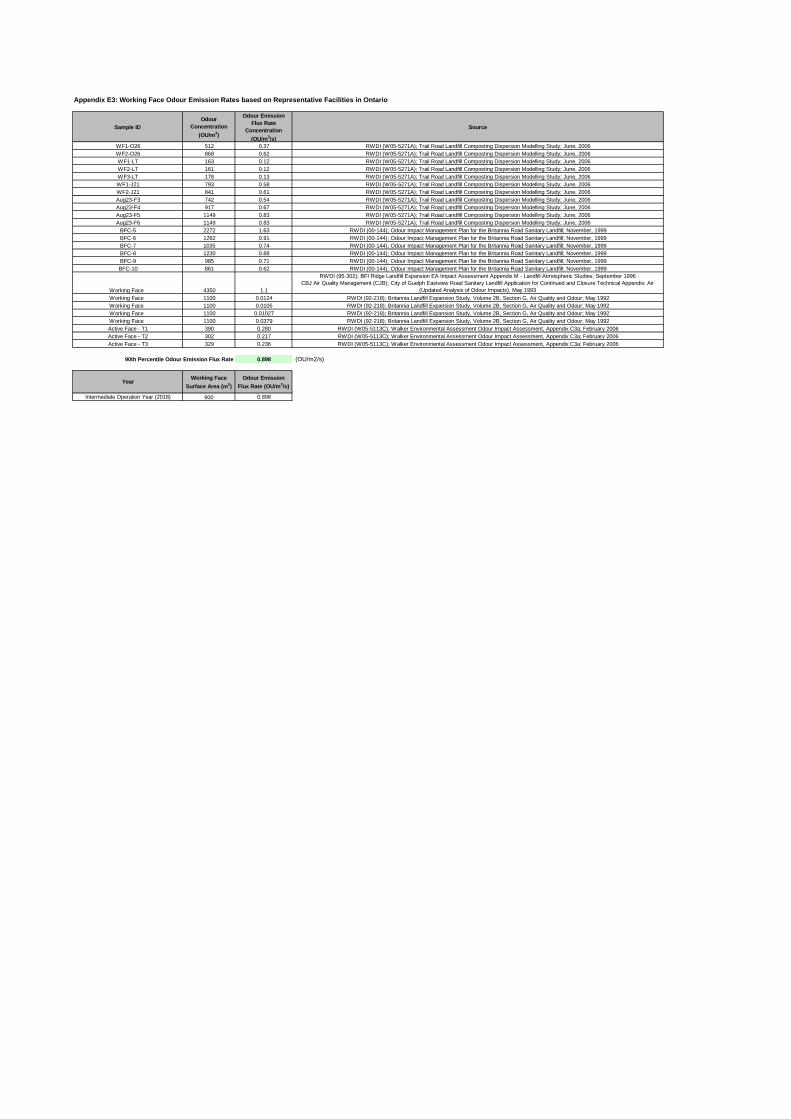
Appendix E3: Working Face Odour Emission Rates based on Representative Facilities in Ontario
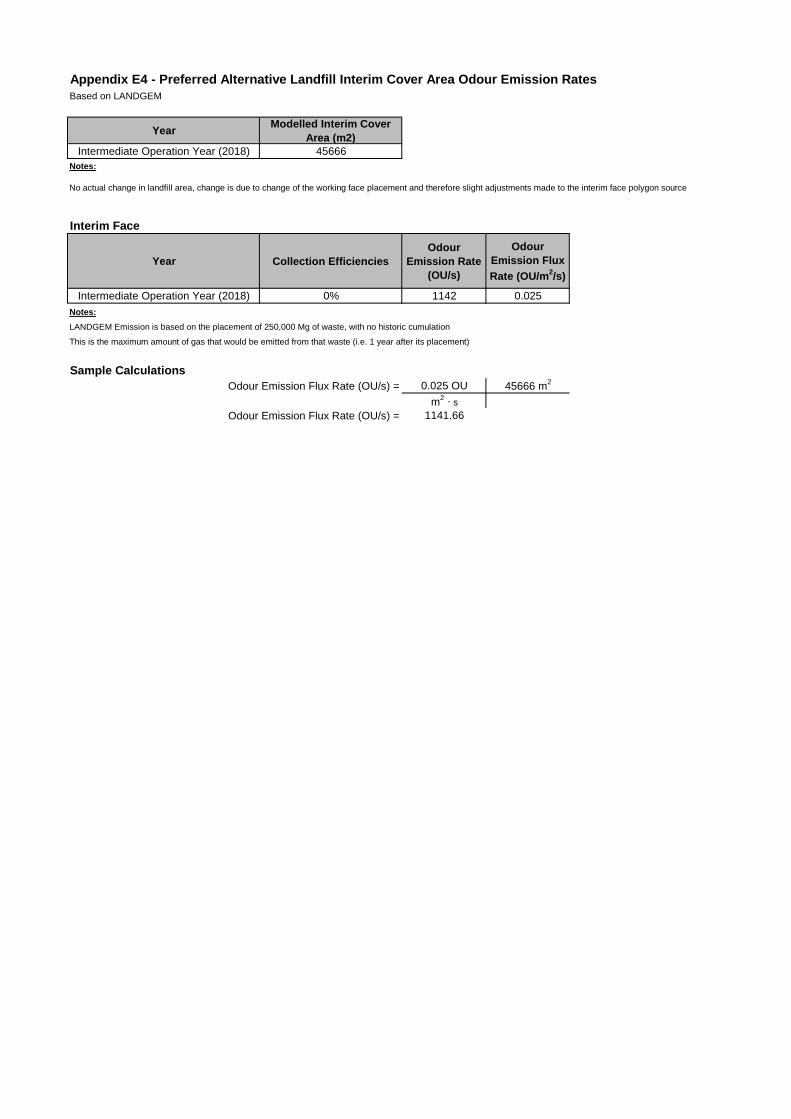
Appendix E4 - Preferred Alternative Landfill Interim Cover Area Odour Emission Rates
Based on LANDGEM
YearModelled Interim Cover
Area (m2)
Intermediate Operation Year (2018) 45666
Notes:
Interim Face
Year Collection Efficiencies
Odour
Emission Rate
(OU/s)
Odour
Emission Flux
Rate (OU/m2/s)
Intermediate Operation Year (2018) 0% 1142 0.025
Notes:
LANDGEM Emission is based on the placement of 250,000 Mg of waste, with no historic cumulation
This is the maximum amount of gas that would be emitted from that waste (i.e. 1 year after its placement)
Sample Calculations
Odour Emission Flux Rate (OU/s) = 0.025 OU 45666 m2
m2 · s
Odour Emission Flux Rate (OU/s) = 1141.66
No actual change in landfill area, change is due to change of the working face placement and therefore slight adjustments made to the interim face polygon source
Employee Job Title
APPENDIX F
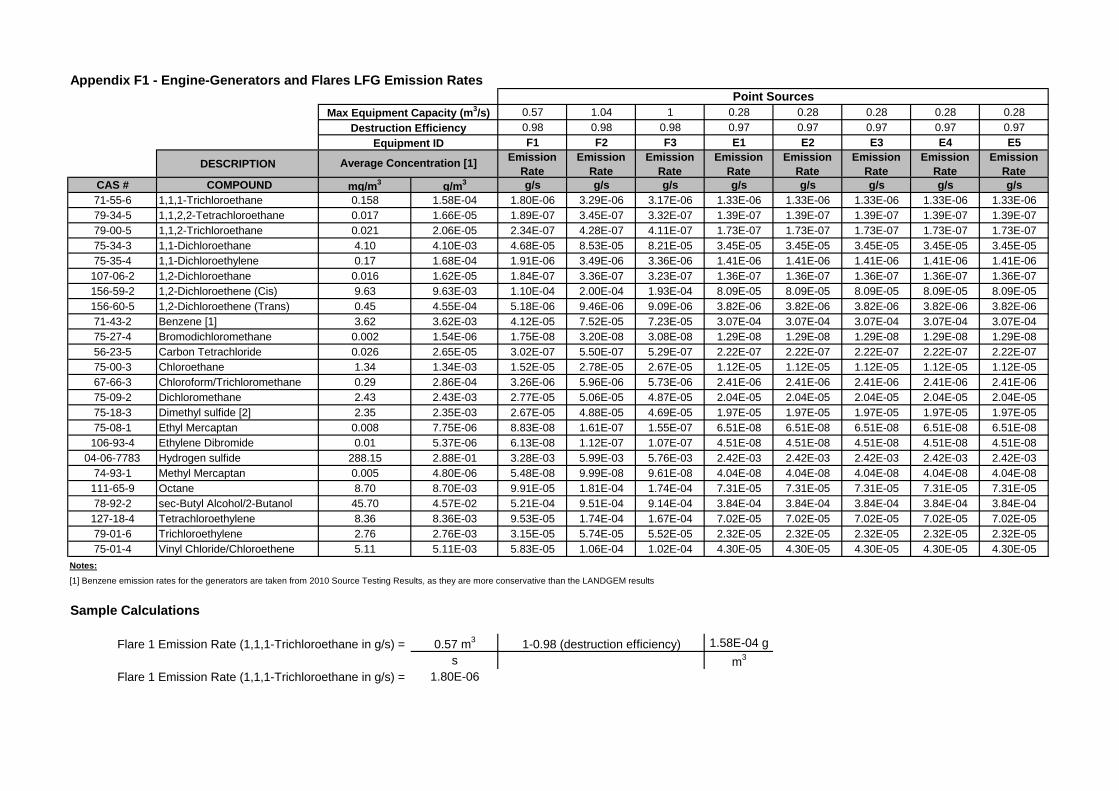
Appendix F1 - Engine-Generators and Flares LFG Emission Rates
[1] Benzene emission rates for the generators are taken from 2010 Source Testing Results, as they are more conservative than the LANDGEM results
Sample Calculations
Flare 1 Emission Rate (1,1,1-Trichloroethane in g/s) = 0.57 m3 1.58E-04 g
s m3
Flare 1 Emission Rate (1,1,1-Trichloroethane in g/s) = 1.80E-06
1-0.98 (destruction efficiency)
Average Concentration [1]
Point Sources
Max Equipment Capacity (m3/s)
Destruction Efficiency
Equipment ID
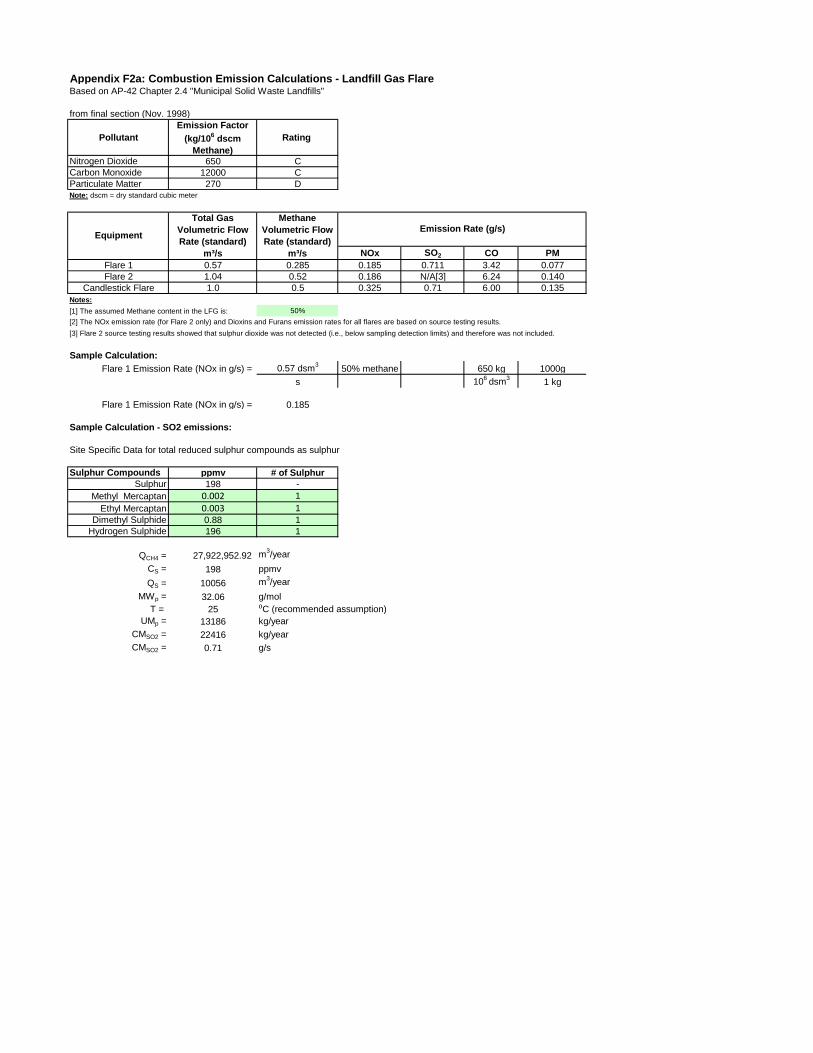
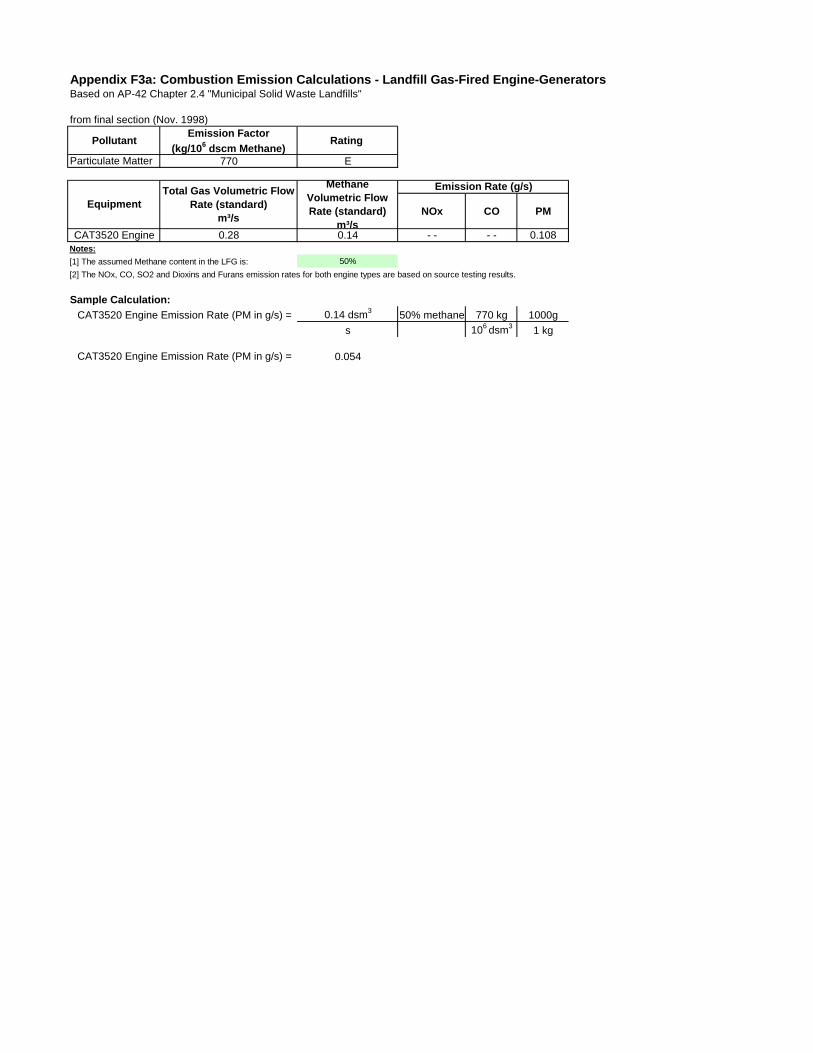
Appendix F2a: Combustion Emission Calculations - Landfill Gas FlareBased on AP-42 Chapter 2.4 "Municipal Solid Waste Landfills"
from final section (Nov. 1998)
Pollutant
Emission Factor
(kg/106 dscm
Methane)
Rating
Nitrogen Dioxide 650 C
Carbon Monoxide 12000 C
Particulate Matter 270 DNote: dscm = dry standard cubic meter
NOx SO2 CO PM
Flare 1 0.57 0.285 0.185 0.711 3.42 0.077
Flare 2 1.04 0.52 0.186 N/A[3] 6.24 0.140
Candlestick Flare 1.0 0.5 0.325 0.71 6.00 0.135
Notes:
[1] The assumed Methane content in the LFG is: 50%
[2] The NOx emission rate (for Flare 2 only) and Dioxins and Furans emission rates for all flares are based on source testing results.
[3] Flare 2 source testing results showed that sulphur dioxide was not detected (i.e., below sampling detection limits) and therefore was not included.
Sample Calculation:
Flare 1 Emission Rate (NOx in g/s) = 0.57 dsm3
50% methane 650 kg 1000g
s 106
dsm3
1 kg
Flare 1 Emission Rate (NOx in g/s) = 0.185
Sample Calculation - SO2 emissions:
Site Specific Data for total reduced sulphur compounds as sulphur
Sulphur Compounds ppmv # of Sulphur
Sulphur 198 -
Methyl Mercaptan 0.002 1
Ethyl Mercaptan 0.003 1
Dimethyl Sulphide 0.88 1
Hydrogen Sulphide 196 1
QCH4 = 27,922,952.92 m3/year
CS = 198 ppmv
QS = 10056 m3/year
MWp = 32.06 g/mol
T = 25 ⁰C (recommended assumption)
UMp = 13186 kg/year
CMSO2 = 22416 kg/year
CMSO2 = 0.71 g/s
Total Gas
Volumetric Flow
Rate (standard)
m³/s
Methane
Volumetric Flow
Rate (standard)
m³/s
Emission Rate (g/s)Equipment
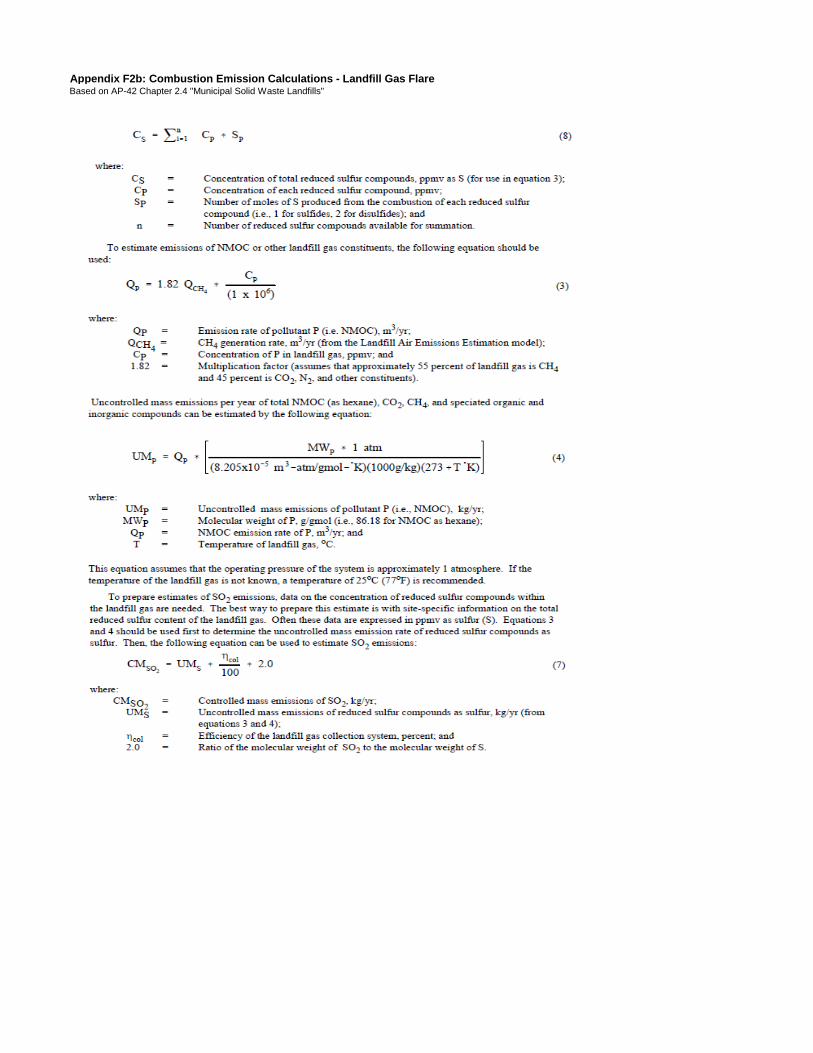
Appendix F2b: Combustion Emission Calculations - Landfill Gas FlareBased on AP-42 Chapter 2.4 "Municipal Solid Waste Landfills"
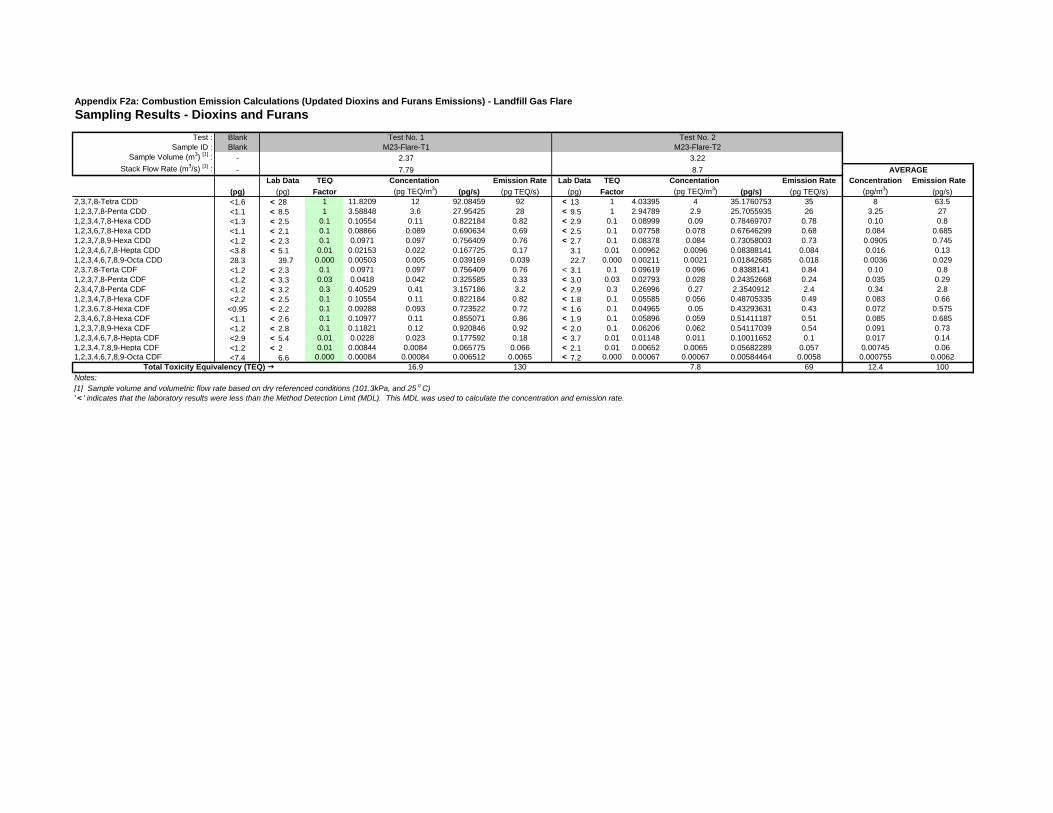
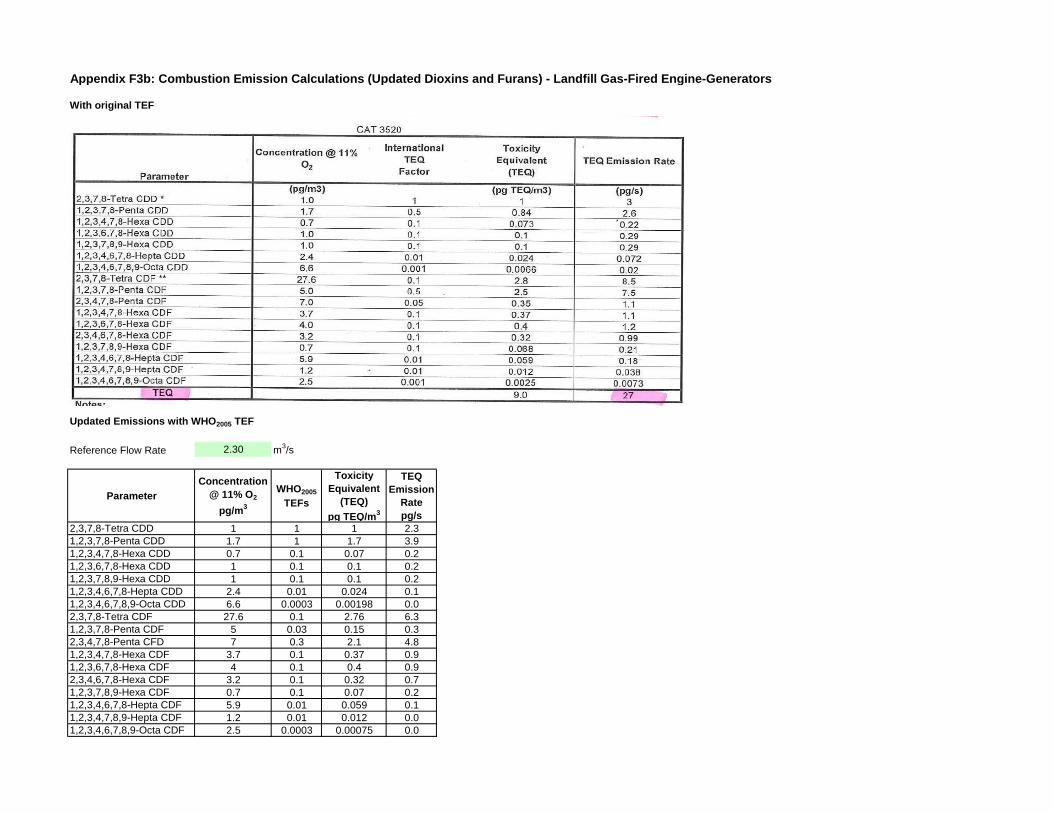
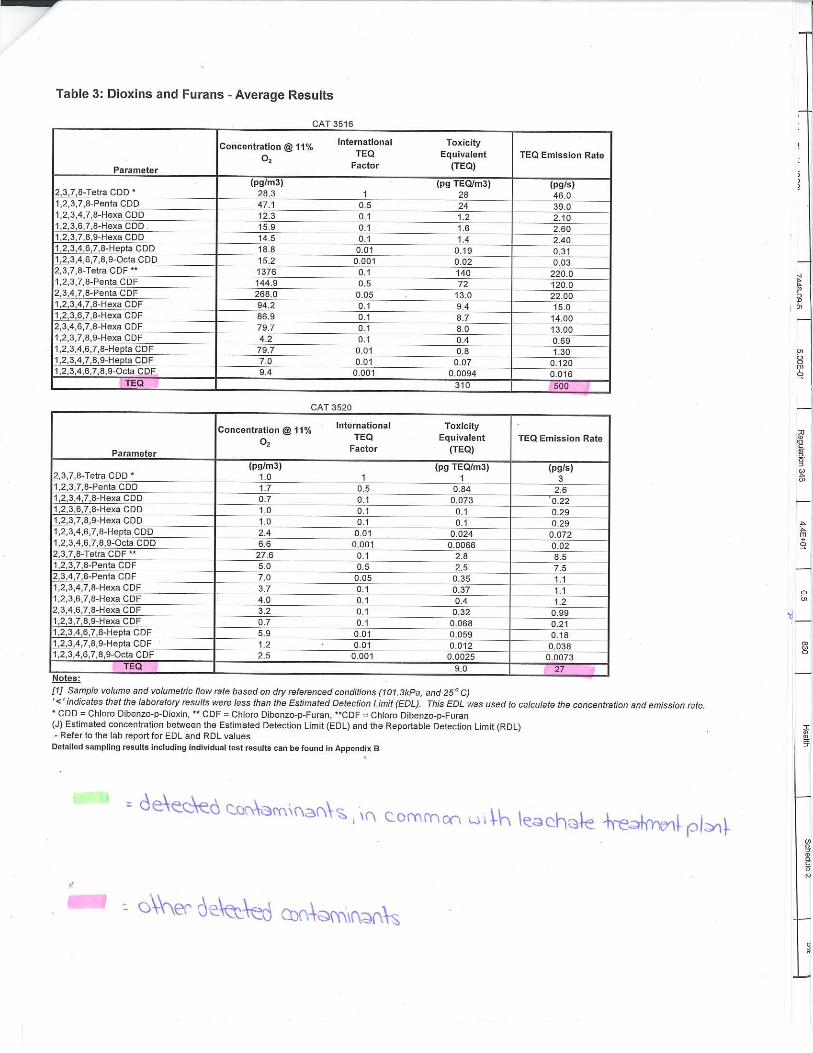
Appendix F2a: Combustion Emission Calculations (Updated Dioxins and Furans Emissions) - Landfill Gas Flare
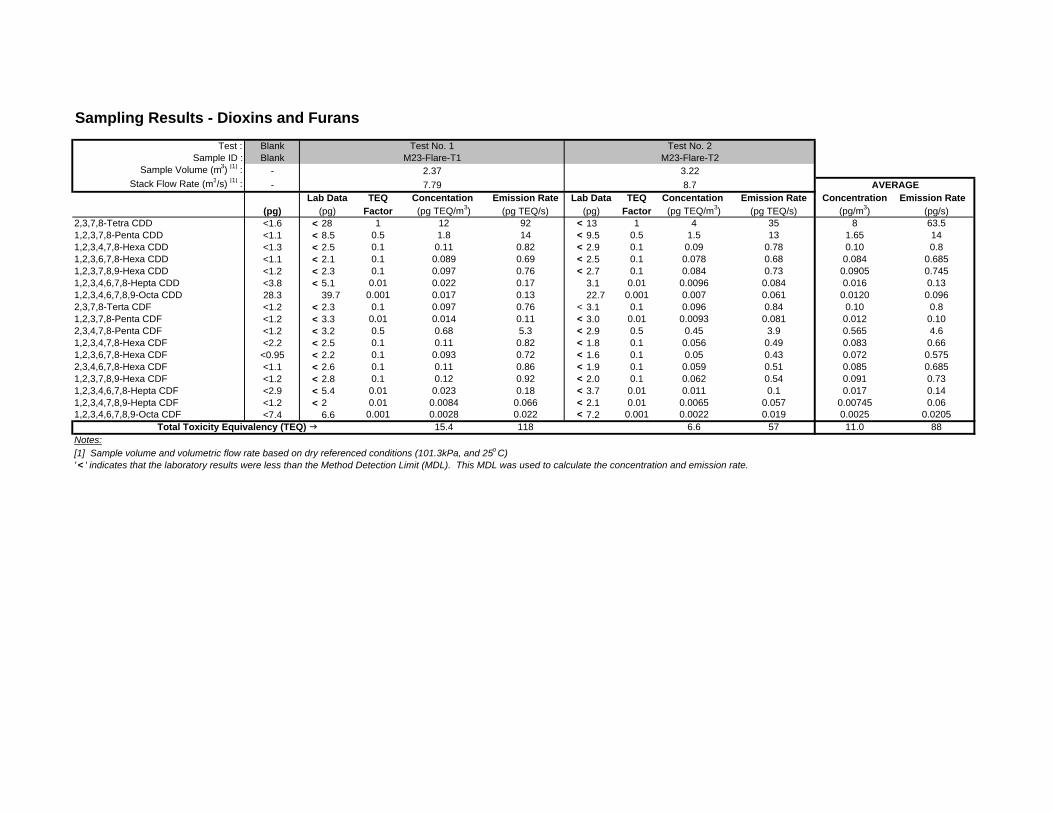
[1] Sample volume and volumetric flow rate based on dry referenced conditions (101.3kPa, and 25oC)
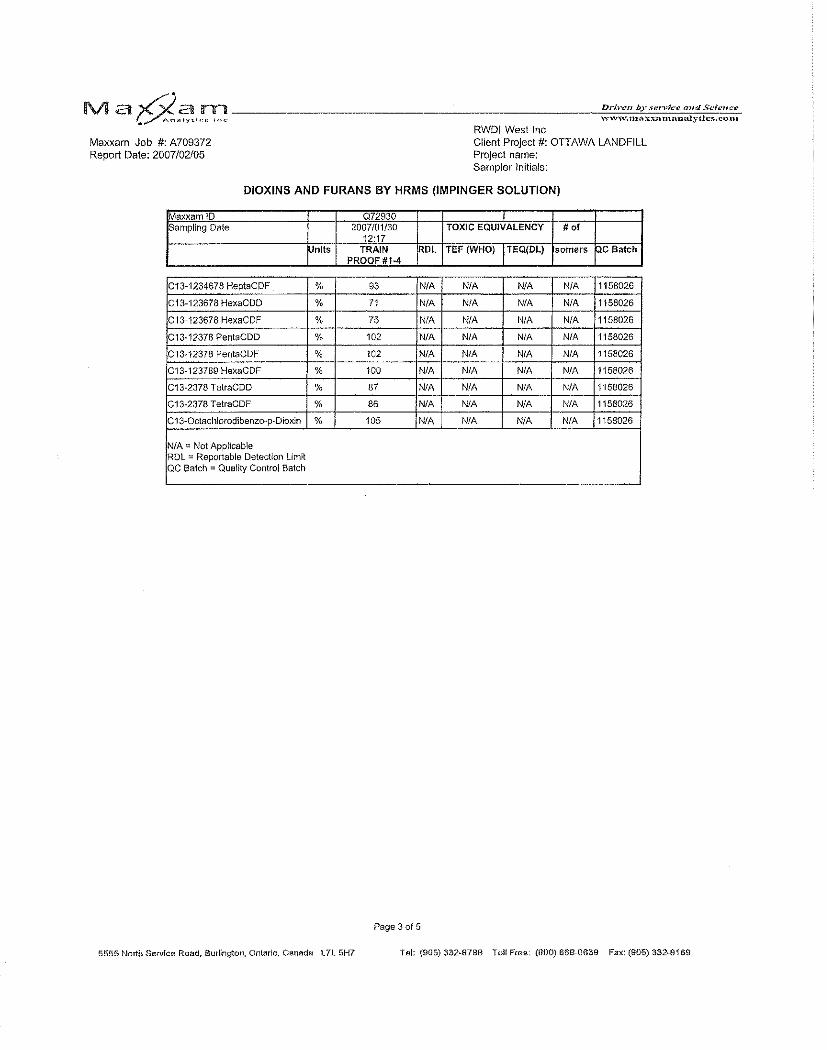
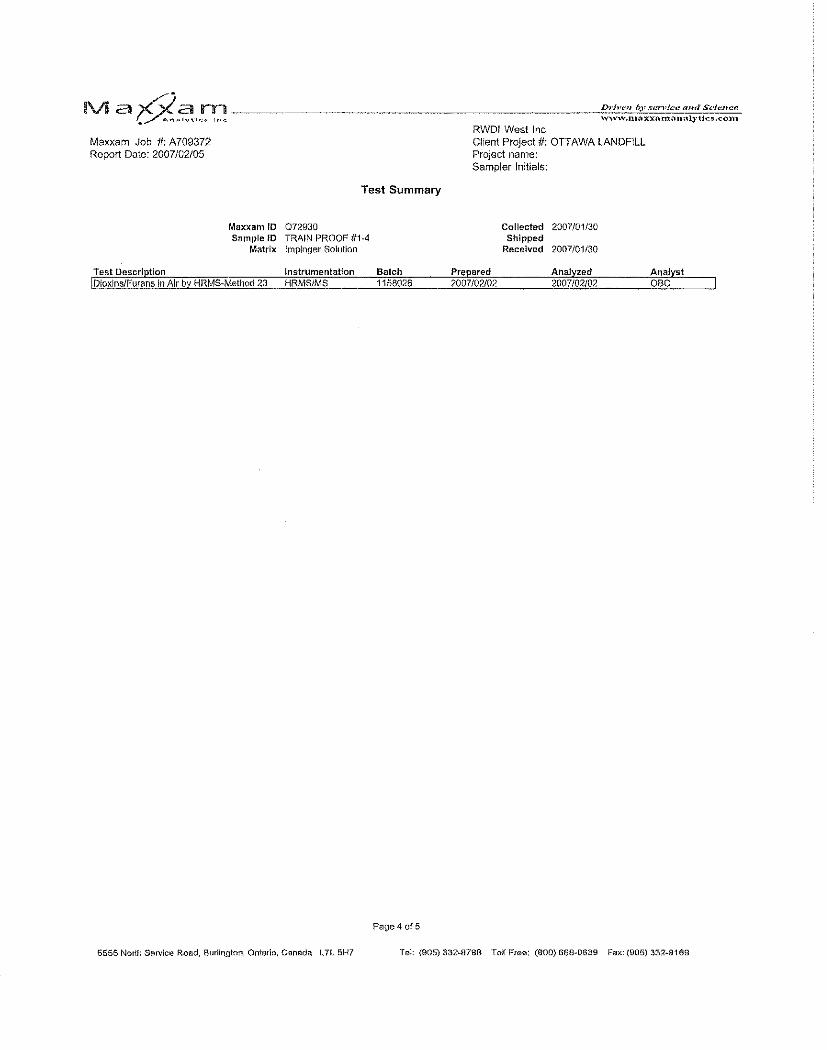
' < ' indicates that the laboratory results were less than the Method Detection Limit (MDL). This MDL was used to calculate the concentration and emission rate.
June 13, 2007 Remi Godin Waste Management of Canada 2301 Carp Road Ottawa, ON K0A 1L0 Re: Results of Stack Testing on the Flare Stack
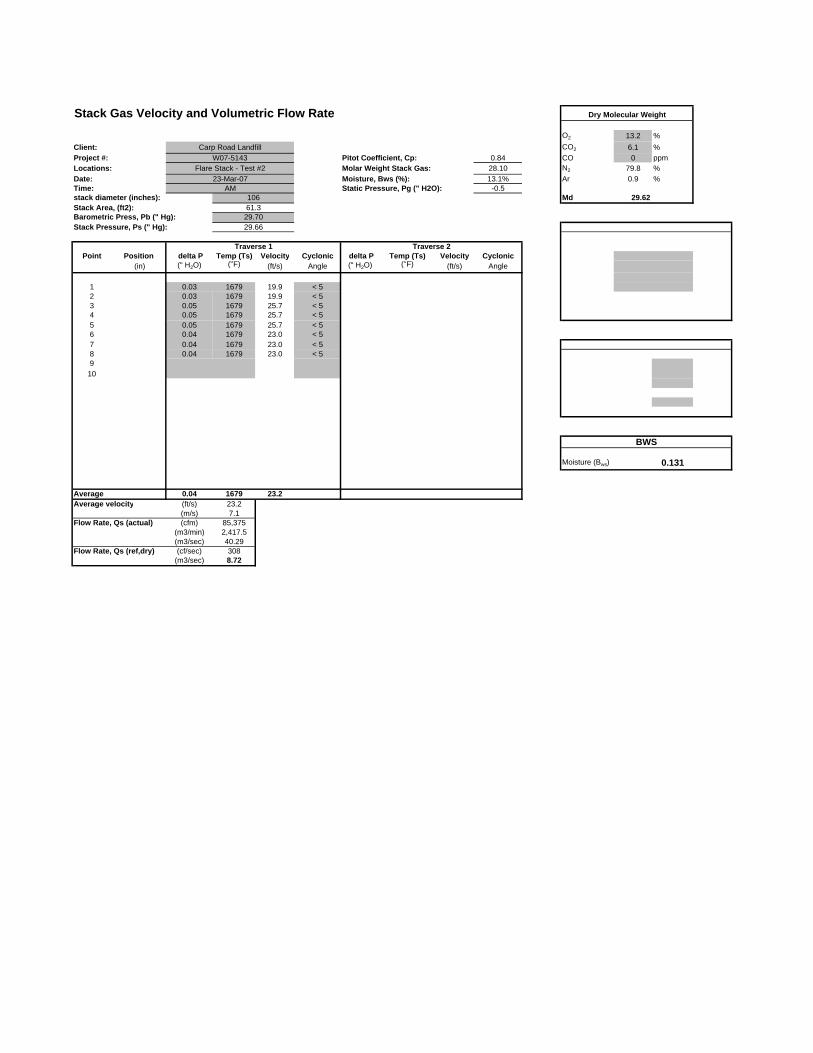
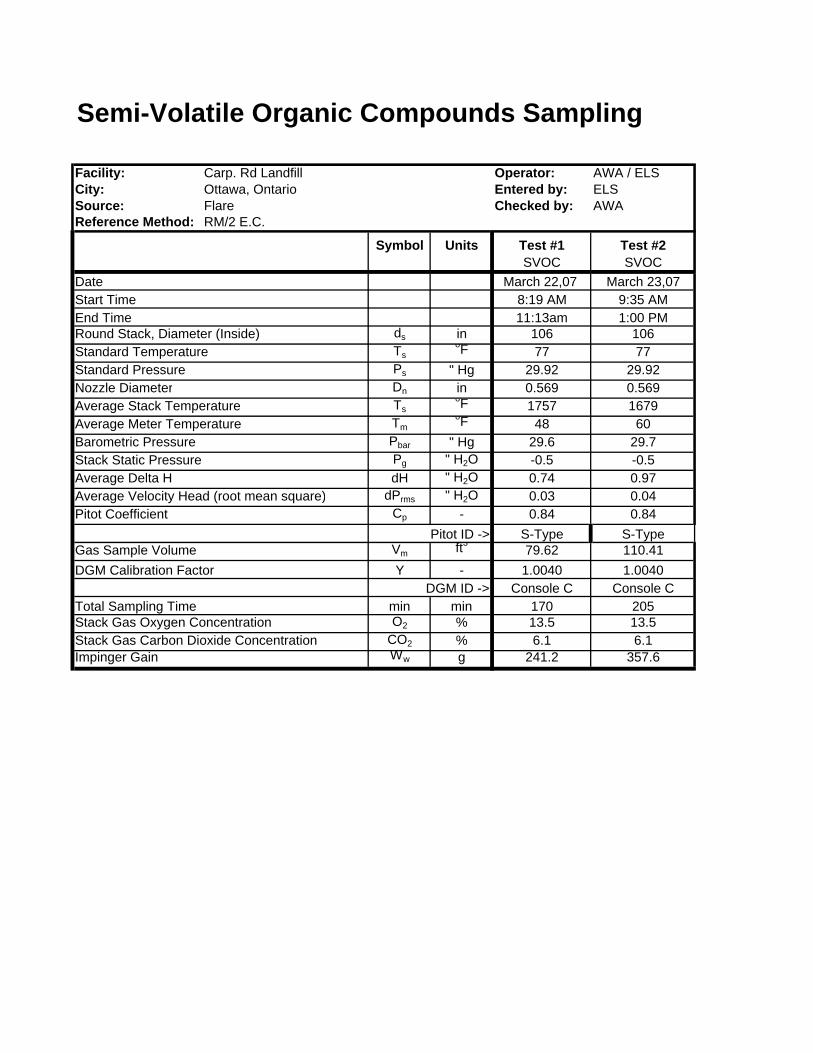
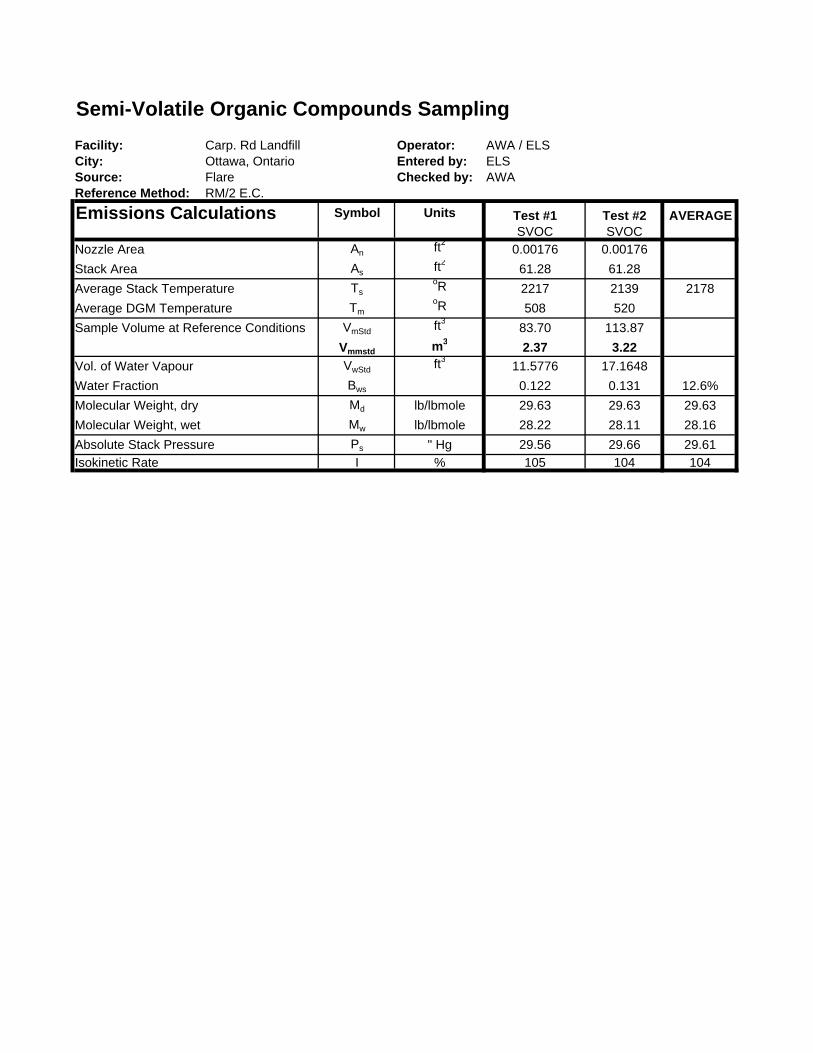
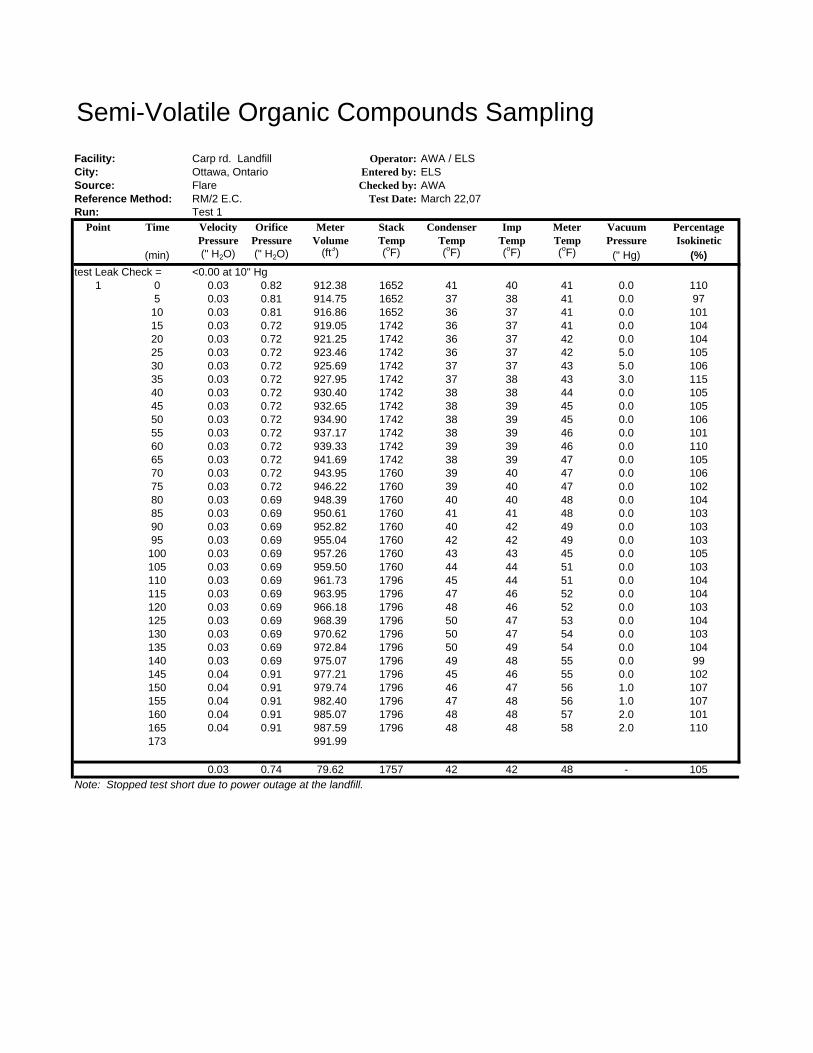
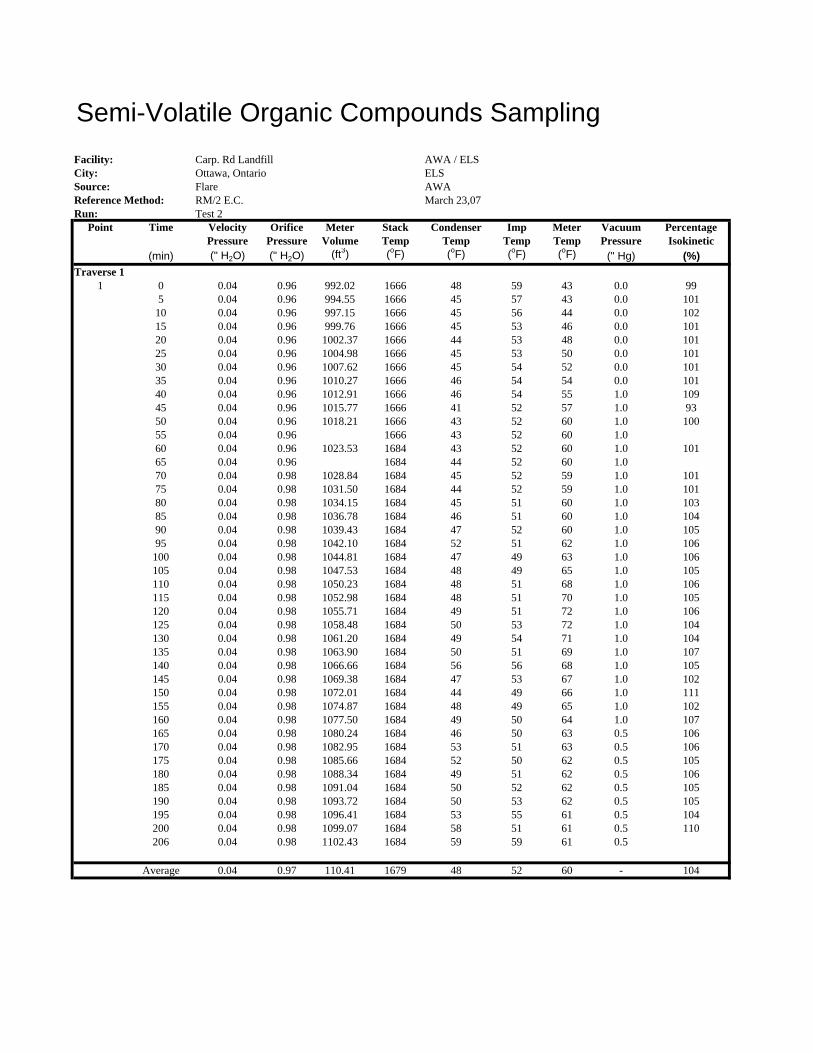
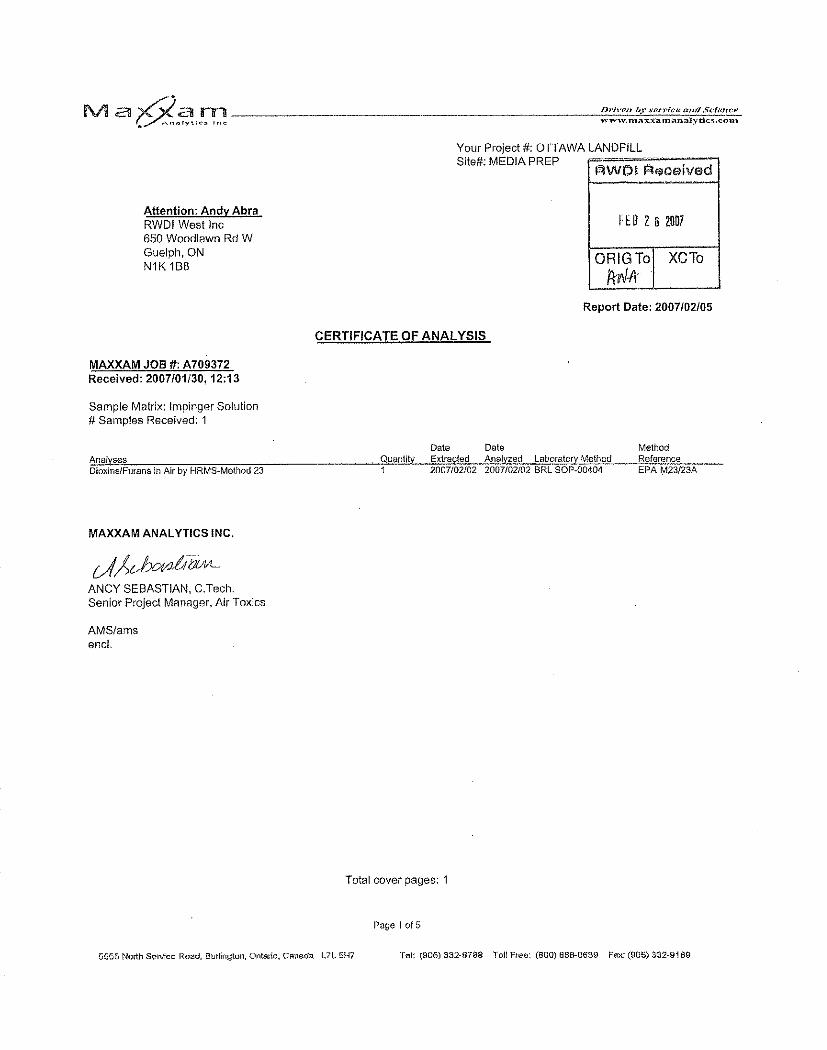
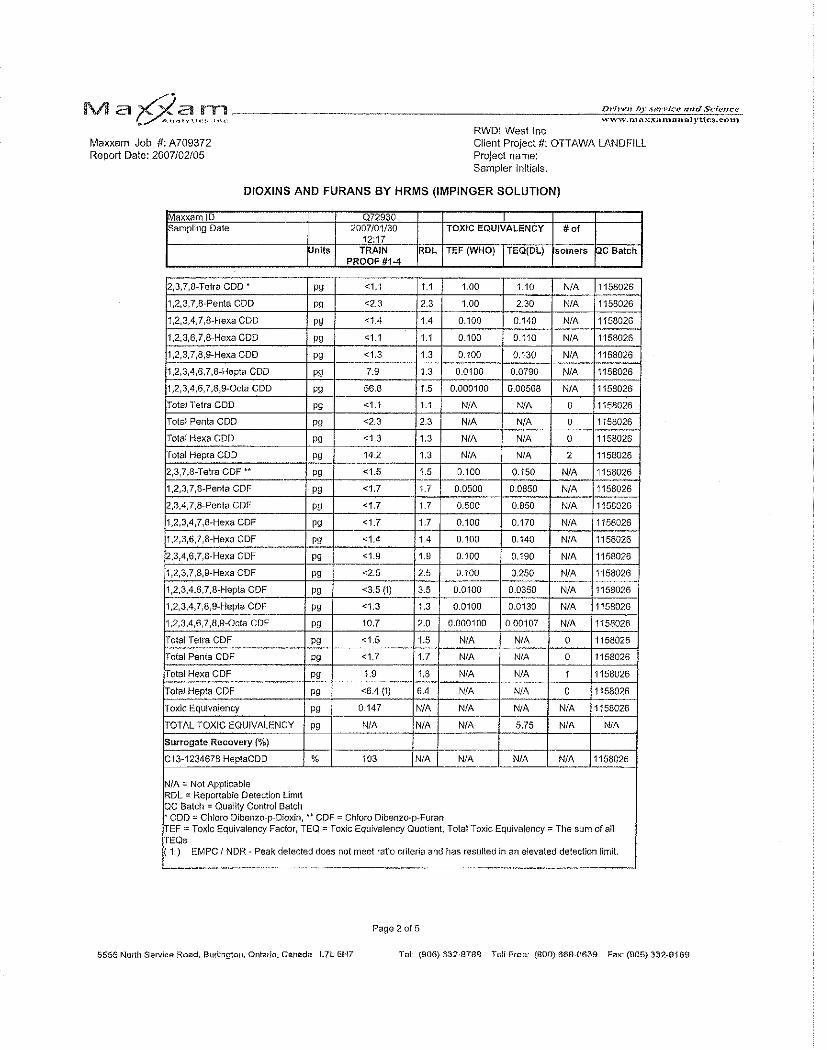
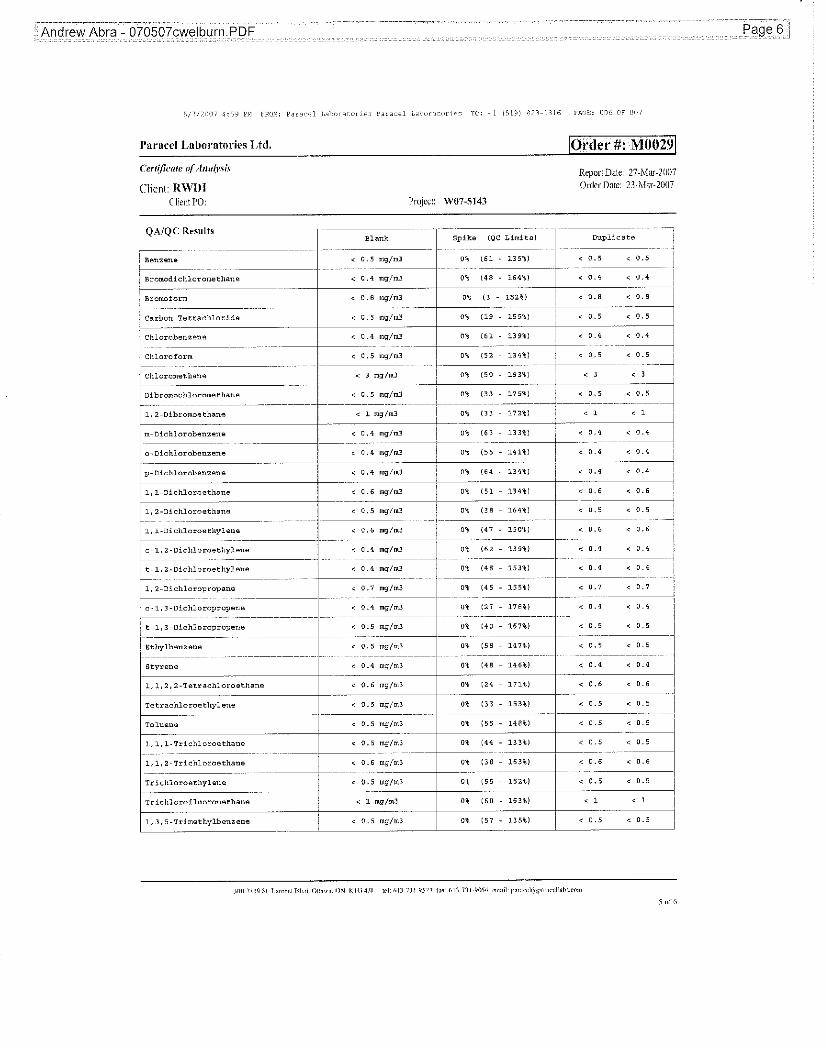
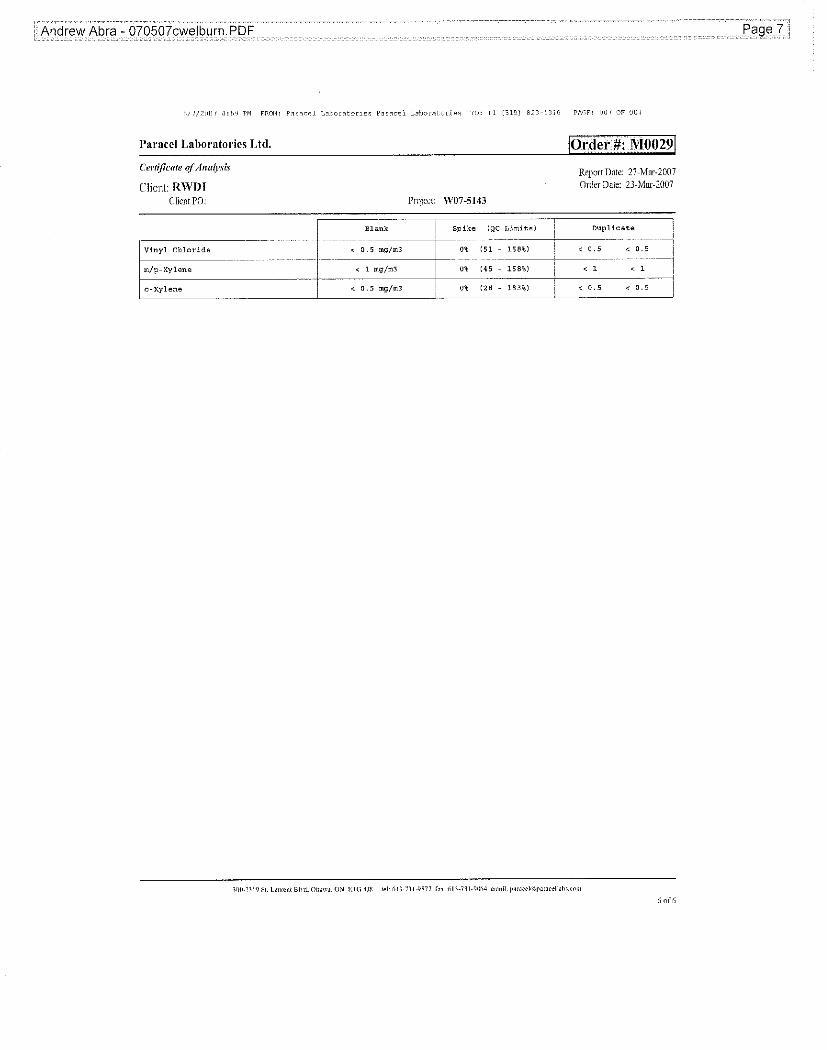
Carp Road Landfill, March Testing Program RWDI Reference No. W07-5143A Email: [email protected] Dear Remi: RWDI AIR Inc. (RWDI) has been retained by Carp Road Landfill to conduct emission sampling of one of their flare stacks at their Landfill located in Kanata, Ontario. The purpose of this testing was to determine the emissions of dioxins and furans, along with volatile organic compounds being emitted from the landfill gas flare stack #2 (F-2). Two tests on the flare stack were conducted on March 22nd, and March 23rd, 2007 while the landfill was operating under typical process conditions. The emissions for the key parameters are provided below, and more detailed results are presented in the appendices. Sampling Location Due to sampling logistics (i.e. safety and scaffolding) only one of the two flare stacks were tested. Also for these reasons only one of the sampling ports on the flare could be accessed. The flare stack was tested for dioxins and furans, volatile organic compounds (VOC), oxygen, carbon dioxide, oxides of nitrogen, and sulphur dioxide. In addition to these parameters, stack gas characteristics including stack gas velocity and volumetric flow rate were determined.
June 13, 2007 Remi Godin Landfill Gas Flare Testing Results Page 2
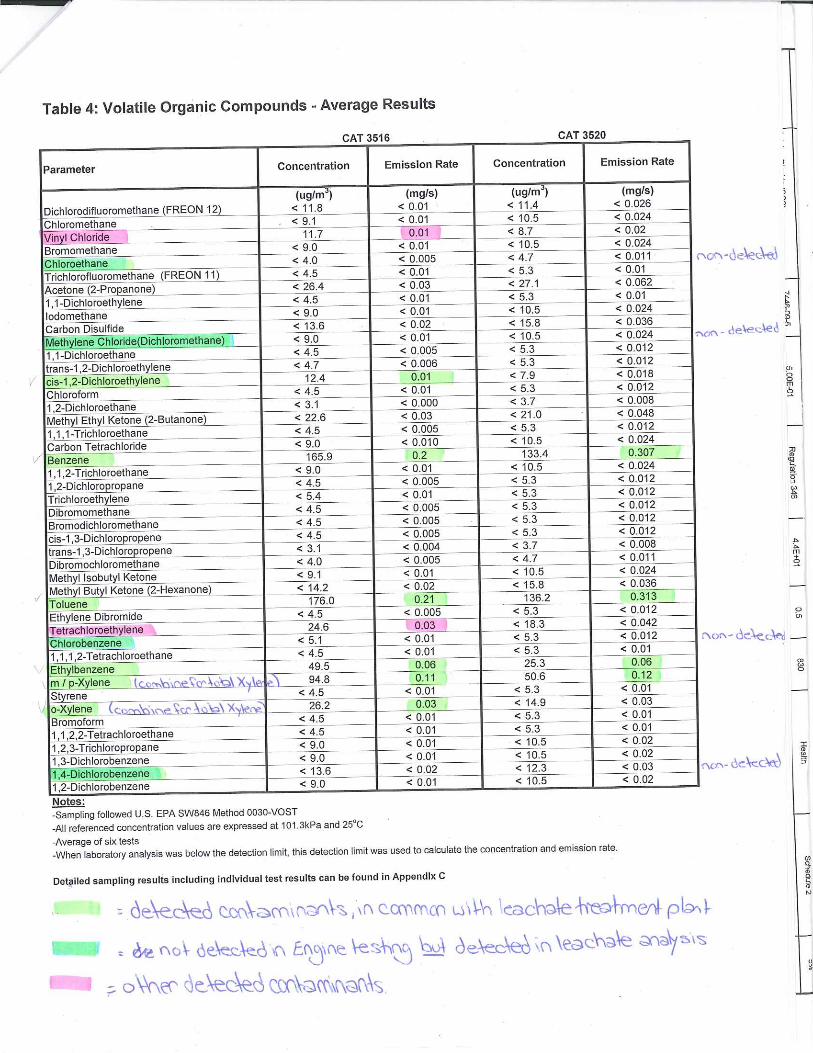
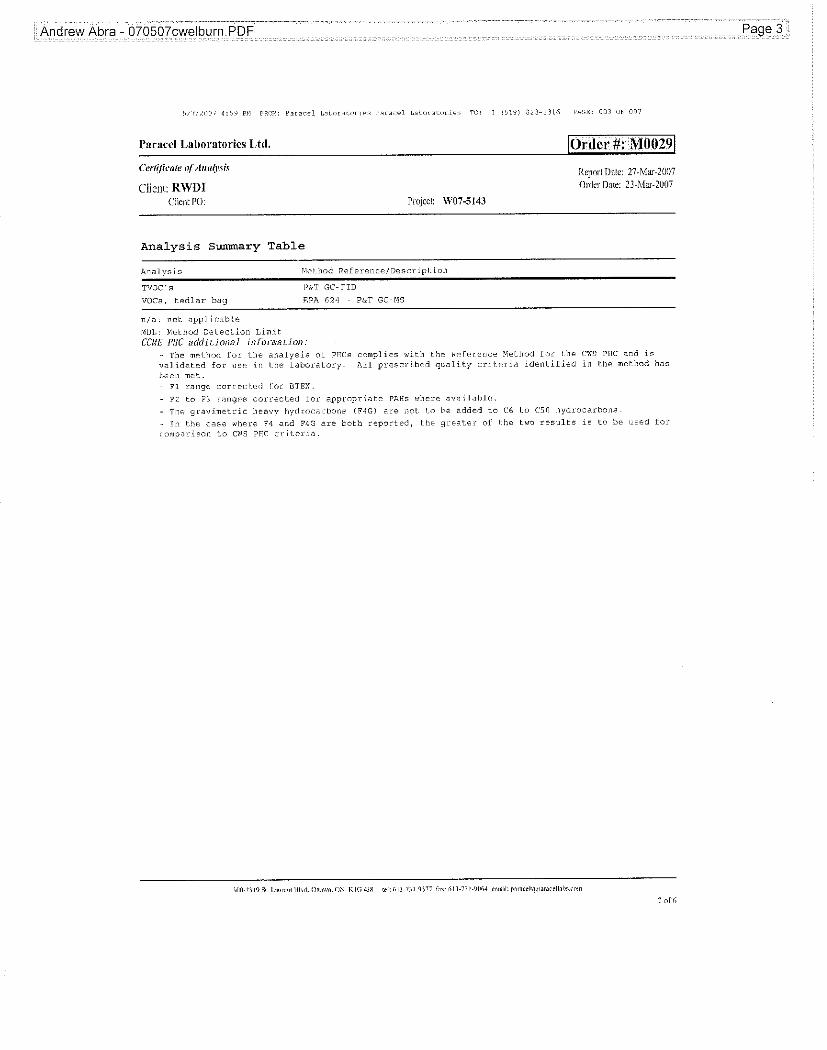
Sampling Methodologies Stack Velocity, Temperature, and Volumetric Flow Rate Determination The exhaust velocities and flow rates were determined following the Ontario Source Testing Code (OSTC) Method 2, “Determination of Stack Gas Velocity and Flow Rate (Type S Pitot Tube)”. Velocity measurements were taken with a pre-calibrated S-Type pitot tube and incline manometer. Volumetric flow rates were determined following the equal area method as outlined in OSTC Method 2. Temperature measurements were made simultaneously with the velocity measurements and were conducted using a chromel-alumel type “k” thermocouple in conjunction with a digital temperature indicator. The diameter of the stack at the sample location was taken from the engineering drawings and C of A documentation and was determined to be 2.7m. The dry molecular weight of the stack gas was determined following calculations outlined in OSTC Method 3, “Determination of Molecular Weight of Dry Stack Gas”. Stack moisture content was determined through direct condensation and according to OSTC Method 4, “Determination of Moisture Content of Stack Gas”. Sampling Dioxin and Furan Isomers Sampling for dioxins and furans (PCDD/F) was performed in accordance with Environment Canada’s method RM/2, “Reference Method for Source Testing of Releases of Selected Semi-Volatile Organic Compounds from Stationary Sources”. Triplicate sampling runs were conducted. Due to the safety conditions regarding the high temperature and sampling infrastructure, sampling was conducted isokinetically at a single point. The sample was drawn through a glass lined sample probe and proofed glass fibre filter. Both of these were maintained at a temperature of 120 ± 14°C (248 ± 25°F). The sample then passed through a water cooled condenser and an XAD-2 absorbent module. The temperature of the XAD-2 module was kept below 20°C. The stack gas sample was then introduced into the impinger train. The impinger train was configured as specified in the reference method. Upon completion of the test, the samples were kept cool and delivered to Maxxam Analytical Services in Burlington, Ontario. The filter, XAD-2 module, impinger catch, and all rinses were analysed for the target compounds using high resolution mass spectrometry. Sampling for Volatile Organic Compounds Sampling for volatile organic compounds (VOC) was conducted by collecting the stack gas sample in a Tedlar Bag. The sample was then transported the same day to the laboratory and was analysed for VOC’s. Paracel Laboratory’s Ltd. Located in Ottawa, Ontario, conducted laboratory analysis.
June 13, 2007 Remi Godin Landfill Gas Flare Testing Results Page 3
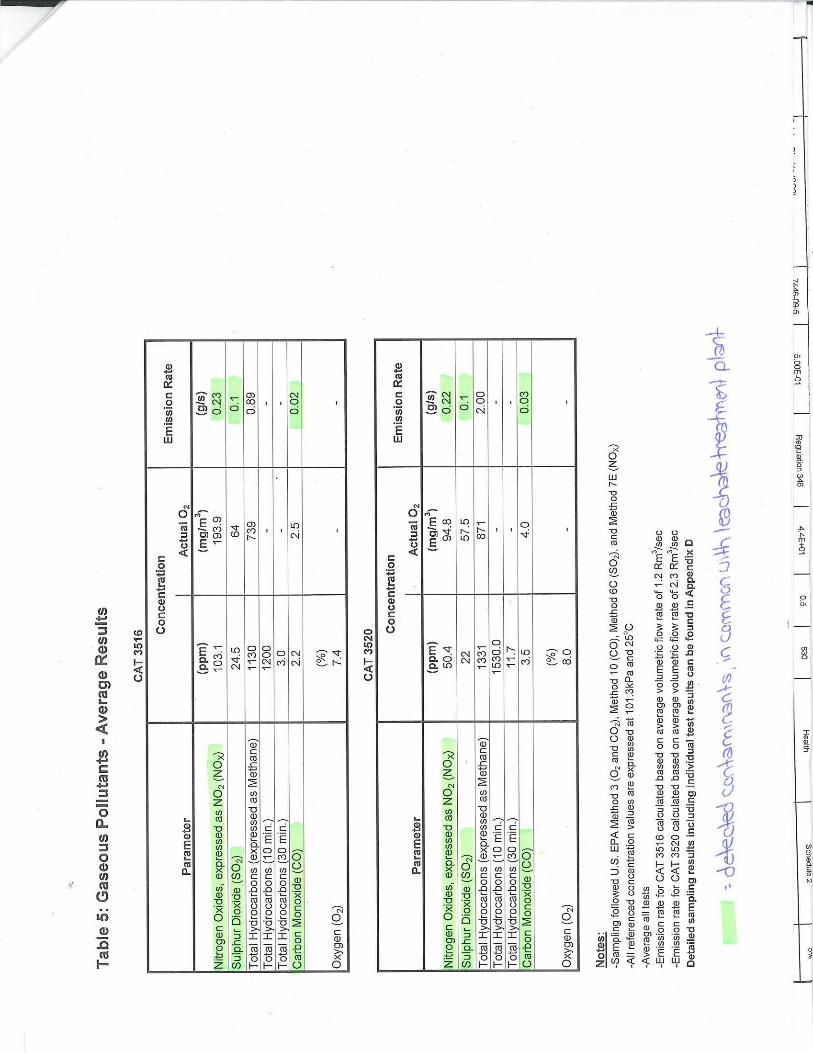
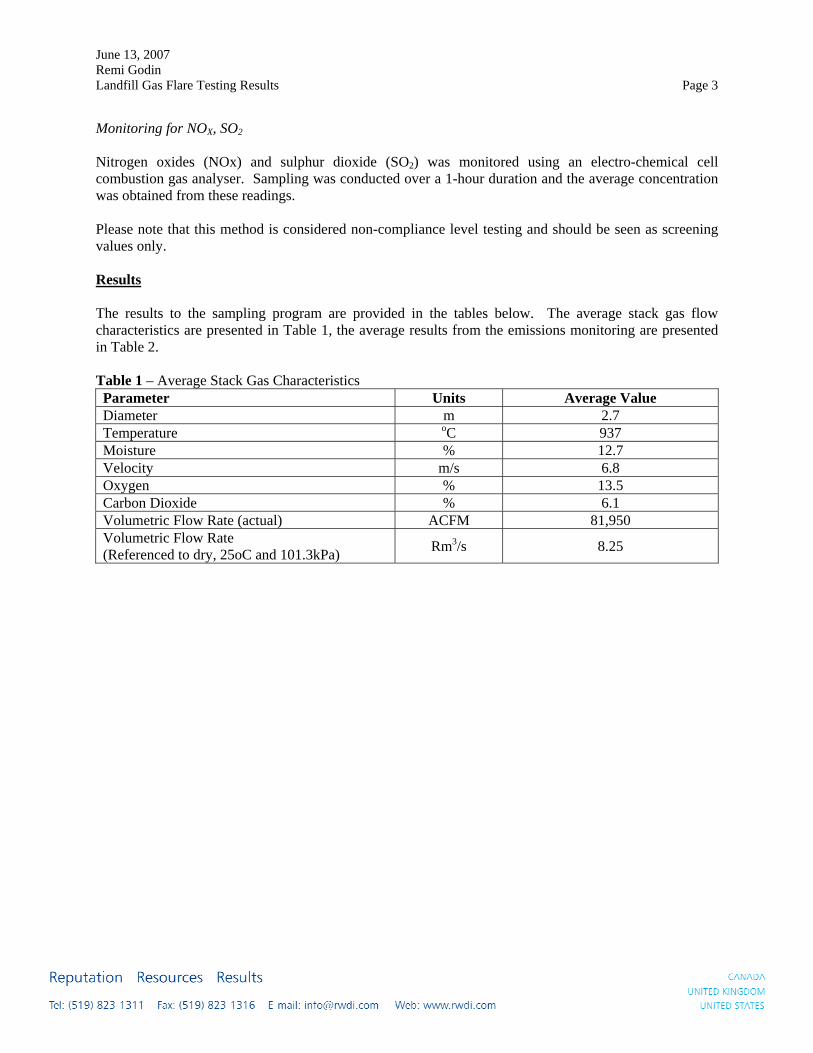
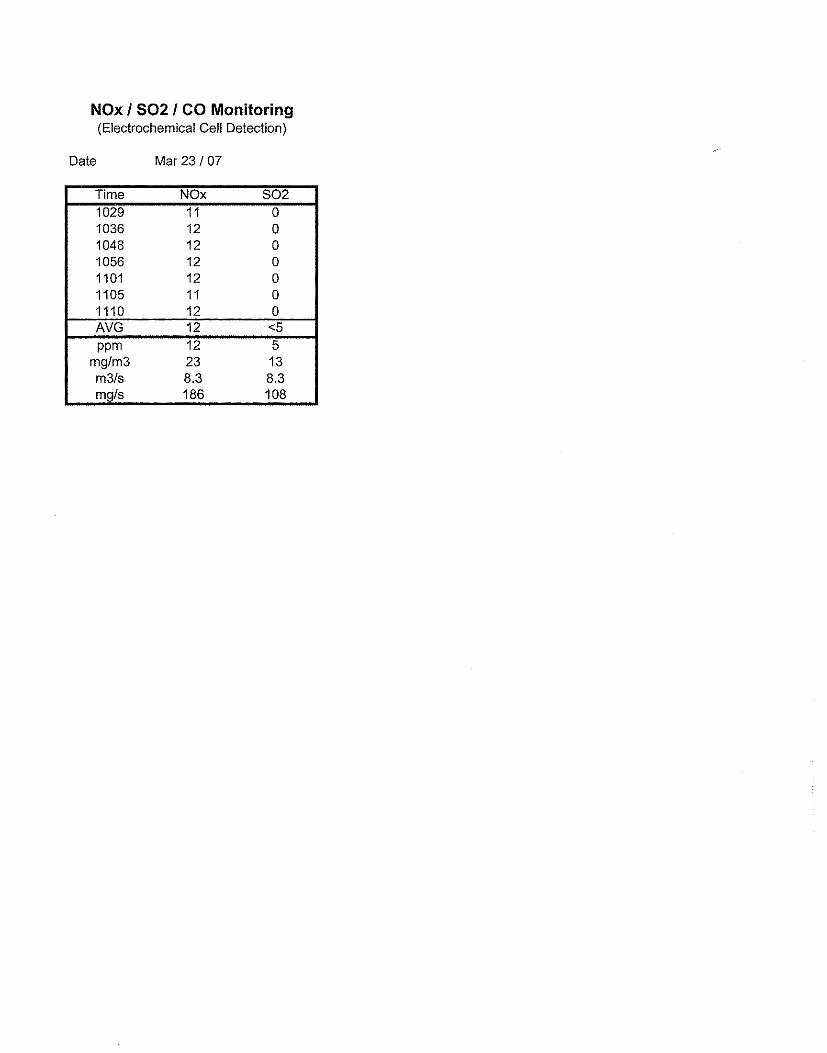
Monitoring for NOX, SO2 Nitrogen oxides (NOx) and sulphur dioxide (SO2) was monitored using an electro-chemical cell combustion gas analyser. Sampling was conducted over a 1-hour duration and the average concentration was obtained from these readings. Please note that this method is considered non-compliance level testing and should be seen as screening values only. Results The results to the sampling program are provided in the tables below. The average stack gas flow characteristics are presented in Table 1, the average results from the emissions monitoring are presented in Table 2. Table 1 – Average Stack Gas Characteristics Parameter Units Average Value Diameter m 2.7 Temperature oC 937 Moisture % 12.7 Velocity m/s 6.8 Oxygen % 13.5 Carbon Dioxide % 6.1 Volumetric Flow Rate (actual) ACFM 81,950 Volumetric Flow Rate (Referenced to dry, 25oC and 101.3kPa) Rm3/s 8.25
June 13, 2007 Remi Godin Landfill Gas Flare Testing Results Page 4
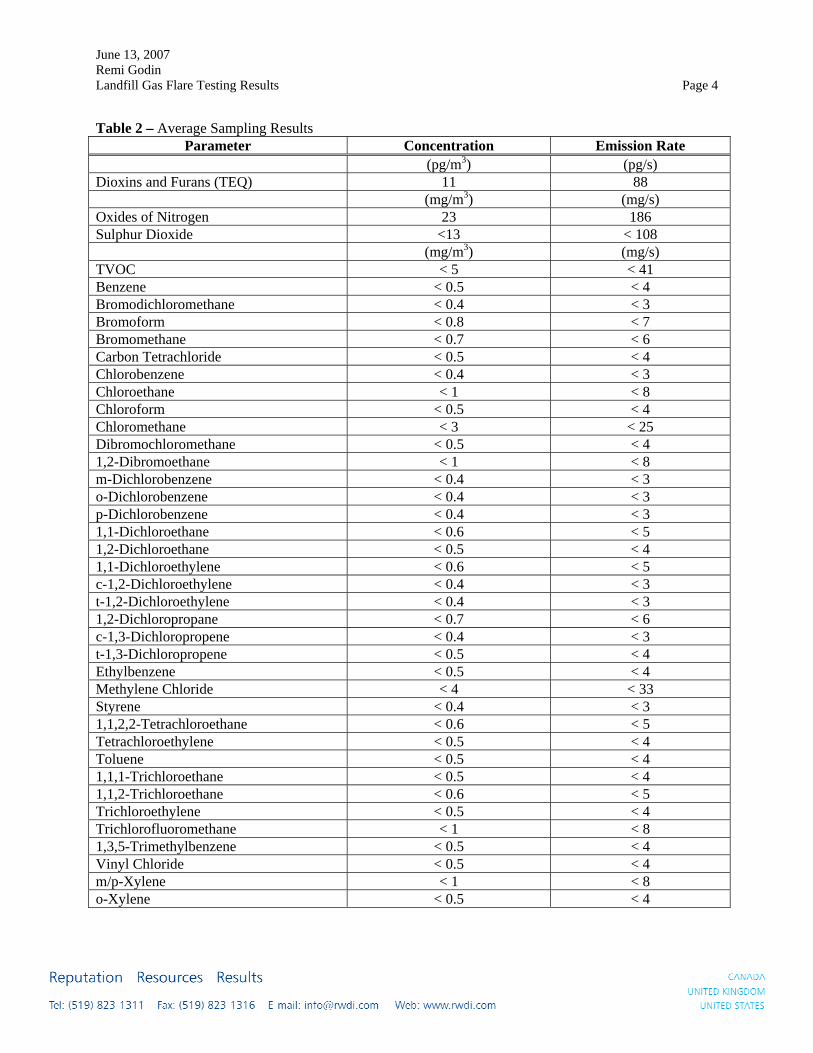
Table 2 – Average Sampling Results Parameter Concentration Emission Rate
June 13, 2007 Remi Godin Landfill Gas Flare Testing Results Page 5
As expected, the landfill gas flare (F-2) showed no significant levels of emissions for the parameters tested. The majority of the PCDD/F and VOC parameters were below the laboratory’s method detection limit. Detailed results from the testing are presented in the appendices. Appendix A includes the laboratory results, and Appendix B contains the detailed calculations from the testing. If you have any questions regarding these results, please do not hesitate to contact us. Yours very truly, RWDI AIR Inc.
Notes:[1] Sample volume and volumetric flow rate based on dry referenced conditions (101.3kPa, and 25o C)' < ' indicates that the laboratory results were less than the Method Detection Limit (MDL). This MDL was used to calculate the concentration and emission rate.
(pg)
Test No. 2
M23-Flare-T2
3.22
8.7
(pg)
Test No. 1
M23-Flare-T1
2.37
7.79
Total Toxicity Equivalency (TEQ)
Lab Data Lab DataAVERAGE
Volatile Organic Compounds
MDLmg/m
3
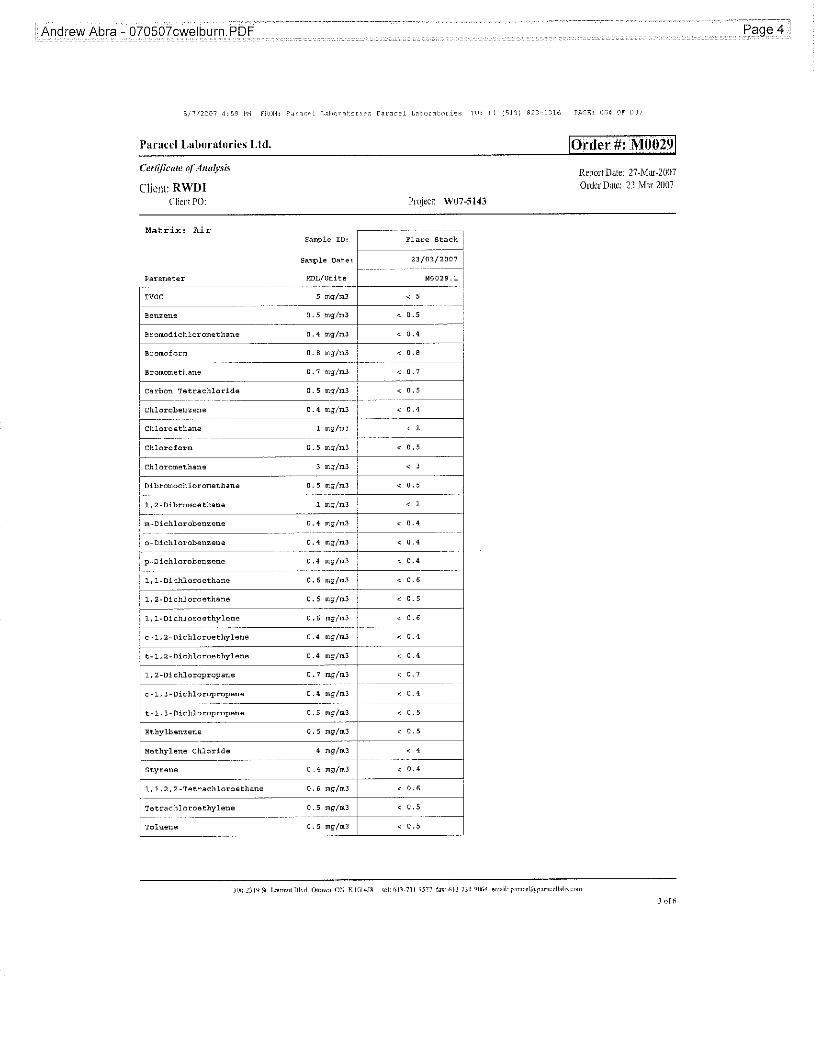
TVOC 5 < 5 < 41
Benzene 0.5 < 0.5 < 4
Bromodichloromethane 0.4 < 0.4 < 3
Bromoform 0.8 < 0.8 < 7
Bromomethane 0.7 < 0.7 < 6
Carbon Tetrachloride 0.5 < 0.5 < 4
Chlorobenzene 0.4 < 0.4 < 3
Chloroethane 1 < 1 < 8
Chloroform 0.5 < 0.5 < 4
Chloromethane 3 < 3 < 25
Dibromochloromethane 0.5 < 0.5 < 4
1,2-Dibromoethane 1 < 1 < 8
m-Dichlorobenzene 0.4 < 0.4 < 3
o-Dichlorobenzene 0.4 < 0.4 < 3
p-Dichlorobenzene 0.4 < 0.4 < 3
1,1-Dichloroethane 0.6 < 0.6 < 5
1,2-Dichloroethane 0.5 < 0.5 < 4
1,1-Dichloroethylene 0.6 < 0.6 < 5
c-1,2-Dichloroethylene 0.4 < 0.4 < 3
t-1,2-Dichloroethylene 0.4 < 0.4 < 3
1,2-Dichloropropane 0.7 < 0.7 < 6
c-1,3-Dichloropropene 0.4 < 0.4 < 3
t-1,3-Dichloropropene 0.5 < 0.5 < 4
Ethylbenzene 0.5 < 0.5 < 4
Methylene Chloride 4 < 4 < 33
Styrene 0.4 < 0.4 < 3
1,1,2,2-Tetrachloroethane 0.6 < 0.6 < 5
Tetrachloroethylene 0.5 < 0.5 < 4
Toluene 0.5 < 0.5 < 4
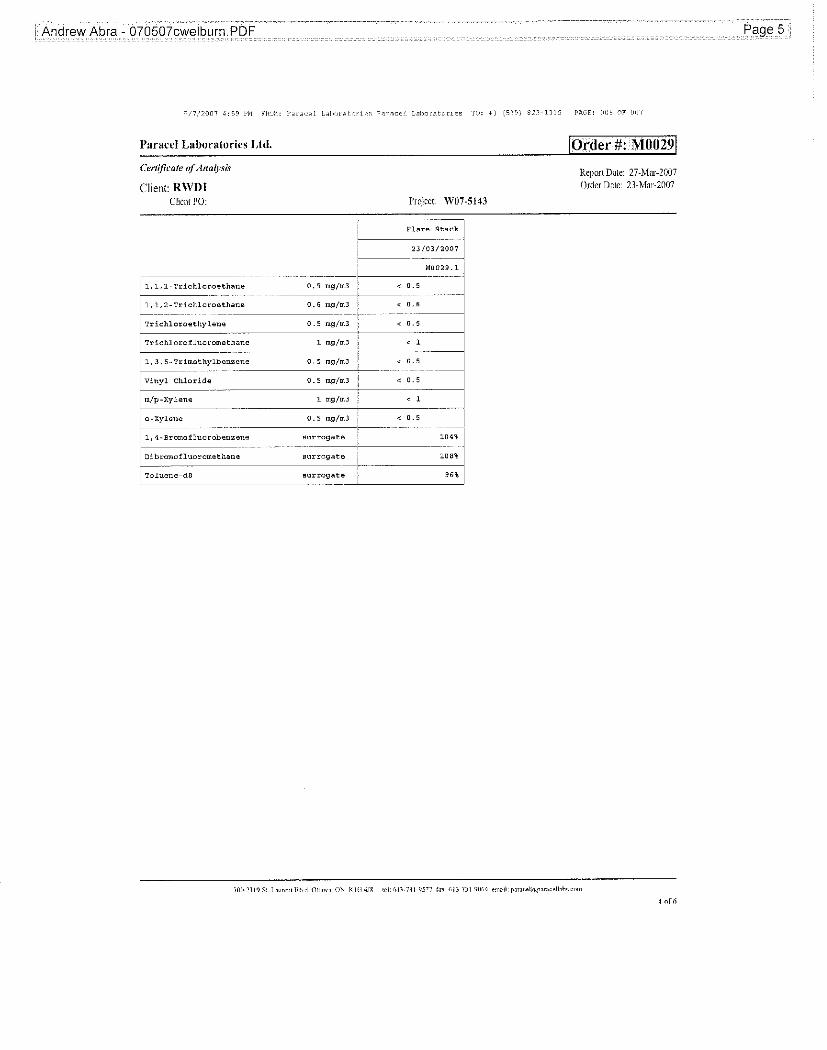
1,1,1-Trichloroethane 0.5 < 0.5 < 4
1,1,2-Trichloroethane 0.6 < 0.6 < 5
Trichloroethylene 0.5 < 0.5 < 4
Trichlorofluoromethane 1 < 1 < 8
1,3,5-Trimethylbenzene 0.5 < 0.5 < 4
Vinyl Chloride 0.5 < 0.5 < 4
m/p-Xylene 1 < 1 < 8o-Xylene 0.5 < 0.5 < 4
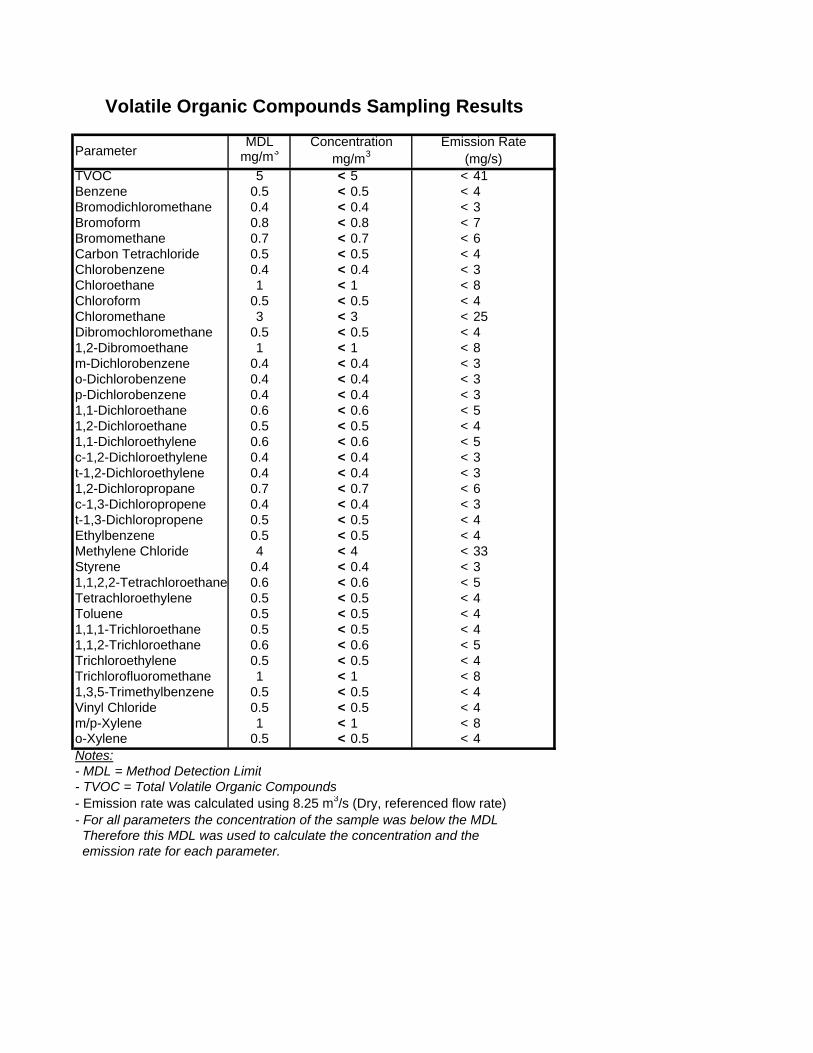
Notes:- MDL = Method Detection Limit- TVOC = Total Volatile Organic Compounds- Emission rate was calculated using 8.25 m
3/s (Dry, referenced flow rate)
- For all parameters the concentration of the sample was below the MDL Therefore this MDL was used to calculate the concentration and the emission rate for each parameter.
[1] Source ID, Source Type: should provide information on the modelling source type (e.g., Point, Area or Volume Source); the process source or sources within the modelling source (e.g., Process Line #1); and the stack or stacks within each process source.
[2] Emission Estimating Technique Short-Forms are V-ST (Validated Source Test), “ST” (Source Test), EF (Emission Factor), MB (Mass Balance), and EC (Engineering Calculation).
[3] Data Quality Categories: Highest; Above-Average; Average; and Marginal.
Sample CalculationsRAWLEACH In-Stack Concentration (1,2 Dichloroethane in mg/m3) = 1.64E-05 g s 1000 mg
s 0.0001 m3 1 g
RAWLEACH In-Stack Concentration (1,2 Dichloroethane in mg/m3) = 164
RAWLEACH In-Stack Allowable Concentration (1,2 Dichloroethane in OU/m3) = 6.75
RAWLEACH In-Stack Allowable Concentration (1,2 Dichloroethane in OU/s) = 6.75 OU 0.0001 m3
m3 s
RAWLEACH In-Stack Allowable Concentration (1,2 Dichloroethane in OU/s) = 6.75E-04
Total Odour Emission Rate for a source (OU/s) = Ʃ(Contaminants Maximum Odour Emission Rates for 1 source
50147084243406.6 0.60.2 0.003 809SLUDGE Point Sludge Tank 0.0001 25
Page 3 of 3
Employee Job Title
APPENDIX I
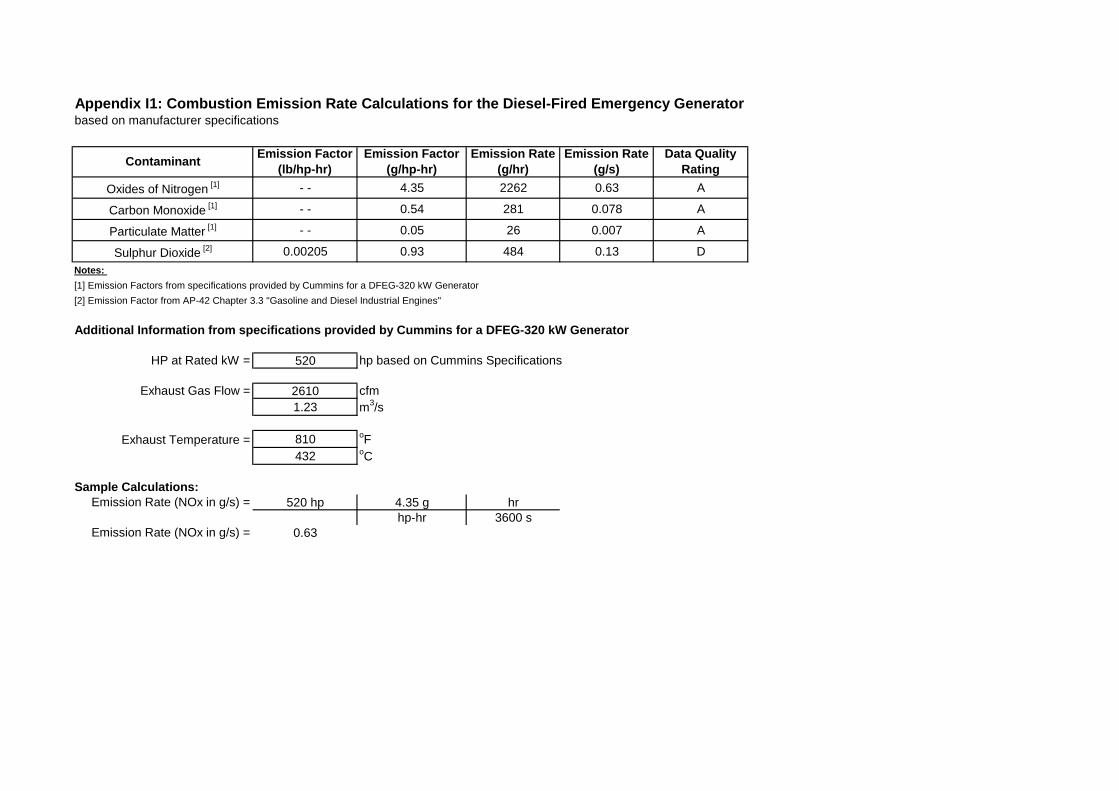
Appendix I1: Combustion Emission Rate Calculations for the Diesel-Fired Emergency Generatorbased on manufacturer specifications
Oxides of Nitrogen [1] - - 4.35 2262 0.63 A
Carbon Monoxide [1] - - 0.54 281 0.078 A
Particulate Matter [1] - - 0.05 26 0.007 A
Sulphur Dioxide [2] 0.00205 0.93 484 0.13 D
Notes:
[1] Emission Factors from specifications provided by Cummins for a DFEG-320 kW Generator
[2] Emission Factor from AP-42 Chapter 3.3 "Gasoline and Diesel Industrial Engines"
Additional Information from specifications provided by Cummins for a DFEG-320 kW Generator
HP at Rated kW = 520 hp based on Cummins Specifications
Exhaust Gas Flow = 2610 cfm
1.23 m3/s
Exhaust Temperature = 810oF
432oC
Sample Calculations:
Emission Rate (NOx in g/s) = 520 hp 4.35 g hr
hp-hr 3600 s
Emission Rate (NOx in g/s) = 0.63
Emission Rate
(g/s)
Data Quality
RatingContaminant
Emission Factor
(g/hp-hr)
Emission Rate
(g/hr)
Emission Factor
(lb/hp-hr)
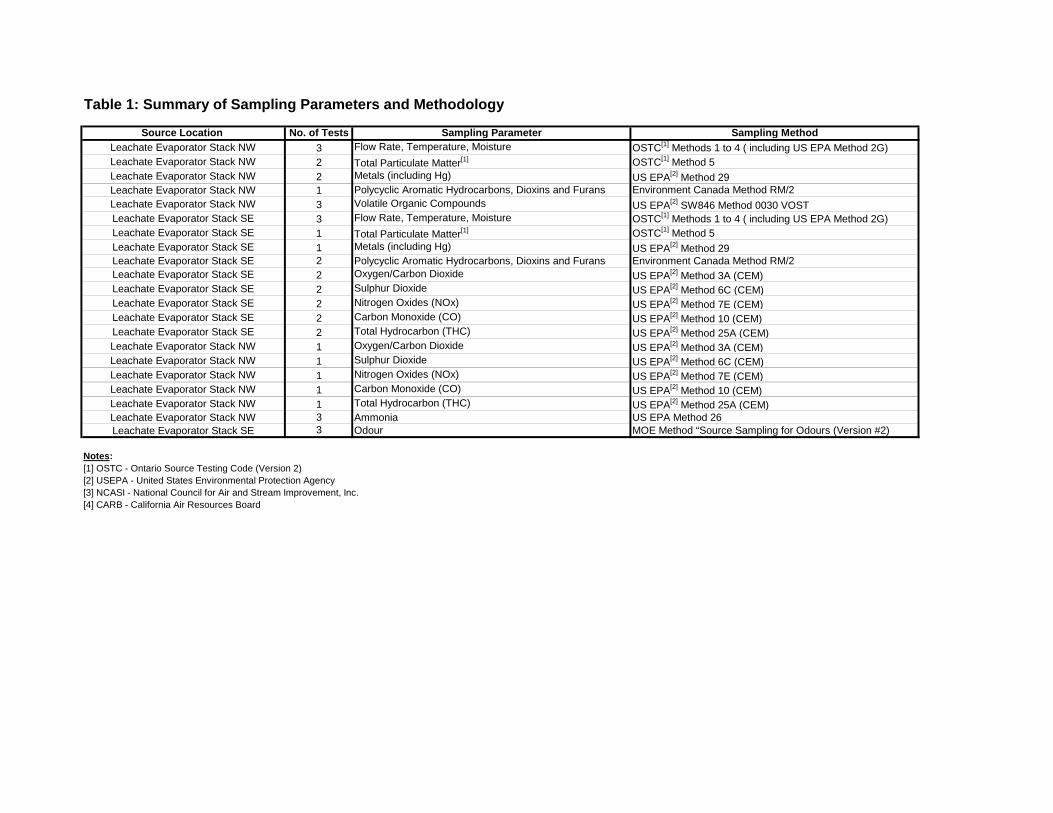
Table 1: Summary of Sampling Parameters and Methodology
Source Location No. of Tests Sampling Parameter Sampling MethodLeachate Evaporator Stack NW 3 Flow Rate, Temperature, Moisture OSTC[1] Methods 1 to 4 ( including US EPA Method 2G)Leachate Evaporator Stack NW 2 Total Particulate Matter[1] OSTC[1] Method 5Leachate Evaporator Stack NW 2 Metals (including Hg) US EPA[2] Method 29Leachate Evaporator Stack NW 1 Polycyclic Aromatic Hydrocarbons, Dioxins and Furans Environment Canada Method RM/2Leachate Evaporator Stack NW 3 Volatile Organic Compounds US EPA[2] SW846 Method 0030 VOSTLeachate Evaporator Stack SE 3 Flow Rate, Temperature, Moisture OSTC[1] Methods 1 to 4 ( including US EPA Method 2G)Leachate Evaporator Stack SE 1 Total Particulate Matter[1] OSTC[1] Method 5Leachate Evaporator Stack SE 1 Metals (including Hg) US EPA[2] Method 29Leachate Evaporator Stack SE 2 Polycyclic Aromatic Hydrocarbons, Dioxins and Furans Environment Canada Method RM/2Leachate Evaporator Stack SE 2 Oxygen/Carbon Dioxide US EPA[2] Method 3A (CEM)Leachate Evaporator Stack SE 2 Sulphur Dioxide US EPA[2] Method 6C (CEM)Leachate Evaporator Stack SE 2 Nitrogen Oxides (NOx) US EPA[2] Method 7E (CEM)Leachate Evaporator Stack SE 2 Carbon Monoxide (CO) US EPA[2] Method 10 (CEM)Leachate Evaporator Stack SE 2 Total Hydrocarbon (THC) US EPA[2] Method 25A (CEM)Leachate Evaporator Stack NW 1 Oxygen/Carbon Dioxide US EPA[2] Method 3A (CEM)Leachate Evaporator Stack NW 1 Sulphur Dioxide US EPA[2] Method 6C (CEM)Leachate Evaporator Stack NW 1 Nitrogen Oxides (NOx) US EPA[2] Method 7E (CEM)Leachate Evaporator Stack NW 1 Carbon Monoxide (CO) US EPA[2] Method 10 (CEM)Leachate Evaporator Stack NW 1 Total Hydrocarbon (THC) US EPA[2] Method 25A (CEM)Leachate Evaporator Stack NW 3 Ammonia US EPA Method 26Leachate Evaporator Stack SE 3 Odour MOE Method “Source Sampling for Odours (Version #2)
Notes:[1] OSTC - Ontario Source Testing Code (Version 2)[2] USEPA - United States Environmental Protection Agency[3] NCASI - National Council for Air and Stream Improvement, Inc.[4] CARB - California Air Resources Board
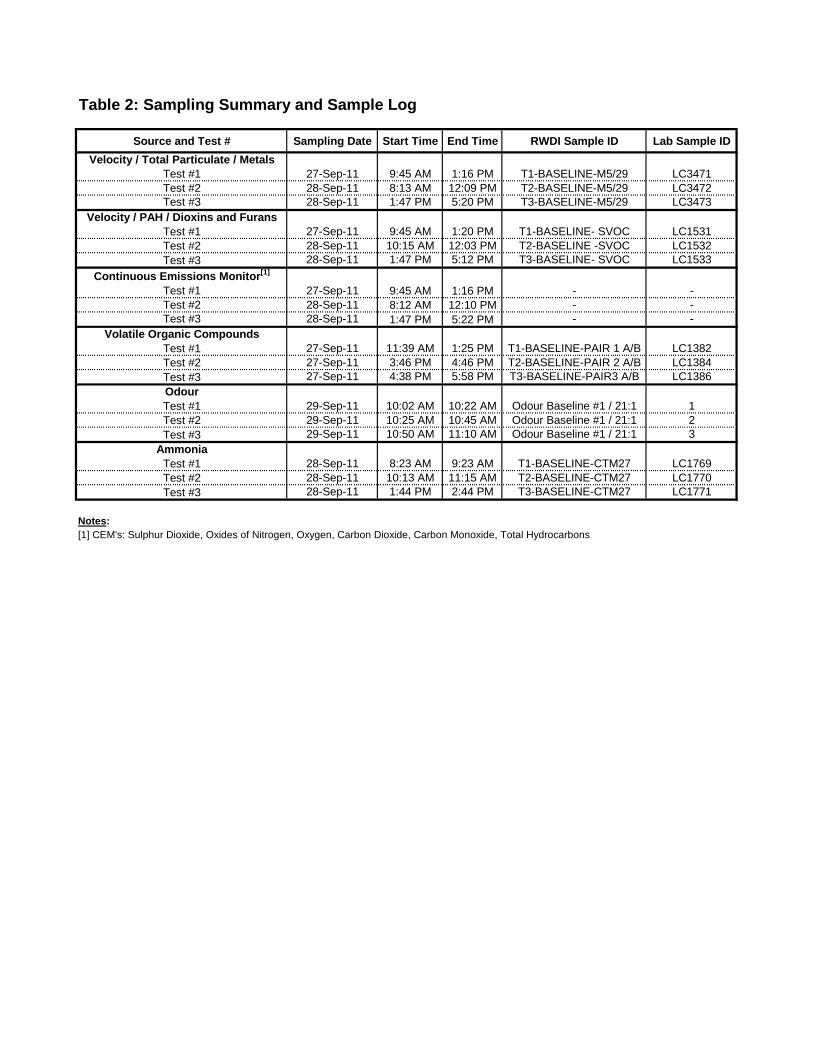
Table 2: Sampling Summary and Sample Log
Source and Test # Sampling Date Start Time End Time RWDI Sample ID Lab Sample ID
Velocity / Total Particulate / MetalsTest #1 27-Sep-11 9:45 AM 1:16 PM T1-BASELINE-M5/29 LC3471Test #2 28-Sep-11 8:13 AM 12:09 PM T2-BASELINE-M5/29 LC3472Test #3 28-Sep-11 1:47 PM 5:20 PM T3-BASELINE-M5/29 LC3473
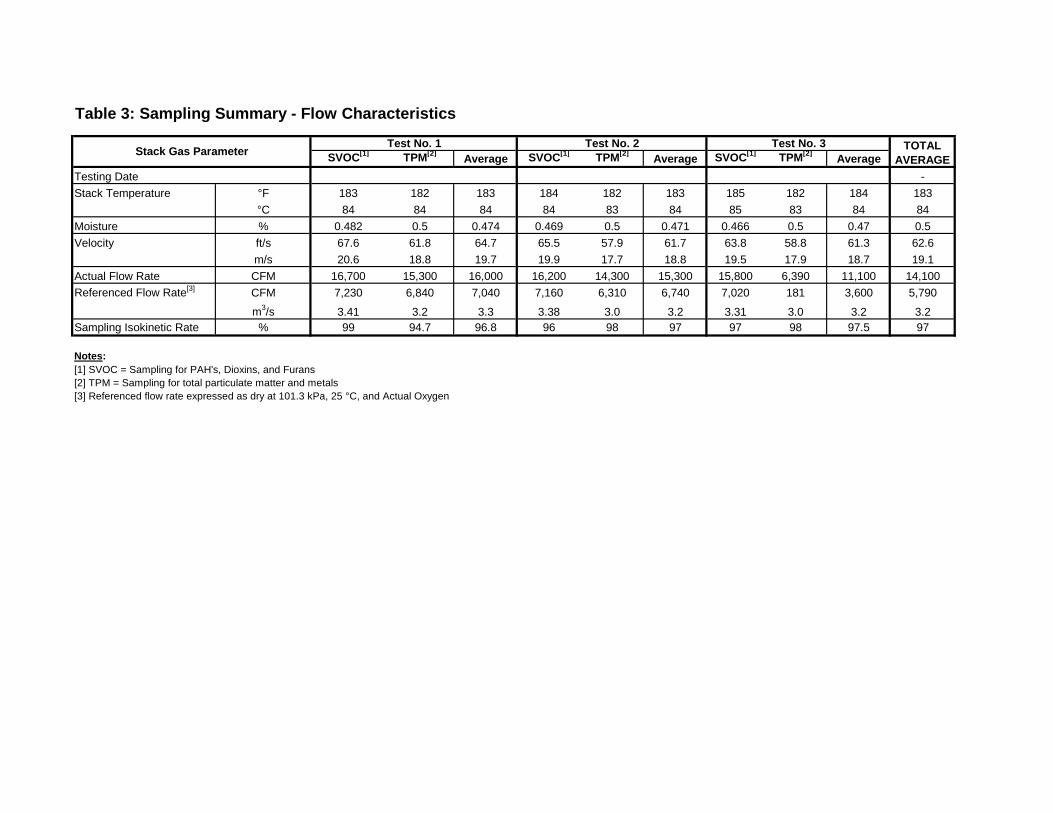
Notes:[1] SVOC = Sampling for PAH's, Dioxins, and Furans[2] TPM = Sampling for total particulate matter and metals[3] Referenced flow rate expressed as dry at 101.3 kPa, 25 °C, and Actual Oxygen
Test No. 3 TOTALAVERAGE
Testing Date
Stack Gas ParameterTest No. 1 Test No. 2
Employee Job Title
APPENDIX J
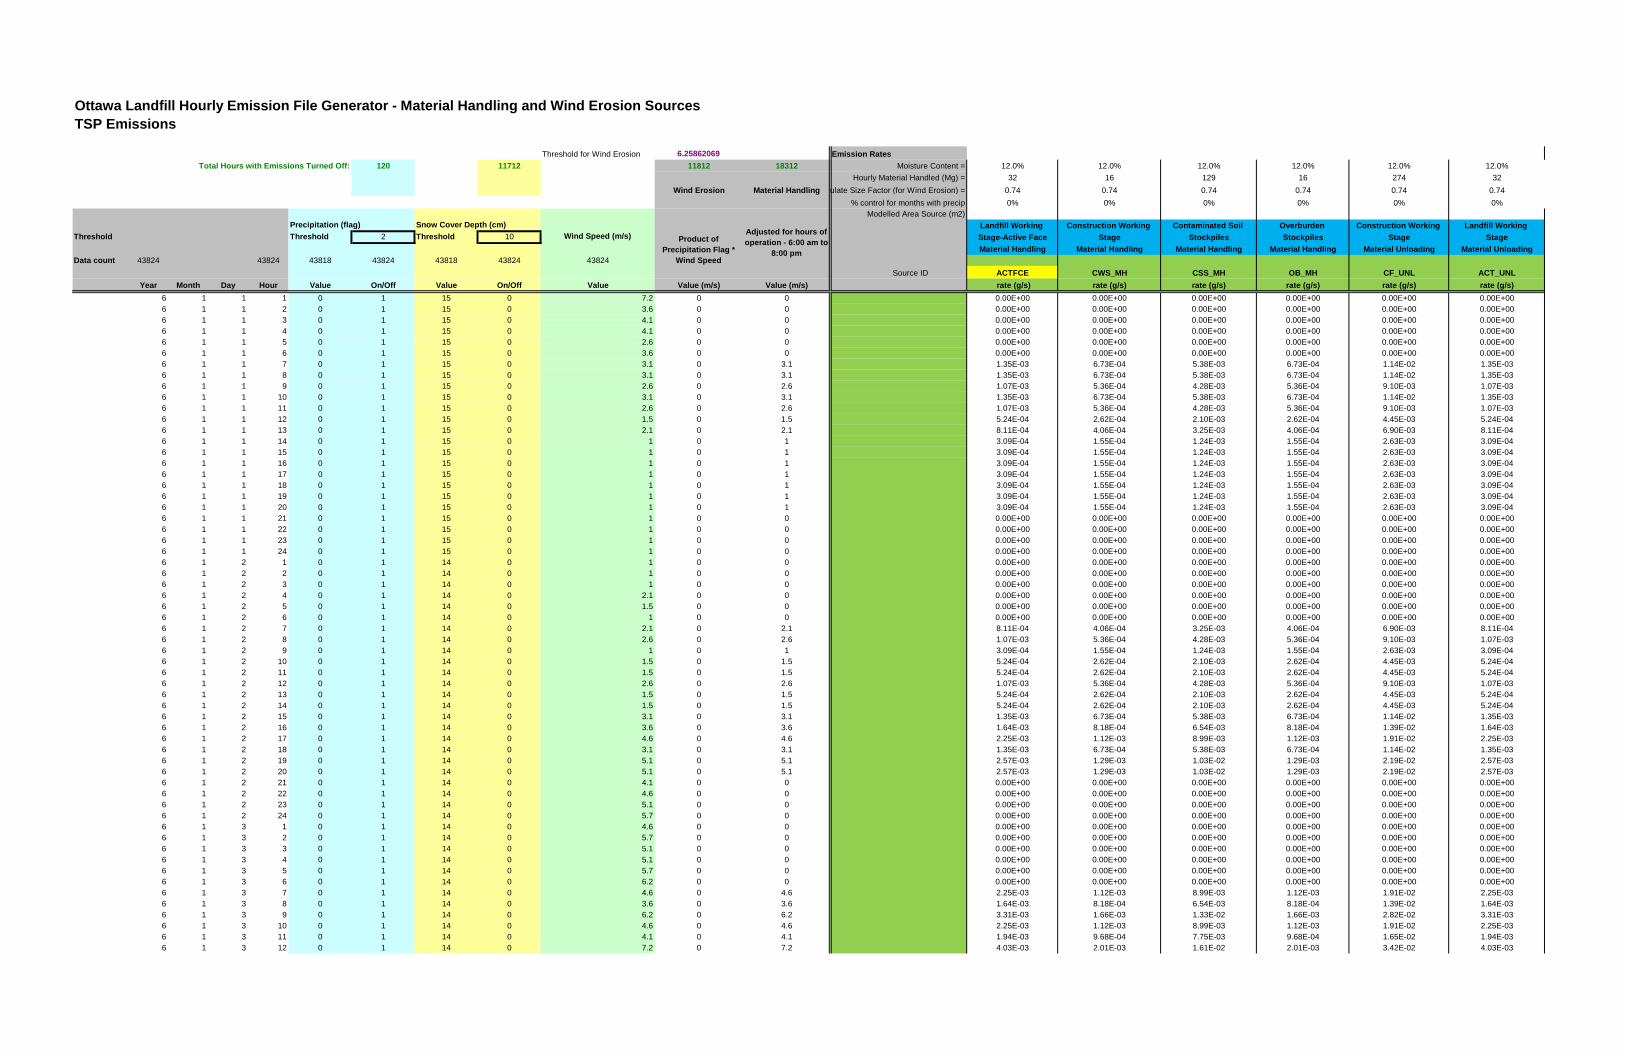
Ottawa Landfill Hourly Emission File Generator - Material Handling and Wind Erosion SourcesTSP Emissions
Wind Erosion Material Handlingk Factor (for Material Handling) or Wind Erosion Particulate Size Factor (for Wind Erosion) = 0.74 0.74 0.74 0.74 0.74 0.74
% control for months with precip 0% 0% 0% 0% 0% 0%Modelled Area Source (m2)
Precipitation (flag) Snow Cover Depth (cm) Landfill Working Construction Working Contaminated Soil Overburden Construction Working Landfill Working Threshold Threshold 2 Threshold 10 Stage-Active Face Stage Stockpiles Stockpiles Stage Stage
Material Handling Material Handling Material Handling Material Handling Material Unloading Material UnloadingData count 43824 43824 43818 43824 43818 43824 43824
Source ID ACTFCE CWS_MH CSS_MH OB_MH CF_UNL ACT_UNL
Year Month Day Hour Value On/Off Value On/Off Value Value (m/s) Value (m/s) rate (g/s) rate (g/s) rate (g/s) rate (g/s) rate (g/s) rate (g/s)
APPENDIX K1: Bulldozing at Overburden Pile and Construction Working Face - TSP Emission Rates--> Emission Factor Equations for Uncontrolled Open Dust Sources at Western Surface Coal Mines, AP-42 11.9-2
M = 12% material moisture content (%) --> chosen from AP42 Table 13.2.4-1 to match parameters for Material Handling Sourcess = 9% material silt content (%) Material: Cover
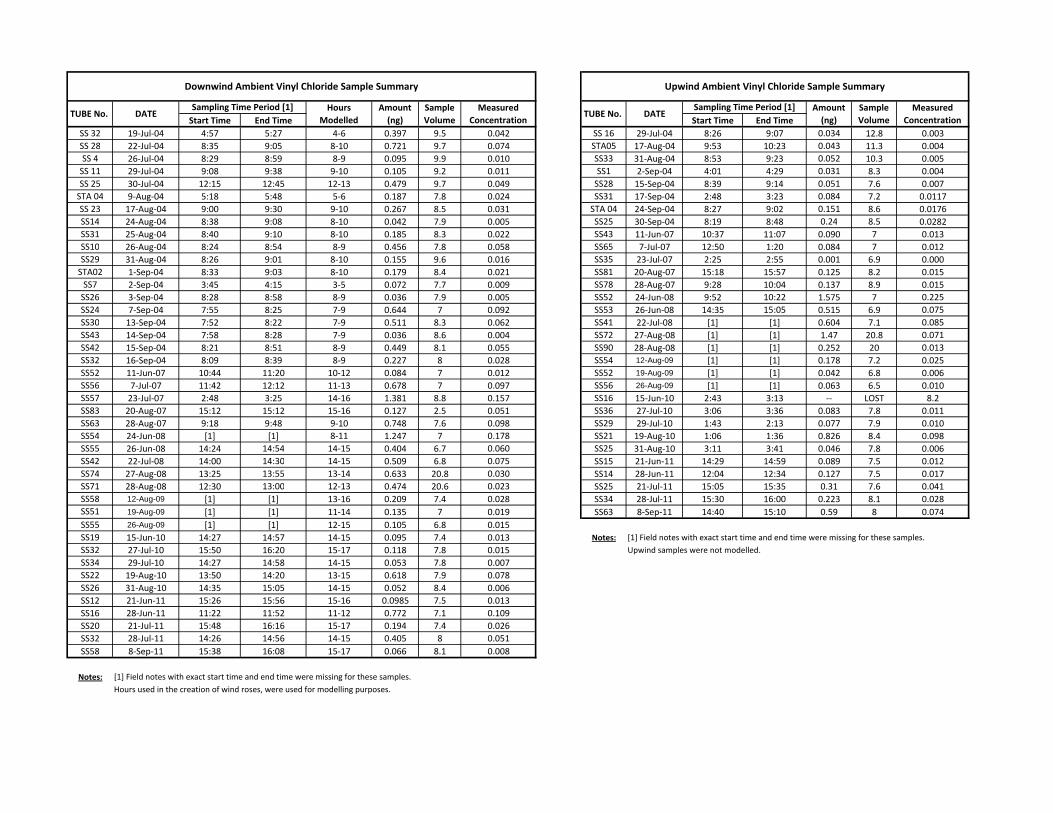
Notes: [1] Field notes with exact start time and end time were missing for these samples.Hours used in the creation of wind roses, were used for modelling purposes.