| ^ m United States Department of Commerce I Technology Administration B National Institute of Standards and Technology NISTIR 3996 SENSING OF CONTACT TUBE WEAR IN GAS METAL ARC WELDING M.A. Mornis T.P. Quinn T.A. Siewert J.P.H. Steele Set
Transcript
|^m United States Department of CommerceI Technology AdministrationB National Institute of Standards and Technology
NISTIR 3996
SENSING OF CONTACT TUBE WEARIN GAS METAL ARC WELDING
M.A. Mornis
T.P. QuinnT.A. Siewert
J.P.H. Steele
Set
N/STIR 3996
SENSING OF CONTACT TUBE WEARIN GAS METAL ARC WELDING
M.A. Mornis
T.P. QuinnT.A. Siewert
J.P.H. Steele*
Materials Reliability Division
Materials Science and Engineering Laboratory
National Institute of Standards and Technology
Boulder, Colorado 80303
^Department of Mechanical Engineering
Colorado School of Mines
Golden, Colorado 80401
September 1992
U.S. DEPARTMENT OF COMMERCE, Barbara Hackman Franklin, Secretary
TECHNOLOGY ADMINISTRATION, Robert M. White, Under Secretary for Technology
NATIONAL INSTITUTE OF STANDARDS AND TECHNOLOGY, John W. Lyons, Director
'
CONTENTS
LIST OF FIGURES iii
LIST OF TABLES iv
1. INTRODUCTION 1
1.1 Gas Metal Arc Welding 1
1.2 Nomenclature 2
1.3 Contact Tube Wear 3
1.4 Contact Tube Failure 3
1.5 Tube Wear With Constant Voltage Power Source 4
2. Electrode positioning: work angle and travel angle 7
3. Weave test 10
4. Mean current versus bore size 10
5. SD of current versus bore size 11
6. PSD current - 0 to 100 Hz for varying bore diameter 12
7. PSD voltage - 0 to 50 Hz for varying bore diameter 12
8. Droplet frequency versus bore size 13
9. SD of droplet frequency versus bore size 13
10. Droplet profile with enlarging bore size 14
11. Range of visible electrode length versus bore size 15
12. SD of droplet frequency versus ratio of bore/electrode diameters 15
13 Voltage signal with increasing weld time 17
14. W of tubes LW10, LW11 and SW1 18
15. W of tubes SW2, SW3 and SW4 19
16. Wear pattern for GMAW process with steel electrode 20
17. W and R versus length of electrode fed for tube A2 21
18. W and R versus length of electrode fed for tube B1 21
19. W and R versus length of electrode fed for tube Cl 22
20. W and R versus length of electrode fed for tube S4 . 22
21. Sectioned contact tubes 24
22. Electrode and tube wear configuration 25
23. Arc length of contact versus R 26
24. Contact area versus R 26
25. Wear volume versus R 26
26. PSD voltage for sequential stringer and 1 Hz weave beads with a new contact
tube 28
27. Weave geometry 28
28. IF Versus length of electrode for stringer and weave tests 29
IV
LIST OF TABLES
Table Page
1. Actual wear tests - Group I 16
2. Actual wear tests - Group II 18
3. Actual wear tests - Group III 19
4. Contact tube measurements 23
/
v
ABSTRACT
Welding tests confirm that the circuit voltage can serve as a through-the-arc
sensing parameter for monitoring wear of the contact tube in gas metal arc
welding. The integrated power spectral density curve (W) of the voltage,
within the 0 to 4 Hz range, correlated with wear. W in this frequency range
measured the arc stability, which degrades as the contact tube is eroded by the
electrode. W reached a peak value when the wear reached the maximum line
contact between the electrode and the contact tube, then W became erratic as
the electrode started to oscillate within the slot that had worn in the tube.
1. INTRODUCTION1.1 Gas Metal Arc Welding
In gas metal arc welding (GMAW), a continuously fed electrode melts as it enters an
electric arc and molten droplets are transferred to the weld joint. The current passes from the
contact tube to the electrode, through the arc, and then to the weld joint (Figure 1). Because
of the series connection between these circuit elements, the static and dynamic characteristics
of the arc are a combination of the response of these circuit elements. The following
paragraphs list some of the important characteristics of these elements and how they affect the
wear of the contact tube and the ability to sense the wear.
Figure 1. Contact tube and electrode.
1
An externally supplied gas, generally a mixture based on Ar or C02 ,is used to shield
the molten weld metal from the atmosphere. Although a small amount of atmospheric
contamination can be tolerated, most molten metals react with high levels of oxygen and
nitrogen causing inclusions, porosity, or embrittlement. In addition to shielding the electrode
and the base metal from contamination, the inert gases and any reactive gases form the
plasma that stabilizes the arc.
The two most common types of power sources used in GMAW are constant voltage and
pulsed current. A constant-voltage power source delivers a relatively fixed voltage during
welding, with a slight decrease in voltage as more current is required (about 2 V drop for
each 100 A). An initial arc length, La ,is determined by the combination of the arc voltage
(set at the power source) and the electrode feed rate. A constant-voltage power source is
inherently stable; any perturbation in the contact-tube-to-work distance, CTWD, changes the
circuit impedance and is balanced by an instantaneous change in the current [1]. The
magnitude of the current change is determined by the slope (drop in voltage as the current
increases) of the characteristic curve of the power source. The power-source designer chooses
a slope that increases the arc power when the arc is short and decreases the arc power when
the arc is long, stabilizing the arc length.
In a pulsed-current power source, the arc current is switched between high- and low-
current intervals. The high-current interval serves to melt the electrode tip, pinch the molten
column into droplets, and propel the droplets toward the base metal. The low-current interval
serves to maintain the arc between the high-current pulses and preheats the electrode. Apulsed-current power source typically requires a feedback control system in the electrode
feeder to compensate for changes in CTWD.
1.2 Nomenclature
Figure 1 also identifies the following parameters:
Ls
Electrode extension, the length of the electrode that projects beyond the contact tube to
the arc.
La Arc length, the distance from the tip of the electrode (where melting occurs) to the
weld pool.
CTWD Contact-tube-to-work distance, the distance from the contact tube to the base metal,
also equal to the sum of the electrode extension, Lsand the arc length, La .
Vt
Total voltage drop, from power source to base metal.
2
Va
Arc voltage, the voltage drop from the tip of the electrode to the base metal.
Vs
Voltage drop from the point of current transfer to the tip of the electrode; in this figure
the point of current transfer is assumed to be at the tip of the contact tube.
1.3 Contact Tube Wear
A contact tube is usually a copper alloy with a diameter (bore size) 0.2 mm to 0.5 mmlarger than the welding electrode, depending on the tube hardness [2]. The tube aligns the
electrode with respect to the welding gun and serves to transfer the welding current from the
tube to the electrode. The electrode probably touches the contact tube in several places, so
the current is shared between the contact tube and the electrode in a parallel circuit, yet most
of the current travels through the contact tube until the final contact at the tip [3], Less
current travels through the electrode because (1) the electrode has a resistivity greater than
that of the copper-alloy contact tube, (2) the electrode has been cold drawn raising its
resistance further, and (3) the electrode has a smaller cross section. The point where the
current transfers from the contact tube tip to the electrode is the location of any arc-related
interaction between the electrode and the contact tube, such as an accentuation of wear in the
presence of ohmic heating.
As the contact tube wears, the point of electrical contact probably moves between
different points within the contact tube. As the point of contact changes, the current travels
through different lengths of electrode to the arc (at least until the electrode can reestablish an
equilibrium length). This varying electrode length leads to instability of the arc and
determines the interval at which the contact tube must be replaced.
When a contact tube wears during manual GMAW, the welder compensates for changes
in arc length by moving the welding gun toward or away from the base metal. The welder
uses visual and audio feedback to identify a worn tube. As automation of GMAW progresses,
a method of automatically monitoring the wear of the contact tube must be developed. An
automatic system would either compensate for a worn tube or instruct the operator to replace
the tube.
1.4 Contact Tube Failure
Failure of the contact tube can be defined as (1) catastrophic obstruction of the electrode
or (2) generation of unacceptable instability in the welding process. Catastrophic obstruction
terminates the weld and replacement of the tube is necessary before welding can continue. If
a substantial amount of the contact-tube alloy has been melted and transferred to the weld
pool, the weld may have to be rejected or grinding of the weld may be needed to remove this
crack-prone material. Instability in the weld process occurs gradually, and the contact tube
may be replaced between welds. If the instability is not noticed or corrected, the weld quality
3
can deteriorate until the welds will not pass visual or NDE acceptance criteria. Weld quality
may also be affected by increased wear of the contact tube because the electrode position may
exceed position tolerances.
There are three types of catastrophic failure of contact tubes: (1) fusion of the electrode to
the inside of the contact tube, (2) clogging of the tube due to weld spatter or other debris, and
(3) melting the entire tip of the contact tube. If current consistently transfers to the electrode
through a specific region of the tube, that region may overheat and the electrode may fuse to
the inside of the tube at the point of current transfer. This fusion occurs when either the tube,
the electrode, or both reach their melting temperature [2], A contact tube tip can also melt
if the arc length increases until it reaches the tip of the contact tube. Catastrophic failure also
occurs when debris accumulates inside the tube, causing the electrode feed to hesitate and
ultimately to stop. For titanium, DeNale and Lukens found that a copper-titanium
intermetallic layer grew inside the contact tube until the electrode could not feed any more
[2]. For most electrodes, the problem is the reverse; the contact tube wears. In these cases,
any intermetallic compounds that might form apparently bond to the electrode and are carried
out of the contact tube.
Failure of a contact tube can be defined as when the contact tube causes unacceptable
instabilities in steady-state welding. The welding engineer must decide in each application
when the instability starts to cause unacceptable weld quality, in characteristics such as weld
profile, weld-bead alignment with the joint, penetration, or the risk of catastrophic failure.
1.5 Tube Wear with a Constant-Voltage Power Source
In a constant-voltage GMAW process, the power source voltage, K„ is maintained
nearly constant (changing only slightly in response to changes in the current). Under steady-
state conditions, the current transfer point can be assumed to be at the tip of the contact tube,
and the electrode extension, Ls .,
can be assumed to remain constant during the weld.
However, if Lschanges as the point of current transfer varies, the steady state assumptions are
no longer valid. If Lsincreases, current decreases due to an instantaneous increase in
electrode resistance. This results in an increase in voltage drop across the electrode and a
decreased voltage drop across the arc, Va . The decrease in Va,arc length (La), and welding
current result in a decrease in power or heat input to the base metal. This reduction in heat
should not severely change the welding conditions because, before long, the point of current
transfer returns to the end of the contact tube and the electrode returns to its equilibrium
length. However, instantaneous changes in the circuit resistance can be detected by changes
in the circuit voltage and current.
4
1.6 Tube Wear with a Pulsed-Current Power Source
A pulsed-current power source with voltage feedback control of the electrode feed speed
reacts to wear of the contact tube in a different manner. The current is maintained at a set
value by the power source. When Lachanges due to wear, the voltage (Vt)
changes. In
response, the feedback control system increases or decreases the electrode feed speed. If the
electrode feed speed system is not critically damped, any overshoot in the feed speed creates
oscillation in the arc length until the system stabilizes. When welding is performed at a high
travel speed, the variations in arc length affect weld quality by changing the bead width.
1.7 Wear Mechanisms
Wear, in the case of sliding contact between two bodies, is the removal of surface
material and transformation of the surface. Although several different wear mechanisms may
be occurring simultaneously in a contact tube during GMAW, abrasion and adhesion seem to
be the major contributors to the deterioration of a contact tube when welding with a steel
electrode.
Abrasive wear is the removal of material by a hard asperity between the contact tube and
the electrode, or the addition of a foreign body. Foreign bodies may be oxides embedded in
the surface or wear particles formed during sliding. Resistance to abrasive wear is a function
of hardness, and experiments have shown that abrasive wear occurs when the Vickers
hardness (HV) of the asperity is 1.5 times greater than the abraded surface [4], Even if the
difference in hardness between the electrode and the contact tube were less, oxides and
intermetallic compounds (formed by diffusion when heat is present) may meet this hardness
criterion.
A steel electrode (ER 100S-1) with a tensile strength of 700 to 770 MPa has a hardness
of 205 HV to 222 HV, while a copper alloy has a hardness of approximately 70 HV [5,6].
Although both these values underestimate the hardness of materials that have been cold
worked, the hardness ratio for the two materials is still about 3, so they meet the differential
hardness criterion for abrasive wear.
Adhesion wear can be due to cold welding (formation of a metallurgical bond when
materials are below their melting temperature) or hot welding (melting of one of the
materials). Cold welding requires atomically clean surfaces for the bonding to occur. In the
GMAW environment, the electrode surface is often oxidized, contaminated by debris, or
coated with a lubricant to enhance feeding. In spite of these surface coatings, virgin surfaces
can be exposed. These atomically clean surfaces are generated by asperities plowing through
surface films of lubricants or oxides. Cold welding between these virgin surfaces of the
electrode and the contact tube creates a bond which must be sheared by the electrode feeder
or catastrophic feed failure occurs. If the cold weld between the electrode and the contact
tube is strong (often the case with an intermetallic compound), the joint might shear within
5
either the adjacent electrode or the contact tube metal. The failure of any cold welds for
GMAW using a steel electrode and a copper alloy contact tube must occur within the contact
tube because the diameter of the contact tube increases over time.
Gas metal arc welding with a titanium electrode and a copper-alloy contact tube provides
an example of adhesion wear due to a hot weld. If the contact tube is heated to 1493 K by
an arc within the tube, a localized pool of copper develops on the inside of the tube.
Titanium dissolves in the molten copper, forming a low-melting-point eutectic that later
solidifies as a hard intermetallic compound. This compound bonds strongly to the interior of
the contact tube, resulting in an accumulation of hard intermetallic compounds inside the
contact tube [2],
The removal of surface material can be quantified by wear volume, where wear volume
(V) is proportional to the distance (1) or time of sliding, according to the formula
V = Kl H ’
( 1 )
where H is the hardness of the softer material and K is some parameter specific to the wear
conditions. This parameter may be a function of the normal load, the area of contact or the
shape of the asperity [4].
2. EXPERIMENTAL PROCEDUREThe welding arc is affected not only by the shielding gas and power source, as described
in the introduction, but also by electrode orientation and movement with respect to the base
plate.
The electrode orientation can be defined by two angles, the travel angle (leading or
trailing) and the work angle, as illustrated in Figure 2. In this study, the travel angle was
adjusted for the most stable arc and this value was kept constant within each test matrix. The
work angle was set as small as possible and was kept constant for each test matrix.
The travel speed was selected near the middle of the range used in production
environments and was kept constant for each test matrix. The travel speed was relatively
unimportant in this study because we were not concerned with the microstructure, the variable
affected most by the heat input.
To investigate the various aspects of wear, several tests were used. These included
simulated wear tests (which separated the effect of tube diameter from interior surface damage
due to actual wear), three groups of wear tests, and an evaluation of the effect of electrode
weave. The procedures were customized for each test group, as described in the following
sections.
6
Figure 2. Electrode positioning: work angle and travel angle.
2.1 Simulated Wear Tests
A simple test was designed to simulate wear of a contact tube. New tubes were drilled
to produce a range of internal diameters. The increasing diameters simulated the loss in
electrode alignment that occurs when a tube is worn; however, the clean internal surface
neglected the oxidation or other damage that occurs on the internal surface of the tube. The
voltage and current were monitored and analyzed as welds were made with a constant-voltage
power source and constant electrode feed rate. Droplet frequency, the rate of formation of
drops of molten electrode which are propelled to the weld pool, was calculated from high-
speed images of the weld [7].
The power source output of 32 V was filtered with a transistorized current regulator to
reduce power-line ripple below 0.1 V. The polarity was direct-current electrode positive
(DCEP), in which the welding electrode is positive and the base metal is negative. The
electrode was fed at 10 m/min, which produced a current of 300 A. A stationary, water-
cooled, straight welding gun was positioned normal to the plate surface. The base metal was
fastened to a motorized carriage under the stationary gun and moved with a velocity of 20
cm/min. The contact-tube-to-work distance (CTWD) was set at 13.5 mm, and the shielding
gas was a mixture of 95 percent Ar and 5 percent C02 . Through-the-arc imaging and the
specific features of our imaging system have been described previously [7,8], The
magnification of the video system was 4.4, producing a resolution of 0.1 mm/pixel.
7
Standard contact tubes with a bore diameter of 1.4 mm were drilled to diameters of
1.5 mm, 1.6 mm, 1.7 mm, 1.8 mm, 1.85 mm, 2.0 mm, 2.1 mm, and 2.24 mm. One contact
tube with a bore diameter of 1.3 mm was used to represent an undersized bore. The electrode
was an E70S-3 (low carbon steel) with a 1.14 mm diameter.
Three welds of 8 s duration were made with each contact tube, for a total of 30 welds.
The welding voltage and current were acquired at a rate of 2000 samples/s.
The following data was calculated for each contact tube:
1. Mean and standard deviation of current,
2. Power spectral density (PSD) of current,
3. Droplet frequency, and
4. Length of electrode from the gas cup to the arc.
2.2 Actual Wear Tests
The actual wear tests were conducted in three groups. The combination of power source,
contact tube, and other details are described in the following sections.
2.2.1. Wear Test. Group I. Group I used a commercial pulsed-current power source with
voltage feedback control of the electrode feed speed. The polarity was DCEP. A curved
water-cooled welding gun was used with a 0° work angle, a 10° trailing travel angle, and a
long-life contact tube alloy (as described by the manufacturer). The base plate carriage was
set at a travel speed of 14.7 cm/min, and the CTWD was 19 mm. Shielding gas was a
mixture of 95 percent Ar and 5 percent C0 2at a flow rate of 1.13 m 3
/h. The average current
setting ranged from 225 A to 250 A.
The average dimensions of the carbon steel base metal plates were 25 cm x 50 cm x
2 cm. After approximately 3 min of welding, the CTWD was checked and the gun was
repositioned on a clean region of the base plate. Repositioning was necessary to maintain a
consistent direction of travel and corresponding travel angle.
The current and electrode feed speed were measured at internal test points in the pulse
power source. The internal electrode feed test point measures the input voltage to the
electrode feed motor, and is generated by the internal feedback control system of the power
supply. It is only approximately proportional to the actual electrode feed speed, but provided
a convenient way to measure the feed stability. The voltage was measured across the two
output terminals of the power source. The voltage, wire feed speed (WFS), and current were
acquired at rates of 200, 800, and 2000 samples/s. The signals were low-pass filtered (to
eliminate aliasing) at 90 Hz, 360 Hz and 900 Hz, respectively. The PSD of the voltage was
calculated for analysis.
8
2.2.2. Wear Test Group II . Group II is similar to Group I except that standard life contact
tubes were used. The mean current setting ranged from 150 to 220 A and the data
acquisition rates for voltage, WFS, and current were 200, 220, and 2000 samples/s. For the
lower sampling rates the signal was first sent through 90 Hz and 100 Hz low-pass filters
before computer acquisition. The PSD of the voltage and the area under the curve of the PSD
of the voltage from 0 to 4 Hz, a, were calculated from the acquired data.
2.2.3. Wear Test. Group III. Group III used the pulsed-current power source and a straight
water-cooled welding gun with 0° work and travel angles. Standard-life contact tubes (but
from a different manufacturer) were used. Every 9 to 18 min, the welding was stopped to
confirm that the CTWD (19 mm) was correct and to measure the change in contact tube
diameter with calipers. The shielding gas was 95 percent Ar and 5 percent C02 ,the mean
operating current was 300 A, the data acquisition rates for the voltage and WFS were 200
samples/s, and the low pass filter was set at 90 Hz. Two tube compositions were used:
composition A was termed "standard life" by the manufacturer, and composition B was
termed "extended life." The following information was calculated from the acquired data:
1. PSD of the voltage.
2. Area under the curve of the PSD of the voltage, a.
3. Wear volume, contact surface, and arc length for the tube.
2.3 Weave Test
A weave of 1 Hz was used in a single wear test to determine its effect on the low-
frequency PSD data. Any changes in the CTWD due to the weave procedure are expected to
appear within the 0 to 4 Hz frequency range of the power spectral density data. The test
utilized the straight water-cooled weld gun at a 0° work angle and a 10° trailing travel angle,
with the standard 1 .4-mm-intemal-diameter tube. The shielding gas mixture was 95 percent
Ar and 5 percent C02 ,the travel speed was set at 14.7 cm/min and the acquisition rate was
220 samples/s. A 6-mm-thick steel bar was tack-welded to the base metal plate and tilted to
approximately a 45° angle to simulate a V-groove joint (Figure 3). The stroke on the
horizontal oscillator was set to 10 mm and the CTWD was 19 mm.
3. RESULTS AND DISCUSSION3.1 Simulated Wear Tests (Drilled Contact Tubes)
3,1.1. Current Analysis. The mean and standard deviation of the welding current were
calculated and plotted for the three weld tests conducted for each bore size. Figure 4 is the
graph of mean current versus bore size (1.4 mm is standard bore), and Figure 5 is the graph
of the standard deviation of current taken at each bore size. In previous experiments, Heald
reported a small increase in the standard deviation of the weld current with an increase in
9
Figure 3. Weave test.
bore diameter [7]. However, the results of these tests do not show a correlation between
standard deviation of current and bore size.
Another measure of arc stability is the magnitude of the PSD curve. We calculated a
using the fast Fourier transform [9]. Figure 6 shows the PSD current curves for frequencies
Figure 4. Mean current versus bore size.
10
cosrs
>0Q
(0
*oc005
c0ww.3<J
6 .5 -
6-
5 .5 -
5'
4.5
4
3.5
3
2.5
5 c
3 :
5 c
X
5 :X
5 :3
5
3C
f
c X
XX
X3 :
3
3
c
XA
35T
V1.1 1.2 1.3 1.4 1.5 1.6 1.7
Bore Diameter (mm)1.8 1.9
Figure 5. SD of current versus bore size.
from 0 to 100 Hz, for varying bore diameters. This frequency range was selected for analysis
because it contained the largest variations in the PSD magnitude as wear occurred. However,
no consistent trend in current PSD magnitudes could be related to the bore diameters.
3.1.2. Voltage Analysis. The PSD of the arc voltage data is plotted in Figure 7. The lower
frequency range of 0 to 50 Hz was selected for observation, and does not show a uniform
increase with bore diameter.
3.1.3, Droplet Frequency Analysis. The droplet frequency was calculated by counting the
number of frames which passed during the development of 10 drops of molten electrode. The
duration of each frame was one-thousandth of a second. Figures 8 and 9 graph the droplet
frequency and standard deviation versus bore diameter. The average droplet frequency
increases with bore size with a low SD until the bore diameter of 1.85 mm is reached, at
which point the average droplet frequency and SD peak. The high-speed images of the
welding revealed that all contact tube diameters produced smaller secondary droplets along
with a major droplet. The major droplets were counted to determine droplet frequency. The
droplet form changed from small discrete droplets with short necking of the electrode, to
elongated droplets generated from a long narrow neck. Between the bore diameters of 1.98
mm and 2.2 mm, the mode of transfer changed from discreet droplets to a stream of molten
11
14
NX
oJX
12-
10-<QCO
8-
Q.•*=>
C0 6'
u13
O 4'
0><
2
—r2.2mm
2.1mm./ N
—
A
\ \
f"/J
<rw \
’ll ,6mm
i
\
L t
\. \\ t
A\
\ \\
1.3mm^\ V\ \
%
•\ \ \
0 10 20 30 40 50 60 70 80 90 100
Frequency (Hz)
Figure 6. PSD current - 0 to 100 Hz for varying bore diameter.
Figure 7. PSD voltage - 0 to 50 Hz for varying bore diameter.
12
500
_ 450-wToQ.O
>oco3cro
oClOk_
Q
400J
350-
300-
250-
i x
— ><
XX X
(XX
X X
V< X
X X
X
X
1.2 1.4 1.6 1.8 2
Bore Diameter (mm)
2.2 2.4
Figure 8. Droplet frequency versus bore size.
Bore Diameter (mm)
Figure 9. SD of droplet frequency versus bore size.
13
electrode. Figure 10. Current affects droplet transfer mode, and the increase in average
current with bore diameter may explain the change in droplet formation [7].
3.1.4. Arc Length Analysis. The extremes in arc length were calculated by measuring the
visible electrode length for each tube on the video records. One effect of wear in a contact
tube is an erratic arc length. Therefore, a greater spread in arc length was expected for an
increase in bore diameter, but Figure 1 1 indicates no such correspondence.
3.1.5. Discussion of Simulated Wear Tests. The standard deviation (SD) of droplet
frequency may be of use in selecting an optimum ratio of contact-tube diameter to electrode
diameter for a constant-potential GMAW process. The low standard deviations of droplet
frequency occur for a ratio of contact-tube-to-electrode ratio less than 1.62 mm/mm, as shown
in Figure 12. The preferred droplet transfer mode occurs at a bore diameter less than 1.98
mm or a ratio of tube diameter to electrode diameter of less than 1.73 mm/mm.
VISIBLE
ELECTRODE
LENGTH
VISIBLE
ELECTRODE
LENGTH
Figure 10. Change in droplet profile with enlarging bore size, with the larger bore on the
right.
14
Figure 1 1 . Range of visible electrode length versus bore size.
90-j
80-
(0
To __a 70-oTJ
^ 60-o
§ 50-croLL A(~\-
X !
!
u- 4U*->
0
o 30-
Q
S 20-Qcx>
1 H-
—X
1
1 U
n.X
X
s*
|
H i Xi X-j 1
i i
1 1.2 1.4 1.6 1.8 2 2.2 2.4
Bore Diameter/wire Diameter (mm/mm)
Figure 12. SD of droplet frequency versus ratio of bore/ electrode diameters.
15
3.2 Actual Wear Tests
3.2.1 Wear Test Group I. Table 1 summarizes the results for the welds of Group I.
Electrode feed speed data (acquired at 2000 samples/s) were analyzed by counting the number
of "outliers," defined as points where the WFS exceeded some multiple of the SD of electrode
feed speed. The multiple was varied to find an increasing trend in the number of outliers with
welding time.
Table 1 - Actual wear test - Group I.
Tube
number
Welding
time
(min)
Meanamperage
(A)
WFS sample
rate
(samples/s) Comments
LWO 20 225 2000 E70S-3 electrode was
unstable, terminated test
LW1 19 250 2000 ER100S-1 electrode
LW2 42 250 2000 Switched from 250 A to
225 A after 28 minutes
LW4 135 250 2000 Electrode ran out at 135
minutes
LW10 48 220 200,2000 Electrode ran out
LW1
1
62 220 200,2000 Leaky gas o-ring, moved
contact tube, stopped
welding
Note: Shielding Gas was 95 percent Ar - 5 percent C02
This increasing trend in outliers appeared in the WFS data of contact tube LW4 with a
limit of 3 times the SD. The outliers technique was not successful in providing a consistent
rising trend relative to wear. Variations in electrode feed speed are a low-frequency
phenomenon, therefore the acquisition rate was changed to include both 200 and 2000
samples/s for later tests in Group I.
The analysis of the PSD curve for the arc voltage showed an increased area under the
curve in the 0 to 4 Hz frequency range for LW10 and LW11. Figure 13 shows the actual
voltage recorded during welding with a single contact tube. The envelope of the voltage
appears more ragged as wear progresses; this variation was also observed visually in the arc
during testing. As wear advanced, the arc became more erratic.
16
Canuci Tip Wear
5a.occ
100
94
82
no
39 2u*
27
12
1
Time(s)Mean vohage = 24 -k 0.2 (v) for all samples
Figure 13. Voltage signal with increasing weld time.
The voltage (V) was sampled at time zero with a new contact tube at 200 cycles per s for
a total of 90 s, and every 1 0 to 15 min thereafter. The voltage data were normalized
according to
(2 )
where V is the mean voltage and V' is the normalized voltage. Since the majority of voltage
variance occurred in the 0 to 4 Hz range, the PSD in this frequency range was integrated to
give
4Hz
a = f P(V)df ,(J )
0
where F is frequency. To better indicate wear, a was normalized with a at L=0 calculated
when the contact tube is first placed in the welding gun:
W(L) = -5®-, (4)
a(L=0)
where L is the total length of the electrode consumed using the contact tube and W is our
wear parameter.
17
3.2,2 Wear Test Group II . Table 2 summarizes the results for the Group II welds.
Table 2. Actual wear test - Group II.
Tube
number
Welding
time
(min)
Meancurrent
(A)
Sample
rate
(samples/s) Comments
SW1 105 150 200, 2000 95% Ar - 5% 02shielding
gas
SW2 99 150 200 Tube moved, stopped at 99
min
SW3 102 150 200
SW4 140 220 200 SW4 used in weave test
and bore was measured
Note: Shielding gas for SW2, SW3, and SW4 was 95 percent Ar and 5 percent C02 .
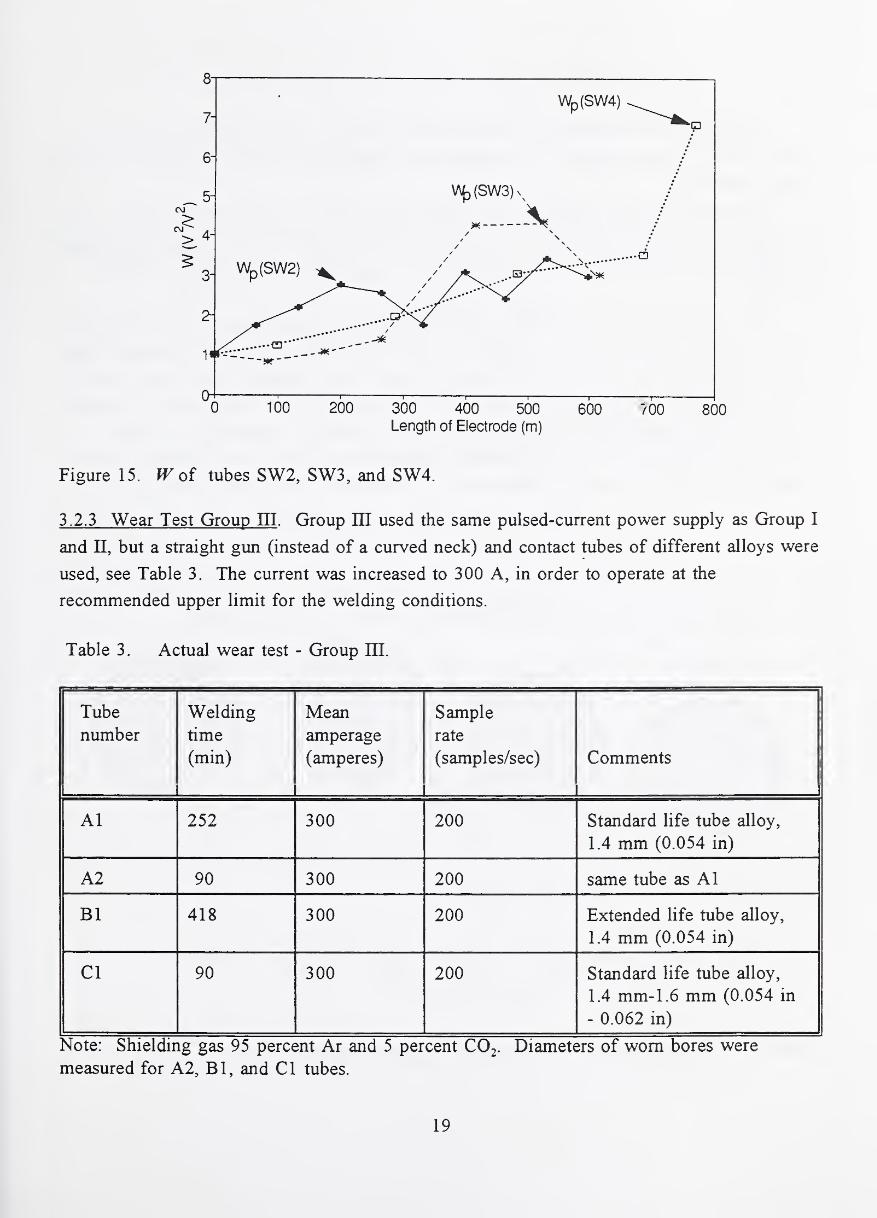
Figures 14 and 15 show W of arc voltage versus length of electrode consumed for contact
tubes with different compositions and designs, different weld gases, and different average
currents. W steadily increased, reaching a peak (Wp)
in all cases. After Wpwas attained, the
wear parameter became erratic, leveling off or decreasing in value. Wpcan be identified in
each case.
Figure 14.
1
18
8-
7-
6-
Wp (SW4)
CD
100 200 300 400 500
Length of Electrode (m)
600 700 800
Figure 15. fV of tubes SW2, SW3, and SW4.
3.2.3 Wear Test Group III . Group III used the same pulsed-current power supply as Group I
and II, but a straight gun (instead of a curved neck) and contact tubes of different alloys were
used, see Table 3. The current was increased to 300 A, in order to operate at the
recommended upper limit for the welding conditions.
Table 3. Actual wear test - Group III.
Tube
number
Welding
time
(min)
Meanamperage
(amperes)
Sample
rate
(samples/sec) Comments
A1 252 300 200 Standard life tube alloy,
1.4 mm (0.054 in)
A2 90 300 200 same tube as A1
Bl 418 300 200 Extended life tube alloy,
1.4 mm (0.054 in)
Cl 90 300 200 Standard life tube alloy,
1.4 mm-1.6 mm (0.054 in
- 0.062 in)
Note: Shielding gas 95 percent Ar and 5 percent C02
. Diameters of worn bores were
measured for A2, Bl, and Cl tubes.
19
In Group III, the W and companion bore were measured. The initial bore diameter at
time zero (D0) and the length of the elongated bore developed in the direction of the cast (Dm )
were measured.
Cast is the curvature inherent in the electrode from electrode drawing and winding onto
the spool. All wound electrode has a cast and whether a straight or curved gun is used, wear
develops in the direction of the cast. Figure 16 is a typical wear pattern for the GMAWprocess.
The dimensionless wear ratio (R) is created by dividing the enlarging diameter (Dm ) by
the original bore diameter (D0). Figures 17, 18, 19, and 20 show changes in W and R with
the increasing length of electrode fed through the tube during welding, for Group III and S4.
is identified in each graph. The wear ratio which occurs at the same time Wp
is reached
is labeled Rp
. The wear ratio Rp
is not the peak wear ratio; it is the wear ratio which
corresponds to the point at which the largest area under the power spectral density curve is
reached (Wp ).
For the straight welding gun, Rpfalls within a range from 1.44 to 1.55.
Figure 16. Wear pattern for GMAW process with steel electrode.
20
Figure 17. W and R versus length of electrode fed for Tube A2.
Figure 18. W and R versus length of electrode fed for Tube Bl.
21
R
(mm/mm)
Figure 19. W and R versus length of electrode fed for Tube Cl..
Figure 20. W and R versus length of electrode fed for Tube S4.
22
R
(mm/mm)
3,2.4 Sectioned Contact Tubes. Tubes A2, Bl, Cl, and S4 were cut longitudinally, on a
plane perpendicular to the direction of wear. The areas of erosion and adhesion were detected
and measurements taken with an image analyzer, see Table 4.
Table 4. Contact tube measurements.
Tube
number
Wear length
(mm)Adhesion length
(mm)Calculated
approach angle,
a (degrees)
A2 15.32 1.754 .0533
Bl 16.07 1.564 .0531
Cl 12.89 1.910 0787
S4 14.10 8.540 .0880
Figure 21 shows the contact tube section which is perpendicular to the direction of wear,
along with the wear and adhesion area, for tubes A2, Bl, Cl, and S4.
3.2,5 Discussion of Actual Wear Tests. To determine a relationship between Wpand R
p , the
following were calculated; the change in tube exit contact length, contact surface area
between the electrode and the contact tube during welding, and the volume of copper worn
from the tube in relation to the angle of approach (a) and Dm. Figure 22 displays the
geometric relationship between the electrode and the contact tube during welding. As the
weld progresses, the electrode wears away the outlet of the contact tube in the direction of
cast. The wear continues until the electrode has worn a notch, with the contour of the
electrode, into the tube (P = 180°).
Then, the contact that was originally a line at the exit between the electrode and the tube
has reached a maximum, and the volume rate of wear decreases. The wear volume rate
changes because the line contact reaches it maximum value. Figures 23, 24, and 25. This
occurrence closely corresponds to a value for W (for A2, B 1 ,and C 1 with a straight weld
gun) at R equal to 1 .47 mm/mm.
As wear progresses, the point of current transfer can move within the electrode-tube
contact surface, which is greater for a smaller approach angle (a). The voltage variance is
produced by the changes in the voltage drop across the electrode extension and would
continuously increase as the surface area of contact increases. Yamada and Tanaka
determined that the point of current transfer is confined to the bottom one-fourth of the
contact tube and that current passes to the electrode without sparking [3], The voltage
23
%
1.7 5mm-1 imxj* jjpgBgj
\'Z**4ozv:, 1 1
—
r—j^w ?wr i ixiT'itw1
ii-rii rrrt 1
1-1
irn^jao^ . ^
15.23mm
B I
S4
Figure 21. Sectioned contact tubes.
24
CONTACT ARC
INNERTUBESURFA
CONTACT SURFACE
APPROACH ANGLE CO
ELECTRODE
CONTACT TUBE
ELECTRDDE
Figure 22. Electrode and tube wear configuration.
25
Configuration parameters versus R
Figure 23. Arc length of contact versus R .
180 -
—— Tub* A2— Tuba B1 —— Tub* Cl Tub* S4
Figure 24. Contact area versus R .
Tub* A2— Tub* 81 — Tub* Cl Tub* S4
Figure 25. Wear volume versus R .
26
variance would be a function of surface contact area and is not necessarily a low-frequency
process. If surface contact area were the only factor, tubes tested with the straight gun would
have W magnitudes greater than those for tubes with the curved gun, because the approach
angle is less and the surface area of contact is greater for the depth of wear. The results of
wear tests in this report do not indicate this.
The contact tube, S4, used in the curved gun has a larger ratio of adhesion area to surface
contact area than the tubes used in a straight gun. Therefore, other factors, such as contact
pressure, may affect the actual adhesion area.
The low-frequency voltage variance in a GMAW process with a pulsed-current power
source and feedback control of the WFS, develops from a combination of variations in
electrode extension and fluctuation in WFS due to adhesion. As mentioned earlier, adhesion
(cold welding and hot welding) between the surfaces of the electrode and tube creates a
junction which can be destroyed by the sliding motion of the electrode. Because the tube
material is eroded with weld time for the steel electrode, separation occurs at the tube side of
the junction.
When WFS is interrupted due to an adhesive bond, arc voltage increases, and in the weld
power source used the electrode feed motor increases speed to compensate. As soon as the
adhesive bond fails, the WFS is no longer restricted, but the controller has already
recommended an increase in speed. The combined rise in speed lengthens the electrode
extension and shortens the arc length. Then the controller signals the electrode feed motor to
decrease speed. This cycle is affected by the control system, dynamics of the feeder motor,
and frequency of adhesive bonds.
The maximum variance of the arc voltage (JFp)
at these low frequencies coincides with
the point of maximum line contact at the exit of the tube and at the decrease in the rate of
wear volume. If current transfer is limited to the extreme tip of the tube, the probability of
adhesive bonds forming depends upon the line of physical contact between the electrode and
the tube. The low-frequency changes in WFS are the consequence of increased frequency of
adhesive contact between the electrode and the tube due to the enlarging line contact.
3.3 Weave Test
The welding test for tube S4 included testing with a 1 Hz weave imposed on the weld
data. Test welds alternated between a linear weld progression (stringer bead) and an
oscillating weld progression (weave bead). Figure 26 displays the PSD of voltage for a
stringer bead collected immediately after replacing the contact tube (time 0) and the weave
bead data collected thereafter (3 min.).
Spikes at 1 Hz and at multiples of the weave frequency result from the voltage variation
caused by the weaving (Figure 27).
27
0.09
Figure 26. PSD voltage for sequential stringer and 1 Hz weave beads with a new contact
tube.
OSCILLATION
<=> c=C>
Figure 27. Weave geometry.
28
Figure 28 shows W for the stringer test weld and the 1 Hz weave test weld. The value of
W for a weave bead can presently be used as a wear monitor only if welding conditions are
kept constant. Welding a weave bead along a skewed path or filling a groove with multiple
passes, creates variations in the frequency and magnitude of the weave voltage data [10].
Figure 28. W versus length of electrode for stringer and weave tests.
IV. CONCLUSIONS
1 . Through-the-arc sensing can detect contact tube wear for the conditions of these tests.
These experiments show that the variance of the welding voltage correlates to contact
tube wear.
2. The area, W, under the power spectral density curve from 0 to 4 Hz identifies a point
in welding when the voltage variance has reached a maximum, and the electrode has
worn a slot with the maximum length of contact in the contact tube. This point can be
used to indicate the time to replace the tube.
3. The simulated-wear tests suggest that a contact-tube-to-electrode-bore ratio of less than
1.6 would provide a droplet-transfer mode with low standard deviation of droplet
6. Copper and Copper Alloys . 1989. Volume 02.01 of Annual Book of ASTM Standards.
American Society for Testing and Materials, Philadelphia.
7. Heald, P.R., Madigan, R.B., Siewert, T.A., and Liu, S., 1991. Droplet Transfer
Modes for a MIL 100S-1 GMAW Electrode. NISTIR 3976. National Institute for
Standards and Technology. Gaithersburg, Maryland.
8. Eagar, T.W., Allemand, C.D., Schoeder, R., and Ries, D.E. 1985. A Method for
Filming Metal Transfer in Welding Arcs. Welding Journal . 64(1 ):45 to 47
9. Bendat & Piersol, 1971. Random Data: Analysis and Measurement Procedures .
Wiley-Interscience. New York, N.Y.
10. Cook, G., Randall, M., Shepard, M., Yizhang, L. 1986. Adaptive Submerged Arc
Welding Control. International Conference on Trends in Welding Research. S.A.
David, ed. ASM International. Metals Park, Ohio.
30
BL-114A
(5-90)
ADMAN 15.01
U.S. DEPARTMENT OF COMMERCENATIONAL INSTITUTE OF STANDARDS AND TECHNOLOGY
BIBLIOGRAPHIC DATA SHEET
PUBLICATION OR REPORT NUMBER
NISTIR 39962! PERFORMING ORGANIZATION REPORT NUMBER
B92-02613. PUBLICATION DATE
September 19924. TITLE AND SUBTITLE
Sensing of Contact Tube Wear in Gas Metal Arc Welding
5. AUTHOR (S)
M.A. Momis, T.P. Quinn, T.A. Siewert and J.P.H. Steele
6. PERFORMING ORGANIZATION (IF JOINT OR OTHER THAN NIST, SEE INSTRUCTIONS)
U.S. DEPARTMENT OF COMMERCENATIONAL INSTITUTE OF STANDARDS AND TECHNOLOGYBOULDER, COLORADO 80303-3328
7. CONTRACT/GRANT NUMBER
8. TYPE OF REPORT AND PERIOD COVERED
9. SPONSORING ORGANIZATION NAME AND COMPLETE ADDRESS (STREET, CITY, STATE, ZIP)
U.S. Navy - David Taylor Research Center
Code 2815Annapolis, Maryland 21402-5067
10. SUPPLEMENTARY NOTES
11. ABSTRACT (A 200-WORD OR LESS FACTUAL SUMMARY OF MOST SIGNIFICANT INFORMATION. IF DOCUMENT INCLUDES A SIGNIFICANT BIBLIOGRAPHY ORUTERATURE SURVEY, MENTION IT HERE.)
Welding tests confirmed that the circuit voltage can serve as a through-the-arc
sensing parameter for monitoring contact tube wear in gas metal arc welding. The integral power
spectral density curve (IV) of the voltage, within the 0 to 4 Hz range, correlated with wear. Win this frequency range was found to measure the arc stability, which degraded as the contact tube
was eroded by the electrode. W reached a peak value when the wear reached the maximum line
contact between the electrode and the contact tube, then the W became erratic as the electrode
started to oscillate within the slot that had worn in the tube.
12. KEY WORDS (6 TO 12 ENTRIES; ALPHABETICAL ORDER; CAPITAUZE ONLY PROPER NAMES; AND SEPARATE KEY WORDS BY SEMICOLONS)
contact tube wear; current; gas metal arc welding; sensing; through-the-arc sensing;voltage; weld sensing
13. AVAILABILITY
UNUMITED
FOR OFFICIAL DISTRIBUTION. DO NOT RELEASE TO NATIONAL TECHNICAL INFORMATION SERVICE (NTIS).
X
X
ORDER FROM SUPERINTENDENT OF DOCUMENTS, U.S. GOVERNMENT PRINTING OFFICE,WASHINGTON, DC 20402.
ORDER FROM NATIONAL TECHNICAL INFORMATION SERVICE (NTIS), SPRINGFIELD, VA 22161.