1. IntroductionPapaverine (6,7-dimethoxy-1-veratryl-isoquinoline, PAP) is a benzylisoquinoline alkaloid obtained from opium. It has a direct spasmolytic effect on the smooth muscles of the bronchi, gastrointestinal tracts, ureters, and biliary system, and a pronounced relaxant effect on blood vessels including coronary, cerebral, pulmonary, and peripheral arteries [1]. Several methods have been reported for the quantitative determination of PAP, including chromatography [2,3], spectrophotometry [4–6], chemiluminescence [7,8], capillary electrophoresis [9,10], Raman spectroscopy [11], atomic absorption [12] and electrochemical methods such as: coulometry [13], potentiometry [14–17], voltammetry [18–20]. A lot of the reported methods suffer from disadvantages such as a long time of analysis often a requirement of expensive instruments. The detection limit which is included in the range of 4 mg L−1 to 5 μg L−1 for direct method listed above is also not sufficient. Thus a sensitive, fast and cheep method of determining papaverine is necessary for studying presence of papaverine in various samples.
The performance of voltammetric methods are strongly influenced by the working electrode material. As voltammetry is mostly based on mercury electrodes, the toxicity of mercury considerably limits the practical usage of this method, especially outside of the laboratory. One of the solutions proposed by Baś and Kowalski greatly limits the amount of mercury in electrode construction thereby makes the use of this electrode more save [21]. Such mercury electrode (Hg(Ag)FE) was used for the determination of various compounds and organic elements in simple and complex matrix [22-31].
In the work presented here a highly sensitive and fast method for the trace determination of PAP using Hg(Ag)FE and differential pulse stripping voltammetry are described. The procedure was examined and successfully utilized for the determination of a low and high PAP concentration in drug samples and urine. Potential interference from selected metal ions and surface-active substances were examined.
Central European Journal of Chemistry
Sensitive and fast determination of papaverine by adsorptive stripping voltammetry on renewable mercury film electrode
Faculty of Materials Science and Ceramics, AGH University of Science and Technology, 30-059 Kraków
Robert Piech*, Beata Paczosa-Bator
Research Article
The renewable mercury film electrode, applied for the determination of papaverine traces using differential pulse adsorptive stripping voltammetry (DP AdSV) is presented. The calibration graph obtained for papaverine is linear from 1.25 nM (0.42 μg L−1) to 95 nM (32.2 μg L−1) for a preconcentration time of 60 s, with correlation coefficient of 0.998. For the renewable mercury electrode (Hg(Ag)FE) with a surface area of 9.1 mm2 the detection limit for a preconcentration time of 60 s is 0.7 nM (0.24 μg L−1). The repeatability of the method at a concentration level of the analyte as low as 17 μg L−1, expressed as RSD is 3.3% (n=5). The proposed method was successfully applied and validated by studying the recovery of papaverine from drugs, urine and synthetic solution.
2. Experimental procedure2.1. Measuring apparatus and softwareA multipurpose Electrochemical Analyzer M161 with the electrode stand M164 (both MTM-ANKO, Poland) were used for all voltammetric measurements. The classical three-electrode quartz cell, volume 20 mL, consisting of the (Hg(Ag)FE) [21], refreshed before each measurement and with a surface area of 1–12 mm2, as the working electrode, a double junction reference electrode Ag/AgCl/KCl (3 M) with replaceable outer junction (3 M KCl) and a platinum wire as an auxiliary electrode. The results obtained with the film electrode were then compared with corresponding values obtained using the HMDE M163 (MTM-ANKO). pH measurements were performed with laboratory pH-meter (N-512 elpo, Polymetron, Poland). Stirring was performed using a magnetic bar rotating at approximately 500 rpm. All experiments were carried out at room temperature. The MTM-ANKO EAGRAPH software enabled electrochemical measurements, data acquisition, and advanced processing of the results.
2.2. Chemicals and glasswareAll reagents used were of analytical grade. An alkaline 0.1 M borate buffer (pH 9.0) was prepared by dissolving Na2B4O7•10H2O p.a. (POCh, Poland) and NaOH Suprapur® (Merck). A standard stock solution of papaverine (0.01 M) was prepared by dissolving papaverine hydrochloride powder obtained from Sigma. Triton X-100 was purchased from Windsor Laboratories Ltd, The silver base for the film electrode was prepared from polycrystalline silver wire with a diameter of 0.5 mm, and of 99.99% purity (Goodfellow Science Park, England). Prior to use, glassware was cleaned by immersion in a 1:10 aqueous solution of HNO3, followed by copious rinsing in distilled water. All experiments were carried out at room temperature.
2.3. Standard procedure of measurementsQuantitative measurements were performed using (DP AdSV) and the standard addition procedure. The procedure of refreshing the Hg(Ag)FE electrode was carried out before each measurement. The Hg(Ag)FE electrode conditioned in this way was used to determine papaverine in the supporting electrolyte: 0.005 M borate buffer (pH 9.0, total volume 10 mL) contained in a quartz voltammetric cell. During the accumulation step (Eacc = −375 mV for tacc = 30 s) papaverine was adsorbed while the solution was being stirred (ca. 500 rpm.) using a magnetic stirring bar. Then, after a rest period of 5 s a differential pulse voltammogram was recorded in the cathodic direction from −375 to
−1700 mV. The other experimental parameters were as follows: step potential, 4 mV; pulse potential, 75 mV; time step potential, 20 ms (10 ms waiting + 10 ms sampling time). The measurements were carried out from deaerated solutions with argon gas.
2.4. Sample preparation2.4.1. Liquid drugsFor DP AdSV determination of the papaverine in liquid drugs (Papaverinum hydrochloricum, WZF, Polfa – diluted twenty five-fold and fortestomachicae, Herbapol, Poland – diluted ten-fold) samples was transferred in 100 microliters volume directly into the voltammetric cell with supporting electrolyte. Next papaverine was determined with standard addition method.
2.4.2. Urine samplesThe fresh human urine was used without sample pretreatment. The volume of 50 and 100 µL spiked with papaverine was added directly into the voltammetric cell with supporting electrolyte. Next papaverine was determined with standard addition method.
3. Results and discussion
3.1. Renewable mercury film electrode Hg(Ag) FEThe adsorptive stripping voltammetric techniques are applicable for measuring traces of papaverine. This is due to its high sensitivity, reproducibility and linearity. Signals obtained for papaverine for Hg(Ag)FE as compared to HMDE are in Fig. 1. Papaverine peak current is about twice higher for the Hg(Ag)FE vs. the HMDE electrode (for comparable geometrical sizes of surfaces of working electrodes). The peak potentials were: −1475 mV for Hg(Ag)FE and −1507 mV for HMDE. Difference between peak potentials may be because of the influence of the depression of hydrogen overvoltage caused by silver amalgam and its catalytic effect on papaverine peak. The peak half width of the papaverine signal was 50 mV for Hg(Ag)FE and 35 mV for HMDE electrode. The reproducibility of papaverine signal was 3.3% (n=5, PAP conc. 50 nM). The dependence of PAP peak current on the surface of Hg(Ag)FE is presented in Fig. 2. The signal grows linearity vs. increase of surface of Hg(Ag)FE. For 100 nM of PAP the following equation could be obtained: Y = 0.148 ± 0.003 [μA mm−2] + 0.015 ± 0.020 [μA], r = 0.999.
In the work 9.1 mm2 geometrical surface area was used.
737
Sensitive and fast determination of papaverine by adsorptive stripping voltammetry on renewable mercury film electrode
3.2. Influence of the scan rate on papaverine peak current and peak potential The influence of the scan rate (v) on the peak current and peak potential at Hg(Ag)FE was investigated in the range of 20 mV s−1 to 500 mV s−1 (Fig. 3). The peak current vs. scan rate gave a straight line. The obtained linear regression equation is:
Ip = 0.03v + 1.91 [µA], r = 0.994
This suggests an adsorption-driven reduction process at the Hg(Ag)FE.
The cathodic peak potential was shifted in the negative direction with the increasing scan rate. The peak potential vs. ln scan rate gave a straight line. The obtained linear regression equation is:
Ek = –26lnv –1315 [mV], r = 0.992
Based on the theory for an irreversible electrode reaction from the slope of Ek vs. lnv, αn = 0.98 could be obtain and the number of the electron transfer for α assuming 0.5 could be calculate to 2.
3.3. Influence of DPV parameters on papaverine peakThe important parameters of the DPV technique are pulse amplitude (ΔE), potential step amplitude (Es), waiting time (tw) and sampling time (ts). Consequently, these parameters were investigated. To optimize the conditions for papaverine measurements, the following instrumental parameters were systematically varied: ∆E in the range 5 − 100 mV (both positive and negative mode), Es in the range 1 − 6 mV, tw and tp from 5 to 60 ms.
The best results were obtained for: pulse amplitude of 75 mV, step potential of 4 mV, waiting time and sampling time of 10 ms.
3.4. Influence of preconcentration potential and time on papaverine peakInfluence of preconcentration potential and time are always important factors on the sensitivity and detection limit of the method. Optimal preconcentration potential for papaverine determination in alkaline solution is in the wide range from 0 to −1100 mV (Fig. 4A). For preconcentration potentials lower than 0 mV and higher than −1100 mV the papaverine peak decreased significantly. For further work, the −375 mV of preconcentration potential was applied.
The changes in magnitude of the papaverine current vs. the preconcentration time are presented in Fig. 4B. The peak current for 100 nM and 200 nM of the papaverine increased with the increase of the preconcentration time from 0.05 µA and 0.21 µA (tacc = 0 s) to 2.99 µA and 3.82 µA (tacc = 120 s) respectively. For the preconcentration time of 90 s and higher (100 nM papaverine) or 60 s and higher (200 nM papaverine), the observed efficiency of the preconcentration decreased. The papaverine peak potential is dependent on either the preconcentration potential (the peak potential shifted from −1475 mV for Ed = −375 mV to −1520 mV for Ed = −1400 mV) and the preconcentration time (from −1510 mV (0 s) to −1459 mV (120 s)) respectively.
Figure 1. Comparison of voltammograms obtained for 100 nM papaverine in 0.005 M borate buffer (pH of base electrolyte 9.0) for HMDE and Hg(Ag)FE electrode. The electrode areas were 3.1 mm2 for the (Hg(Ag)FE) and 3 mm2 for the HMDE. Instrumental parameters: ΔE = 75 mV, Es = 4 mV, tp,tw = 10 ms, preconcentration potential Eacc = –375 mV, preconcentration time tacc = 30 s. Stirring rate 500 rpm.
Figure 2. Voltammograms obtained for electrode surface area: (1) − 3.1; (2) − 5.1; (3) − 7.1; (4) − 9.1; (5) − 11.1 mm2 for 100 nM papaverine in 0.005 M borate buffer (pH of base electrolyte 9.0). All other conditions are as in Fig. 1.
738
R. Piech, B. Paczosa-Bator
3.5. Influence of pH on papaverine peakDetermination of the papaverine requires alkaline conditions. In the Fig. 5. the effect of the pH on the papaverine peak current is presented. For the value of pH equal to 10 the papaverine peak current was 0.51 μA and grows for more acidic conditions. The best results were obtained for pH in the range of 9.15 – 8.7 (PAP peak current approx. 1.3 μA). Lower alkaline conditions caused a decrease in the peak current and significant increase in the background current, e.g. for the pH of 8.0 the peak current was 1.1 μA. The pH influence on the peak potential was also observed. The PAP peak shifts to positive potentials for less alkaline supporting electrolyte from −1499 mV (pH 10) to −1463 mV (pH 8). It may be caused by the catalytic effect of hydrogen on papaverine peak. For further measurements, the pH of 9.0 was applied.
3.6. InterferencesThe examined ions, such as: Ca(II), Mg(II) in a 1000-fold excess and Fe(III), Zn(II), V(V), Mo(VI), Pb(II), Cd(II), Sb(III) in a 20-fold excess did not interfere. However, it was observed that for Mn(II) ions in a 20-fold or 10-fold excess interpretation of the papaverine signal was difficult because of their similar peak potentials. In the case of Cu(II) ions in a 20-fold excess the papaverine peak current decreased by 15%. The interferences from Mn(II) and Cu(II) ions could be easily eliminated by the addition to the supporting electrolyte HEDTA (N-(hydroxyethyl)-ethylenediaminetriacetic acid) e.g. 0.2 mM (recovery of papaverine signal - 100% and no suppress of papaverine signal was observed). Organic compounds such as: citric acid in a 20-fold excess, ascorbic acid in a 20-fold excess, and glucose 10 µg mL-1 did not interfere.
The surface-active compounds are usually a source of strong interferences in voltammetric methods. A non-ionic surface-active compound (Triton X-100) was investigated in this respect. For 0.05 mg L−1 of Triton X-100 concentration, no suppress of the signal was observed. However, it was observed that for 0.1 mg L−1 Triton X-100 concentration the papaverine signal decreased by 5% and for 0.25 mg L−1 of Triton X-100 by 25%, for 0.5 mg L−1 of Triton X-100 by 90%, and for 1 mg L−1 of Triton X-100 the signal dropped to 0 µA.
3.7. Analytical performanceThe DP AdSV papaverine calibration curves for the preconcentration time of 60; 30 and 15 s are presented in Fig. 6.
The detection limit obtained for the short preconcentration time (15 s) was 4 nM and the linearity
Figure 3. Linear sweep voltammograms for 10 µM papaverine in 0.005 M borate buffer (pH of base electrolyte 9.0). Scan rate: (1) – 20; (2) – 50; (3) – 100; (4) – 250; (5) – 500 mV s−1.
Figure 4. (A) Dependence of the peak current on preconcentration potential in the range from 100 to −1450 mV for 100 nM papaverine, (B) dependence of the peak current on preconcentration time in the range from 0 to 120 s for (a) − 100 and (b) − 200 nM papaverine in 0.005 M borate buffer (pH of base electrolyte 9.0). All other conditions are as in Fig. 1.
Figure 5. Dependence of the peak current on pH in the range from 8 to 10 for 100 nM papaverine in 0.005 M borate buffer and obtained voltammograms for (1) – 10; (2) – 9.4; (3) – 9.0 and (4) – 8.0 pH. All other conditions are as in Fig. 1.
739
Sensitive and fast determination of papaverine by adsorptive stripping voltammetry on renewable mercury film electrode
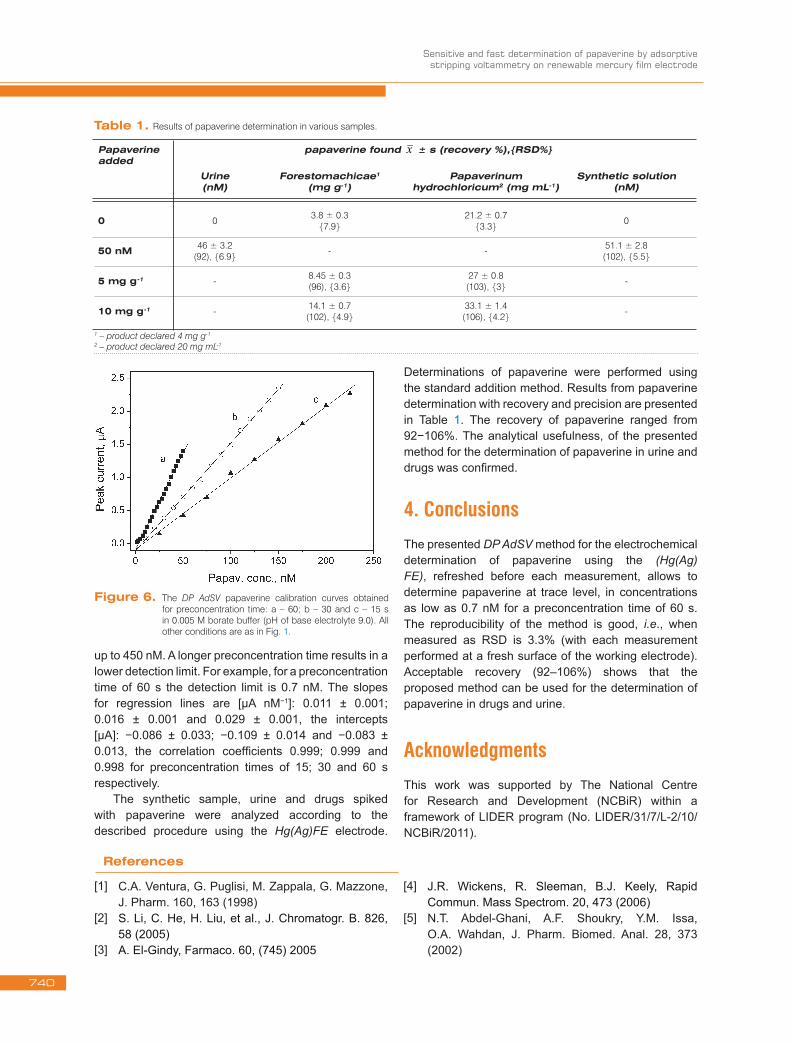
up to 450 nM. A longer preconcentration time results in a lower detection limit. For example, for a preconcentration time of 60 s the detection limit is 0.7 nM. The slopes for regression lines are [µA nM−1]: 0.011 ± 0.001; 0.016 ± 0.001 and 0.029 ± 0.001, the intercepts [µA]: −0.086 ± 0.033; −0.109 ± 0.014 and −0.083 ± 0.013, the correlation coefficients 0.999; 0.999 and 0.998 for preconcentration times of 15; 30 and 60 s respectively.
The synthetic sample, urine and drugs spiked with papaverine were analyzed according to the described procedure using the Hg(Ag)FE electrode.
Determinations of papaverine were performed using the standard addition method. Results from papaverine determination with recovery and precision are presented in Table 1. The recovery of papaverine ranged from 92−106%. The analytical usefulness, of the presented method for the determination of papaverine in urine and drugs was confirmed.
4. ConclusionsThe presented DP AdSV method for the electrochemical determination of papaverine using the (Hg(Ag)FE), refreshed before each measurement, allows to determine papaverine at trace level, in concentrations as low as 0.7 nM for a preconcentration time of 60 s. The reproducibility of the method is good, i.e., when measured as RSD is 3.3% (with each measurement performed at a fresh surface of the working electrode). Acceptable recovery (92–106%) shows that the proposed method can be used for the determination of papaverine in drugs and urine.
AcknowledgmentsThis work was supported by The National Centre for Research and Development (NCBiR) within a framework of LIDER program (No. LIDER/31/7/L-2/10/NCBiR/2011).
Figure 6. The DP AdSV papaverine calibration curves obtained for preconcentration time: a – 60; b – 30 and c – 15 s in 0.005 M borate buffer (pH of base electrolyte 9.0). All other conditions are as in Fig. 1.
Table 1. Results of papaverine determination in various samples.
C.A. Ventura, G. Puglisi, M. Zappala, G. Mazzone, J. Pharm. 160, 163 (1998)S. Li, C. He, H. Liu, et al., J. Chromatogr. B. 826, 58 (2005)A. El-Gindy, Farmaco. 60, (745) 2005
J.R. Wickens, R. Sleeman, B.J. Keely, Rapid Commun. Mass Spectrom. 20, 473 (2006)N.T. Abdel-Ghani, A.F. Shoukry, Y.M. Issa, O.A. Wahdan, J. Pharm. Biomed. Anal. 28, 373 (2002)
[1]
[2]
[3]
[4]
[5]
740
R. Piech, B. Paczosa-Bator
E.E. Karibyan, I.P. Shesterova, Sh. T. Talipov, Zh. Anal. Khim. 34, 1354 (1979) (in Russian)S. Zhang, Y. Zhuang, H. Ju, Anal. Lett. 37, 143 (2004)Y.F. Zhuang, S.C. Zhang, J.S. Yu, H. X. Ju, Anal. Bioanal. Chem. 375, 281 (2003)F. Wei, M. Zhang, Y.Q. Feng, Electrophoresis 27, 1939 (2006)M.M. Reddy, V. Suresh, G. Jayashanker, et al., Electrophoresis 24, 1437 (2003)S.C. Pinzaru, N. Leapold, I. Pavel, W. Kiefer, Spectrochim. Acta A: Mol. Biomol. Spectrosc. 60, 2021 (2004)M. Eisman, M. Gallego, M. Varcarcel, J. Pharm. Biomed. Anal. 12, 179 (1994)I.F. Abdullin, G.K. Budnikov, G.Yu. Nafikova, R.M. Badretdenova, Zh. Anal. Khim. 49, 773 (1994) (in Russian)W.J. Cabrera, M.A. Kaempfe, M.D. Urzúa, H.E. Rios, J. Colloid. Interface Sci. 295, 155 (2006)M. Kuznetsova, S. Kartamyshev, S. Ryasenskii, I. Gorelov, Khim.-Farm. Zh. 39, 42 (2005) (in Russian)B. Magnuszewska, J. Ostrowska, Z. Figaszewski, Chem. Anal. (Warsaw) 45, 105 (2000)C. Eppelsheim, R. Aubeck, N. Hampp, C. Brauchle, Analyst 116, 1001 (1991)
R. Kalvoda, Anal. Chim. Acta. 162, 197 (1984)Y.H. Zeng, G.R. Zhang, Fenxi Huaxue 23, 1137 (1995)G.K. Ziyatdinova, A.I. Samigulin, G.K. Budnikov, J. Anal. Chem. 56, 457 (2007)B. Baś, Z. Kowalski, Electroanalysis 14, 1067 (2002)B. Baś, Anal. Chim. Acta 570, 195 (2006)P. Kapturski, A. Bobrowski, J. Electroanal. Chem. 617, 1 (2008)P. Kapturski, A. Bobrowski, Electroanalysis 19, 1863 (2007)R. Piech, B. Baś, W.W. Kubiak, Talanta 76, 295 (2008)R. Piech, B. Baś, W.W. Kubiak, Electroanalysis 19, 2342 (2007)A. Bobrowski, M. Gawlicki, P. Kapturski, V. Mirceski, F. Spasovski, J. Zarębski Electroanalysis 21, 36 (2009)R. Piech, Electroanalysis 22, 1851 (2010)S. Skrzypek, Electroanalysis 23, 2781 (2011)S. Skrzypek, S. Smarzewska, W. Ciesielski, Electroanalysis 24, 1153 (2012)S. Smarzewska, S. Skrzypek, W. Ciesielski, Electroanalysis 24, 1591 (2012)M. Brycht, O. Vajdle, J. Zbiljić, Z. Papp, V. Guzsvány, S. Skrzypek, Int. J. Electrochem. Sci. 7, 10652 (2012)