Sensitivity and uncertainty in flood inundation modelling – conceptof an analysis framework
T. Weichel1, F. Pappenberger2, and K. Schulz1
1Helmholtz Centre for Environmental Research – UFZ, Dept. for Computational Landscape Ecology, Permoserstr. 15, 04318Leipzig, Germany2European Centre for Medium-Range Weather Forecasts, Shinfield Park, Reading, RG2 9AX, UK
Received: 15 January 2007 – Revised: 11 April 2007 – Accepted: 4 May 2007 – Published: 16 May 2007
Abstract. After the extreme flood event of the Elbe in 2002the definition of flood risk areas by law and their simulationbecame more important in Germany. This paper describes aconcept of an analysis framework to improve the localisationand duration of validity of flood inundation maps. The two-dimensional finite difference model TrimR2D is used andlinked to a Monte-Carlo routine for parameter sampling aswell as to selected performance measures. The purpose isthe investigation of the impact of different spatial resolutionsand the influence of changing land uses in the simulationof flood inundation areas. The technical assembling of theframework is realised and beside the model calibration, firsttests with different parameter ranges were done. Preliminaryresults show good correlations with observed data, but theinvestigation of shifting land uses reflects only poor changesin the flood extension.
1 Introduction
After the extreme flood event of the Elbe river in 2002(DKKV, 2004) the German Water Resources Act was en-hanced through the paragraphs §31b and §31c (Bundesre-publik Deutschland, 2005). Because of a total loss of morethan 9 billion euros in Germany a comprehensive localisa-tion of the potential flood risk areas was finalised. In thisapproach the authors focus on two main points in the simu-lation of potential flooded areas. Besides the integration ofdetailed topographic data the influence of on-site land usechanges are investigated. However, there are still major re-search challenges in the flood inundation modelling that needto be addressed like the problem of the spatial resolutionand derivation of effective model parameterisations (Bateset al., 2006; Hengl 2005). Due to the general development
of the airborne laser altimeter technology, detailed data witha spatial resolution lower than 1 m and a high horizontaland vertical accuracy (<0.2 m) are available for the hydrody-namic modelling. The increasing computer capabilities offera better application of such large data volumes too. There-fore the use of these data in the flood inundation modellingwith a detailed representation of the topography leads to thequestion of the required accuracy concerning the aspired re-sults (Hengl, 2005). Furthermore the impact of distributedland use types described through roughness values is alsodiscussed (Pappenberger et al., 2005; Werner et al., 2005).Whereas Werner et al. (2005) came to the result that the im-pact of distributed floodplain roughness values is restrictedto the dominant land use. But how far land use changes,especially in urban areas, follow this result or show othertendencies will researched in this study. First historical andlater possible future changes will be integrated in the simu-lation of inundation maps. If it’s possible to achieve a sus-tained success with this approach the reliability of the simu-lated inundation areas could be improved. These limitationsstill introduce a significant amount of uncertainties into anyprediction of potential flood risk thereby hampering any con-sequent planning or decision making process. Especially ur-ban areas require effective and differentiated approaches forthe modelling of flood risk areas due to the accumulation ofmonetary values (DKKV, 2004). The uncertainty and sensi-tivity analysis as methodical tools provide a general basis ofmodel evaluation (Aronica et al., 2002; Crosetto et al., 2000;Pappenberger et al., 2005).
2 Investigation site an available data
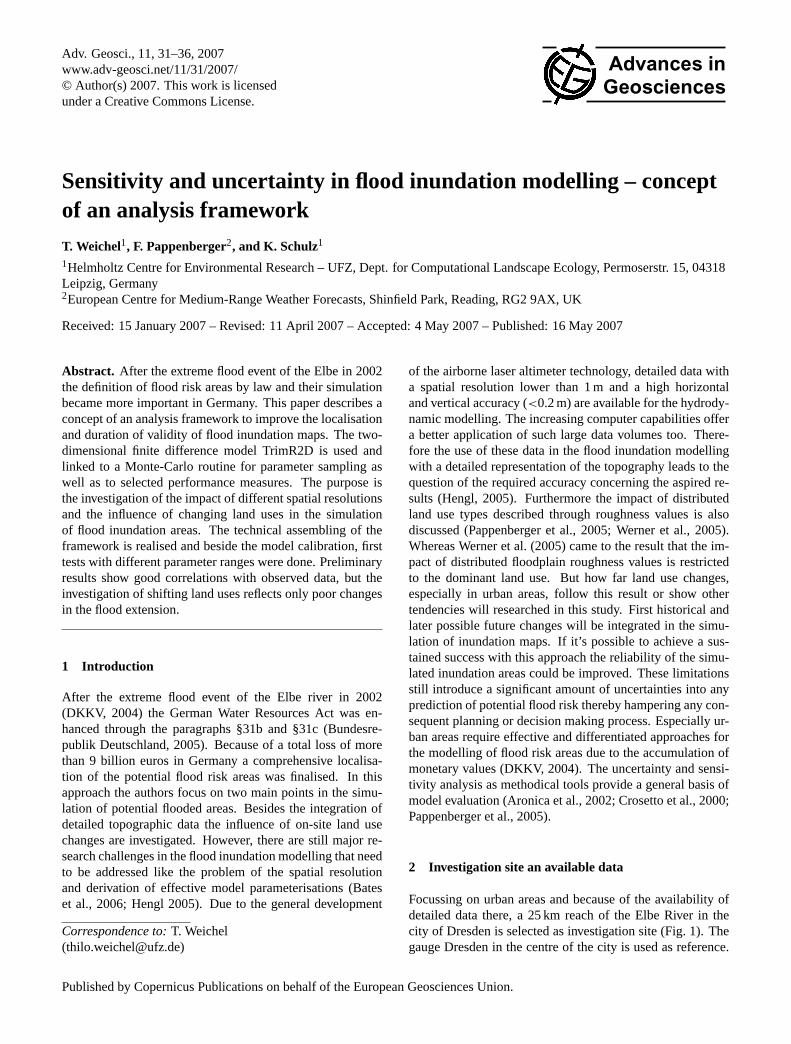
Focussing on urban areas and because of the availability ofdetailed data there, a 25 km reach of the Elbe River in thecity of Dresden is selected as investigation site (Fig. 1). Thegauge Dresden in the centre of the city is used as reference.
Published by Copernicus Publications on behalf of the European Geosciences Union.
32 T. Weichel et al.: Sensitivity and uncertainty in flood inundation modelling
Fig. 1. Investigation site Dresden with flood extent (EnvironmentalAgency Dresden).
Values of discharge and water level are hourly available bythe Water and Shipping Authority. Tributaries are ignored.The used topographic data based on a digital elevation model(DEM), made by airborne laser scanning. The river channelis separate measured by the German Federal Institute of Hy-drology. Both data are useable with a spatial resolution ofone meter. The observed flood extension during the floodpeak (17.08.2002) is prepared by airborne photographs andlocal watching. The distributed roughness is deduced fromthe “Biotoptypenkartierung” (scale 1:10.000). Further datalike sandbag defence lines, building polygons or potential in-undation maps by law are available by the local authority En-vironmental Agency as soon as the background informationabout the data.
3 Objectives
Based on the questions, how detailed flood inundation mapshave to be and for what time period they are valid, the fol-lowing objectives are addressed.
I. Evaluation of the spatial scale depended parameter sen-sitivity concerning to the quality of model predictions.
The purpose is the estimation of the most effective spatialresolution of the used parameters as well as the definition oftheir ranges relative to the required spatial scale (Bates et al.,2006; Hengl, 2006). Because different detailed inundationmaps, like in spatial scale of 1:5000 or 1:100 000 should ob-tain an adapted spatial resolution of their simulation input,especially the DEM.
II. Analysis of the impact of land use changes, includingtheir spatiotemporal dynamics of land surface properties onthe modelling of flood inundation areas.
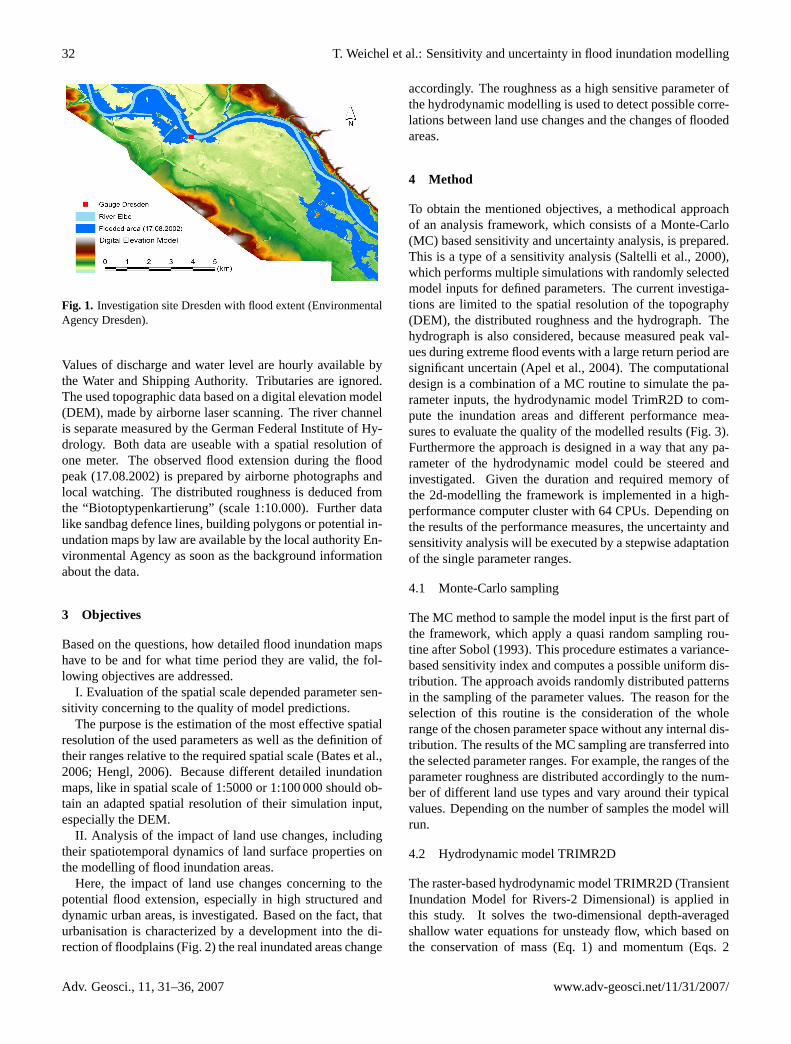
Here, the impact of land use changes concerning to thepotential flood extension, especially in high structured anddynamic urban areas, is investigated. Based on the fact, thaturbanisation is characterized by a development into the di-rection of floodplains (Fig. 2) the real inundated areas change
accordingly. The roughness as a high sensitive parameter ofthe hydrodynamic modelling is used to detect possible corre-lations between land use changes and the changes of floodedareas.
4 Method
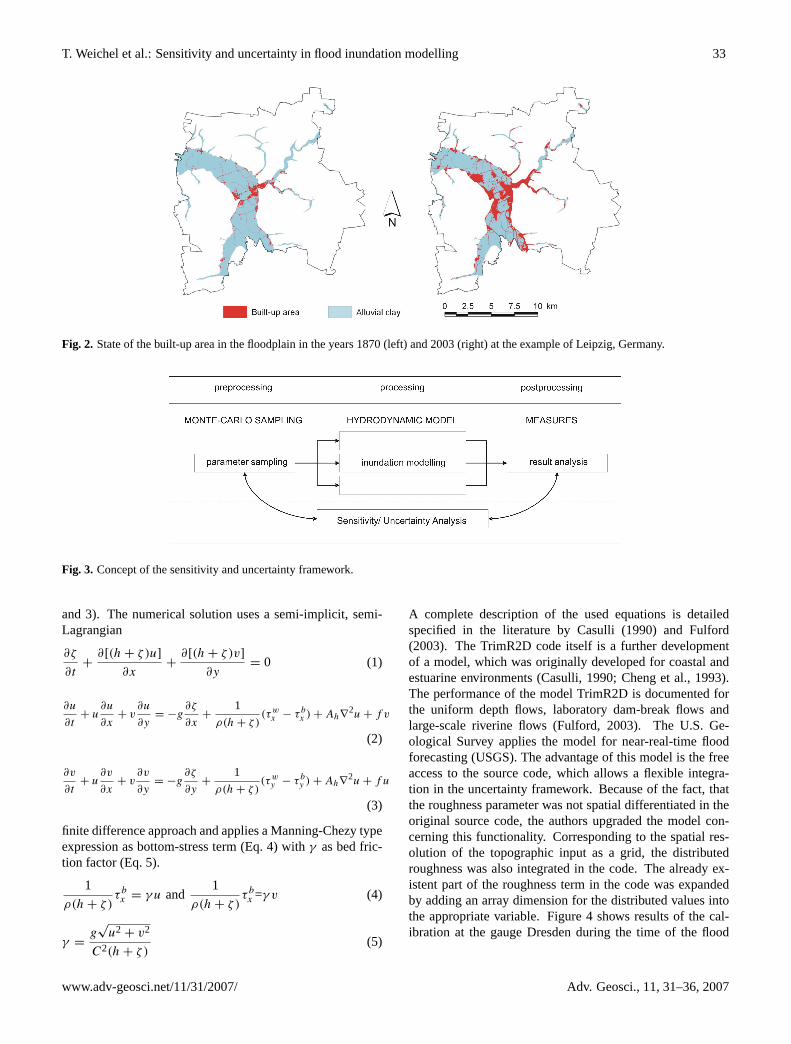
To obtain the mentioned objectives, a methodical approachof an analysis framework, which consists of a Monte-Carlo(MC) based sensitivity and uncertainty analysis, is prepared.This is a type of a sensitivity analysis (Saltelli et al., 2000),which performs multiple simulations with randomly selectedmodel inputs for defined parameters. The current investiga-tions are limited to the spatial resolution of the topography(DEM), the distributed roughness and the hydrograph. Thehydrograph is also considered, because measured peak val-ues during extreme flood events with a large return period aresignificant uncertain (Apel et al., 2004). The computationaldesign is a combination of a MC routine to simulate the pa-rameter inputs, the hydrodynamic model TrimR2D to com-pute the inundation areas and different performance mea-sures to evaluate the quality of the modelled results (Fig. 3).Furthermore the approach is designed in a way that any pa-rameter of the hydrodynamic model could be steered andinvestigated. Given the duration and required memory ofthe 2d-modelling the framework is implemented in a high-performance computer cluster with 64 CPUs. Depending onthe results of the performance measures, the uncertainty andsensitivity analysis will be executed by a stepwise adaptationof the single parameter ranges.
4.1 Monte-Carlo sampling
The MC method to sample the model input is the first part ofthe framework, which apply a quasi random sampling rou-tine after Sobol (1993). This procedure estimates a variance-based sensitivity index and computes a possible uniform dis-tribution. The approach avoids randomly distributed patternsin the sampling of the parameter values. The reason for theselection of this routine is the consideration of the wholerange of the chosen parameter space without any internal dis-tribution. The results of the MC sampling are transferred intothe selected parameter ranges. For example, the ranges of theparameter roughness are distributed accordingly to the num-ber of different land use types and vary around their typicalvalues. Depending on the number of samples the model willrun.
4.2 Hydrodynamic model TRIMR2D
The raster-based hydrodynamic model TRIMR2D (TransientInundation Model for Rivers-2 Dimensional) is applied inthis study. It solves the two-dimensional depth-averagedshallow water equations for unsteady flow, which based onthe conservation of mass (Eq. 1) and momentum (Eqs. 2
T. Weichel et al.: Sensitivity and uncertainty in flood inundation modelling 33
Fig. 2. State of the built-up area in the floodplain in the years 1870 (left) and 2003 (right) at the example of Leipzig, Germany.
Fig. 3. Concept of the sensitivity and uncertainty framework.
and 3). The numerical solution uses a semi-implicit, semi-Lagrangian
∂ζ
∂t+
∂[(h + ζ )u]
∂x+
∂[(h + ζ )v]
∂y= 0 (1)
∂u
∂t+ u
∂u
∂x+ v
∂u
∂y= −g
∂ζ
∂x+
1
ρ(h + ζ )(τw
x − τ bx ) + Ah∇
2u + f v
(2)
∂v
∂t+ u
∂v
∂x+ v
∂v
∂y= −g
∂ζ
∂y+
1
ρ(h + ζ )(τw
y − τ by ) + Ah∇
2u + f u
(3)
finite difference approach and applies a Manning-Chezy typeexpression as bottom-stress term (Eq. 4) withγ as bed fric-tion factor (Eq. 5).
1
ρ(h + ζ )τ bx = γ u and
1
ρ(h + ζ )τ bx =γ v (4)
γ =g√
u2 + v2
C2(h + ζ )(5)
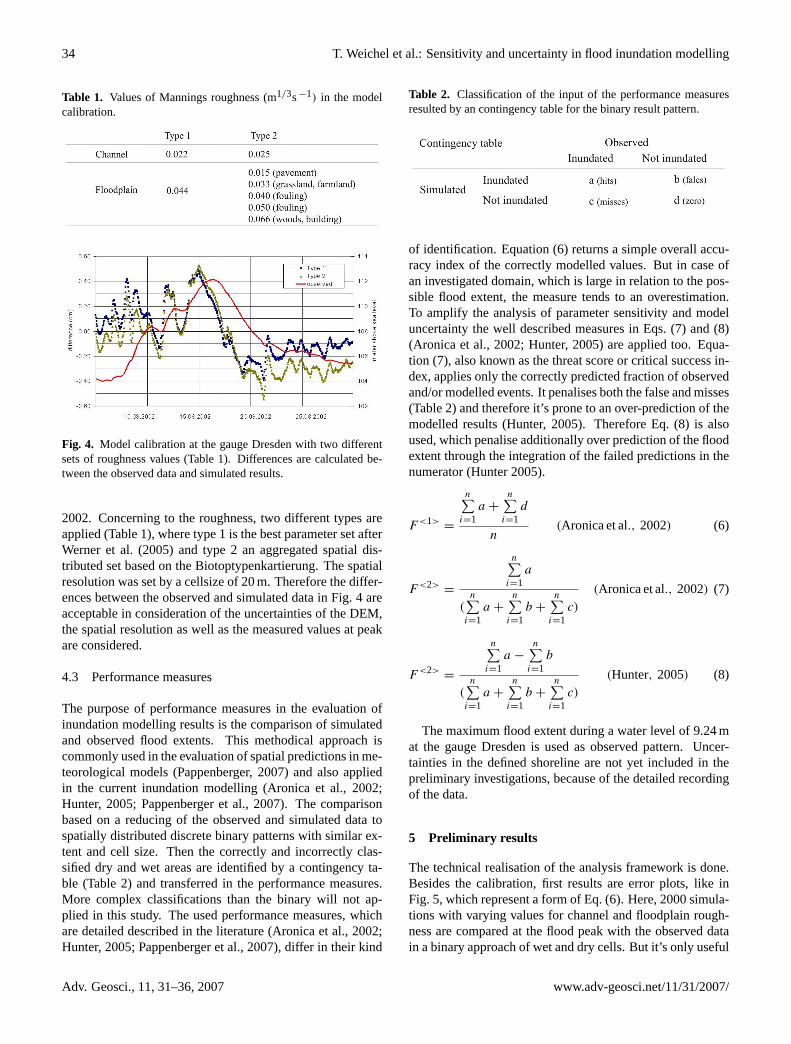
A complete description of the used equations is detailedspecified in the literature by Casulli (1990) and Fulford(2003). The TrimR2D code itself is a further developmentof a model, which was originally developed for coastal andestuarine environments (Casulli, 1990; Cheng et al., 1993).The performance of the model TrimR2D is documented forthe uniform depth flows, laboratory dam-break flows andlarge-scale riverine flows (Fulford, 2003). The U.S. Ge-ological Survey applies the model for near-real-time floodforecasting (USGS). The advantage of this model is the freeaccess to the source code, which allows a flexible integra-tion in the uncertainty framework. Because of the fact, thatthe roughness parameter was not spatial differentiated in theoriginal source code, the authors upgraded the model con-cerning this functionality. Corresponding to the spatial res-olution of the topographic input as a grid, the distributedroughness was also integrated in the code. The already ex-istent part of the roughness term in the code was expandedby adding an array dimension for the distributed values intothe appropriate variable. Figure 4 shows results of the cal-ibration at the gauge Dresden during the time of the flood
34 T. Weichel et al.: Sensitivity and uncertainty in flood inundation modelling
Table 1. Values of Mannings roughness (m1/3s−1) in the modelcalibration.
Fig. 4. Model calibration at the gauge Dresden with two differentsets of roughness values (Table 1). Differences are calculated be-tween the observed data and simulated results.
2002. Concerning to the roughness, two different types areapplied (Table 1), where type 1 is the best parameter set afterWerner et al. (2005) and type 2 an aggregated spatial dis-tributed set based on the Biotoptypenkartierung. The spatialresolution was set by a cellsize of 20 m. Therefore the differ-ences between the observed and simulated data in Fig. 4 areacceptable in consideration of the uncertainties of the DEM,the spatial resolution as well as the measured values at peakare considered.
4.3 Performance measures
The purpose of performance measures in the evaluation ofinundation modelling results is the comparison of simulatedand observed flood extents. This methodical approach iscommonly used in the evaluation of spatial predictions in me-teorological models (Pappenberger, 2007) and also appliedin the current inundation modelling (Aronica et al., 2002;Hunter, 2005; Pappenberger et al., 2007). The comparisonbased on a reducing of the observed and simulated data tospatially distributed discrete binary patterns with similar ex-tent and cell size. Then the correctly and incorrectly clas-sified dry and wet areas are identified by a contingency ta-ble (Table 2) and transferred in the performance measures.More complex classifications than the binary will not ap-plied in this study. The used performance measures, whichare detailed described in the literature (Aronica et al., 2002;Hunter, 2005; Pappenberger et al., 2007), differ in their kind
Table 2. Classification of the input of the performance measuresresulted by an contingency table for the binary result pattern.
of identification. Equation (6) returns a simple overall accu-racy index of the correctly modelled values. But in case ofan investigated domain, which is large in relation to the pos-sible flood extent, the measure tends to an overestimation.To amplify the analysis of parameter sensitivity and modeluncertainty the well described measures in Eqs. (7) and (8)(Aronica et al., 2002; Hunter, 2005) are applied too. Equa-tion (7), also known as the threat score or critical success in-dex, applies only the correctly predicted fraction of observedand/or modelled events. It penalises both the false and misses(Table 2) and therefore it’s prone to an over-prediction of themodelled results (Hunter, 2005). Therefore Eq. (8) is alsoused, which penalise additionally over prediction of the floodextent through the integration of the failed predictions in thenumerator (Hunter 2005).
F<1>=
n∑i=1
a +
n∑i=1
d
n(Aronica et al., 2002) (6)
F<2>=
n∑i=1
a
(n∑
i=1a +
n∑i=1
b +
n∑i=1
c)
(Aronica et al., 2002) (7)
F<2>=
n∑i=1
a −
n∑i=1
b
(n∑
i=1a +
n∑i=1
b +
n∑i=1
c)
(Hunter, 2005) (8)
The maximum flood extent during a water level of 9.24 mat the gauge Dresden is used as observed pattern. Uncer-tainties in the defined shoreline are not yet included in thepreliminary investigations, because of the detailed recordingof the data.
5 Preliminary results
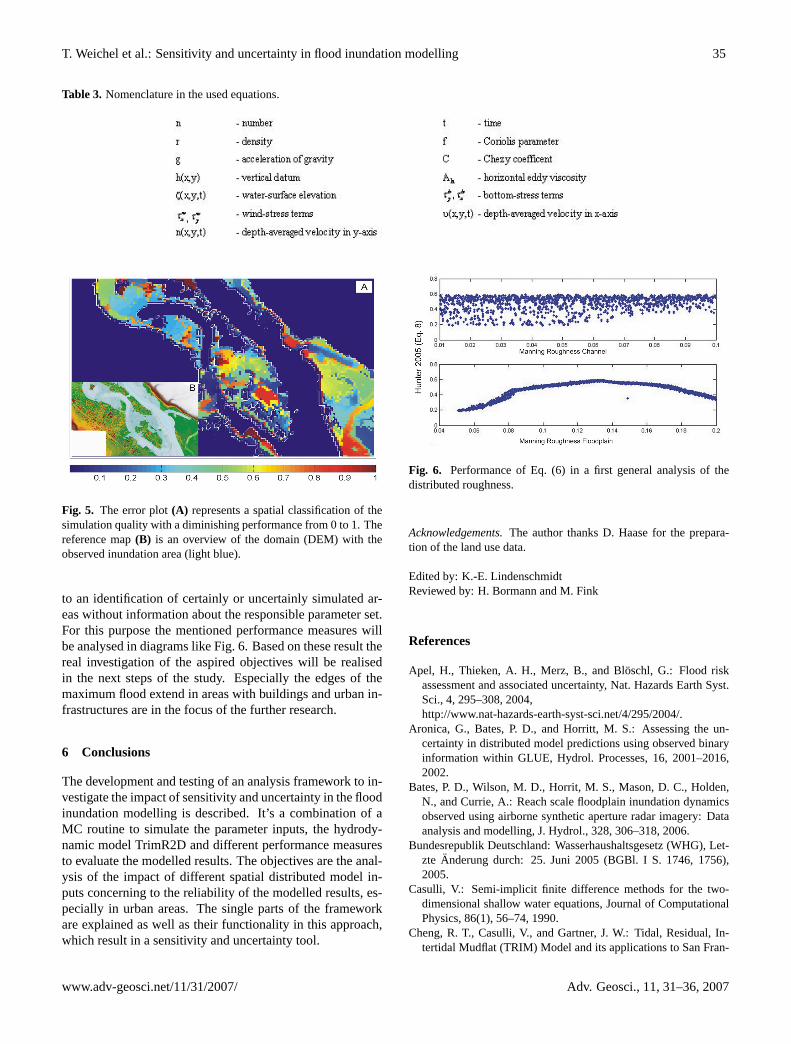
The technical realisation of the analysis framework is done.Besides the calibration, first results are error plots, like inFig. 5, which represent a form of Eq. (6). Here, 2000 simula-tions with varying values for channel and floodplain rough-ness are compared at the flood peak with the observed datain a binary approach of wet and dry cells. But it’s only useful
T. Weichel et al.: Sensitivity and uncertainty in flood inundation modelling 35
Table 3. Nomenclature in the used equations.
Fig. 5. The error plot(A) represents a spatial classification of thesimulation quality with a diminishing performance from 0 to 1. Thereference map(B) is an overview of the domain (DEM) with theobserved inundation area (light blue).
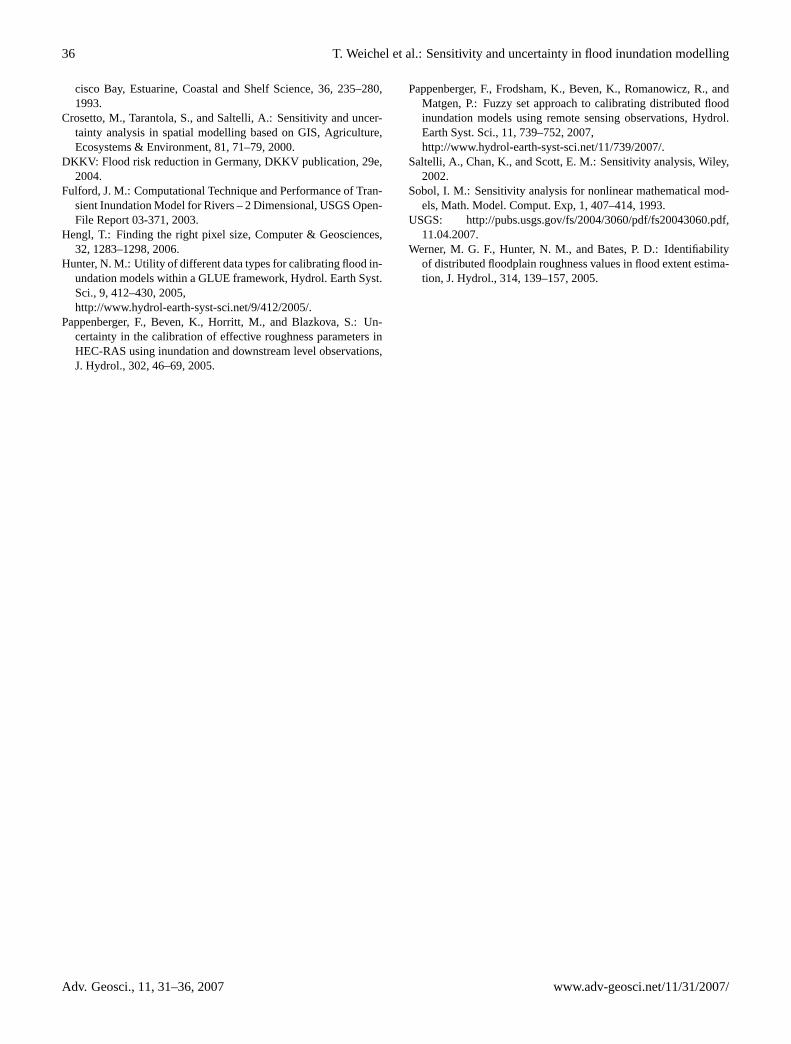
to an identification of certainly or uncertainly simulated ar-eas without information about the responsible parameter set.For this purpose the mentioned performance measures willbe analysed in diagrams like Fig. 6. Based on these result thereal investigation of the aspired objectives will be realisedin the next steps of the study. Especially the edges of themaximum flood extend in areas with buildings and urban in-frastructures are in the focus of the further research.
6 Conclusions
The development and testing of an analysis framework to in-vestigate the impact of sensitivity and uncertainty in the floodinundation modelling is described. It’s a combination of aMC routine to simulate the parameter inputs, the hydrody-namic model TrimR2D and different performance measuresto evaluate the modelled results. The objectives are the anal-ysis of the impact of different spatial distributed model in-puts concerning to the reliability of the modelled results, es-pecially in urban areas. The single parts of the frameworkare explained as well as their functionality in this approach,which result in a sensitivity and uncertainty tool.
Fig. 6. Performance of Eq. (6) in a first general analysis of thedistributed roughness.
Acknowledgements.The author thanks D. Haase for the prepara-tion of the land use data.
Edited by: K.-E. LindenschmidtReviewed by: H. Bormann and M. Fink
References
Apel, H., Thieken, A. H., Merz, B., and Bloschl, G.: Flood riskassessment and associated uncertainty, Nat. Hazards Earth Syst.Sci., 4, 295–308, 2004,http://www.nat-hazards-earth-syst-sci.net/4/295/2004/.
Aronica, G., Bates, P. D., and Horritt, M. S.: Assessing the un-certainty in distributed model predictions using observed binaryinformation within GLUE, Hydrol. Processes, 16, 2001–2016,2002.
Bates, P. D., Wilson, M. D., Horrit, M. S., Mason, D. C., Holden,N., and Currie, A.: Reach scale floodplain inundation dynamicsobserved using airborne synthetic aperture radar imagery: Dataanalysis and modelling, J. Hydrol., 328, 306–318, 2006.
Bundesrepublik Deutschland: Wasserhaushaltsgesetz (WHG), Let-zte Anderung durch: 25. Juni 2005 (BGBl. I S. 1746, 1756),2005.
Casulli, V.: Semi-implicit finite difference methods for the two-dimensional shallow water equations, Journal of ComputationalPhysics, 86(1), 56–74, 1990.
Cheng, R. T., Casulli, V., and Gartner, J. W.: Tidal, Residual, In-tertidal Mudflat (TRIM) Model and its applications to San Fran-
36 T. Weichel et al.: Sensitivity and uncertainty in flood inundation modelling
cisco Bay, Estuarine, Coastal and Shelf Science, 36, 235–280,1993.
Crosetto, M., Tarantola, S., and Saltelli, A.: Sensitivity and uncer-tainty analysis in spatial modelling based on GIS, Agriculture,Ecosystems & Environment, 81, 71–79, 2000.
DKKV: Flood risk reduction in Germany, DKKV publication, 29e,2004.
Fulford, J. M.: Computational Technique and Performance of Tran-sient Inundation Model for Rivers – 2 Dimensional, USGS Open-File Report 03-371, 2003.
Hengl, T.: Finding the right pixel size, Computer & Geosciences,32, 1283–1298, 2006.
Hunter, N. M.: Utility of different data types for calibrating flood in-undation models within a GLUE framework, Hydrol. Earth Syst.Sci., 9, 412–430, 2005,http://www.hydrol-earth-syst-sci.net/9/412/2005/.
Pappenberger, F., Beven, K., Horritt, M., and Blazkova, S.: Un-certainty in the calibration of effective roughness parameters inHEC-RAS using inundation and downstream level observations,J. Hydrol., 302, 46–69, 2005.
Pappenberger, F., Frodsham, K., Beven, K., Romanowicz, R., andMatgen, P.: Fuzzy set approach to calibrating distributed floodinundation models using remote sensing observations, Hydrol.Earth Syst. Sci., 11, 739–752, 2007,http://www.hydrol-earth-syst-sci.net/11/739/2007/.
Saltelli, A., Chan, K., and Scott, E. M.: Sensitivity analysis, Wiley,2002.
Sobol, I. M.: Sensitivity analysis for nonlinear mathematical mod-els, Math. Model. Comput. Exp, 1, 407–414, 1993.
Werner, M. G. F., Hunter, N. M., and Bates, P. D.: Identifiabilityof distributed floodplain roughness values in flood extent estima-tion, J. Hydrol., 314, 139–157, 2005.