+ All Categories
Home > Documents > Sensory Analysis techniques for materials selection in the ... · Sensory Analysis techniques for...

Sensory Analysis techniques for materials selection in the ... · Sensory Analysis techniques for...

Date post: 15-Oct-2019
Category:
Upload: others
View: 17 times
Download: 0 times
Share this document with a friend
1
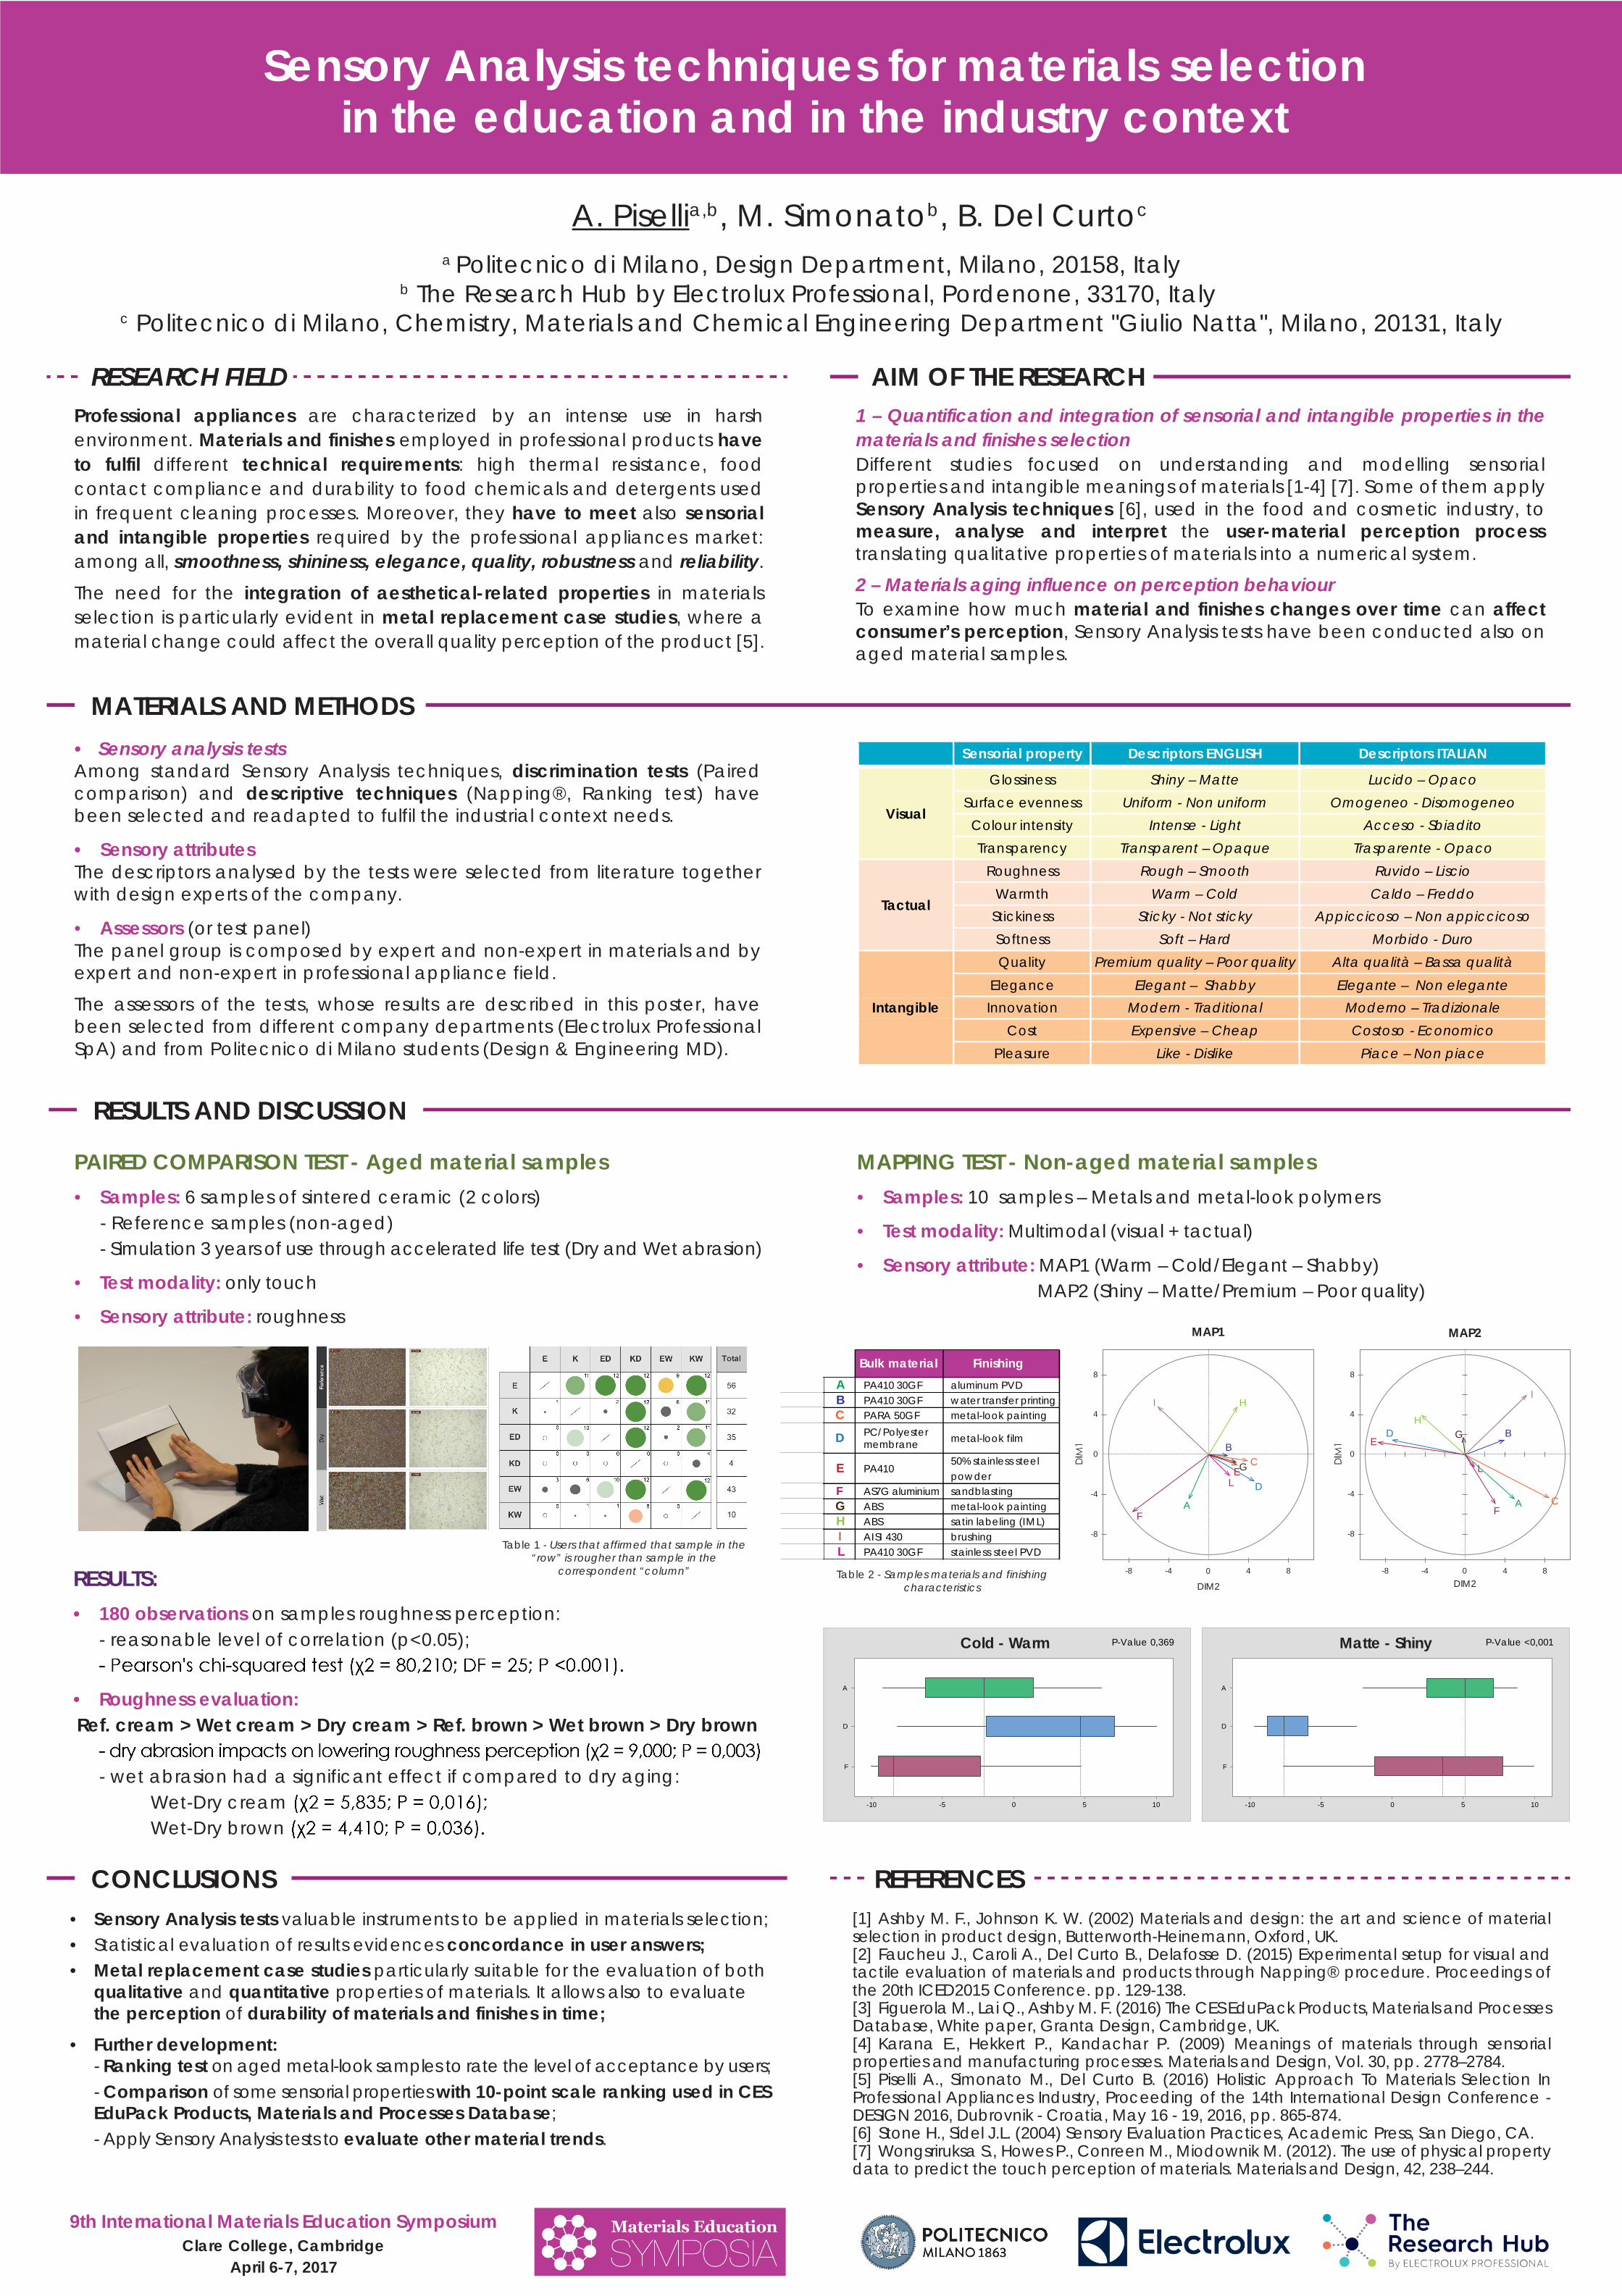
REFERENCES Sensory Analysis techniques for materials selection in the education and in the industry context a Politecnico di Milano, Design Department, Milano, 20158, Italy b The Research Hub by Electrolux Professional, Pordenone, 33170, Italy c Politecnico di Milano, Chemistry, Materials and Chemical Engineering Department "Giulio Natta", Milano, 20131, Italy Professional appliances are characterized by an intense use in harsh environment. Materials and finishes employed in professional products have to fulfil different technical requirements: high thermal resistance, food contact compliance and durability to food chemicals and detergents used in frequent cleaning processes. Moreover, they have to meet also sensorial and intangible properties required by the professional appliances market: among all, smoothness, shininess, elegance, quality, robustness and reliability. The need for the integration of aesthetical-related properties in materials selection is particularly evident in metal replacement case studies, where a material change could affect the overall quality perception of the product [5]. Sensory Analysis tests valuable instruments to be applied in materials selection; • Statistical evaluation of results evidences concordance in user answers; Metal replacement case studies particularly suitable for the evaluation of both qualitative and quantitative properties of materials. It allows also to evaluate the perception of durability of materials and finishes in time; Further development: - Ranking test on aged metal-look samples to rate the level of acceptance by users; - Comparison of some sensorial properties with 10-point scale ranking used in CES EduPack Products, Materials and Processes Database; - Apply Sensory Analysis tests to evaluate other material trends. [1] Ashby M. F., Johnson K. W. (2002) Materials and design: the art and science of material selection in product design, Butterworth-Heinemann, Oxford, UK. [2] Faucheu J., Caroli A., Del Curto B., Delafosse D. (2015) Experimental setup for visual and tactile evaluation of materials and products through Napping® procedure. Proceedings of the 20th ICED2015 Conference. pp. 129-138. [3] Figuerola M., Lai Q., Ashby M. F. (2016) The CES EduPack Products, Materials and Processes Database, White paper, Granta Design, Cambridge, UK. [4] Karana E., Hekkert P., Kandachar P. (2009) Meanings of materials through sensorial properties and manufacturing processes. Materials and Design, Vol. 30, pp. 2778–2784. [5] Piselli A., Simonato M., Del Curto B. (2016) Holistic Approach To Materials Selection In Professional Appliances Industry, Proceeding of the 14th International Design Conference - DESIGN 2016, Dubrovnik - Croatia, May 16 - 19, 2016, pp. 865-874. [6] Stone H., Sidel J.L. (2004) Sensory Evaluation Practices, Academic Press, San Diego, CA. [7] Wongsriruksa S., Howes P., Conreen M., Miodownik M. (2012). The use of physical property data to predict the touch perception of materials. Materials and Design, 42, 238–244. A. Piselli a,b , M. Simonato b , B. Del Curto c RESEARCH FIELD MATERIALS AND METHODS 1 – Quantification and integration of sensorial and intangible properties in the materials and finishes selection Different studies focused on understanding and modelling sensorial properties and intangible meanings of materials [1-4] [7]. Some of them apply Sensory Analysis techniques [6], used in the food and cosmetic industry, to measure, analyse and interpret the user-material perception process translating qualitative properties of materials into a numerical system. 2 – Materials aging influence on perception behaviour To examine how much material and finishes changes over time can affect consumer’s perception, Sensory Analysis tests have been conducted also on aged material samples. • Sensory analysis tests Among standard Sensory Analysis techniques, discrimination tests (Paired comparison) and descriptive techniques (Napping®, Ranking test) have been selected and readapted to fulfil the industrial context needs. • Sensory attributes The descriptors analysed by the tests were selected from literature together with design experts of the company. Assessors (or test panel) The panel group is composed by expert and non-expert in materials and by expert and non-expert in professional appliance field. The assessors of the tests, whose results are described in this poster, have been selected from different company departments (Electrolux Professional SpA) and from Politecnico di Milano students (Design & Engineering MD). AIM OF THE RESEARCH CONCLUSIONS RESULTS AND DISCUSSION 9th International Materials Education Symposium Clare College, Cambridge April 6-7, 2017 Sensorial property Descriptors ENGLISH Descriptors ITALIAN Visual Glossiness Shiny – Matte Lucido – Opaco Surface evenness Uniform - Non uniform Omogeneo - Disomogeneo Colour intensity Intense - Light Acceso - Sbiadito Transparency Transparent – Opaque Trasparente - Opaco Tactual Roughness Rough – Smooth Ruvido – Liscio Warmth Warm – Cold Caldo – Freddo Stickiness Sticky - Not sticky Appiccicoso – Non appiccicoso Softness Soft – Hard Morbido - Duro Intangible Quality Premium quality – Poor quality Alta qualità – Bassa qualità Elegance Elegant – Shabby Elegante – Non elegante Innovation Modern - Traditional Moderno – Tradizionale Cost Expensive – Cheap Costoso - Economico Pleasure Like - Dislike Piace – Non piace PAIRED COMPARISON TEST - Aged material samples Samples: 6 samples of sintered ceramic (2 colors) - Reference samples (non-aged) - Simulation 3 years of use through accelerated life test (Dry and Wet abrasion) Test modality: only touch Sensory attribute: roughness MAPPING TEST - Non-aged material samples Samples: 10 samples – Metals and metal-look polymers Test modality: Multimodal (visual + tactual) Sensory attribute: MAP1 (Warm – Cold/Elegant – Shabby) MAP2 (Shiny – Matte/Premium – Poor quality) RESULTS: • 180 observations on samples roughness perception: - reasonable level of correlation (p<0.05); • Roughness evaluation: Ref. cream > Wet cream > Dry cream > Ref. brown > Wet brown > Dry brown - wet abrasion had a significant effect if compared to dry aging: Wet-Dry cream Wet-Dry brown 8 4 0 -4 -8 0 4 8 MAP2 DIM2 B -8 -4 C D A E F G H I L A PA410 30GF aluminum PVD B PA410 30GF water transfer printing C PARA 50GF metal-look painting D PC/Polyester membrane metal-look film E PA410 50% stainless steel powder F AS7G aluminium sandblasting G ABS metal-look painting H ABS satin labeling (IML) I AISI 430 brushing L PA410 30GF stainless steel PVD Bulk material Finishing 8 4 0 -4 -8 0 4 8 MAP1 DIM2 B -8 -4 C D A E F G H I L F D A 10 5 0 -5 -10 Cold - Warm P-Value 0,369 F D A 10 5 0 -5 -10 Matte - Shiny P-Value <0,001 Table 1 - Users that affirmed that sample in the “row” is rougher than sample in the correspondent “column” Table 2 - Samples materials and finishing characteristics
Transcript

REFERENCES

Sensory Analysis techniques for materials selectionin the education and in the industry context

a Politecnico di Milano, Design Department, Milano, 20158, Italyb The Research Hub by Electrolux Professional, Pordenone, 33170, Italy

c Politecnico di Milano, Chemistry, Materials and Chemical Engineering Department "Giulio Natta", Milano, 20131, Italy

Professional appliances are characterized by an intense use in harsh environment. Materials and finishes employed in professional products have to fulfil different technical requirements: high thermal resistance, food contact compliance and durability to food chemicals and detergents used in frequent cleaning processes. Moreover, they have to meet also sensorial and intangible properties required by the professional appliances market: among all, smoothness, shininess, elegance, quality, robustness and reliability.The need for the integration of aesthetical-related properties in materials selection is particularly evident in metal replacement case studies, where a material change could affect the overall quality perception of the product [5].

• Sensory Analysis tests valuable instruments to be applied in materials selection;• Statistical evaluation of results evidences concordance in user answers;• Metal replacement case studies particularly suitable for the evaluation of both qualitative and quantitative properties of materials. It allows also to evaluate the perception of durability of materials and finishes in time;• Further development: - Ranking test on aged metal-look samples to rate the level of acceptance by users; - Comparison of some sensorial properties with 10-point scale ranking used in CES EduPack Products, Materials and Processes Database; - Apply Sensory Analysis tests to evaluate other material trends.

[1] Ashby M. F., Johnson K. W. (2002) Materials and design: the art and science of material selection in product design, Butterworth-Heinemann, Oxford, UK.[2] Faucheu J., Caroli A., Del Curto B., Delafosse D. (2015) Experimental setup for visual and tactile evaluation of materials and products through Napping® procedure. Proceedings of the 20th ICED2015 Conference. pp. 129-138.[3] Figuerola M., Lai Q., Ashby M. F. (2016) The CES EduPack Products, Materials and Processes Database, White paper, Granta Design, Cambridge, UK.[4] Karana E., Hekkert P., Kandachar P. (2009) Meanings of materials through sensorial properties and manufacturing processes. Materials and Design, Vol. 30, pp. 2778–2784.[5] Piselli A., Simonato M., Del Curto B. (2016) Holistic Approach To Materials Selection In Professional Appliances Industry, Proceeding of the 14th International Design Conference - DESIGN 2016, Dubrovnik - Croatia, May 16 - 19, 2016, pp. 865-874.[6] Stone H., Sidel J.L. (2004) Sensory Evaluation Practices, Academic Press, San Diego, CA.[7] Wongsriruksa S., Howes P., Conreen M., Miodownik M. (2012). The use of physical property data to predict the touch perception of materials. Materials and Design, 42, 238–244.

A. Pisellia,b, M. Simonatob, B. Del Curtoc

RESEARCH FIELD

MATERIALS AND METHODS

1 – Quantification and integration of sensorial and intangible properties in the materials and finishes selection Different studies focused on understanding and modelling sensorial properties and intangible meanings of materials [1-4] [7]. Some of them apply Sensory Analysis techniques [6], used in the food and cosmetic industry, to measure, analyse and interpret the user-material perception process translating qualitative properties of materials into a numerical system.2 – Materials aging influence on perception behaviourTo examine how much material and finishes changes over time can affect consumer’s perception, Sensory Analysis tests have been conducted also on aged material samples.

• Sensory analysis tests Among standard Sensory Analysis techniques, discrimination tests (Paired comparison) and descriptive techniques (Napping®, Ranking test) have been selected and readapted to fulfil the industrial context needs.

• Sensory attributesThe descriptors analysed by the tests were selected from literature together with design experts of the company.

• Assessors (or test panel)The panel group is composed by expert and non-expert in materials and by expert and non-expert in professional appliance field. The assessors of the tests, whose results are described in this poster, have been selected from different company departments (Electrolux Professional SpA) and from Politecnico di Milano students (Design & Engineering MD).

AIM OF THE RESEARCH

CONCLUSIONS

RESULTS AND DISCUSSION

9th International Materials Education SymposiumClare College, Cambridge

April 6-7, 2017

Sensorial property Descriptors ENGLISH Descriptors ITALIAN

Visual

Glossiness Shiny – Matte Lucido – Opaco Surface evenness Uniform - Non uniform Omogeneo - Disomogeneo Colour intensity Intense - Light Acceso - Sbiadito Transparency Transparent – Opaque Trasparente - Opaco

Tactual

Roughness Rough – Smooth Ruvido – Liscio Warmth Warm – Cold Caldo – Freddo

Stickiness Sticky - Not sticky Appiccicoso – Non appiccicoso Softness Soft – Hard Morbido - Duro

Intangible

Quality Premium quality – Poor quality Alta qualità – Bassa qualità Elegance Elegant – Shabby Elegante – Non elegante Innovation Modern - Traditional Moderno – Tradizionale

Cost Expensive – Cheap Costoso - Economico Pleasure Like - Dislike Piace – Non piace

PAIRED COMPARISON TEST - Aged material samples• Samples: 6 samples of sintered ceramic (2 colors) - Reference samples (non-aged) - Simulation 3 years of use through accelerated life test (Dry and Wet abrasion)

• Test modality: only touch

• Sensory attribute: roughness

MAPPING TEST - Non-aged material samples• Samples: 10 samples – Metals and metal-look polymers

• Test modality: Multimodal (visual + tactual)

• Sensory attribute: MAP1 (Warm – Cold/Elegant – Shabby) MAP2 (Shiny – Matte/Premium – Poor quality)

RESULTS:• 180 observations on samples roughness perception: - reasonable level of correlation (p<0.05);

• Roughness evaluation:Ref. cream > Wet cream > Dry cream > Ref. brown > Wet brown > Dry brown - wet abrasion had a significant effect if compared to dry aging: Wet-Dry cream Wet-Dry brown

8

4

0

-4

-8

0 4 8

MAP2

DIM2

B

-8 -4

C

D

A

E

F

GH

I

L

A PA410 30GF aluminum PVDB PA410 30GF water transfer printingC PARA 50GF metal-look painting

D PC/Polyester membrane metal-look film

E PA41050% stainless steel powder

F AS7G aluminium sandblasting G ABS metal-look paintingH ABS satin labeling (IML)I AISI 430 brushingL PA410 30GF stainless steel PVD

Bulk material Finishing8

4

0

-4

-8

0 4 8

MAP1

DIM2

B

-8 -4

C

D

A

E

F

G

HI

L

F

D

A

1050-5-10

Cold - Warm P-Value 0,369

F

D

A

1050-5-10

Matte - Shiny P-Value <0,001

Table 1 - Users that affirmed that sample in the “row” is rougher than sample in the

correspondent “column” Table 2 - Samples materials and finishing characteristics

Recommended