28
offence and sentencing trends: Queensland Supreme and District Courts

offence and sentencing trends: Queensland Supreme and
District Courts
Sentencing Spotlight on… offence and sentencing trends: Queensland Supreme and District Courts Summary of offences 2005–06 to 2016–17
Source: Department of Justice and Attorney-General’s Queensland Wide Inter-linked Courts (QWIC) database, as maintained by the Queensland Government Statistician’s Office (QGSO).
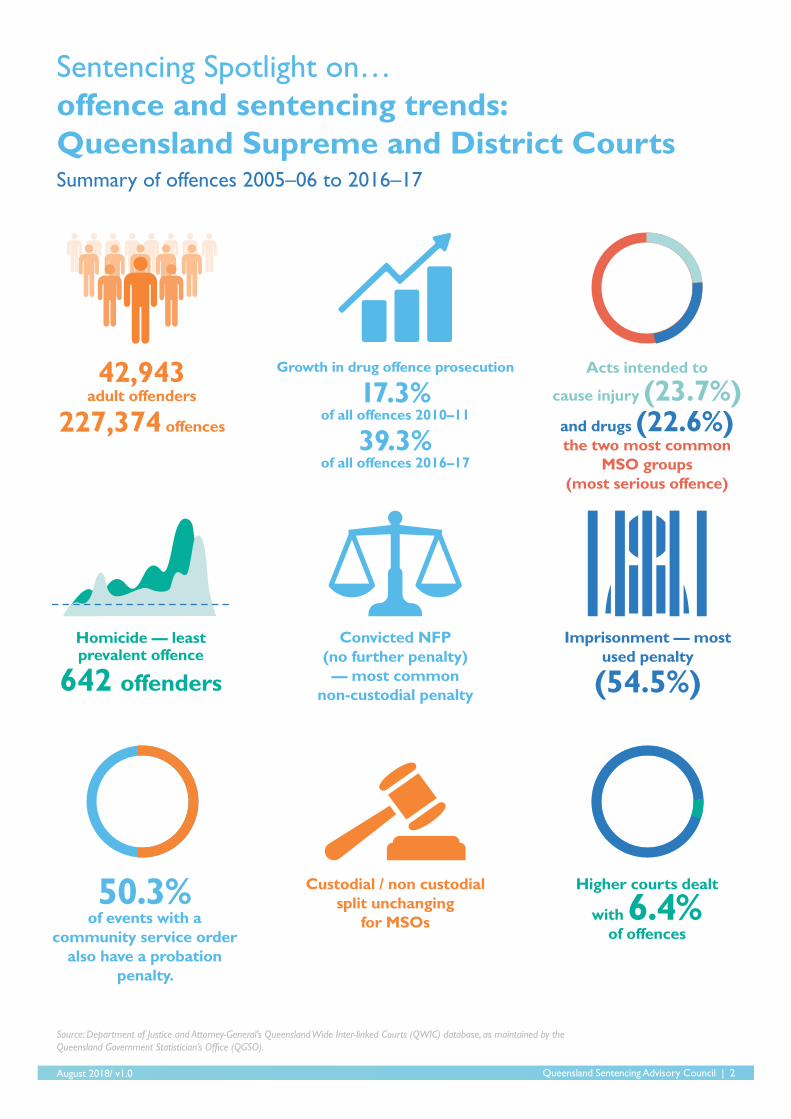
50.3% of events with a
community service order also have a probation
penalty.
Acts intended to
cause injury (23.7%)
and drugs (22.6%) the two most common
MSO groups (most serious offence)
Higher courts dealt
with 6.4% of offences
42,943 adult offenders
227,374 offences
Growth in drug offence prosecution
17.3% of all offences 2010–11
39.3% of all offences 2016–17
Homicide — least prevalent offence
642 offenders
Convicted NFP (no further penalty) — most common
non-custodial penalty
Custodial / non custodial split unchanging
for MSOs
Imprisonment — most used penalty
(54.5%)
August 2018/ v1.0 Queensland Sentencing Advisory Council | 2
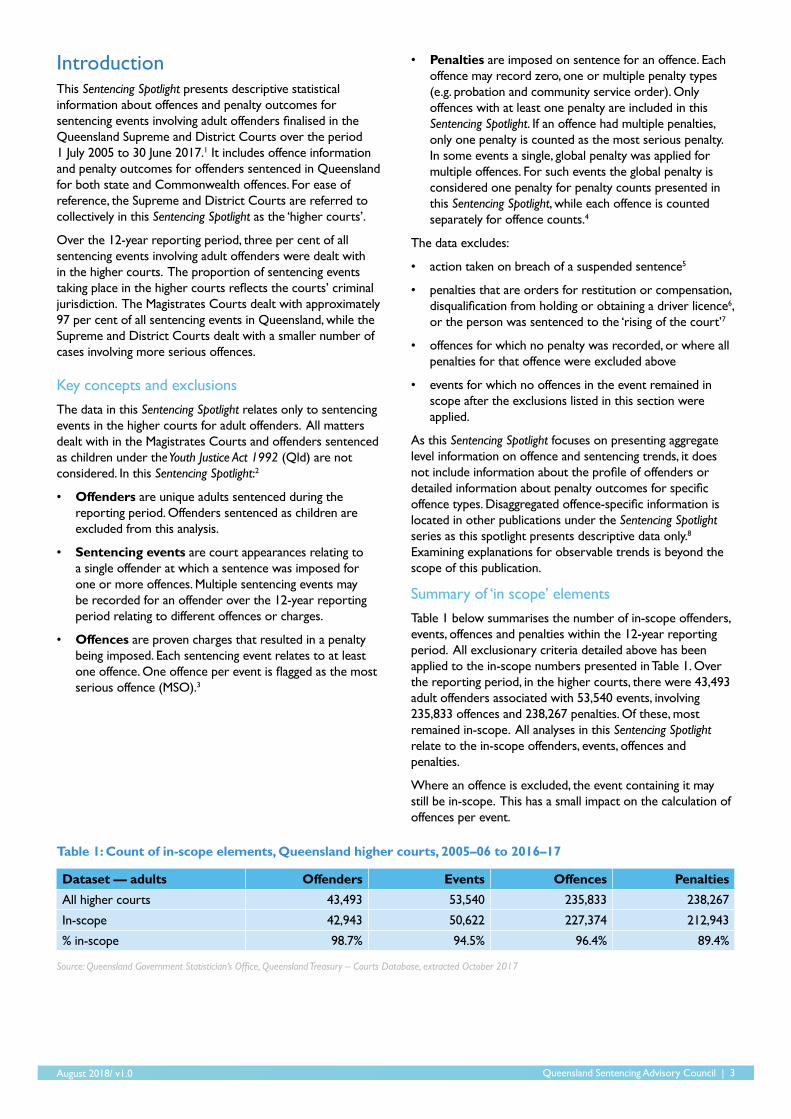
Introduction This Sentencing Spotlight presents descriptive statistical information about offences and penalty outcomes for sentencing events involving adult offenders finalised in the Queensland Supreme and District Courts over the period 1 July 2005 to 30 June 2017.1 It includes offence information and penalty outcomes for offenders sentenced in Queensland for both state and Commonwealth offences. For ease of reference, the Supreme and District Courts are referred to collectively in this Sentencing Spotlight as the ‘higher courts’.
Over the 12-year reporting period, three per cent of all sentencing events involving adult offenders were dealt with in the higher courts. The proportion of sentencing events taking place in the higher courts reflects the courts’ criminal jurisdiction. The Magistrates Courts dealt with approximately 97 per cent of all sentencing events in Queensland, while the Supreme and District Courts dealt with a smaller number of cases involving more serious offences.
Key concepts and exclusionsThe data in this Sentencing Spotlight relates only to sentencing events in the higher courts for adult offenders. All matters dealt with in the Magistrates Courts and offenders sentenced as children under the Youth Justice Act 1992 (Qld) are not considered. In this Sentencing Spotlight:2
• Offenders are unique adults sentenced during the reporting period. Offenders sentenced as children are excluded from this analysis.
• Sentencing events are court appearances relating to a single offender at which a sentence was imposed for one or more offences. Multiple sentencing events may be recorded for an offender over the 12-year reporting period relating to different offences or charges.
• Offences are proven charges that resulted in a penalty being imposed. Each sentencing event relates to at least one offence. One offence per event is flagged as the most serious offence (MSO).3
• Penalties are imposed on sentence for an offence. Each offence may record zero, one or multiple penalty types (e.g. probation and community service order). Only offences with at least one penalty are included in this Sentencing Spotlight. If an offence had multiple penalties, only one penalty is counted as the most serious penalty. In some events a single, global penalty was applied for multiple offences. For such events the global penalty is considered one penalty for penalty counts presented in this Sentencing Spotlight, while each offence is counted separately for offence counts.4
The data excludes:
• action taken on breach of a suspended sentence5
• penalties that are orders for restitution or compensation, disqualification from holding or obtaining a driver licence6, or the person was sentenced to the ‘rising of the court’7
• offences for which no penalty was recorded, or where all penalties for that offence were excluded above
• events for which no offences in the event remained in scope after the exclusions listed in this section were applied.
As this Sentencing Spotlight focuses on presenting aggregate level information on offence and sentencing trends, it does not include information about the profile of offenders or detailed information about penalty outcomes for specific offence types. Disaggregated offence-specific information is located in other publications under the Sentencing Spotlight series as this spotlight presents descriptive data only.8
Examining explanations for observable trends is beyond the scope of this publication.
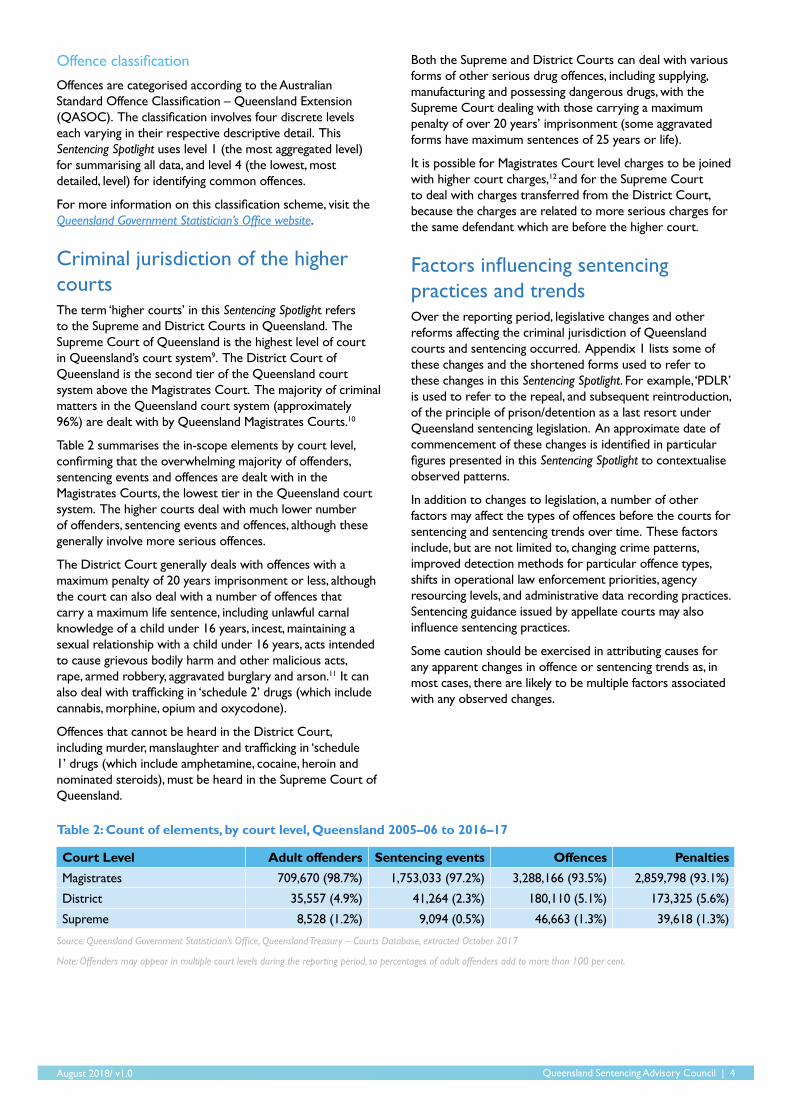
Summary of ‘in scope’ elementsTable 1 below summarises the number of in-scope offenders, events, offences and penalties within the 12-year reporting period. All exclusionary criteria detailed above has been applied to the in-scope numbers presented in Table 1. Over the reporting period, in the higher courts, there were 43,493 adult offenders associated with 53,540 events, involving 235,833 offences and 238,267 penalties. Of these, most remained in-scope. All analyses in this Sentencing Spotlight relate to the in-scope offenders, events, offences and penalties.
Where an offence is excluded, the event containing it may still be in-scope. This has a small impact on the calculation of offences per event.
Table 1: Count of in-scope elements, Queensland higher courts, 2005–06 to 2016–17
Dataset — adults Offenders Events Offences PenaltiesAll higher courts 43,493 53,540 235,833 238,267
In-scope 42,943 50,622 227,374 212,943
% in-scope 98.7% 94.5% 96.4% 89.4%
Source: Queensland Government Statistician’s Office, Queensland Treasury – Courts Database, extracted October 2017
August 2018/ v1.0 Queensland Sentencing Advisory Council | 3
Offence classificationOffences are categorised according to the Australian Standard Offence Classification – Queensland Extension (QASOC). The classification involves four discrete levels each varying in their respective descriptive detail. This Sentencing Spotlight uses level 1 (the most aggregated level) for summarising all data, and level 4 (the lowest, most detailed, level) for identifying common offences.
For more information on this classification scheme, visit the Queensland Government Statistician’s Office website.
Criminal jurisdiction of the higher courtsThe term ‘higher courts’ in this Sentencing Spotlight refers to the Supreme and District Courts in Queensland. The Supreme Court of Queensland is the highest level of court in Queensland’s court system9. The District Court of Queensland is the second tier of the Queensland court system above the Magistrates Court. The majority of criminal matters in the Queensland court system (approximately 96%) are dealt with by Queensland Magistrates Courts.10
Table 2 summarises the in-scope elements by court level, confirming that the overwhelming majority of offenders, sentencing events and offences are dealt with in the Magistrates Courts, the lowest tier in the Queensland court system. The higher courts deal with much lower number of offenders, sentencing events and offences, although these generally involve more serious offences.
The District Court generally deals with offences with a maximum penalty of 20 years imprisonment or less, although the court can also deal with a number of offences that carry a maximum life sentence, including unlawful carnal knowledge of a child under 16 years, incest, maintaining a sexual relationship with a child under 16 years, acts intended to cause grievous bodily harm and other malicious acts, rape, armed robbery, aggravated burglary and arson.11 It can also deal with trafficking in ‘schedule 2’ drugs (which include cannabis, morphine, opium and oxycodone).
Offences that cannot be heard in the District Court, including murder, manslaughter and trafficking in ‘schedule 1’ drugs (which include amphetamine, cocaine, heroin and nominated steroids), must be heard in the Supreme Court of Queensland.
Both the Supreme and District Courts can deal with various forms of other serious drug offences, including supplying, manufacturing and possessing dangerous drugs, with the Supreme Court dealing with those carrying a maximum penalty of over 20 years’ imprisonment (some aggravated forms have maximum sentences of 25 years or life).
It is possible for Magistrates Court level charges to be joined with higher court charges,12 and for the Supreme Court to deal with charges transferred from the District Court, because the charges are related to more serious charges for the same defendant which are before the higher court.
Factors influencing sentencing practices and trendsOver the reporting period, legislative changes and other reforms affecting the criminal jurisdiction of Queensland courts and sentencing occurred. Appendix 1 lists some of these changes and the shortened forms used to refer to these changes in this Sentencing Spotlight. For example, ‘PDLR’ is used to refer to the repeal, and subsequent reintroduction, of the principle of prison/detention as a last resort under Queensland sentencing legislation. An approximate date of commencement of these changes is identified in particular figures presented in this Sentencing Spotlight to contextualise observed patterns.
In addition to changes to legislation, a number of other factors may affect the types of offences before the courts for sentencing and sentencing trends over time. These factors include, but are not limited to, changing crime patterns, improved detection methods for particular offence types, shifts in operational law enforcement priorities, agency resourcing levels, and administrative data recording practices. Sentencing guidance issued by appellate courts may also influence sentencing practices.
Some caution should be exercised in attributing causes for any apparent changes in offence or sentencing trends as, in most cases, there are likely to be multiple factors associated with any observed changes.
Table 2: Count of elements, by court level, Queensland 2005–06 to 2016–17
Court Level Adult offenders Sentencing events Offences PenaltiesMagistrates 709,670 (98.7%) 1,753,033 (97.2%) 3,288,166 (93.5%) 2,859,798 (93.1%)
District 35,557 (4.9%) 41,264 (2.3%) 180,110 (5.1%) 173,325 (5.6%)
Supreme 8,528 (1.2%) 9,094 (0.5%) 46,663 (1.3%) 39,618 (1.3%)
Source: Queensland Government Statistician’s Office, Queensland Treasury – Courts Database, extracted October 2017
Note: Offenders may appear in multiple court levels during the reporting period, so percentages of adult offenders add to more than 100 per cent.
August 2018/ v1.0 Queensland Sentencing Advisory Council | 4

Offences in the higher courts
Counts per offenceTable 3 shows the counts of offenders, events, offences, penalties and MSOs associated with each offence type. Substantial overlap occurs within the offender and event elements, so the percentages for each add to more than 100. Figure 1 and Figure 2 show the total offence and MSO counts over time, by offence type.
Overall, Acts intended to cause injury as an offence category (QASOC level 1) recorded the highest number of unique offenders (13,159, 30.7%), closely followed by Illicit drug offences (12,851, 30.0%). A similar pattern emerges for unique court events, with 14,346 (28.4%) events involving Acts intended to cause injury and 13,842 (27.4%) involving Illicit drug offences. The trend repeats when considering the MSO element, with 23.7 per cent of MSOs being Acts
intended to cause injury and 22.6 per cent being Illicit drug offences. Figure 2 shows however that percentage share has shifted over time, with Acts intended to cause injury dropping from around 29 per cent to 18 per cent across the 12-year reporting period, and Illicit drug offences increasing in share from about 14 to 41 per cent.
Illicit drug offences represents by far the most common offence category, accounting for 24.2 per cent of all sentenced offences — almost double the next common offence type Sexual assault and related offences, which accounts for 12.8 per cent of all offences sentenced in the higher courts. Analysis by penalties is comparable, with Illicit drug offences accounting for 22.6 per cent of all penalties imposed, and Sexual assault and related offences accounting for 14.0 per cent. Figure 1 shows that while Illicit drug offences was the most common offence type for most of the reporting period, its share rose substantially since late 2010 (approximately November 2010).
Table 3: Count of elements, by court level, Queensland 2005–06 to 2016–17
Offence (QASOC Level 1) Offenders Events Offences Penalties MSOsHomicide and related offences 589 (1.4%) 595 (1.2%) 642 (0.3%) 643 (0.3%) 594 (1.2%)
Acts intended to cause injury 13,186 (30.8%) 14,346 (28.4%) 22,416 (9.9%) 22,987 (10.8%) 11,956 (23.7%)
Sexual assault and related offences
6,919 (16.2%) 7,339 (14.5%) 29,061 (12.8%) 29,574 (13.9%) 7,072 (14.0%)
Dangerous or negligent acts endangering persons
3,443 (8%) 3,551 (7%) 4,474 (2%) 4,523 (2.1%) 2,197 (4.4%)
Abduction, harassment and other offences against person
1,781 (4.2%) 1,819 (3.6%) 2,737 (1.2%) 2,814 (1.3%) 667 (1.3%)
Robbery, extortion and related offences
4,696 (11.0%) 5,062 (10%) 7,304 (3.2%) 7,647 (3.6%) 4,520 (9.0%)
Unlawful entry with intent/burglary, break and enter
6,623 (15.5%) 7,476 (14.8%) 25,141 (11.1%) 26,101 (12.3%) 3,865 (7.7%)
Theft and related offences 8,559 (20.0%) 9,632 (19.1%) 27,283 (12%) 26,272 (12.3%) 1,377 (2.7%)
Fraud, deception and related offences
4,579 (10.7%) 4,744 (9.4%) 15,328 (6.7%) 15,618 (7.3%) 2,928 (5.8%)
Illicit drug offences 12,851 (30.0%) 13,842 (27.4%) 55,127 (24.2%) 46,325 (21.8%) 11,392 (22.6%)
Prohibited and regulated weapons and explosives offences
1,985 (4.6%) 2,050 (4.1%) 3,508 (1.5%) 2,573 (1.2%) 129 (0.3%)
Property damage and environmental pollution
4,544 (10.6%) 4,726 (9.4%) 8,299 (3.6%) 7,955 (3.7%) 1,409 (2.8%)
Public order offences 2,172 (5.1%) 2,274 (4.5%) 3,321 (1.5%) 2,831 (1.3%) 302 (0.6%)
Traffic and vehicle regulatory offences
1,928 (4.5%) 2,010 (4%) 5,414 (2.4%) 4,205 (2.0%) 26 (0.1%)
Offences against justice procedures, government security and operations
6,609 (15.4%) 7,210 (14.3%) 15,719 (6.9%) 11,706 (5.5%) 1,928 (3.8%)
Source: Queensland Government Statistician’s Office, Queensland Treasury – Courts Database, extracted October 2017.Notes1. ‘Homicide and related offences’ includes attempted murder and dangerous driving causing death.2. Offenders and Events may relate to multiple offence types, and so percentages add to more than 100 per cent.3. The offence types ‘miscellaneous’ and ‘cannot be assigned’ have been excluded. As a result the percentages for offences, penalties and MSOs each add to slightly less than
100 per cent.
August 2018/ v1.0 Queensland Sentencing Advisory Council | 5

Figure 1: QASOC Level 1 offences, change in percentage share over time, Queensland higher courts, 2005–06 to 2016–17
Source: Queensland Government Statistician’s Office, Queensland Treasury – Courts Database, extracted October 2017.
0
0
20
20
40
40
10
10
30
30
Financial year start
Financial year start
Per c
ent o
f all
offe
nces
Per c
ent o
f all
offe
nces
Offence type (QASOC Level 4)
Offence type (QASOC Level 4)
HomicideAbduction, harassmentFraudPublic order
HomicideAbduction, harassmentFraudPublic order
Intended to cause injuryRobbery, extortionDrugsTraffic and vehicle
Intended to cause injuryRobbery, extortionDrugsTraffic and vehicle
Sexual assaultUnlawful entryWeaponsJustice and government
Sexual assaultUnlawful entryWeaponsJustice and government
Endangering personsTheftProperty and environmental
Endangering personsTheftProperty and environmental
Jun 2005
Jun 2005
Jun 2006
Jun 2006
Jun 2007
Jun 2007
Jun 2008
Jun 2008
Jun 2009
Jun 2009
Jun 2010
Jun 2010
Jun 2011
Jun 2011
Jun 2012
Jun 2012
Jun 2013
Jun 2013
Jun 2014
Jun 2014
Jun 2015
Jun 2015
Jun 2016
Jun 2016
Jun 2017
Jun 2017
Source: Queensland Government Statistician’s Office, Queensland Treasury – Courts Database, extracted October 2017.
Figure 2: QASOC Level 1 MSOs, change in percentage share over time, Queensland higher courts, 2005–06 to 2016–17
Moynihan*
Moynihan*
* See Appendix 1
* See Appendix 1
August 2018/ v1.0 Queensland Sentencing Advisory Council | 6

Most common offencesThe tables and figures presented below depict the most common offences (QASOC level 4) sentenced in the higher courts. Two results are presented; the first reflects a count of all offences in each sentencing event, while the second reflects a count of the MSOs for each event. The tables show the top ten sentenced offences across the entire reporting period, while the figures show percentage share, across time, for offences that were in the top five of any financial year.
Three of the top four most common offences were Drug offences (Table 4), as were four of the top six MSOs (Table 5). Both figures show significant growth in sentencing for Drug offences over time, particularly since 2011. For the last four years of the 12-year dataset, the top three offence types were all drug offences (Figure 3). The top three MSOs for the last 18 months of the dataset were also Drug offences (Figure 4).
Other clear patterns identified over time include:
• a decrease in Assault occasioning actual bodily harm, down from 15 per cent of all MSOs in 2005, to 7 per cent by 2017 (Figure 4)
• an increase in Armed robbery as an MSO, peaking in mid-2013 as the highest recorded MSO (Figure 4)
• a peak in Child pornography offences 2010–11 to 2011–2012 (Figure 3).
Note the figures show change in percentage share. As a result, the gradual downward trajectory associated with most offences (Figure 3) does not reflect a gradual decrease in the actual number of those offences, rather it results from rising drug offence counts.
Table 4: Top 10 most common offences, Queensland higher courts, 2005–06 to 2016–17
Offence (QASOC level 4) Count Percent Unique offendersPossess illicit drugs 17,110 7.5 8,811Deal or traffic in illicit drugs 15,926 7.0 4,354Indecent treatment of a child 10,539 4.6 2,908Possession of drug utensils 10,400 4.6 6,549Assault occasioning actual bodily harm 9,759 4.3 6,899Enter dwelling with intent, without violence or threats 9,122 4.0 2,849Theft (except motor vehicles) 9,066 4.0 3,926Obtain benefit by deception (remainder) 9,042 4.0 2,716Illegal use of a motor vehicle 7,817 3.4 2,970Break and enter other building 7,352 3.2 2,187
Source: Queensland Government Statistician’s Office, Queensland Treasury – Courts Database, extracted October 2017.
Figure 3: Offences ever ranked in top five most common offences in a year by percentage share, Queensland higher courts, 2005–06 to 2016–17
Source: Queensland Government Statistician’s Office, Queensland Treasury – Courts Database, extracted October 2017.
0
10
5
15
Financial year start
Per c
ent o
f all
offe
nces
Offence type (QASOC Level 4)Assault occasioning actual bodily harmDeal or traffic in illicit drugsIndecent treatment of a childPossession of drug utencils
Break and enter other buildingEnter dwelling with intent without violence or threatsObtain benefit by deception (remainder)Theft (except motor vehicles)
Jun 2005 Jun 2006 Jun 2007 Jun 2008 Jun 2009 Jun 2010 Jun 2011 Jun 2012 Jun 2013 Jun 2014 Jun 2015 Jun 2016 Jun 2017
Moynihan*
* See Appendix 1
Child pornography offencesIllegal use of a motor vehiclePossess illicit drugs
August 2018/ v1.0 Queensland Sentencing Advisory Council | 7

Table 5: Top 10 prevalent MSOs, Queensland higher courts, 2005–06 to 2016–17
Offence (QASOC level 4) Count Percent Unique offendersAssault occasioning actual bodily harm 5,264 10.4 5,074Armed robbery 3,382 6.7 3,203Deal or traffic in illicit drugs – commercial quantity 3,012 6.0 2,975Deal or traffic in illicit drugs 2,930 5.8 2,884Manufacture or cultivate illicit drugs 2,547 5.0 2,430Possess illicit drugs 2,392 4.7 2,303Assault occasioning grievous bodily harm 2,388 4.7 2,360Indecent treatment of a child 1,901 3.8 1,844Wounding 1,482 2.9 1,440Enter dwelling with intent, without violence or threats 1,473 2.9 1,386
Source: Queensland Government Statistician’s Office, Queensland Treasury – Courts Database, extracted October 2017.
Figure 4: MSOs ever ranked in top five prevalent MSOs in a year by percentage share, Queensland higher courts, 2005–06 to 2016–17
Source: Queensland Government Statistician’s Office, Queensland Treasury – Courts Database, extracted October 2017.
Offence combinationsSentencing events may involve sentencing for multiple offences. Figure 5 shows how often each offence type is sentenced in the same court event as other offence types, including offences of the same type. A darker shade of blue indicates a larger proportion of offences. The table is designed to be read from the horizontal axis first. For example, 6.9 per cent of all sentencing events with a Homicide offence also had at least one Theft offence.
The darkish diagonal line from bottom left to top right depicts sentencing events involving two or more counts of the same offence type. Such events are particularly marked in the case of Drugs (75.2%) and Sexual assault (64.9%).
The dark vertical line associated with Traffic and vehicle offences indicates a high percentage of events in which people sentenced for these offences were also sentenced for other offences at the same sentencing event, including Acts endangering persons (51.4%), Theft (64.3%) and Justice procedure/government offences (55.3%).
The darkish horizontal lines for Acts intended to cause injury, Unlawful entry, Theft and Justice procedure/government offences indicate that many other offences have these offences sentenced as part of the same court event. For example 47.2 per cent of Abduction offences, 43.1 per cent of Property/environment offences and 45.8 per cent of Public order offences are sentenced in the same event as an Acts intended to cause injury offence.
0
10
5
15
Financial year start
Per c
ent o
f all
offe
nces
Offence type (QASOC Level 4)Armed robberyDeal or traffic in illicit drugsIndecent treatment of a childPosess illicit drugs
Assault occasioning actual bodily harmDeal or traffic in illicit drugs – commercial quantityManufacture or cultivate illicit drugsAssault occasioning grevious bodily harm
Jun 2005 Jun 2006 Jun 2007 Jun 2008 Jun 2009 Jun 2010 Jun 2011 Jun 2012 Jun 2013 Jun 2014 Jun 2015 Jun 2016 Jun 2017
Moynihan*
* See Appendix 1
Enter dwelling with intent, without violence or threatsObtain benefit by deception (remainder)
August 2018/ v1.0 Queensland Sentencing Advisory Council | 8
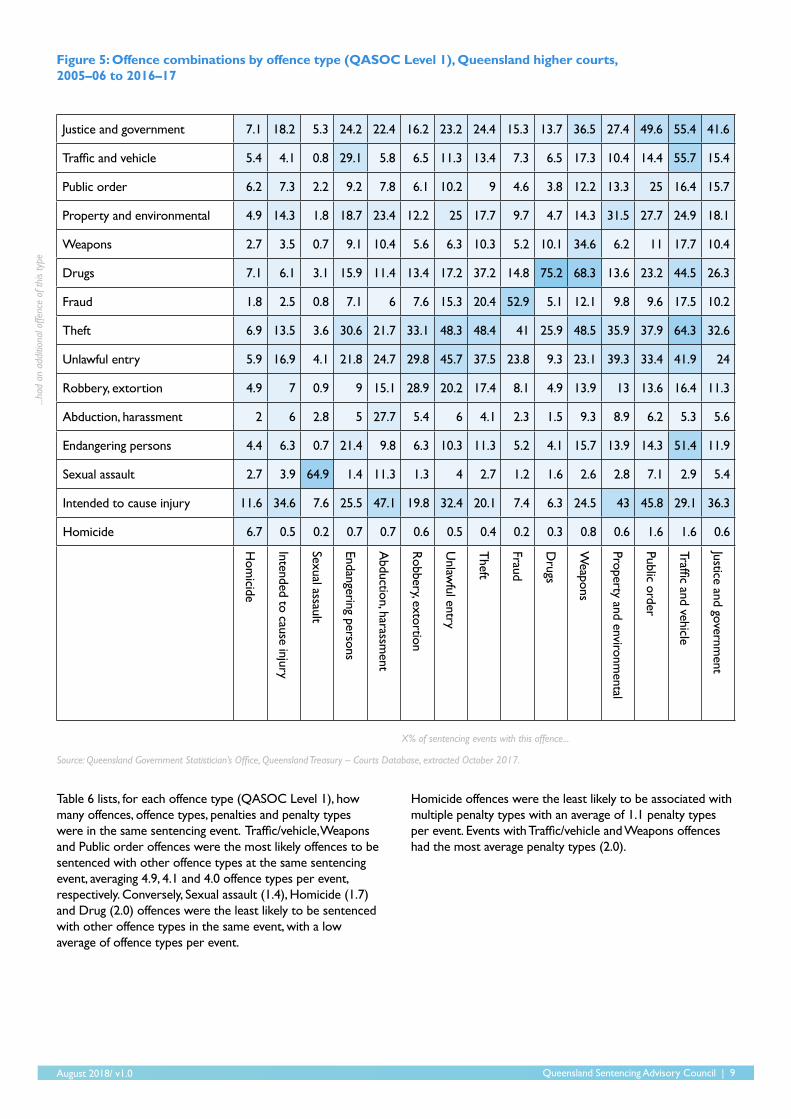
Figure 5: Offence combinations by offence type (QASOC Level 1), Queensland higher courts, 2005–06 to 2016–17
Justice and government 7.1 18.2 5.3 24.2 22.4 16.2 23.2 24.4 15.3 13.7 36.5 27.4 49.6 55.4 41.6
Traffic and vehicle 5.4 4.1 0.8 29.1 5.8 6.5 11.3 13.4 7.3 6.5 17.3 10.4 14.4 55.7 15.4
Public order 6.2 7.3 2.2 9.2 7.8 6.1 10.2 9 4.6 3.8 12.2 13.3 25 16.4 15.7
Property and environmental 4.9 14.3 1.8 18.7 23.4 12.2 25 17.7 9.7 4.7 14.3 31.5 27.7 24.9 18.1
Weapons 2.7 3.5 0.7 9.1 10.4 5.6 6.3 10.3 5.2 10.1 34.6 6.2 11 17.7 10.4
Drugs 7.1 6.1 3.1 15.9 11.4 13.4 17.2 37.2 14.8 75.2 68.3 13.6 23.2 44.5 26.3
Fraud 1.8 2.5 0.8 7.1 6 7.6 15.3 20.4 52.9 5.1 12.1 9.8 9.6 17.5 10.2
Theft 6.9 13.5 3.6 30.6 21.7 33.1 48.3 48.4 41 25.9 48.5 35.9 37.9 64.3 32.6
Unlawful entry 5.9 16.9 4.1 21.8 24.7 29.8 45.7 37.5 23.8 9.3 23.1 39.3 33.4 41.9 24
Robbery, extortion 4.9 7 0.9 9 15.1 28.9 20.2 17.4 8.1 4.9 13.9 13 13.6 16.4 11.3
Abduction, harassment 2 6 2.8 5 27.7 5.4 6 4.1 2.3 1.5 9.3 8.9 6.2 5.3 5.6
Endangering persons 4.4 6.3 0.7 21.4 9.8 6.3 10.3 11.3 5.2 4.1 15.7 13.9 14.3 51.4 11.9
Sexual assault 2.7 3.9 64.9 1.4 11.3 1.3 4 2.7 1.2 1.6 2.6 2.8 7.1 2.9 5.4
Intended to cause injury 11.6 34.6 7.6 25.5 47.1 19.8 32.4 20.1 7.4 6.3 24.5 43 45.8 29.1 36.3
Homicide 6.7 0.5 0.2 0.7 0.7 0.6 0.5 0.4 0.2 0.3 0.8 0.6 1.6 1.6 0.6H
omicide
Intended to cause injury
Sexual assault
Endangering persons
Abduction, harassm
ent
Robbery, extortion
Unlaw
ful entry
Theft
Fraud
Drugs
Weapons
Property and environmental
Public order
Traffic and vehicle
Justice and government
...had
an
addi
tiona
l offe
nce
of th
is ty
pe
X% of sentencing events with this offence...
Source: Queensland Government Statistician’s Office, Queensland Treasury – Courts Database, extracted October 2017.
Table 6 lists, for each offence type (QASOC Level 1), how many offences, offence types, penalties and penalty types were in the same sentencing event. Traffic/vehicle, Weapons and Public order offences were the most likely offences to be sentenced with other offence types at the same sentencing event, averaging 4.9, 4.1 and 4.0 offence types per event, respectively. Conversely, Sexual assault (1.4), Homicide (1.7) and Drug (2.0) offences were the least likely to be sentenced with other offence types in the same event, with a low average of offence types per event.
Homicide offences were the least likely to be associated with multiple penalty types with an average of 1.1 penalty types per event. Events with Traffic/vehicle and Weapons offences had the most average penalty types (2.0).
August 2018/ v1.0 Queensland Sentencing Advisory Council | 9

Table 6: Offence count and penalty count by offence type, Queensland higher courts, 2005–06 to 2016–17
Offence (QASOC Level 1)
Event offences Event offence types (QASOC Level 1)
Event penalties Event penalty types
Average Median Average Median Average Median Average MedianHomicide 2.4 1 1.7 1 2.3 1 1.1 1
Intended to cause injury 4.1 2 2.1 1 3.9 2 1.3 1
Sexual assault 4.8 3 1.4 1 4.7 3 1.4 1
Endangering persons 8.1 3 3.1 2 7.4 3 1.5 1
Abduction, harassment 6.6 4 3.2 3 6.2 4 1.5 1
Robbery, extortion 5.5 3 2.6 2 5 3 1.4 1
Unlawful entry 9.4 5 3.3 3 9.1 5 1.5 1
Theft 10 6 3.3 3 9.1 6 1.6 2
Fraud 8.8 3 2.5 2 8.4 4 1.4 1
Drugs 6.7 4 2 1 5.6 3 1.6 2
Weapons 12.5 9 4.1 3 9.7 6 2 2
Property and environmental 8.6 5 3.4 3 8 4 1.5 1
Public order 10.4 6 4 4 9.2 5 1.8 2
Traffic and vehicle 16 11 4.9 5 13.8 9 2 2
Justice and government 9 5 3.3 3 7.7 4 1.7 2
Source: Queensland Government Statistician’s Office, Queensland Treasury – Courts Database, extracted October 2017.
Table 7 shows the number of offences, offence types, penalties and penalty types per event were significantly lower in the Magistrates Courts than in the higher courts. This pattern is consistent across all offence types except Robbery/extortion, which had more offences and penalties per event in the Magistrates Courts than in the higher courts. The largest differences between court types was evident in events with Traffic or Public order offences. Events with Traffic offences averaged 1.8 offences and 1.7 penalties in Magistrates Courts, compared to 16 offences and 13.8 penalties in the higher courts. Events with Public order offences averaged 2.0 offences and 1.8 penalties in Magistrates Courts, compared to 10.4 offences and 9.2 penalties in the higher courts.
For more information on the results for the Magistrates Courts see the complementary publication in this Sentencing Spotlight series, Offence and sentencing trends: Queensland Magistrates Courts.
Table 7: Offence count and penalty count by court type, 2005–06 to 2016–17
Offence (QASOC Level 1)
Event offences Event offence types (QASOC Level 1)
Event penalties Event penalty types
Average Median Average Median Average Median Average MedianMagistrates Courts 1.9 1 1.2 1 1.6 1 1.1 1
Higher Courts 4.5 2 1.7 1 4.2 2 1.4 1
Source: Queensland Government Statistician’s Office, Queensland Treasury – Courts Database, extracted October 2017.
August 2018/ v1.0 Queensland Sentencing Advisory Council | 10

Penalties and sentencing
Penalty types: overviewThe Penalties and Sentences Act 1992 (Qld) sets out the penalty types available to the higher courts for sentencing adult offenders.
Penalties are generally classified as either custodial or non-custodial. Custodial orders include imprisonment, intensive correction orders (ICOs) and suspended sentences of imprisonment. Non-custodial orders include community service orders, probation, fines and recognisance orders/good behaviour bonds.
Table 8 shows the count of offenders, events, offences, penalties and MSOs by penalty type. Substantial overlap occurs within the offender and event elements and so the percentages for each add to more than 100.
Table 8: Count of offenders, events, offences, penalties and MSOs by penalty type, Queensland higher courts, 2005–06 to 2016–17
Penalty Offenders Events Offences Penalties MSOsCustodial penaltiesImprisonment 21,948 (51.2%) 25,537 (50.6%) 116,007 (51%) 116,009 (54.5%) 23,584 (46.7%)
Partially suspended sentence 7,795 (18.2%) 7,946 (15.7%) 24,268 (10.7%) 24,273 (11.4%) 7,705 (15.3%)
Wholly suspended sentence 7,973 (18.6%) 8,079 (16%) 19,893 (8.7%) 19,902 (9.3%) 7,684 (15.2%)
Intensive correction order 1,430 (3.3%) 1,437 (2.8%) 3,335 (1.5%) 3,335 (1.6%) 1,409 (2.8%)
Non-custodial penaltiesCommunity service 3,223 (7.5%) 3,250 (6.4%) 7,180 (3.2%) 6,078 (2.9%) 2,853 (5.7%)
Probation 7,911 (18.5%) 8,097 (16%) 13,985 (6.2%) 16,214 (7.6%) 3,344 (6.6%)
Fine 2,683 (6.3%) 2,728 (5.4%) 4,320 (1.9%) 3,907 (1.8%) 2,318 (4.6%)
Recognisance 2,083 (4.9%) 1,965 (3.9%) 2,875 (1.3%) 3,626 (1.7%) 782 (1.5%)
Convicted not further punished 9,388 (21.9%) 10,018 (19.8%) 35,511 (15.6%) 19,599 (9.2%) 812 (1.6%)
Source: Queensland Government Statistician’s Office, Queensland Treasury – Courts Database, extracted October 2017.Note: As offenders and events may relate to multiple penalty types, percentages add to more than 100 per cent.
Table 9 summarises the frequency and average outcome by penalty type. Penalty outcome is measured in hours for community service, dollars for fines, and years for other penalty types. Imprisonment includes sentences imposed for fixed term only, and therefore excludes life sentences (of which 266 were recorded over the 12-year reporting period).
Table 9: Summary of penalty range and severity by penalty type, Queensland higher courts, 2005–06 to 2016–17
Penalty Count % Average Median Min Max Quartile 1 Quartile 3 Interquartile range
Custodial penaltiesImprisonment13 116,009 54.5 2.0 years 1.5
years1 day 27 years 0.5 years 3.0 years 2.5 years
Partially suspended sentence
24,273 11.4 2.4 years 2 years 3 days 6 years14 1.5 years 3.0 years 1.5 years
Wholly suspended sentence
19,902 9.3 1.2 years 1 year 1 day 5 years 0.5 years 1.5 years 1.0 year
Intensive correction order
3,335 1.6 0.9 years 1 year 30 days 1 year 0.8 year 1.0 year 0.3 years
Non-custodial penaltiesCommunity service 6,078 2.9 141.3
hours140
hours5 hours 240
hours100 hours 200 hours 100 hours
Probation 16,214 7.6 2 years 2 years 61 days 3 years 1.5 years 2.8 years 1.3 years
Fine 3,907 1.8 $3523 $750 $10 $680k $300 $1500 $1200
Recognisance 3,626 1.7 2.2 years 2.0 years
1 day 5 years 1.5 years 3.0 years 1.5 years
Convicted not further punished
19,599 9.2
Source: Queensland Government Statistician’s Office, Queensland Treasury – Courts Database, extracted October 2017.
August 2018/ v1.0 Queensland Sentencing Advisory Council | 11
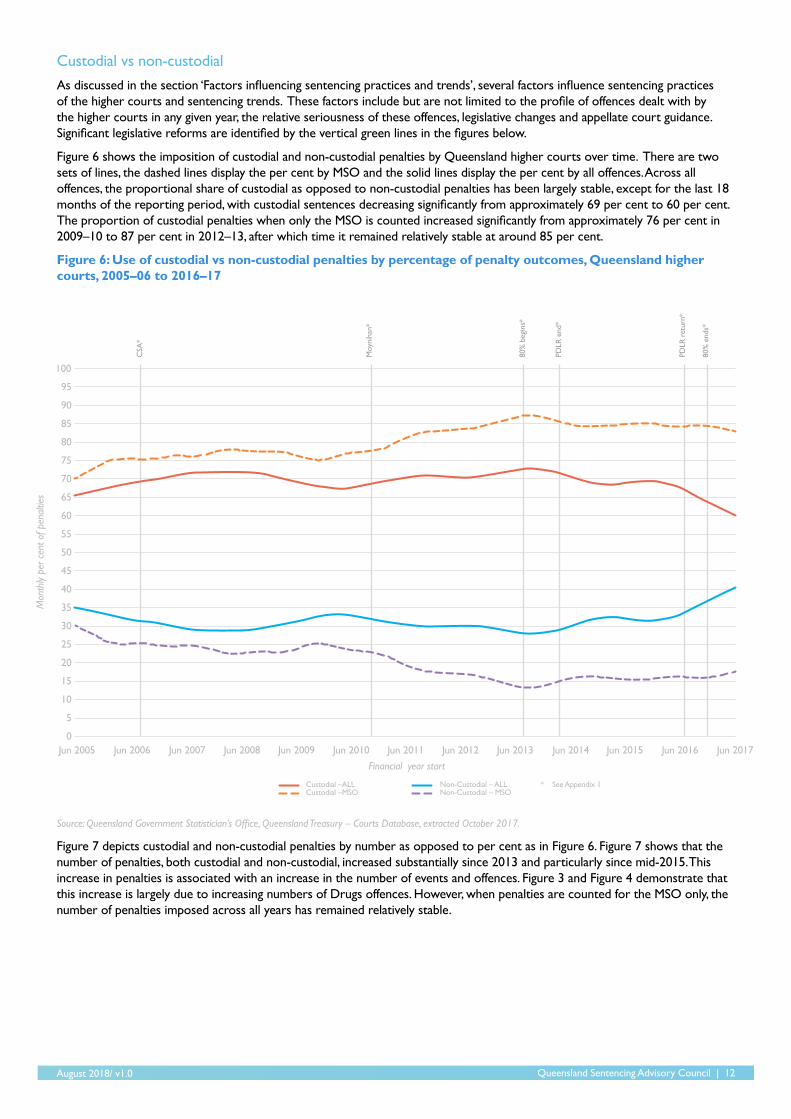
Custodial vs non-custodialAs discussed in the section ‘Factors influencing sentencing practices and trends’, several factors influence sentencing practices of the higher courts and sentencing trends. These factors include but are not limited to the profile of offences dealt with by the higher courts in any given year, the relative seriousness of these offences, legislative changes and appellate court guidance. Significant legislative reforms are identified by the vertical green lines in the figures below.
Figure 6 shows the imposition of custodial and non-custodial penalties by Queensland higher courts over time. There are two sets of lines, the dashed lines display the per cent by MSO and the solid lines display the per cent by all offences. Across all offences, the proportional share of custodial as opposed to non-custodial penalties has been largely stable, except for the last 18 months of the reporting period, with custodial sentences decreasing significantly from approximately 69 per cent to 60 per cent. The proportion of custodial penalties when only the MSO is counted increased significantly from approximately 76 per cent in 2009–10 to 87 per cent in 2012–13, after which time it remained relatively stable at around 85 per cent.
Figure 6: Use of custodial vs non-custodial penalties by percentage of penalty outcomes, Queensland higher courts, 2005–06 to 2016–17
Source: Queensland Government Statistician’s Office, Queensland Treasury – Courts Database, extracted October 2017.
Figure 7 depicts custodial and non-custodial penalties by number as opposed to per cent as in Figure 6. Figure 7 shows that the number of penalties, both custodial and non-custodial, increased substantially since 2013 and particularly since mid-2015. This increase in penalties is associated with an increase in the number of events and offences. Figure 3 and Figure 4 demonstrate that this increase is largely due to increasing numbers of Drugs offences. However, when penalties are counted for the MSO only, the number of penalties imposed across all years has remained relatively stable.
0
30
60
5
35
65
10
40
70
15
45
75
20
50
80
25
55
85
90
95
100
Financial year start
Mon
thly
per c
ent o
f pen
altie
s
Custodial –ALLCustodial –MSO
Non-Custodial – ALLNon-Custodial – MSO
Jun 2005 Jun 2006 Jun 2007 Jun 2008 Jun 2009 Jun 2010 Jun 2011 Jun 2012 Jun 2013 Jun 2014 Jun 2015 Jun 2016 Jun 2017
Moy
niha
n*
80%
beg
ins*
PDLR
end
*
PDLR
ret
urn*
80%
end
s*
CSA
*
* See Appendix 1
August 2018/ v1.0 Queensland Sentencing Advisory Council | 12

Figure 7: Use of custodial vs non-custodial penalties, by count of penalty outcomes, Queensland higher courts, 2005–06 to 2016–17
Source: Queensland Government Statistician’s Office, Queensland Treasury – Courts Database, extracted October 2017.
Order combinationsQueensland’s sentencing framework enables penalties to be combined in different ways. If terms of imprisonment (including ICOs)15 are to be imposed for multiple offences, separate terms must be imposed for each.16 Imprisonment and probation can only be combined for one charge under the confines of legislation (actual imprisonment of one year or less, immediately followed by a period of probation in the community of between nine months and three years).17 More options exist when more than one charge is involved, and the court can impose suspended imprisonment and a community based order on different charges.18
Courts retain more flexibility when imposing fines, probation and community service. A single fine can be imposed for two or more offences founded on the same facts — or that form, or are part of a series of offences of the same or a similar kind.19 A court may make one or more community service orders for an offender convicted of two or more offences.20 The same rule applies for probation orders.21 A court can impose both a community service order and a probation order for one offence.22
Figure 8 shows how often each penalty type was imposed at the same sentencing event as another penalty type. Darker blue indicates a greater proportion. For example, 28.1 per cent of sentencing events involving a recognisance order being made also involved a partially suspended sentence being imposed. Note however, that the reverse figure is different, only 7.4 per cent of sentencing events involving a partially suspended sentence also involved a recognisance order being imposed.
The diagonal effect from bottom left to top right is a result of multiple penalties of the same type being imposed at the one sentencing event. Other clear patterns in combinations include the 63.6 per cent of events involving convicted not further punished that also involve a sentence of imprisonment, and the 50.3 per cent of events involving both community service and probation orders. Please note, where a single order was made for two or more offences, for example, a single fine or probation order was imposed as the penalty outcome for multiple offences, this order is counted as one penalty.
0
600
1200
100
700
1300
200
800
1400
300
900
400
1000
500
1100
1500
Financial year start
Mon
thly
cour
t of p
enal
ties
Custodial –ALLCustodial –MSO
Non-Custodial – ALLNon-Custodial – MSO
Jun 2005 Jun 2006 Jun 2007 Jun 2008 Jun 2009 Jun 2010 Jun 2011 Jun 2012 Jun 2013 Jun 2014 Jun 2015 Jun 2016 Jun 2017
Moy
niha
n*
80%
beg
ins*
PDLR
end
*
PDLR
ret
urn*
80%
end
s*
CSA
*
* See Appendix 1
August 2018/ v1.0 Queensland Sentencing Advisory Council | 13
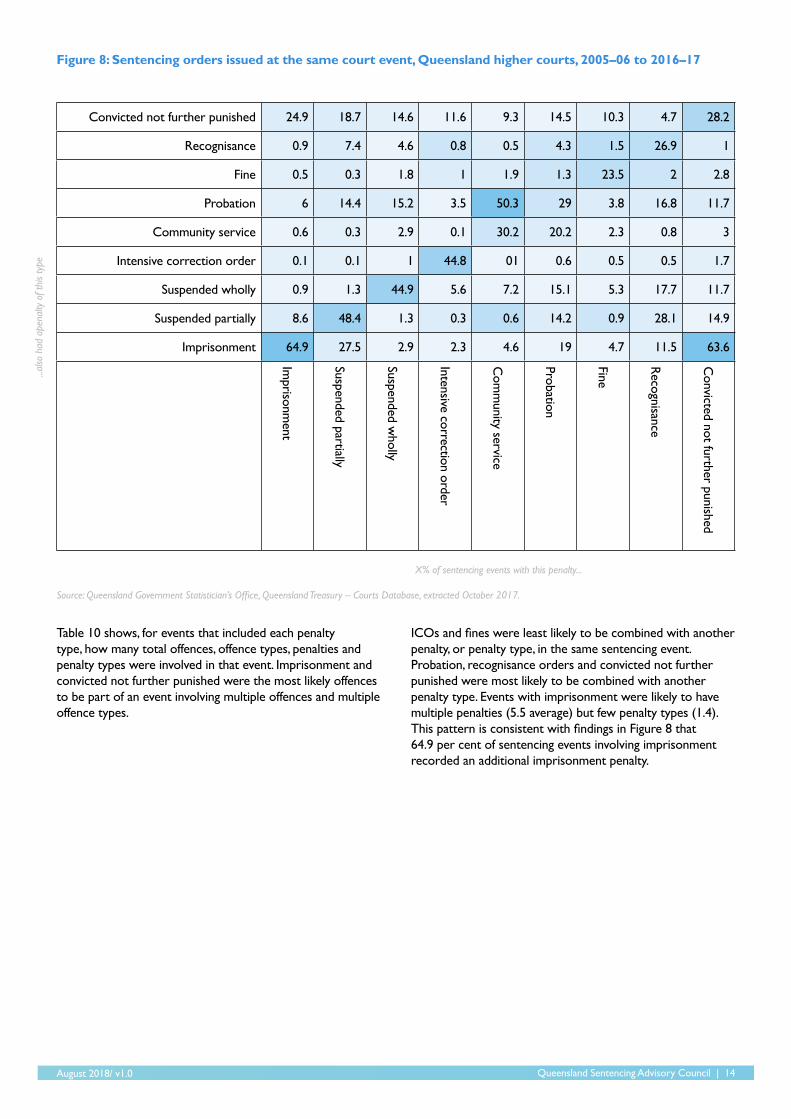
Figure 8: Sentencing orders issued at the same court event, Queensland higher courts, 2005–06 to 2016–17
Source: Queensland Government Statistician’s Office, Queensland Treasury – Courts Database, extracted October 2017.
Convicted not further punished 24.9 18.7 14.6 11.6 9.3 14.5 10.3 4.7 28.2
Recognisance 0.9 7.4 4.6 0.8 0.5 4.3 1.5 26.9 1
Fine 0.5 0.3 1.8 1 1.9 1.3 23.5 2 2.8
Probation 6 14.4 15.2 3.5 50.3 29 3.8 16.8 11.7
Community service 0.6 0.3 2.9 0.1 30.2 20.2 2.3 0.8 3
Intensive correction order 0.1 0.1 1 44.8 01 0.6 0.5 0.5 1.7
Suspended wholly 0.9 1.3 44.9 5.6 7.2 15.1 5.3 17.7 11.7
Suspended partially 8.6 48.4 1.3 0.3 0.6 14.2 0.9 28.1 14.9
Imprisonment 64.9 27.5 2.9 2.3 4.6 19 4.7 11.5 63.6
Imprisonm
ent
Suspended partially
Suspended wholly
Intensive correction order
Com
munity service
Probation
Fine
Recognisance
Convicted not further punished
...also
had
ape
nalty
of t
his
type
X% of sentencing events with this penalty...
ICOs and fines were least likely to be combined with another penalty, or penalty type, in the same sentencing event. Probation, recognisance orders and convicted not further punished were most likely to be combined with another penalty type. Events with imprisonment were likely to have multiple penalties (5.5 average) but few penalty types (1.4). This pattern is consistent with findings in Figure 8 that 64.9 per cent of sentencing events involving imprisonment recorded an additional imprisonment penalty.
Table 10 shows, for events that included each penalty type, how many total offences, offence types, penalties and penalty types were involved in that event. Imprisonment and convicted not further punished were the most likely offences to be part of an event involving multiple offences and multiple offence types.
August 2018/ v1.0 Queensland Sentencing Advisory Council | 14

Table 10: Offence count and penalty count for court events involving adult offenders by penalty type, Queensland higher courts, 2005–06 to 2016–17
PenaltyEvent offences
Event offence types
(QASOC Level 1)Event penalties Event penalty
types
Average Median Average Median Average Median Average Median
Imprisonment 5.9 3 2.1 1 5.5 3 1.4 1
Suspended partially 5.1 3 1.8 1 5 3 1.7 1
Suspended wholly 3.5 2 1.4 1 3.4 2 1.4 1
Intensive correction order 2.9 2 1.5 1 2.9 2 1.3 1
Community service 3.1 2 1.4 1 3.6 2 1.7 2
Probation 4.4 2 1.7 1 4.4 2 1.9 2
Fine 2.4 1 1.3 1 2.2 1 1.3 1
Recognisance 4 2 1.3 1 4.4 2 1.9 2
Convicted not further punished 8.9 6 2.9 2 7.4 4 2.1 2
Source: Queensland Government Statistician’s Office, Queensland Treasury – Courts Database, extracted October 2017.
Earlier, Table 7 showed that the number of offences, offence types, penalties and penalty types per event were significantly lower in the Magistrates Courts than in the higher courts. The largest differences between court types was associated with events with the penalties of convicted not further punished and recognisance orders. Sentencing events with a penalty of convicted not further punished averaged 4 offences and 3.3 penalties in Magistrates Courts as compared to 8.9 offences and 7.4 penalties in the higher courts. Sentencing events with a recognisance order penalty averaged 1.8 offences and 1.5 penalties in the Magistrates Courts as compared to 4.0 offences and 4.4 penalties in the higher courts.
ICOs displayed an opposite pattern, with events involving ICOs averaging 4.6 offences and 4.5 penalties in Magistrates Courts as compared to 2.9 offences and 2.9 penalties in the higher courts.
For more information on the results for the Magistrates Courts see the complementary publication in this series Sentencing Spotlight on offence and sentencing trends: Queensland Magistrates Courts.
Custodial sentencesFigure 9 shows imprisonment was by far the most commonly used form of custodial penalty — the most used across each year, and increasing over the dataset. Imprisonment was also the most common of all penalty types imposed by the higher courts over the 12-year period.
ICOs reduced in use over time, decreasing from 889 orders made in 2005–06 to 79 in 2016–17.
August 2018/ v1.0 Queensland Sentencing Advisory Council | 15
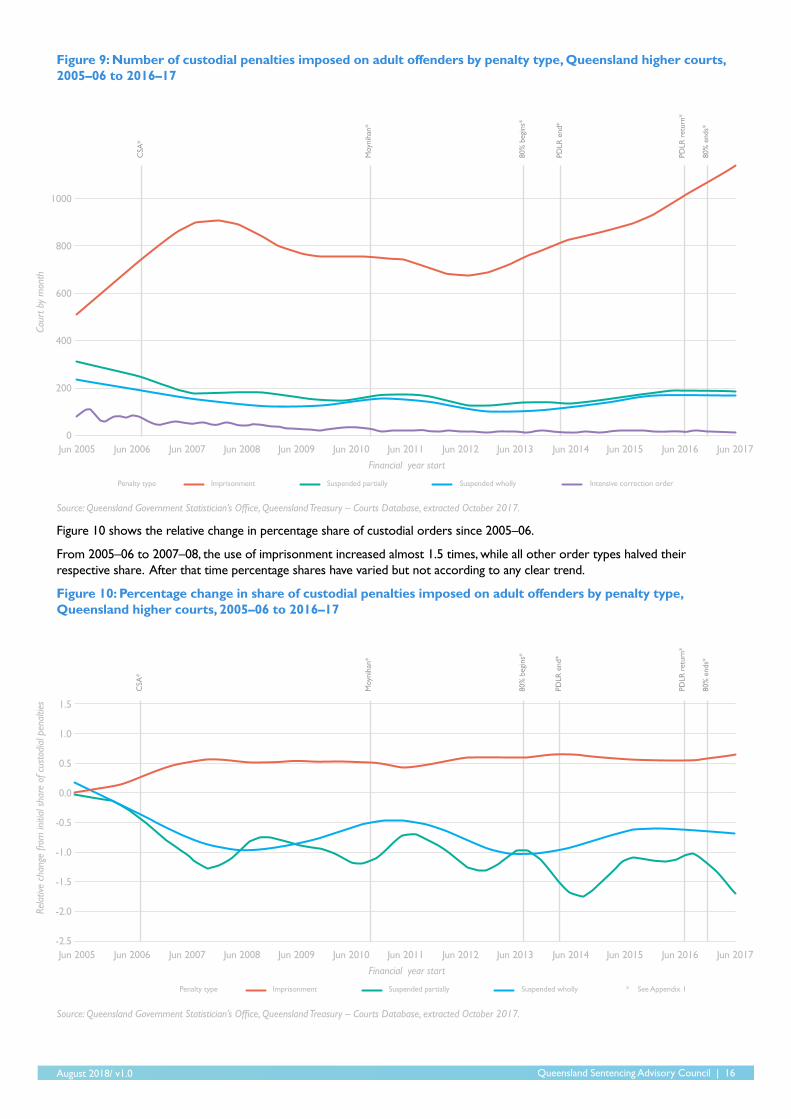
Figure 9: Number of custodial penalties imposed on adult offenders by penalty type, Queensland higher courts, 2005–06 to 2016–17
Source: Queensland Government Statistician’s Office, Queensland Treasury – Courts Database, extracted October 2017.
Figure 10 shows the relative change in percentage share of custodial orders since 2005–06.
From 2005–06 to 2007–08, the use of imprisonment increased almost 1.5 times, while all other order types halved their respective share. After that time percentage shares have varied but not according to any clear trend.
Figure 10: Percentage change in share of custodial penalties imposed on adult offenders by penalty type, Queensland higher courts, 2005–06 to 2016–17
Source: Queensland Government Statistician’s Office, Queensland Treasury – Courts Database, extracted October 2017.
0
-2.5
600
0.0
-0.5
200
-2.0
800
0.5
1.0
400
-1.0
-1.5
1000
1.5
Financial year start
Financial year start
Cour
t by
mon
thRe
lativ
e ch
ange
from
initi
al s
hare
of c
usto
dial
pen
altie
s
Imprisonment
Imprisonment
Suspended partially
Suspended partially
Penalty type
Penalty type
Suspended wholly
Suspended wholly
Intensive correction order
Jun 2005
Jun 2005
Jun 2006
Jun 2006
Jun 2007
Jun 2007
Jun 2008
Jun 2008
Jun 2009
Jun 2009
Jun 2010
Jun 2010
Jun 2011
Jun 2011
Jun 2012
Jun 2012
Jun 2013
Jun 2013
Jun 2014
Jun 2014
Jun 2015
Jun 2015
Jun 2016
Jun 2016
Jun 2017
Jun 2017
Moy
niha
n*M
oyni
han*
80%
beg
ins*
80%
beg
ins*
PDLR
end
*PD
LR e
nd*
PDLR
ret
urn*
PDLR
ret
urn*
80%
end
s*80
% e
nds*
CSA
*C
SA*
* See Appendix 1
August 2018/ v1.0 Queensland Sentencing Advisory Council | 16

Non-custodial sentencesFigure 11 shows that convicted not further punished is the most commonly used form of non-custodial penalty, and its prevalence is increasing relative to others. A number of plausible reasons exist to explain this trend,23 however, examining explanations for observable trends is beyond the scope of this Sentencing Spotlight.
As illustrated in Figure 8, 63.6 per cent of events involving convicted but not further punished also involved imprisonment being imposed for another offence at the same sentencing event. The use of other custodial orders at the same sentencing event was not uncommon. For example, 14.9 per cent of events involving a sentence of convicted not further punished also involved the imposition of a partially suspended sentence, while 11.7 per cent were made at the same sentencing event as a wholly suspended sentence.
An increase in convicted not further punished is also identifiable in Figure 12 which shows the change in share of all non-custodial penalties, by penalty type, relative to the 2005–06 baseline. Figure 12 also depicts a sharp rise and fall in the use of recognisance orders from 2009–10 to 2013–14. While the totals involved are not large, the movements are significant, with actual counts of 409, 627, 769, 460 and 262 being recorded across the five-year period.
The sharp drops in percentage share from June 2015 are not due to a sudden decrease in the use of these penalty types, but rather a result of the significant increase in convicted not further punished visible in Figure 11.
Figure 11: Number of non-custodial penalties imposed on adult offenders by penalty type, Queensland higher courts, 2005–06 to 2016–17
0
200
400
600
Financial Year start
Coun
t by
mon
th
Community service Probation Fine Recognisance Convicted not further punished
Jun 2005 Jun 2006 Jun 2007 Jun 2008 Jun 2009 Jun 2010 Jun 2011 Jun 2012 Jun 2013 Jun 2014 Jun 2015 Jun 2016 Jun 2017
Moy
niha
n
80%
beg
ins
PDLR
end
PDLR
ret
urn
80%
end
s
CSA
Source: Queensland Government Statistician’s Office, Queensland Treasury – Courts Database, extracted October 2017.
August 2018/ v1.0 Queensland Sentencing Advisory Council | 17

Figure 12: Percentage change in share of custodial penalties by penalty type, Queensland higher courts, 2005–06 to 2016–17
Source: Queensland Government Statistician’s Office, Queensland Treasury – Courts Database, extracted October 2017.
Penalties by offence typeFigure 13 and Table 11 provide a snapshot of the penalties each MSO type receives. Imprisonment represents the largest proportion across all offence types except Justice and government offences (QASOC Level 1). For the Justice and government offence type, fines represent the most common penalty (n = 586) closely followed by convicted not further punished (n = 543).
0
-1
-2
-3
0
1
Financial year start
Rela
tive
chan
ge fr
om in
itial
sha
re o
f non
-cus
todi
al p
enal
ties
Community servicePenalty type Probation Fine Recognisance Convicted not further punished
Jun 2005 Jun 2006 Jun 2007 Jun 2008 Jun 2009 Jun 2010 Jun 2011 Jun 2012 Jun 2013 Jun 2014 Jun 2015 Jun 2016 Jun 2017
Moy
niha
n*
80%
beg
ins*
PDLR
end
*
PDLR
ret
urn*
80%
end
s*
CSA
*
* See Appendix 1
August 2018/ v1.0 Queensland Sentencing Advisory Council | 18

Figure 13: Penalty types by MSO (QASOC Level 1), Queensland higher courts, 2005–06 to 2016–17Pe
r ce
nt o
f offe
nces
0
40
80
20
60
Inte
nded
to c
ause
inju
ry
Enda
nger
ing
pers
ons
Robb
ery,
exto
rtio
n
Thef
t
Sexu
al a
ssau
lt
Unl
awfu
l ent
ry
Abd
uctio
n, ha
rass
men
t
Frau
d
Dru
gs
Wea
pons
Prop
erty
and
env
ironm
enta
l
Publ
ic o
rder
Traf
fic a
nd v
ehic
le
Just
ice
and
gove
rnm
ent
Offence type (QASOC Level 1)
Penalty by offence type
100
ImprisonmentSuspended partiallySuspended wholly
FineRecognisanceConvicted not further punished
ProbationIntensive correction orderCommunity service
Hom
icid
e
August 2018/ v1.0 Queensland Sentencing Advisory Council | 19
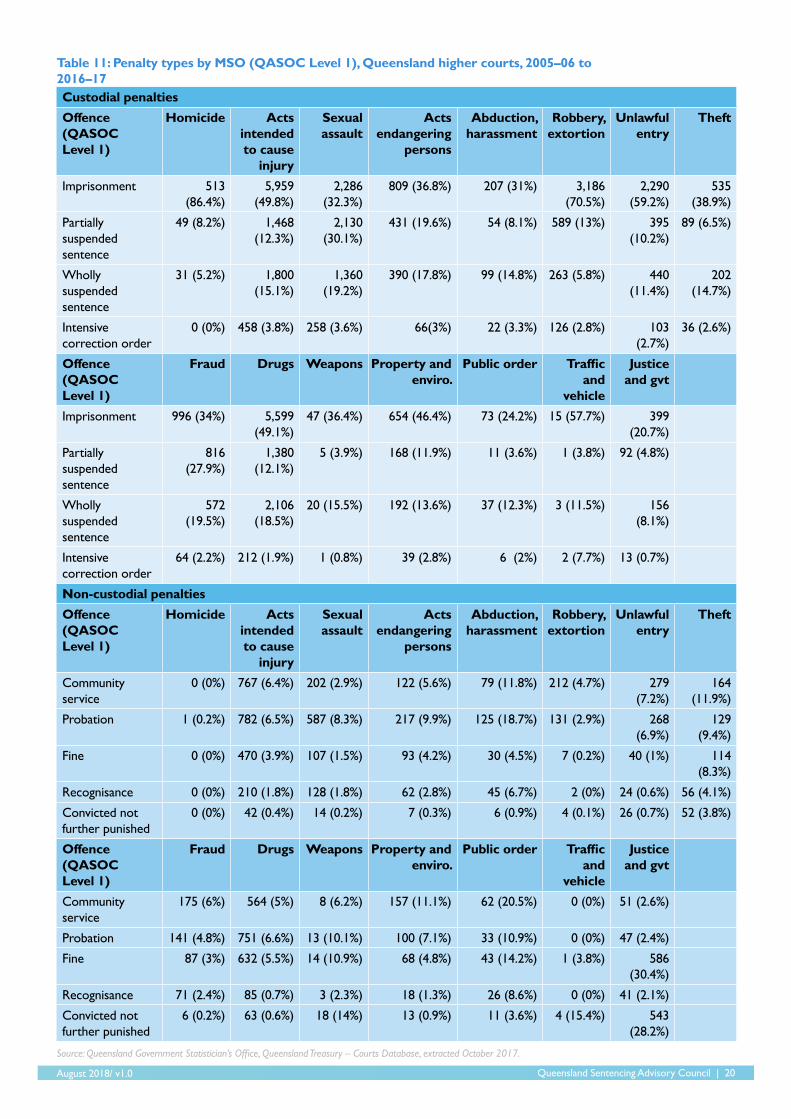
Custodial penaltiesOffence (QASOC Level 1)
Homicide Acts intended to cause
injury
Sexual assault
Acts endangering
persons
Abduction, harassment
Robbery, extortion
Unlawful entry
Theft
Imprisonment 513 (86.4%)
5,959 (49.8%)
2,286 (32.3%)
809 (36.8%) 207 (31%) 3,186 (70.5%)
2,290 (59.2%)
535 (38.9%)
Partially suspended sentence
49 (8.2%) 1,468 (12.3%)
2,130 (30.1%)
431 (19.6%) 54 (8.1%) 589 (13%) 395 (10.2%)
89 (6.5%)
Wholly suspended sentence
31 (5.2%) 1,800 (15.1%)
1,360 (19.2%)
390 (17.8%) 99 (14.8%) 263 (5.8%) 440 (11.4%)
202 (14.7%)
Intensive correction order
0 (0%) 458 (3.8%) 258 (3.6%) 66(3%) 22 (3.3%) 126 (2.8%) 103 (2.7%)
36 (2.6%)
Offence (QASOC Level 1)
Fraud Drugs Weapons Property and enviro.
Public order Traffic and
vehicle
Justice and gvt
Imprisonment 996 (34%) 5,599 (49.1%)
47 (36.4%) 654 (46.4%) 73 (24.2%) 15 (57.7%) 399 (20.7%)
Partially suspended sentence
816 (27.9%)
1,380 (12.1%)
5 (3.9%) 168 (11.9%) 11 (3.6%) 1 (3.8%) 92 (4.8%)
Wholly suspended sentence
572 (19.5%)
2,106 (18.5%)
20 (15.5%) 192 (13.6%) 37 (12.3%) 3 (11.5%) 156 (8.1%)
Intensive correction order
64 (2.2%) 212 (1.9%) 1 (0.8%) 39 (2.8%) 6 (2%) 2 (7.7%) 13 (0.7%)
Non-custodial penaltiesOffence (QASOC Level 1)
Homicide Acts intended to cause
injury
Sexual assault
Acts endangering
persons
Abduction, harassment
Robbery, extortion
Unlawful entry
Theft
Community service
0 (0%) 767 (6.4%) 202 (2.9%) 122 (5.6%) 79 (11.8%) 212 (4.7%) 279 (7.2%)
164 (11.9%)
Probation 1 (0.2%) 782 (6.5%) 587 (8.3%) 217 (9.9%) 125 (18.7%) 131 (2.9%) 268 (6.9%)
129 (9.4%)
Fine 0 (0%) 470 (3.9%) 107 (1.5%) 93 (4.2%) 30 (4.5%) 7 (0.2%) 40 (1%) 114 (8.3%)
Recognisance 0 (0%) 210 (1.8%) 128 (1.8%) 62 (2.8%) 45 (6.7%) 2 (0%) 24 (0.6%) 56 (4.1%)
Convicted not further punished
0 (0%) 42 (0.4%) 14 (0.2%) 7 (0.3%) 6 (0.9%) 4 (0.1%) 26 (0.7%) 52 (3.8%)
Offence (QASOC Level 1)
Fraud Drugs Weapons Property and enviro.
Public order Traffic and
vehicle
Justice and gvt
Community service
175 (6%) 564 (5%) 8 (6.2%) 157 (11.1%) 62 (20.5%) 0 (0%) 51 (2.6%)
Probation 141 (4.8%) 751 (6.6%) 13 (10.1%) 100 (7.1%) 33 (10.9%) 0 (0%) 47 (2.4%)
Fine 87 (3%) 632 (5.5%) 14 (10.9%) 68 (4.8%) 43 (14.2%) 1 (3.8%) 586 (30.4%)
Recognisance 71 (2.4%) 85 (0.7%) 3 (2.3%) 18 (1.3%) 26 (8.6%) 0 (0%) 41 (2.1%)
Convicted not further punished
6 (0.2%) 63 (0.6%) 18 (14%) 13 (0.9%) 11 (3.6%) 4 (15.4%) 543 (28.2%)
Source: Queensland Government Statistician’s Office, Queensland Treasury – Courts Database, extracted October 2017.
Table 11: Penalty types by MSO (QASOC Level 1), Queensland higher courts, 2005–06 to 2016–17
August 2018/ v1.0 Queensland Sentencing Advisory Council | 20

Appendix 1
Significant Queensland legislative changes, 2005–2017
Short name Details Change 1 Change 2
CSA 2006 Corrective Services Act 2006 (Qld), and its parole regime and accompanying insertion of Part 9, Division 3 of the Penalties and Sentences Act 1992 (Qld). This included the introduction of court ordered parole in Queensland.
Commenced 28/08/2006
Moynihan In 2010, legislative amendments referred to as the ‘Moynihan reforms’ changed the jurisdictions of the Magistrates, District and Supreme Courts.24 They expanded the Magistrates Courts’ jurisdiction to determine indictable offences in the Criminal Code (Qld) and Drugs Misuse Act 1986 (Qld) and increased the District Court’s general criminal jurisdiction from offences with a maximum penalty of 14 years or less, to those with a maximum of 20 years or less.25
Commenced 1/11/2010
80% [drug trafficking rule]
This required all drug traffickers sentenced to immediate full-time imprisonment to serve a mandatory minimum non-parole period of 80 per cent of their sentence imposed in actual detention.26 It did not apply if the term of imprisonment was wholly or partially suspended or was to be served by way of an intensive correction order. It meant that an offender who pleaded guilty would not be eligible for parole until after serving 80 per cent of their sentence, instead of at the one-third mark as is commonly ordered by sentencing courts,27 or the 50 per cent mark which otherwise applies.28 The Queensland Court of Appeal confirmed that in relation to applying the 80 per cent rule for drug trafficking:
• a term of imprisonment was only to be suspended where appropriate to do so, and not as a means of circumventing the 80 per cent rule,29 but
– the rule did not create a preference for parole over suspension30
– where a modest sentence length was required, the possibility that the rule might limit the beneficial effect of parole conditions was relevant when choosing between parole and a suspended sentence31
• where the rule applied and actual imprisonment with parole was required, it was appropriate to sentence at the lower end of the available range.32
Commenced 29/08/2013
Removed 9/12/2016
August 2018/ v1.0 Queensland Sentencing Advisory Council | 21

PDLR [prison/ detention last resort]
Under section 9(2)(a) of the Penalties and Sentences Act 1992 (Qld), in sentencing an offender, courts must have regard to the principles that a sentence of imprisonment should only be imposed as a last resort and that a sentence allowing the person to stay in the community is preferable.33 There are legislative exceptions to these principles that apply to offences involving violence, child sexual offending and child exploitation material (where this sentencing principle had already been excluded).
Removed 28/03/2014
Reintroduced I/07/2016
Short name Details Change 1 Change 2
Mandatory community service orders for prescribed offences committed in public places while intoxicated
Under section 108B of the Penalties and Sentences Act 1992 (Qld) a court which convicts an offender of a ‘prescribed offence’34 with a specific circumstance of aggravation, must make a community service order, whether or not it also makes another order. The circumstance of aggravation is that the offender committed the offence in a public place whilst adversely affected by an intoxicating substance. The court can decline to make a community service order if satisfied the offender could not comply with the order because of any physical, intellectual or psychiatric disability.
Commenced 1/12/2014
Domestic violence Under s 9(10A) of the Penalties and Sentences Act 1992 (Qld), a court sentencing for a domestic violence offence (as defined under section 1 of the Criminal Code) must treat the fact that it is a domestic violence offence as an aggravating factor, unless it considers it is not reasonable because of the exceptional circumstances of the case.
Applies to offences committed on or after 5/05/2016
August 2018/ v1.0 Queensland Sentencing Advisory Council | 22

Endnotes1 The data is sourced from the Department of Justice and
Attorney-General’s Queensland Wide Inter-linked Courts (QWIC) database, as maintained by the Queensland Government Statistician (GovStats). For more information, see the Sentencing Spotlight technical information paper available on the Council’s website www.sentencingcouncil.qld.gov.au
2 More information about data sources, limitations and counting rules can be found in the Sentencing Spotlight technical information paper available on the Council’s website.
3 See the technical paper for information about MSO and how the MSO per sentencing event is determined and counted for the purposes of the Council’s Sentencing Spotlight series: <http://www.sentencingcouncil.qld.gov.au/__data/assets/pdf_file/0003/517773/Sentencing-Spotlight-Technical-Information.pdf>
4 As to a global penalty for multiple offences, imprisonment and probation can only be combined for one charge under the confines of legislation (actual imprisonment of one year or less, immediately followed by a period of probation in the community of between nine months and three years): Penalties and Sentences Act 1992 (Qld) s 92. A single fine can be imposed for two or more offences founded on the same facts or that form, or are part of, a series of offences of the same or a similar kind: Penalties and Sentences Act 1992 (Qld) s 49. A court may make one or more community service orders for an offender convicted of two or more offences: Penalties and Sentences Act 1992 (Qld) s 107. The same rule applies for probation orders: Penalties and Sentences Act 1992 (Qld) s 97. A court can impose both a community service order and a probation order for one offence: Penalties and Sentences Act 1992 (Qld) s 109.
5 A suspended sentence can only be breached if the person subject to it is convicted of an offence punishable by imprisonment during the operational period of the order; but the breach of the order in and of itself does not constitute a separate ‘offence’ for which the person can be sentenced: Penalties and Sentences Act 1992 (Qld) sections 146 and 147 (cf sections 123, 125, 125 and 127 regarding breach of community based orders, including intensive correction orders). The vast majority of these were recorded either as ‘convicted not further punished’ or ‘rising of the court’. Over 6700 breach of suspended prison sentence outcomes were recorded as ‘convicted and not further punished’ over the reporting period, with a further 594 recorded as being sentenced to the ‘rising of the court’. These breaches were excluded from the data analysis on the basis that the recording of these actions on breach is for recording purposes only and does not constitute a true penalty outcome or sentence. See further R v Skinner [2001] 1 Qd R 322, 324-325.
6 These orders are commonly referred to as ‘ancillary orders’ and are in addition to any other sentence imposed. See, for example, Penalties and Sentences Act 1992 (Qld) s 35(2) which provides that orders for restitution and compensation may be made ‘in addition to any other sentence to which the offender is liable’. Courts have recognised that restitution and compensation orders are additional to an independent sentencing option. They are not a form of punishment, despite being part of the ‘sentence’ or judgment: R v Ferrari [1997] 2 Qd R 472, 477 (McPherson JA). Where these orders were the only penalty recorded for an offence, that offence was excluded from analysis.
7 Over the reporting period, there were 768 ‘rising of the court’ penalties imposed by the higher courts, of which 766 were also the most serious penalty imposed for the offence for which the sentence was imposed. The majority of these (n=594; 77.5%) were recorded against breach of suspended sentence, which were excluded for the reasons detailed in note 5 above.
8 See <http://www.sentencingcouncil.qld.gov.au/research/sentencing-spotlight>.
9 See the Council’s Sentencing Guide for further information about the structure of courts in Queensland available on the Council’s website.
10 Magistrates Courts of Queensland Annual Report 2016–2017 (2017), 5 available at <http://www.courts.qld.gov.au/__data/assets/pdf_file/0006/561237/mc-ar-2016-2017.pdf>.
11 See District Court of Queensland Act 1967 (Qld) s 61. The District Court’s criminal jurisdictional ceiling was lifted from 14 years to 20 years imprisonment by amendments in the Civil and Criminal Jurisdiction Reform and Modernisation Amendment Act 2010 (Qld) s 48.
12 See Criminal Code (Qld) s 651 and Penalties and Sentences Act 1992 (Qld) s 189.
13 Imprisonment sentence length calculations do not include the 266 life sentences imposed in the period.
14 While a suspended sentence for a Queensland offence cannot exceed five years, this data includes sentencing outcomes for Commonwealth offences. A recognisance release order for a Commonwealth offence cannot be imposed for a head sentence exceeding three years. However, this three-year limit was only introduced from November 2015. Previously, where a court sentenced an offender to imprisonment for one or more offences and the aggregate sentence exceeded three years, s 19AB(1) Crimes Act 1914 (Cth) provided that the court must either set a non-parole period or make a recognisance release order (but may decline to do either if satisfied it is not appropriate to do so).
August 2018/ v1.0 Queensland Sentencing Advisory Council | 23
15 R v CAI [2008] QCA 359, 3 (Muir JA).16 R v Crofts [1999] Qd R 386, 387.17 Penalties and Sentences Act 1992 (Qld) s 92.18 See R v Hood [2005] 2 Qd R 54.19 Penalties and Sentences Act 1992 (Qld) s 49.20 Penalties and Sentences Act 1992 (Qld) s 107.21 Penalties and Sentences Act 1992 (Qld) s 97.22 Penalties and Sentences Act 1992 (Qld) s 109.23 High level analysis for 2011–12 to 2016–17 suggests the
growth has in part has been led by the following four offences, which constituted 54 per cent of the increase in these sentencing outcomes: Possession of drug utensils (18%); Possess illicit drugs (15%); Deal or traffic in illicit drugs (14%); Illicit drug offences, not elsewhere classified (remainder) (8%).There are administrative procedures allowing for Magistrates Court level charges to be dealt with in the higher courts – see Criminal Code (Qld) s 651 and Penalties and Sentences Act 1992 (Qld) s 189. For legislation dealing with taking pre-sentence custody into account on sentence, see s 159A of the Penalties and Sentences Act 1992 (Qld). For a discussion of the limits of the jurisdiction of the Magistrates Courts and the elective rights of the prosecution and defence regarding which court offences can be heard in, see the discussion in the companion Spotlight, Sentencing Spotlight on offence and sentencing trends: Queensland Magistrates Courts, which discusses sections 552A, 552B, 552BA, 552D and 552H of the Criminal Code (Qld) and sections 13, 14 and 118 of the Drugs Misuse Act 1986 (Qld).
24 Civil and Criminal Jurisdiction Reform and Modernisation Amendment Act 2010 (Qld) — assent on 13 August 2010 — provisions including various changes to the criminal law jurisdiction commenced 1 November 2010.
25 Explanatory Notes, Civil and Criminal Jurisdiction Reform and Modernisation Amendment Bill 2010, 1.
26 Inserted by the Justice and Other Legislation Amendment Act 2013 (Qld) sections 42B and 68B, removed by the Serious and Organised Crime Legislation Amendment Act 2016 (Qld) sections 21, 162, 164. It applied to a trafficking offence which occurred wholly on or after 13 August 2013: Justice and Other Legislation Amendment Act 2013 (Qld) s 68C.
27 See R v Crouch; R v Carlisle [2016] QCA 81, 8 [29] (McMurdo P).
28 Corrective Services Act 2006 (Qld) s 184(2). This is the general statutory rule which a sentencing judge can generally override. Other more specific legislative provisions can also mean more non-parole time, such as serious violent offence declarations (Penalties and Sentences Act 1992 (Qld) Part 9A) and the serious organised crime circumstance of aggravation provisions (Penalties and Sentences Act 1992 (Qld) Part 9D. Both of these tools can apply to drug trafficking).
29 R v Clark [2016] QCA 173, 9 [34], 13 [53] (Morrison JA).
30 R v Borowicz [2016] QCA 211, 10 [42]-[43] (Gotterson JA) agreeing with the R v Clark [2016] QCA 173 judgment.
31 R v Borowicz [2016] QCA 211, 10 [44] (Gotterson JA).32 R v Clark [2016] QCA 173, 3 [5] (McMurdo P) and 16
[68] (Morrison JA); see also R v Brookes [2017] QCA 63, 8 [32], 9 [39] and 10 [42] (McMurdo JA).
33 Penalties and Sentences Act 1992 (Qld) s 9(2). Removed by the Youth Justice and Other Legislation Amendment Act 2014 (Qld) (assent 28 March 2014) and reintroduced by the Youth Justice and Other Legislation Amendment Act (No. 1) 2016 (Qld) (assent 27 June 2016).
34 Prescribed offences are affray, grievous bodily harm, wounding, common assault, assault occasioning bodily harm or serious assault (of a police or public officer) under the Criminal Code (Qld); and assaulting or obstructing a police officer under the Police Powers and Responsibilities Act 2000 (Qld).
August 2018/ v1.0 Queensland Sentencing Advisory Council | 24

Notes
August 2018/ v1.0 Queensland Sentencing Advisory Council | 25

Notes
August 2018/ v1.0 Queensland Sentencing Advisory Council | 26

Notes
August 2018/ v1.0 Queensland Sentencing Advisory Council | 27

Sentencing Spotlight on… offence and sentencing trends: Queensland Supreme and District Courts Published by the Queensland Sentencing Advisory Council, August 2018
© Queensland Sentencing Advisory Council 2018
This Sentencing Spotlight on…offence and sentencing trends: Queensland Supreme and District Courts is licensed under a Creative Commons Attribution (CC BY) 4.0 International licence. You are free to copy and adapt the work as long as you attribute the Queensland Sentencing Advisory Council.
For more information:Email: [email protected]: (07) 3224 7370Website: www.sentencingcouncil.qld.gov.au
Disclaimer:The content presented in this publication is distributed by the Queensland Sentencing Advisory Council as an information source only. While all reasonable care has been taken in its preparation, no liability is assumed for any errors or omissions. Queensland Sentencing Advisory Council makes every effort to ensure the data is accurate at the time of publication, however the administrative data are subject to a range of limitations.
![Sentencing since Muldrock The impact of the High …...[footnotes omitted] Following Muldrock, this has been found to be so in at least one case in relation to the offence of cultivating](https://static.documents.pub/doc/80x56/5fe5a566ae60b1320c4c8e50/sentencing-since-muldrock-the-impact-of-the-high-footnotes-omitted-following.jpg)


