SEO’s, Real Options, and Risk Dynamics: Empirical Evidence Murray Carlson, Adlai Fisher, and Ron Giammarino The University of British Columbia * May 5, 2005 Abstract This paper presents new evidence on the dynamics of firm level beta and volatil- ity in the time period surrounding seasoned equity offerings. Beta increases prior to the SEO and decreases thereafter, consistent with recent real options theories of SEO underperformance. Volatility, on the other hand, decreases before and increases after SEO’s. Some of this effect is due to market level rather than id- iosyncratic factors. This suggests a potential role for time variation in volatility in the issuance decision, which has not previously been explored in either the theoret- ical or empirical literature. We hand collect from press releases the proposed use of SEO funds, and investigate whether the type of use relates to post-issuance risk and long-run performance. We also demonstrate that a simple conditional dynamic asset pricing model can explain the return patterns of SEO firms in the post-issue period. Underperformance of SEO’s disappears once we account for dynamics in beta. * Sauder School of Business, University of British Columbia, 2053 Main Mall, Vancouver, BC, V6T 1Z2. We thank seminar participants at the University of Calgary for helpful comments. Support for this project from the Social Sciences and Humanities Research Council of Canada (grant number 410- 2003-0741) and the UBC Bureau of Asset Management is gratefully acknowledged.
Transcript
SEO’s, Real Options, and Risk Dynamics:
Empirical Evidence
Murray Carlson, Adlai Fisher, and Ron Giammarino
The University of British Columbia∗
May 5, 2005
Abstract
This paper presents new evidence on the dynamics of firm level beta and volatil-
ity in the time period surrounding seasoned equity offerings. Beta increases prior
to the SEO and decreases thereafter, consistent with recent real options theories
of SEO underperformance. Volatility, on the other hand, decreases before and
increases after SEO’s. Some of this effect is due to market level rather than id-
iosyncratic factors. This suggests a potential role for time variation in volatility in
the issuance decision, which has not previously been explored in either the theoret-
ical or empirical literature. We hand collect from press releases the proposed use
of SEO funds, and investigate whether the type of use relates to post-issuance risk
and long-run performance. We also demonstrate that a simple conditional dynamic
asset pricing model can explain the return patterns of SEO firms in the post-issue
period. Underperformance of SEO’s disappears once we account for dynamics in
beta.
∗Sauder School of Business, University of British Columbia, 2053 Main Mall, Vancouver, BC, V6T
1Z2. We thank seminar participants at the University of Calgary for helpful comments. Support for
this project from the Social Sciences and Humanities Research Council of Canada (grant number 410-
2003-0741) and the UBC Bureau of Asset Management is gratefully acknowledged.
SEO’s, Real Options, and Risk Dynamics:Empirical Evidence
Abstract
This paper presents new evidence on the dynamics of firm level beta and volatil-
ity in the time period surrounding seasoned equity offerings. Beta increases prior to
the SEO and decreases thereafter, consistent with recent real options theories of SEO
underperformance. Volatility, on the other hand, decreases before and increases after
SEO’s. Some of this effect is due to market level rather than idiosyncratic factors.
This suggests a potential role for time variation in volatility in the issuance decision,
which has not previously been explored in either the theoretical or empirical literature.
We hand collect from press releases the proposed use of SEO funds, and investigate
whether the type of use relates to post-issuance risk and long-run performance. We
also demonstrate that a simple conditional dynamic asset pricing model can explain
the return patterns of SEO firms in the post-issue period. Underperformance of SEO’s
disappears once we account for dynamics in beta.
JEL Classification: G31, G32
Keywords: Seasoned Equity Offering, Real Options, Event Studies, Announcement
Effects, Abnormal Returns, Selection Bias
1. Introduction
The pattern of stock returns through seasoned equity offering (SEO) episodes has at-
tracted a great deal of interest and research. Summarizing a large literature Ritter
(2003) reports that investors enjoy an average return of 72% in the year prior to the an-
nouncement of an SEO, a two day cumulative return of -2% around the announcement
date and returns in the five years subsequent to the issue that are on average 5% less
than apparently reasonable benchmark firms. These characteristics do not seem to fit
well in a value maximizing, efficient markets framework. Why would rational investors
in an efficient market participate in SEO’s when on average they earn less than they
would by investing in comparable firms?
These puzzles have been a magnet for analysis based on cognitive biases and irra-
tionality1. The intuition of behavioral explanations is compelling. For instance, suppose
that some shares become popular with investors for reasons unrelated to fundamental
value. Due to cognitive biases, information that support the positive bias is given larger
weight than information that contradicts it. Consequently, the pre-issue run-up reflects
the overweighting of positive news rather than an objective view of fundamentals. Re-
sponding to the ’over pricing’ of the equity, managers issue shares at inflated prices. In
some versions of the explanation the managers are rational and simply take advantage
of an irrational market. In other versions, managers display the same cognitive bias as
the investors. Over a long enough period subsequent to the issue sufficient information
arrives to correct the excessive optimism despite the cognitive bias. Hence, post issue
underperformance reflects the predictable correction of an overly optimistic market.
While a large body of work has been devoted to extending and testing behavioral
explanations, a more recent literature explains the return patterns around an SEO as
the dynamic implications of the rationally anticipated optimal exercise of a growth
option. Relative to behavioral explanations, the critical element of this literature is a
link between the exercise of a real option and the dynamics of risk and return.
In this paper we report evidence supporting the real options explanation. We ex-
amine the the changes in risk and return at high frequency through an SEO episode.
We replicate earlier results by showing that underperformance is detected when static
risk adjustment is used but go on to show that underperformance is eliminated when
the dynamics of beta are explicitly recognized. Although others have looked for changes
in risk that explain post issue underperformance, the focus has been on low frequency
betas and the results have been mixed. For instance, in a single factor model Healey
1For a survey of this literature see Baker, Ruback, and Wrugler (2004).
1
and Palepu (1990) find that risk goes up after an SEO. Denis and Kadlec (1995) find
that the apparent risk increase is due to changes in liquidity and that once liquidity is
accounted for, risk does not change following an SEO.
We contribute to this literature by taking a dynamic view of the SEO episode and
focusing on higher frequency evidence. Rather than seeing an SEO as corresponding
to a single discreet change in the state of the firm, we explicitly recognize the dynam-
ics involved. Specifically, we recognize that a firm that manages an expansion option
through to an expansion goes through the following stages (although not necessarily in
this order).
1. A period of time in which the firm has the option to expand.
2. A point when the firm commits to expand in the future.
3. A point in time when equity is issued to finance the expansion
4. A period in time after funds are raised but before the expansion is completed.
5. A point in time when the expansion is completed and paid for.
This view of growth option exercise implies a time pattern of risk and return around
an SEO that depends on where in the process funds are raised and when the expansion
is paid for. Ideally we would test this at high frequencies with explicit market value
balance sheet information.
We add to the existing literature in a number of ways. First, we use the theory on
dynamic betas to motivate an investigation of the relationship between pre-issue run
up, announcement effect and post issue returns. Second we consider higher frequency
estimates of equity beta. Past studies have estimated beta for annual windows using
daily returns. In contrast, we consider monthly estimation periods using daily returns.
This allows us to examine the extent to which risk dynamics follow a pattern consistent
with the theory. Third, since accounting information is not available on a monthly basis,
we rely on stated purposes of the issue to determine classes of firms that are in different
states. To do this, we hand collect from press releases the proposed use of SEO funds.
Categories include retiring debt, buying new capital, engaging in acquisitions, working
capital, and general purposes. We investigate whether the stated use of funds, run up,
and announcement effect are useful instruments for predicting the relative post-issuance
risk and long-run performance of SEO firms.
We find a number of new facts, many of which are consistent with real option
theories. The pre-issue price run up, announcement effect, and post issue performance
2
are related in ways that reflect, at least in part, differences in expectation of the event.
Beta dynamics are generally consistent with a real options explanation: Risk increases
prior to the announcement of an SEO and falls subsequently. Again, the anticipation
of the announcement seems to be reflected in the relationship between pre-issue run
up, announcement effect, and post issue decrease in beta. In contrast to the simple
real options theories, however, return volatility seems to be lowest at the SEO event.
While the pattern of volatility rejects the existing real option theories, they suggest
that stochastic volatility may be a factor in expansion decisions. There is also evidence
of exceptionally low volatility between the filing and issue date, consistent with price
support activities by investment bankers.
Finally, we demonstrate that a simple conditional dynamic asset pricing model can
explain the return patterns of SEO firms in the post-issue period. In particular, un-
derperformance of SEO’s disappears once we account for dynamics in beta. Our work
highlights the importance of reexamining the static traditional null hypothesis of con-
stant risk, regardless of the nature of the event examined.
In section 2 we describe a model that develops the intuition of return dynamics in
a simple setting. Section 3 describes our empirical approach to the problem. Return
dynamics are discussed in section 4 and risk dynamics are discussed in section 5. We
bring risk and return together in section 6.
2. Theories of Risk and Return Dynamics
Theories of SEO timing, return dynamics, and underperformance can be broadly divided
into those that rely on changes in risk and those that do not. Studies that attribute
SEO-related phenomena to factors other than risk can be described as “behavioral,”
because they rely on cognitive bias and persistent mispricing to explain observed return
patterns.
The leading behavioral descriptions of SEO underperformance include Daniel, Hir-
shleifer, and Subrahmanyam (1998) and the windows of opportunity theory of Loughran
and Ritter (1995) and Baker and Wurgler (2002). For our purposes, the important fact
about these theories is that they are silent about the link between the return dynamics
of SEO firms and risk. Thus, explanations of and evidence regarding risk and return
dynamics are outside the scope of the existing behavioral explanations.
Among the existing risk-based explanations, Carlson, Fisher, and Giammarino (2005,
hereafter “CFG”), focus exclusively on risk and return dynamics around SEO’s. The
basic idea can be illustrated in a simple setting. Consider an environment where firms
3
produce from existing capacity but will expand capacity if demand growth is sufficient.
At any point in time, therefore, the firm can be viewed as a portfolio of an asset in place
and a number of growth options. An important assumption is that firms face fixed one–
time costs in expanding capacity. As a result, capacity adjustments will be lumpy and
investment announcements will be discrete events. The link to SEOs is through the
additional assumption that SEOs are used to finance capacity expansions.
Although physical expansion is discrete in this environment, the corresponding dy-
namics of firm value are smooth. Starting from any given capacity and level of demand,
as demand for current output increases, total value increases for two reasons. First,
higher demand means greater cash flows from the current capacity so the value of assets
in place increases. Second, higher demand means that the growth option value has
increased as the option is more likely to be exercised. If investors anticipate optimal
expansion, firm value will smoothly evolve to reflect the value of the expanding firm.
While the firm’s capital evolves in a lumpy manner, and value evolves smoothly,
the risk of the firm evolves in a way that is typically smooth but jumps at the point
that a firm expands. In general, when demand increases, the risk of the firm will
smoothly change to reflect the change in the portfolio weights between the growth option
and assets in place. Risk discretely drops, however, when the firm optimally exercises
its options since at that instant the growth option is replaced with the underlying
asset. CFG show that if the market fully anticipates the investment decision, then,
growth must result in a discrete drop in asset risk, regardless of the riskiness of the new
investment.
This explanation works through the cash flow (or “numerator”) channel in the sense
that discount rates for a cash flow of given riskiness are held constant. Rather, the
riskiness of expected cash flows drive changes in expected returns as the composition of
the firm between growth options and assets-in-place changes.
2.1. A Simple Model of Return Dynamics
This section provides a description of a simple dynamic risk model. Consider a firm
at t = 0 that produces output level q0, the maximum that it can produce at current
capacity. In addition, assume that the firm faces fixed per period operating costs f0. It
has one option to irreversibly expand by paying an amount λ. When this occurs, the
firm has output level q1 > q0 and fixed costs f1 > f0. Firm cash flows are affected by a
state variably Xt which, under the risk-neutral measure, follows dynamics
dXt = (r − δ)Xtdt + σXtdzt
4
where r is the risk-free rate, δ > 0, σ is volatility, and zt is a standard Brownian motion.
In this setting, for any t ≥ 0 cash flows are given by
Xtqγi − fi
for i = 0, 1. Let x denote the level of the state variable X when the firm optimally
expands, and denote by τ the associated stopping time. Prior to the expansion, the
firm value is given by
V0 (Xt) = Xtqγ0
δ−
f0
r+ Xν
t
ε
xν, (1)
where ε can be interpreted as the incremental value of firm expansion when undertaken
and ν > 1 is the beta of the growth option.
The corresponding risk of the firm is
β0 = 1 +V F
0
V0
+V G
V0
(ν − 1) . (2)
The first term in 2 is the beta of the revenues generated by the assets in place. For
convenience we assume that these cash flows have a beta of 1. The second term reflects
the operating risk of the firm and the third captures the risk of the growth option.
Notice that the growth option is a call on more capacity and that this capacity will
have the same revenue risk as assets in place (i.e. β = 1). The risk of the growth
option, ν is, however, greater than 1, reflecting the leverage implicit in an option.
Expression 2 can be used to see the smooth evolution of risk as demand evolves
during non expansion times. As demand grows the risk of the revenues do not change
and have a β = 1. However, as demand grows, total firm value V0 increases so that the
risk from operating leverage (V F
0
V0) decreases. At the same time, however, the value of
the growth option V G increases as a percentage of the total value so the beta of the
firm as a whole will increase since ν > 1.
Risk dynamics at an expansion point are different. CFG show that, for a fully
anticipated expansion at time τ , the beta of the firm must change by the amount
∆β =−λ
V0(x)
[
1 +f1/r
V1(x)
]
< 0,
where V0 and V1, respectively, denote the value of the firm before and after investment.
SEO issuance associated with investment thus leads to a drop in beta. Note that beta
here need not be market beta; it is a measure of exposure to any priced risks in the
state variable X. The theory thus does not require that any particular asset pricing
model hold.
5
In practice, actual SEOs are much more complex than has been recognized in this
literature. In order to gain greater insight in to the empirical results we discuss two
elements of the real world that impact on our empirical observations. The first is
recognition that, while the existence of a growth option may be partially anticipated, the
announcement of an SEO may convey new information to the market about the option.
The second is recognition that the timing of the SEO and investment is more complex
than this simple model recognizes. In the model the SEO is registered, marketed and
sold, and the proceeds are collected and spent on expansion, all at an instant in time.
In reality, registration, sale, collection of proceeds, and expenditure on expansion take
place over several months or even years.
2.2. Partial Anticipation
The previous section describes the dynamics of the intrinsic risk of the firm through
an episode where demand follows a growth path that results in an expansion. This
will also be the path of the market beta if the expansion is fully anticipated. In this
section we recognize that the market risk of the company can increase if the existence of
an expansion option is not fully anticipated prior to the corporate announcement. We
discuss this possibility heuristically.
Suppose that managers observe X directly but investors observe only a noisy signal
about X. When an SEO is announced, however, the market is able to infer from the
decision the value of X and therefore to learn that the option is worth more than was
publicly realized.
This has several implications. In particular, when investors are less informed, we
expect (1) less pre-issuance price runup, because they attach less weight to any com-
monly observed indicator of growth, such as reported earnings or sales, and; (2) more
positive announcement effects for investment motivated issuance announcement; and
(3) the possibility of higher risk as the market learns that the firm has a very risky
growth option that it is close to exercising. This motivates analyzing the data for a
relationship between the runup, announcement effect, and underperformance.
2.3. Capital Structure
The simple story above holds for an all equity firm. For a levered firm, the predictions
about risk dynamics continue to hold with the modification that they now apply to the
asset beta, βA. Although changes in equity βE will reflect firm leverage, the qualitative
results of the previous section will continue to hold as long as the outstanding debt does
6
not change.
In practice, and in our sample of firms, however, firms do issue in order to retire debt.
This has two implications for our work. First, for a firm with a long-run target capital
structure, we expect equity issuance to occur after a string of negative results. Also
post-issuance beta should decrease after the issuance because of a decrease in financial,
rather than growth option, leverage. This motivates examining the SEO issue decision
to consider information regarding the purpose for which the funds are to be used.
2.4. Separating Investment and Issuance
The dynamic risk theory assumes that investment and equity issuance occur simultane-
ously. In practice, the issue, expansion decision is much more complex. To illustrate,
consider the real time line for one SEO episode in our sample, Starbucks. Starbucks
was a private company until 1992 when it issued an IPO. At the end of 1992 Starbucks
had 165 stores. In 1993 the company issued convertible debentures and ended the year
with 272 stores. The following year the firm undertook the seasoned equity offering
that is identified in our sample. The stated purpose of the SEO was to raise funds
for investment. It ended that year with 425 stores. The following year the company
completed a second convertible debenture issue and ended the year with 676 stores. In
1996 the company converted the first debt issue into equity and ended the year with
1015 stores. The following year the company converted the remained convertible debt
into common shares and ended 1997 with 1412 stores.
Since that time the company has not raised funds from the public equity market
and instead has repurchased shares on several occasions. At year end 2004 the company
had over 8,500 stores, 20 times the number of stores that it had after completing the
SEO that appears in our data.
Figure 1 presents a time line of investment relative to assets in place and cash relative
to total assets. It certainly seems that Starbucks exercised a growth option. In fact
Starbucks financed a series of growth options that were exercised between 1993 and
1997. The expansions were were financed by a depletion of cash balances, the issuance
of convertible debentures as well as the SEO. It is beyond the scope of this paper to
develop a theory to reflect the full complexity of an SEO episode. Nevertheless, we can
use the insights gained from the simple model to guide our empirical work.
An expansion option and SEO typically involves the milestones illustrated in figure
2. In this figure, the exercise of an option is separated into the following distinct stages.
• The firm exercises a growth option by committing to acquire the underlying asset.
7
The fact that it will take time to put the asset in place (i.e., time to build) is
modelled as the acquisition of the underlying asset and the issuance of debt to the
seller of the asset2. We will refer to this as the3 ’builder’s debt’. The maturity
of the debt is technologically given, reflecting an exogenous time to build. Note
that builder’s debt will not appear as debt on the balance sheet and need not
be an obligation to an external party. For instance, a company that embarks
on an expansion that will be built by its own staff enters into a commitment to
pay the wages of the workers who are involved with the expansion as well as all
other expenses incurred. Consistent with the previous notation, the cost of the
expansion will be denoted by λ so that committing to purchase the asset is like
issuing a bond with a face value of λ, and a current market value of B.
• The next event in figure 2 is the registration of new shares. This will not directly
change the assets or liabilities of the firm but may provide information to the mar-
ket about the existence of a growth option and/or the commitment to undertake
the expansion. This in turn could increase or decrease the market value of the
equity.
• After the new shares are registered they are issued and cash is received. For
convenience, assume the amount raised through the issue is equal to the cost of
the expansion, λ.
• The equity issue may bring in funds prior to the time that the expansion must
be paid for (i.e. prior to the maturity of the builder’s debt). To capture this, we
allow the firm to invest the proceeds in securities.
• Finally, the securities are sold to retire the builders debt.
To examine the impact of these events on risk consider the market value balance
sheet of the firm at any point in time. Assets consist of Plant and Equipment (P ), Cash
and Securities (C), and Growth Options (GO). Claims against the firm include public
debt (D), builders debt (B), and equity (E). Hence, the market value balance sheet
identity will be
P + C + GO = D + B + E.
2The risk of a commitment to build was first recognized by Rice and Black (1995)3Alternatively, this can be thought of as a forward contract in which the firm commits to take delivery
of new plant at a future period. This alternative model would have essentially the same implications.
8
At any instant in time, the betas of different components of the firm will be related to
each other by a similar relationship. To maintain consistency, assume that the revenue
beta is 1, and the beta of the growth option is4 ν.
P
V+
C
VβC +
GO
Vν =
D
VβD +
B
VβB +
E
VβE
This can be rearranged to highlight the equity beta of the firm.
βE =P
E+ βC C
E+ ν
GO
E− βD D
E− βB B
E
The way in which the financing tactics can change the risk of a firm is illustrated
in Figure 2. Consider an all equity firm (D = 0), that initially has no cash holdings
(C = 0), holds a single growth option and has not committed to expand (B = 0). The
risk of this firm’s equity is
βE =P
E+ ν
GO
E
If the growth option is very small, the firm’s equity has a beta of approximately 1. As
the value of the growth option increases the risk of the equity also increases since ν > 1.
Now consider the risk of the firm at the point where it commits to expand but before
it has issued new shares. The commitment involves the acquisition of a plant worth λ
and the issuance of a builder’s bond.
βE =P + ε + λ
E− βB B
E.
Hence, the risk of the firm has changed from a firm with a growth option - i.e. a levered
position on the underlying asset, to one without the option leverage but now with
financial leverage. Although the net effect depends on the financial leverage relative to
the option leverage, at the instant that the option is exercised, the leverage is the same.
When equity is sold and invested in securities, the beta changes again.
βE =P + ε + λ
E + λ− βB B
E + λ+ βC λ
E + λ.
Notice that there are two offsetting affects here. On the one hand risk goes down as new
equity is brought into the firm. Essentially, the operating risk of the firm is distributed
over a larger equity base. On the other hand, the firm uses the proceeds of the issue, λ
4The beta of the growth option will be independent of time for the perpetual American option
described in the previous section but will more generally be time dependent.
9
to purchase securities. If the securities are risky, the risk of the firm could actually go
up.
Finally, when the securities are sold and the builder’s debt is paid off, the risk of
the firm falls.
βE =P + ε + λ
E + λ= 1.
In summary, when the tactics used to finance a real option exercise are recognized,
the risk dynamics of the firm become more complex but exhibit roughly the same pattern
found in the real options theory. When options are deep out of the money, risk is close
to the risk of the underlying asset. As demand increases and value increases, risk
increases and stays high until funds have been disbursed to pay for the expansion. Once
completed, and assuming there are no other growth options present, the equity risk
returns falls to the revenue risk. Although only a single case study, the beta pattern
found for Starbucks (see Figure 1) is roughly in line with this theory.
3. Empirical Approach
Hamada(1972) first recognized the mechanical decrease in risk that should result from
the increased equity that is brought into the firm through an SEO. Tests of this impli-
cation around SEOs have not, however, been in agreement. For instance, Healey and
Palepu (1990) find increases in risk subsequent to issuance. Denis and Kadlec (1994)
argue that this result is caused by differential liquidity and corresponding beta estima-
tion biases in the pre- and post– SEO periods. After correcting for this effect, they find
no change in risk.
This prior research focused on the debt/equity leverage affect without recognizing
the more complex affects that will accompany the option exercise and financing tactics
set out in Figure 2. Given the importance of company specific factors, it is perhaps
not surprising that this research was somewhat inconclusive. For instance, these studies
looked for a single discrete change in the equity beta caused by the SEO. In contrast,
Starbuck’s SEO took place at the beginning of a multi year expansion that began with
a period when growth options were moving rapidly into the money. Looking only at the
beta the year before and the year after the SEO could be very misleading.
Ideally we would like to test our theory by relating high frequency beta and return
measures to the dynamically changing state of the firm. The state of the firm at any
point in time would include the market value of assets in place, growth options, the
degree of commitment to expansion, etc. Unfortunately, detailed information on these
conditions are not available at frequencies of less than one year.
10
We address this problem in a way that is similar to the approach used by Lamont
(2000). Recognizing that time to build made it difficult to relate investment decisions to
economic fundamentals, Lamont examined stated intentions to related these intentions
to underlying fundamentals.
We begin with a sample of all firms on the SDC new issues database from 1980-1999.
We exclude from our sample financials and utilities, leaving 3611 sample observations.
For these firms, we use Lexis/Nexis to search newswires for a press release describing
the issuance. We then record the stated purpose of the SEO, which can belong to one
or more of the categories: retire debt (D), working capital (WC), acquisition finance
(ACQ), investment (INV), general corporate purposes (GC), and no information (NI).
We also match each sample firm by size to a non-issuing firm from the CRSP
database. This is a common method to control for risk. Our empirical analysis doc-
uments patterns in return dynamics and risk dynamics for the entire sample and by
subsample.
4. SEO Episode Returns
In earlier work, CFG show that the aggregate return patterns observed in SEO firms
and their matches can be captured by a rational real options theory of investment. We
now seek to document patterns in the firm level data that may or may not be consistent
with real options theories.
4.1. Return Dynamics by Use-of-Funds Category
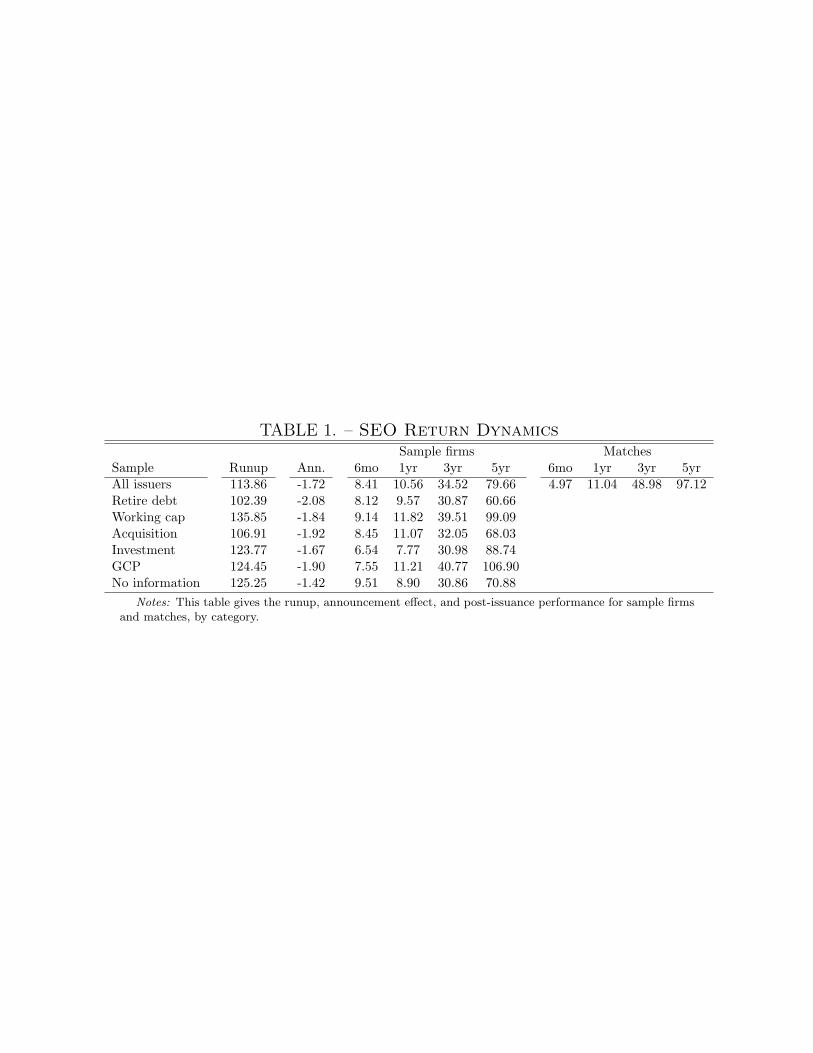
Table 1 shows the runup, announcement effect, and buy-and-hold returns over intervals
of six months, one, three, and five years for sample firms, and post-event returns for
matches. Results are reported for all sample firms and by purpose subcategory.
First examining all issuers, we see the general patterns that have been reported
previously in the literature: a substantial runup in the one year prior to issuance (114%),
negative announcement effect in a three day window (-1.72%), and underperformance
over long horizons relative to a matched sample (80% vs. 97 % at five years). It is
interesting to note the dynamics in the underperformance. In the first six months after
the SEO, the sample firms actually outperform the matches by a substantial margin
(8.4% to 5%), and at one year the returns are close to identical (10.5% vs. 11%). Most
of the underperformance thus seems to take place between 6 months and three years
after the issuance. Between zero and six months the sample firms actually outperform,
and after three years there seems to be little difference in gross returns.
11
There are also interesting patterns when examining the returns across use-of-funds
subcategories. The lowest runups are for firms issuing to retire debt. This is not
surprising, as a simple target capital structure story would imply that firms would
conduct deleveraging recapitalizations in distress. It is thus somewhat surprising that
the runups for debt issuers are as large as they are (102%). Acquirers also have relatively
low runups (107%), while firms investing in working capital have the largest runups
(135%). Firms that are investing (124%), using funds for GCP (124%), and for which
there is no information (125%) are in between.
Announcement effects are most negative for firms issuing to retire debt (-2.08%),
and least negative for firms with no information on the use of funds (-1.42%). The
latter result appears surprising, but may be due to the fact that the announcement
date is imprecisely measured when there is no news wire of the announcement, and
some firms in the category have no documented press release. Investors have the next
highest announcement effect (-1.67%).
Five year post-issuance returns are lowest for firms retiring debt (61%) and making
acquisitions (68%), and highest for fims investing in working capital (99%) and for
general corporate purposes (107%). In fact, the latter two categories have five-year
returns higher than the matched sample. The three year post-issuance return seems to
be less noisy across subcategories, and all types underperform the matched sample at
this horizon. Again, firms issuing for GCP and working capital do best (40%), while the
other categories have returns just over 30%. At the one year horizon, investors have the
lowest returns (8%) but the sample categories are generally close to the match returns.
At six months, all issuance categories robustly outperform the matched sample.
4.2. Post-Issuance Underperformance Regressions
Table 2 shows regression results across subsamples of the five year post-issuance under-
performance against the one year runup (RUNUP), three-day window announcement
effect (ANNOUNCE), one year market runup prior to issuance (MKTRUN), SEO pro-
ceeds as a percent of capitalization (PCPCT), book-to-market prior to announcement
(PRIORBM), logarithm of size prior to announcement (PRIORSZ), percentage of the
issuance in primary offering (PRIORSZ), and a constant.
Cross-sectional variability in the degree of anticipation leads to predictions for the
sign of RUNUP and ANNOUNCE. In particular, with full anticipation, runup is high-
est, the announcement effect is most negative, and the long-run performance is most
negative. Such a model thus suggests a negative sign on RUNUP and a positive sign on
ANNOUNCE. The percent of proceeds PCPCT corresponds to the value λ in the CFG
12
model and should have a negative sign. MKTRUN, PRIORSZ, and PRIORBM, are in-
cluded as variables to control for risk, corresponding to either time-varying risk-premia,
or failure of the matched sample to fully control for risk. The variable PRIMARYPCT
should have a negative sign under a real options type theory where it is the new is-
suance effects of SEO’s that matter. By contrast, a story where managers issue to take
advantage of shareholders would seem to suggest a positive sign.
The one year runup does appear as significantly negative in the entire sample with
a t-statistic of 2.69. This result holds up in the debt and NI subsamples, and the
coefficient is negative but not significant in all other subsamples except for acquirers, for
which it is close to zero. Thus, higher runups tend to lead to more underperformance,
consistent with heterogeneity in anticipation in a real options framework. On the
other hand, the announcement effect is not significant in any of the regressions. Also
consistent with the theory, PCPCT is negative and significant in the entire subsample
and in the acquirer, investor, and NI subsamples. The variable PRIMARYPCT is also
consistently negative although significant only in the entire sample and NI subsample.
The control MKTRUN is positive in all subsamples and significant in all but the
working capital subsample. Thus, underperformance is less when the market runup
is higher. This is difficult to explain with a real options theory that relies entirely on
cash flow effects, however, discount rate channels such as those in BGN and GKZ might
lead to some predictions for this variable. Behavioral theories might view this variable
as relating to market sentiment. In any event, this result appears to be robust and
should be considered in future theoretical work. The variable PRIORBM is positive
in all subsamples and significant in some, suggesting that our matching procedure may
not be fully capturing the risk of the sample firms. The sign of PRIORSZ varies across
regressions and is generally not significant.
5. SEO Episode Risk
This section documents how measures of risk change around the SEO event. We consider
both market risk and total volatility.
5.1. Market Beta Dynamics
Real options theory does not require a specific asset pricing model to hold in order for
changes in growth option leverage to play a role. Nonetheless, market beta is a natural
place to begin investgating changes in risk around SEO’s.
13
5.1.1. Measuring Market Beta
We seek to develop monthly estimates of market beta for each security and control firm
in our sample. One approach would be to simply calculate betas based on twenty-two
day months using daily data. Scholes and Williams and Dimson suggest that beta
will be underestimated for stocks that trade infrequently. One solution is to use the
“sum betas” advocated by Dimson, and used in Denis and Kadlec. However, these are
noisy. We instead aggregate returns across any days which our sample firm returns are
zero. Empirically, we find that this gives mean beta estimates that are in between the
standard and Dimson betas, but with significantly less noise than the Dimson beta.
5.1.2. Beta Dynamics by Use-of-Funds
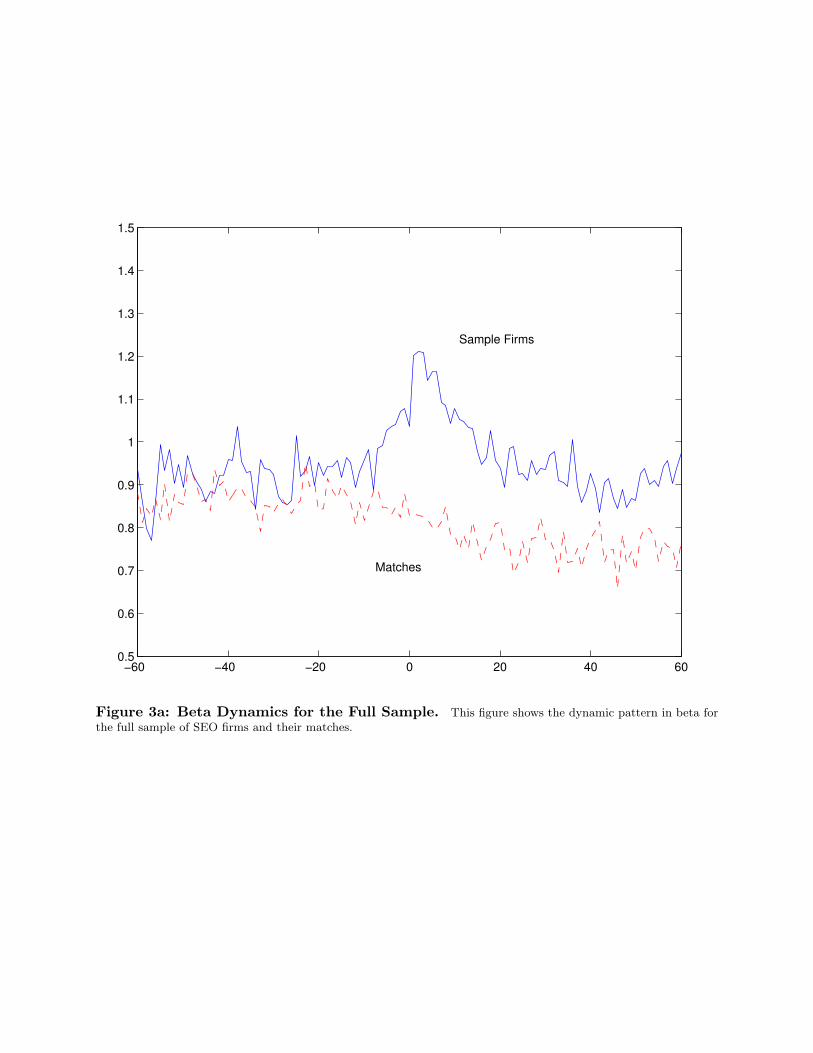
Figure 3a shows beta dynamics for the full sample of SEO firms and their controls. Beta
begins at a value of about 0.9 five years prior to issuance in event time. It increases
slowly over time until about six months prior to the SEO, at which point it increases
dramatically, consistent with a real options theory. It peaks at a level of about 1.2
in the month following the SEO. It then declines over a four year period to a value
less than 0.9. The CFG theory predicts an immediate rather than gradual decline in
beta. This empirical evidence suggests that theory should take into account the many
additional real investment and financing tactics that are important in the period just
after the SEO.
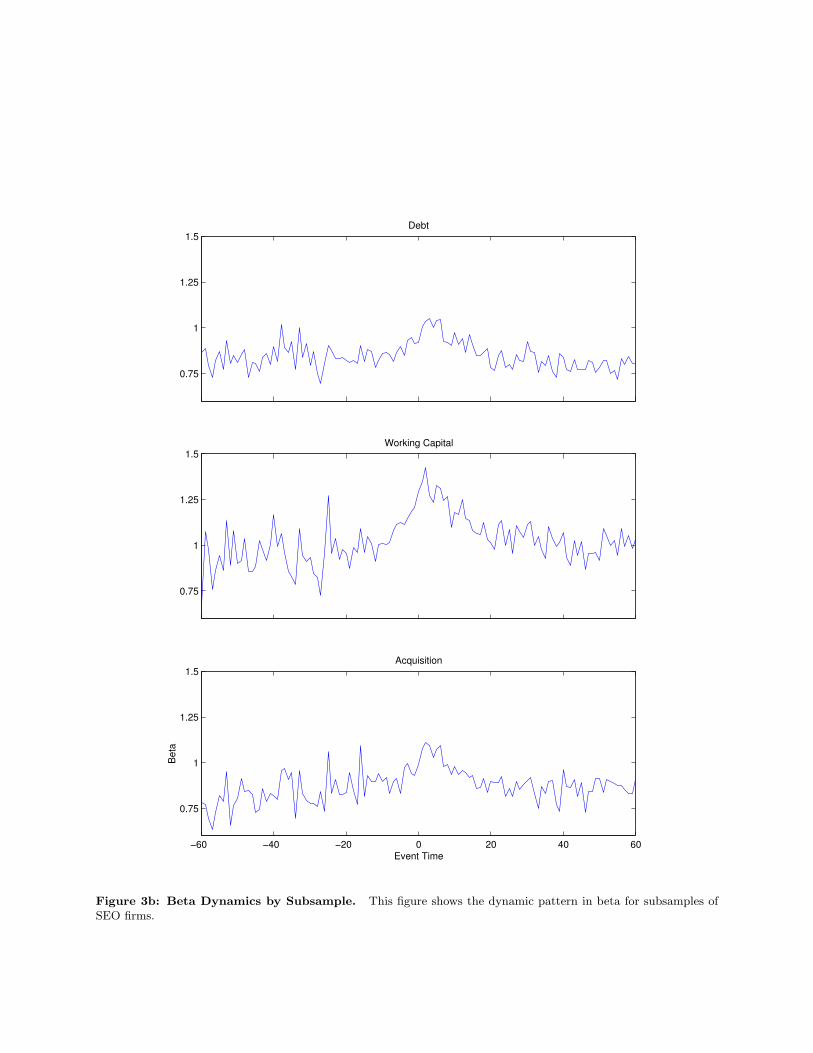
Figures 3b and 3c show the beta dynamics by use-of-funds subsample. All have sim-
ilar characteristics of an increase in beta prior to issuance, peaking just after issuance,
followed by a gradual decline. Firms investing in real assets, working capital, acquisi-
tions, and for general corporate purposes appear similar, with the acquirers having a
slightly lower beta all around. Firms retiring debt appear to have a less pronounced
increase and subsequent decrease in beta. The NI firms seem to have a sudden increase
in beta on the SEO date. These findings are general consistent with the increase prior
to SEO and decrease subsequent to SEO predicted by a real options theory. The data
appear to be more complex than the theory in some of the timing aspects.
5.1.3. Cross-Sectional Regressions for the Change in Beta
Table 3 reports regression results for the change in beta from the six month window
prior to issuance to the six month window beginning three years subsequent to issuance.
We use the same set of regressors as previously: the one year runup (RUNUP), three
day announcement effect (ANNOUNCE), market runup (MKTRUN), proceeds as a
14
percent of capitalization (PCPCT), prior book to market (PRIORBM), prior logarithm
of market capitalization (PRIORSZ), the percent of proceeds in the primary issuance
(PRIMARYPCT), and a constant.
If firms differ in the degree of anticipation of the SEO announcement, we expect
the sign of RUNUP to be negative, so that firms with larger runups have larger drops
in beta. We also expect the sign of ANNOUNCE to be positive, so that firms whose
issuance conveys more positive information about the product market have a smaller
drop in beta.
For the entire sample, we see that both RUNUP and ANNOUNCE have signs of the
expected direction, with significant robust t-statistics. Among the other control vari-
ables, MKTRUN is also significant and positive. In the subsamples by use-of-funds, the
results are similar. RUNUP is always negative and generally significant, ANNOUNCE
and MKTRUN are always positive and generally significant. No other variables are
significant. These results support a real options model of investment with heterogeneity
in anticipation of the SEO announcement.
5.2. Volatility Dynamics
The conditional CAPM does not play any special role in the simple theory developed
in Section Two. Beta simply measures exposure to risk in the state variable Xt,
without specifying how the price of X risk is initially determined. Because the story
is essentially about leverage, we can look at volatility for changes in leverage. This is a
robust prediction that does not depend on the asset pricing model.
5.2.1. Measuring Volatility
We calculate monthly estimates of volatility for each firm and control in our samply by
summing squared returns over twenty-two day periods, as in Schwert (1989).
5.2.2. Volatility Dynamics by Use-of-Funds
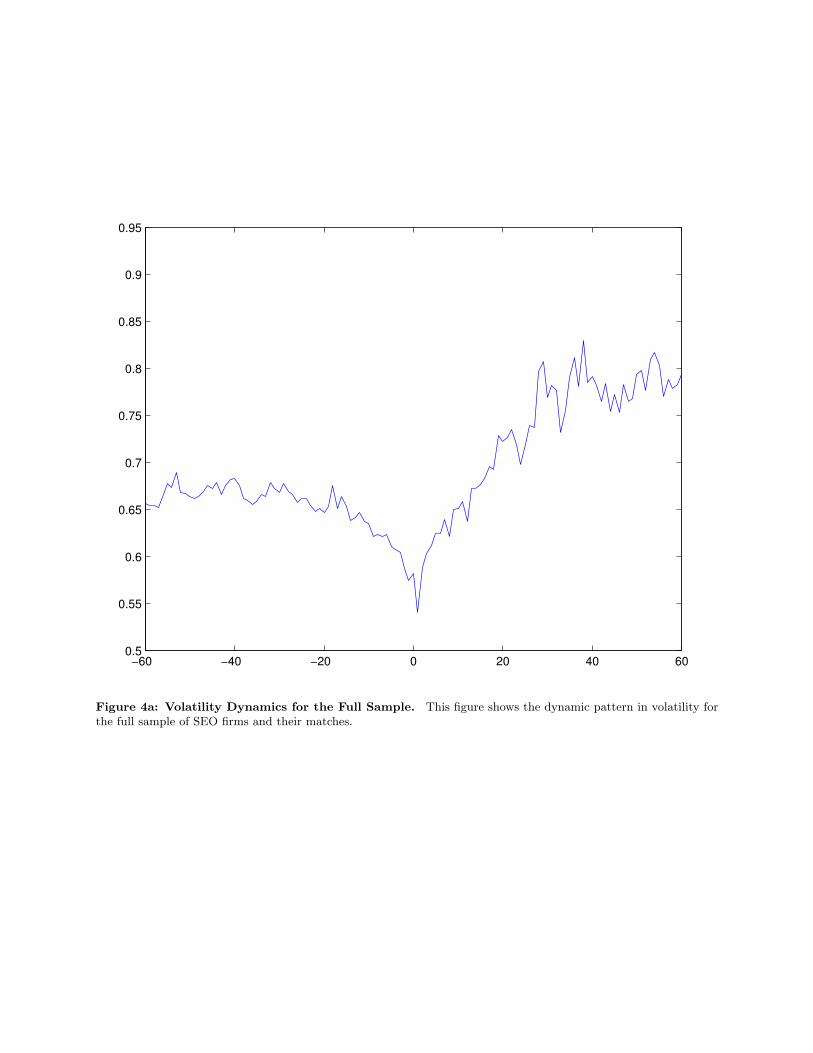
Figure 4a shows the dynamics of average firm-level volatility around the SEO. It drops
sharply leading up to and at the time of the SEO, then increases dramatically afterward.
This is in contrast to our predictions from a real option theory based on constant
volatility of the fundamentals.
The finding is new and robust across use of funds, as shown in Figures 4b and 4c.
Theory should seek to incorporate this finding. One possibility for the sharp drop at
issuance is the price support that takes place around the SEO. But the pattern also
15
seems to be strong as long as two years before and three years after the SEO. This
suggests the possibility of volatility timing, which can easily be studied in a real options
model.
6. Do Risk Dynamics Explain SEO Episode Returns?
In this section we investigate whether the documented changes in beta around the SEO
event can help to explain the underperformance claimed in the previous literature. Prior
practice has been to use pre-SEO firm attributes to adjust for risk. In the first column
of Table 4 we thus report the cumulative abnormal return in the five years subsequent
to issuance, where beta is estimated in the five months prior to issuance. As is standard
in the literature, we find negative long-run abnormal returns, which are significant for
all categories, and equal to about 0.4 percent per month.
In the second column of Table 4, we instead recognize that beta has important
dynamics that must be accounted for. We thus calculate the abnormal return for each
month by using the current within month realized beta. In all subsamples but one, the
average cumulative abnormal return is now not significantly different from zero at the
five percent level, and in that case the abnormal return is positive. The answer thus
seems to be that, yes, risk dynamics do explain SEO episode returns.
7. Conclusion
We have explored the dynamics of equity beta around the SEO event, with the goal
of utilizing these dynamic patterns to explain the long-run underperformance puzzle of
Loughran and Ritter (1994). Theoretical models of real option exercise have guided this
analysis, where we predict that risk will fall following the investment of issue proceeds.
The data show robust support for the predictions of such stylized models. Risk, as
measured by beta, rises sharply in the year prior to stock issues, is highest around
the SEO event, and then falls dramatically during the two years following the issue.
Furthermore, this dynamic pattern in beta mirrors the pattern in traditional measures
of abnormal returns, which are zero or positive in the year following the event, and then
turn negative in post-issue-years two through five.
We demonstrate that a simple conditional dynamic asset pricing model can explain
the return patterns of SEO firms in the post-issue period. In particular, underperfor-
mance of SEO’s disappears once we account for dynamics in beta. Our work highlights
the importance of reexamining the static traditional null hypothesis of constant risk,
16
regardless of the nature of the event examined.
17
References
[1]
[2] Anderson, Christopher, and Garcia-Feijoo, Luis (2003), Empirical Evidence on
Capital Investment, Growth Options, and Security Returns, Working Paper,
Creighton University and University of Kansas.
[3] Asquith, Paul, and Mullins, David (1986), Equity Issues and Offering Dilution,
Journal of Financial Economics 15, 61-89.
[4] Baker, Malcolm, and Wurgler, Jeffrey (2002), Market Timing and Capital Struc-
Notes: This table reports regression results for five year sample underperformance relative to size matches.The regressors are the one-year runup, the three-day window announcement effect, the market runup, theSEO proceeds as a percent of market capitalization, the prior book to market, the prior logarithm of marketcapitalization, the percent of proceeds that are in the primary issuance, and a constant. Robust t-statisticsare in brackets.
TABLE 3. – Beta Change RegressionsSample
Regressor All D WC Acq Inv GCP NIRUNUP -0.238 -0.294 -0.298 -0.275 -0.147 -0.246 -0.281
[-1.37] [0.15] [-1.38] [0.60] [-1.52] [0.08] [-0.87]Notes: This table reports regression results for the post-issuance change in beta. For each sample
firm, we estimate the market beta in the six months prior to SEO announcement, and in the six monthwindow beginning three years after the SEO issuance. The change in beta from the prior to post periodis the dependent variable in the regressions. The regressors are the one-year runup, the three-day windowannouncement effect, the market runup, the SEO proceeds as a percent of market capitalization, the priorbook to market, the prior logarithm of market capitalization, the percent of proceeds that are in the primaryissuance, and a constant. Robust t-statistics are in brackets.
TABLE 4. – SEOAbnormal Performance
CARPre-SEO Dynamic
Beta BetaAll issuers -0.41 0.13
[-8.23] [1.83]Retire debt -0.44 0.11
[-6.07] [1.13]Working cap -0.43 0.13
[-4.42] [0.82]Acquisition -0.42 0.01
[-4.34] [0.34]Investment -0.43 0.02
[-5.21] [0.11]GCP -0.35 0.29
[-4.31] [2.90]No information -0.41 0.09
[-3.91] [0.60]Notes: This table reports in percent per month average cumulative
abnormal returns of SEO firms five years subsequent to issuance. Thefirst column uses the standard method of using a prior period beta toadjust for risk. In particular, we use the beta from the window sixmonths prior to the announcement to the announcement. The secondcolumn uses the dynamic beta estimated in the current month to adjustfor risk. The t-statistics are reported in brackets.
Figure 1: The Starbucks SEO Episode. This figure depicts events surrounding the Starbucks SEO.
Real Option FinancingTactics
Announce/register new shares
Issue Share
Receive Cash
Temporarily invest cash in securities
Commit to Expand•Acquire Plant•Issue ‘Builder’ Debt
Sell SecuritiesRetire Builder’s debt
Time to Build
Figure 2a: Expansion Milestones
Real Option Exercise
β
EGO
EPE νβ +=
EB
EP BE βλεβ −
++=
1λ
λβλ
βλλεβ
++
+−
+++
=EE
BE
P CBE
1=+++
=λλεβ
EPE
Figure 2b: Expansion Milestones and Risk
Figure 2: SEO Timeline. This figure depicts the timeline of events around an SEO.
−60 −40 −20 0 20 40 600.5
0.6
0.7
0.8
0.9
1
1.1
1.2
1.3
1.4
1.5
Sample Firms
Matches
Figure 3a: Beta Dynamics for the Full Sample. This figure shows the dynamic pattern in beta forthe full sample of SEO firms and their matches.
0.75
1
1.25
1.5Debt
0.75
1
1.25
1.5Working Capital
−60 −40 −20 0 20 40 60
0.75
1
1.25
1.5
Event Time
Bet
a
Acquisition
Figure 3b: Beta Dynamics by Subsample. This figure shows the dynamic pattern in beta for subsamples ofSEO firms.
0.75
1
1.25
1.5Invest
0.75
1
1.25
1.5General Purposes
−60 −40 −20 0 20 40 60
0.75
1
1.25
1.5No Information
Event Time
Bet
a
Figure 3c: Beta Dynamics by Subsample. This figure shows the dynamic pattern in beta for subsamples ofSEO firms.
−60 −40 −20 0 20 40 600.5
0.55
0.6
0.65
0.7
0.75
0.8
0.85
0.9
0.95
Figure 4a: Volatility Dynamics for the Full Sample. This figure shows the dynamic pattern in volatility forthe full sample of SEO firms and their matches.
0.5
0.6
0.7
0.8
0.9
Debt
0.5
0.6
0.7
0.8
0.9
Working Capital
Sta
ndar
d D
evia
tion
(Ann
ualiz
ed)
−60 −40 −20 0 20 40 600.5
0.6
0.7
0.8
0.9
Event Time
Acquisition
Figure 4b: Volatility Dynamics by Subsample. This figure shows the dynamic pattern in volatility forsubsamples of SEO firms.
0.5
0.6
0.7
0.8
0.9
Invest
0.5
0.6
0.7
0.8
0.9
General Purposes
Sta
ndar
d D
evia
tion
(Ann
ualiz
ed)
−60 −40 −20 0 20 40 600.5
0.6
0.7
0.8
0.9
No Information
Event Time
Figure 4c: Volatility Dynamics by Subsample. This figure shows the dynamic pattern in volatility forsubsamples of SEO firms.