Page 1
Separate and Combined Integration of Kalina Cycle for Waste Heat Recovery from a
Cement Plant
Ehab S. MAHMOUD1, Mohamed RADY
2*, A. A. ABUHABAYA
2, Adel A. ELSAMAHY
1
1 Electrical Power Engineering Department, Faculty of Engineering, Helwan University, Cairo, Egypt.
2 Mechanical Engineering Department, Faculty of Engineering, Rabigh, King Abdulaziz University, KSA.
Corresponding Author Email: [email protected]
https://doi.org/10.18280/ijht.x
xxxxx
ABSTRACT
Received:
Accepted:
This article reports on using Kalina cycle for waste heat recovery (WHR) from a
cement plant. Two design alternatives have been investigated using separate and
combined WHR from the kiln, cooler, and preheater. Measurements and analysis have
been performed to determine the waste heat from different stages of the cement
manufacturing lines. The annual heat losses from the kiln surface, preheater, and the
cooler are estimated as 79.23, 44.32, and 43.6 GWh at average temperatures of about
314, 315, and 254 ℃, respectively. Analysis and optimization of using Kalina cycle for
Waste Heat Recovery (WHR) from the kiln shell, cooler and preheater to produce
electricity have been carried out using ASPEN software. Parametric study has been
carried out to determine the design parameters for Kalina cycle including turbine inlet
pressure, mass flow rate, and ammonia water concentration. The value of net power
output using combined WHR is about 7.35 MW as compared to 6.86 using separate
WHR design with a total cost saving of about 23%.
Keywords:
Kalina cycle; waste heat
recovery; low-grade heat source;
ammonia-water mixture; power;
Cement industry; heat loss; power
consumption
1. Introduction
Energy cost average is about 55% of the total cost of cement production. Massive energy cost is due to both heat
consumption in kiln operations and electrical power consumption for different operations of grinding mills, fans, and
motors [1]. Energy consumption in a cement plant is divided into 25% in the form of electricity and 75% as heat.
Waste heat recovery for power generation is a way to reduce the total power consumption for cement production
process [2]. In the whole process, about 35-40% of the heat is lost through different waste heat streams in the kiln,
preheater, and cooler [3].
In cement plants, three points which can be used for waste heat recovery system. The first point is the exhaust gas
of pre-heater with temperature of about 300 – 350 °C in 5 – 6 stages production lines. The second point is the cooler,
where the clinker temperature at the exit of the kiln reaches 1000 °C. The clinker is air cooled to 100-120 °C
producing waste hot air at about 260-300 °C. The third point is waste heat from the kiln shell where the hot gases can
reach temperatures more than 300 °C [4]. An energy audit analysis of a typical cement plant [5] showed that the kiln
and cooler exhaust heat represent 19.15% and 5.61% of total heat input, respectively. For 5000 ton/day of kiln
operation, the expected power generation was estimated to be approximately 6-9 MW [6]. Ziya Sögüt et al. [7]
estimated 217.31 GJ waste heat from the rotary kiln of cement plant in Turkey of which represents about 51% of the
overall heat consumption of the process. Widuramina et al. [8] investigated the available waste heat in the cement kiln
waste gas in a Norwegian cement plant. For a cement production of 1.3 million tons per year, it was found that 1.5–
4.2 MW and 2.2–5.8 MW waste heat is available that can be used for low pressure steam and hot water generation.
Page 2
Kalina cycle has been considered as an effective power cycles for low temperature waste heat recovery. It has many
many practical advantages as compared to Rankine cycle [9, 10]. A Kalina based cogeneration system of power and
refrigeration showed significantly higher energy efficiency as compared to the stand-alone Kaline cycle [9].
Numerical study of Kalina cycle utilizing low temperature geothermal heat source at 145℃ for power generating
reported a cycle efficiency of 12.95% [10]. The cycle efficiency was shown to be improved by 2% using an auxiliary
superheater in the system. Mehri Akbari [11] proposed a new combined heat and power cogeneration system which is
based on the Kalina cycle and uses geothermal energy as a heat source to produce electricity and pure water. The
proposed system includes a Kalina cycle, a LiBr/H2O heat exchanger and a water purification system. The first law
and second law efficiencies of the proposed system were found in the range of 16%-18.2% and 61.9%-69.1%,
respectively.
Wasabi Energy estimated that the integration of the Kalina cycle technology into a cement plant in the Khairpur
region of Pakistan for waste heat recovery in clinker cooler exhaust gases and preheater exhaust gases would reduce
overall power consumption by 10% - 20% [12]. FL Smith provided the Kalina cycle waste heat recovery system to
Star Cement L.L.C in Ras Al Khaimah, United Arab Emirates. According to their system, the total power is expected
to be reduced by 12% [13].
Ogriseck [14] studied a cogeneration plant using Kalina cycle. The net efficiency of the integrated Kalina plant was
obtained between 12.3% and 17.1% and depends on the cooling water temperature and the ammonia content in the
alkaline solution. A parametric study and optimization of Kalina cycle driven by solar energy has been reported by
Wang et al. [15]. The net power output from the cycle can be maximized by proper choice of turbine inlet pressure
and ammonia solution mass fraction with less sensitivity to changes in inlet temperature to the turbine. Carlos, et al.
[16], performed thermodynamic analysis of ORC and Kalina cycles using different working fluids. Using R-290 as
the working fluid of ORC and using a Kalina cycle composed of a mixture of 84% ammonia mass fraction and 16%
water mass fraction, the best performance of the two cycles can be obtained. The net power of Kalina cycle was found
to be 18% higher than ORC.
From the previous review, it can be concluded that the adaptation of Kalina cycle in cement plants needs more
investigations and analysis. The size of the components or the selected conditions have rarely been taken into
consideration. Also, the cycle configuration and integration in the cement plants should consider the differences in
available amount and temperature levels of waste heat sources in the plant. As practical case study for a typical
cement plant, the present article reports on waste heat recovery from Al Arish Cement plant in Egypt. Measurements
and analysis have been performed to determine the waste heat from three points of the cement manufacturing lines.
Analysis and optimization of using Kalina cycle to recover waste heat from the kiln shell, cooler and preheater to
produce electricity have been carried out using ASPEN HYSYS software. Design parameters of system components
and recovery heat exchangers of kiln shell, cooler and preheater are specified. The effects of turbine inlet pressure,
ammonia concentration, and the evaporator exit temperature on Kalina cycle performance are investigated. Two
design alternatives have been proposed and investigated for Kalina cycle integration in the cement plant. The first
configuration uses separate recovery heat exchanger and Kalina cycle for the kiln, cooler, and preheater. The second
combined WHR system combines the waste heat from the kiln, cooler, and preheater in a single cycle.
2. Plant Description The present study is carried out on a typical cement production plant in El Arish Cement Company in Egypt. The
plant is located 70 km to the south of El Arish City in Sinai. It contains 4 production lines with average capacity 5800
ton/day. The plant started production with two lines in 2010 then added 2 lines in 2016. Table 1 shows technical data
of major plant components as per the information available in January 2018.
Figures 1 to 3 show the flow diagram for the preheater, kiln area, and cooler area and the proposed positions for
waste heat recovery (WHR). WHR from the preheater depends on hot gases from the cyclone before raw mill process
and ID fan. For the kiln, WHR is located around the kiln shell to collect heat loss by radiation and convection from
Page 3
kiln shell using secondary shell and insulation from ambient air. For the cooler area, WHR receives waste hot gas
from cooler before entering the filter then to the stack.
3. Waste Heat Analysis and Feasibility
Studying the heat source, the material flow direction, chemical composition, and hot gas characteristics are the first
step to analyze waste heat from the plant. As can be seen in Fig. 1, feeding material start firstly in preheater cyclones
(C1-C5). A cyclone is a conical vessel shape in which fine material and gas stream pass tangentially by a vortex force
within the vessel. The hot gas leaves the cyclone through a co-axial "vortex-finder "upward. The feeding material are
thrown to the outside edge of the cyclone by centrifugal force action and leaves down through a flap gate valve. The
feeding material passes from one cyclone to the other to enter the kiln. The average temperature in the first step of
cyclones reaches 300-400 OC and increases gradually by going down to the next step of cyclones to reach about 800-
900 OC at kiln inlet.
In the rotary kiln, see Fig. 2, fuel is added to the system, using the main burner inside the kiln towards the outlet
part and at the calciner part of preheater by using 4 burners. Typical fuels used in the plant include heavy oil, natural
gas, coal, or a mixture of alternative fuels. The rotary kiln is made of a steel shell tube with number of sections
welded together and is inclined to help material flow to next processes in the cooler. It has a layer of refractory bricks
to withstand high operating temperature which may reach about 1500 OC during the calcination process. The kiln
outer steel shell is exposed to the ambient and can reach a temperature of about 300-400 OC. The three live casted
steel rings which support the rotary kiln, called “tyres”, rotate on the supporting rollers (two rollers for each tyre) and
carries the heavy weight of the kiln. The kiln shell loses large amounts of heat by radiation and convection to the
ambient. Additionally, air is pumped over specific areas over the shell surface using air nozzles to avoid shell
deformation.
Feeding material finally leaves the rotary kiln and convert to clinker. It should be cooled down in clinker cooler,
see Fig. 3. They move with special speed on grates cooled by external air fans. Hot gas with clinker dust with
temperature of about 250 – 350 OC leaves the cooler to the filtering stage by using a centrifugal fan and then move to
the stack. The major waste heat recovery sources from cement production lines are outlined in Fig. 4. They include
radiation and convection from the rotary kiln surface, cooler vent air, and hot gas exhaust from the cyclone preheater.
They are analyzed in the following sections. They are analyzed in the following sections.
3.1 Waste heat from rotary kiln
Convection and radiation losses from the rotary kiln surface are function of the kiln surface temperature and forced
air along its 72 meters length. It is known that the temperature of the surface is dependent on the type of fuel used,
type of clinker manufactured, duration of operation from previous maintenance which influence refractory lining, and
atmospheric conditions. The surface temperatures are monitored constantly by the plant control room during the
normal operating conditions of the rotating kiln using infra-red image techniques.
Table 1. El Arish Cement Company production lines technical data, January 2018.Number
of lines
Cement
process
Preheater
type
Preheater
stage
Kiln
average
capacity
ton /day
Raw mill
type
Kiln
diameter
Kiln length
4 Dry
process
Double
string
5 5800 Vertical
mill
5 m 72 m
Cooler type Fuel Fuel
consumption
Power
consumption
Production
availability
Cooling
water
Raw mill
cooling
Hydraulic grate cooler
Coal- heavy oil
900 kcal/kg 110 kwh/ton 345 day/year Air cooling tower
Conditioning tower
Using IR measurements, the variation of average kiln surface temperature over a typical year is shown in Fig. 5.
The average shell temperature of rotary kiln is measured to be about 314℃.
Convection heat loss from the kiln surface Q conv is calculated using Equations (1).
(1)
Page 4
Where is the convection heat transfer coefficient, Ak is the kiln surface area, Tk is the kiln surface temperature, and
Ta is the average atmospheric temperature. The convection heat transfer coefficient hc in W/m2K is calculated using
equation (2) [6].
hc =0.3D +4+3.5(
) - 0.85(
) 2 + 0.076(
) 3
(2)
The radiation heat losses from the kiln surface is calculated using Eq. (3).
(3)
Where Tk is the kiln surface temperature in kelvin, σ = 5.67x10⁻⁸
W/m2k
4 , Ak is the kiln surface area (π D L) estimated
as 1130.4 m2 and emissivity of steel is taken as ε =0.9. For the calculation of total convection and radiation heat
losses from the kiln surface and account for the variation of kiln surface temperature along its length, the kiln surface
is divided into equal sections of one meter length each. The total annual convection and radiation losses from the kiln
surface Qckt and Qrkt (MWh) are obtained by summing together all values of convection and radiation losses from each
meter of kiln and multiplying it by fraction of operating hours (y) in a year as given by Eq. (4) and Eq. (5).
∑ (4)
∑ (5)
Where, n is the number of kiln sections, n=72. The total annual heat loss from the kiln Q kiln can be calculated by
summing together convection and radiation losses.
Q kiln = Qckt + Q rkt (6)
Figure 1. Flow diagram for preheater area and
waste heat recovery system position, preheater.
Figure 2. Flow diagram for kiln area and proposed waste heat
recovery system position, kiln
3.2 Waste heat from preheater
El Arish cement plant has four lines with kiln feed capacity of 5800 ton/day and preheater with double string
design and 5 stages. After the hot gas from cement kiln is used to preheat the raw meal and calcination process, it is
dissipated to the top of the preheater cyclones (cyclone 1 first stage) then to the conditioning tower before passing
through the raw mill. The gas should be cooled before being sent to the raw mill. Some of the hot gas is used within
the raw mill for drying and lifting process. The exhaust gas from the preheater can be used for waste heat recovery
without influencing cement process with some limitations.
Figure 6 shows the variation of measured hot gas temperature form cyclone 1 over one year. To divert the hot gas
through a heat exchanger for heat recovery, the cooling water will be removed from the cooling tower. The heat
recovery system (heat exchanger) should be designed to maintain the required output temperature requirements for
Page 5
raw mill operation. The hot gas exit from heat exchanger should have the same temperature as the conditioning tower
exit gas. In the present study, a heat exchanger for waste heat recovery is proposed to be installed in parallel to the
conditioning tower after the preheater, see Fig. 7.
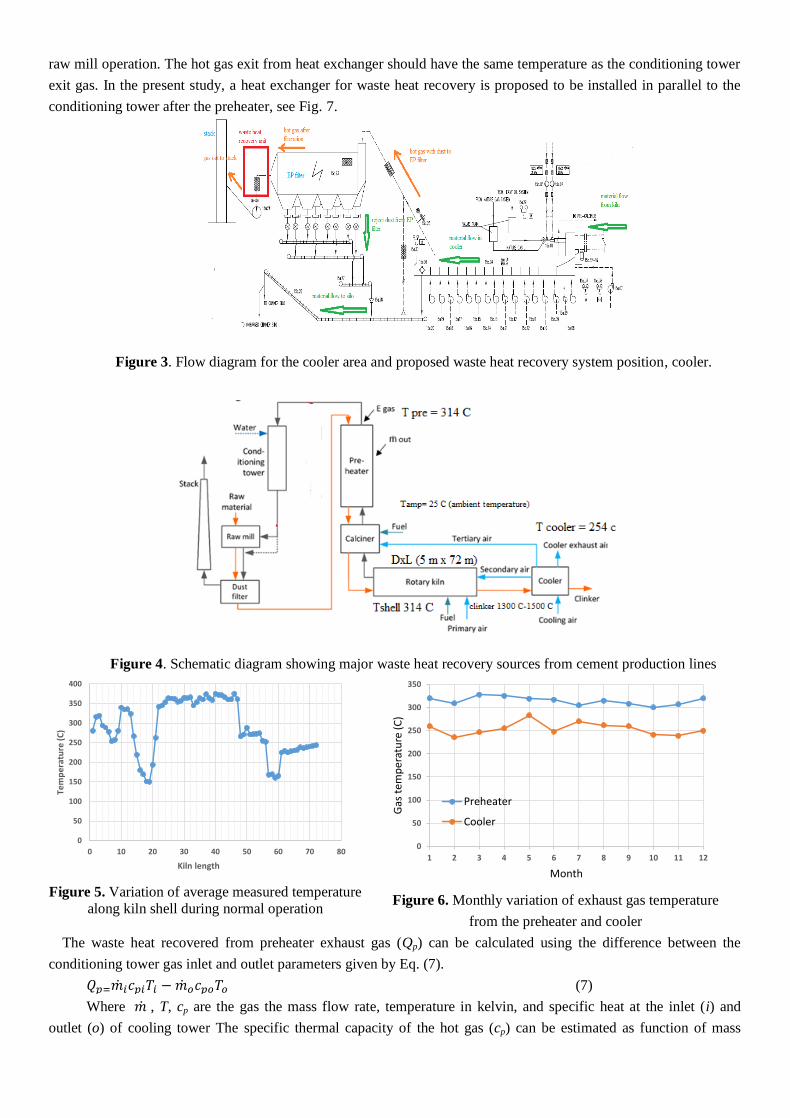
Figure 3. Flow diagram for the cooler area and proposed waste heat recovery system position, cooler.
Figure 4. Schematic diagram showing major waste heat recovery sources from cement production lines
Figure 5. Variation of average measured temperature
along kiln shell during normal operation Figure 6. Monthly variation of exhaust gas temperature
from the preheater and cooler
The waste heat recovered from preheater exhaust gas (Qp) can be calculated using the difference between the
conditioning tower gas inlet and outlet parameters given by Eq. (7).
(7)
Where , T, cp are the gas the mass flow rate, temperature in kelvin, and specific heat at the inlet (i) and
outlet (o) of cooling tower The specific thermal capacity of the hot gas (cp) can be estimated as function of mass
0
50
100
150
200
250
300
350
1 2 3 4 5 6 7 8 9 10 11 12
Gas
tem
per
atu
re (
C)
Month
Preheater
Cooler
0
50
100
150
200
250
300
350
400
0 10 20 30 40 50 60 70 80
Tem
pe
ratu
re (
C)
Kiln length
Page 6
fraction (x) of each component (k) in the exhaust gas and hot gas temperature (T) as reported in [6]. The volume
fraction (x) for each gas component in the exhaust gas before and after the conditioning tower is estimated based on
nominal data extracted from [6]. The mass flow rate of gas entering the cooling tower is calculated using Eq. (8)
∑
(8)
Where is the measured volume flow rate of gas at preheater outlet. The mass flow rate of gas exit from the
cooling tower is calculated considering the water vapour mass flow rate added to the inlet gas by water nozzles in the
conditioning tower ( using Eq. (9)
∑
The water vapour mass added to the gas in the cooling tower is equal to the make-up water rate supplied to the
cooling tower. The measured value of make-up water is about as 55 m3/h. It should be mentioned that this amount of
make-up water shall be saved after applying the waste heat recovery from the preheater as shown in Fig. 7. The total
annual waste heat in MWh from the preheater exhaust gas is claculated using Eq. (10).
∑
(10)
3.3 Waste heat from cooler
The cooler waste hot gas, which is vented to the atmosphere, is waste heat from the system. Figure 6 shows average
temperature of waste hot gas from cooler over one year. The temperature changes from one month to another due to
shutdown times and process parameters change during normal operation.
The total annual waste heat by hot gas from the cooler is calculated using Eq. (11).
∑ (11)
Where is the volume flow rate of hot gas discharge from the cooler, Tco is the hot gas outlet temperature, and cpc is
the heat capacity of gas per unit volume kJ/m3 K. According to Ulrich Terblanche [6], the specific heat of the clinker
cooler hot gas can be approximated as a function of the gas temperature by using the specific thermal capacity of dry
air calculation. Table 2 shows the annual average energy loss from the kiln shell, preheater and cooler. The largest
source of heat loss is in the kiln shell and the clinker cooler gas.
Figure 7. Proposed location of heat exchanger for heat recovery from preheater exhaust gas.
Table 2. Waste heat analysis from Kiln shell, preheater, and cooler Item Availability Energy
consumption
Qkiln conv Q kiln rad Q hourly
MWh
Q Annual
GWh/year
Average
temperature oC
Carnot
Kiln Shell 95% 900 kcal/kg
clinker
28.44
GWh/year
50.79
GWh/year
9.1 79.23 314 50%
Preheater 95% 5 44.32 315 50.1%
Cooler 95% 4.98 43.7 254 44.4%
Total 95% 19.48 167.25
Page 7
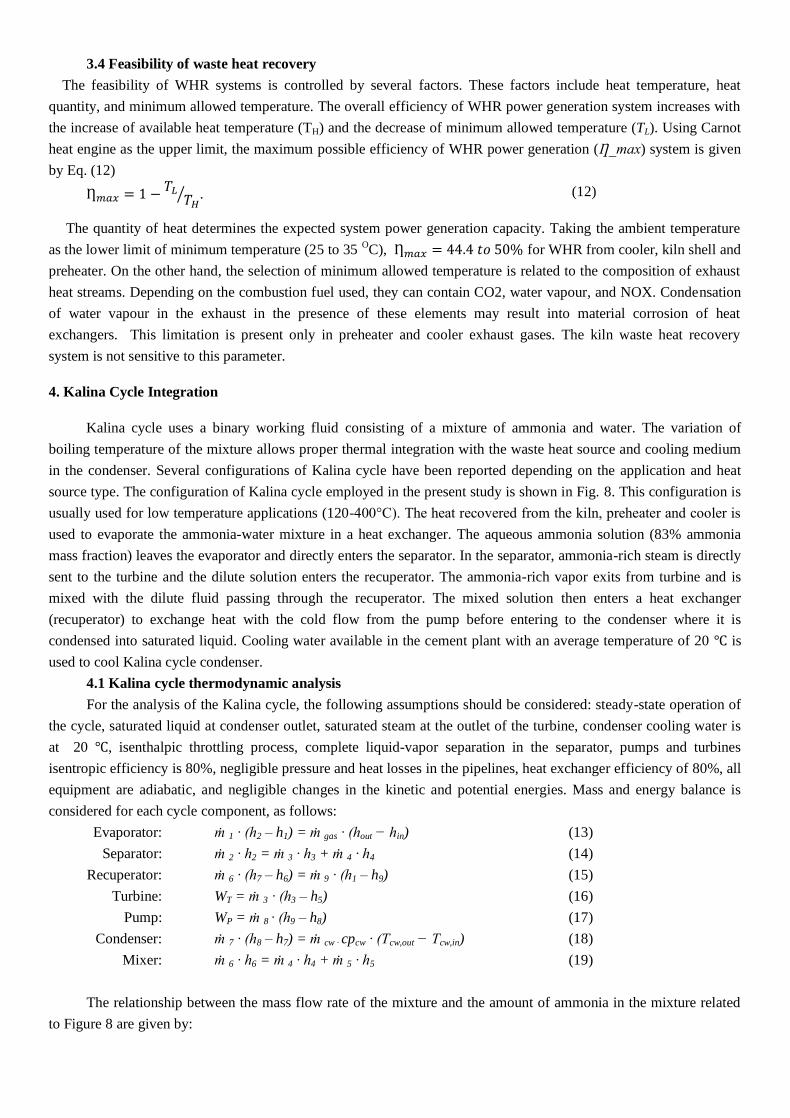
3.4 Feasibility of waste heat recovery
The feasibility of WHR systems is controlled by several factors. These factors include heat temperature, heat
quantity, and minimum allowed temperature. The overall efficiency of WHR power generation system increases with
the increase of available heat temperature (TH) and the decrease of minimum allowed temperature (TL). Using Carnot
heat engine as the upper limit, the maximum possible efficiency of WHR power generation (Ƞ_max) system is given
by Eq. (12)
⁄ . (12)
The quantity of heat determines the expected system power generation capacity. Taking the ambient temperature
as the lower limit of minimum temperature (25 to 35 OC), for WHR from cooler, kiln shell and
preheater. On the other hand, the selection of minimum allowed temperature is related to the composition of exhaust
heat streams. Depending on the combustion fuel used, they can contain CO2, water vapour, and NOX. Condensation
of water vapour in the exhaust in the presence of these elements may result into material corrosion of heat
exchangers. This limitation is present only in preheater and cooler exhaust gases. The kiln waste heat recovery
system is not sensitive to this parameter.
4. Kalina Cycle Integration
Kalina cycle uses a binary working fluid consisting of a mixture of ammonia and water. The variation of
boiling temperature of the mixture allows proper thermal integration with the waste heat source and cooling medium
in the condenser. Several configurations of Kalina cycle have been reported depending on the application and heat
source type. The configuration of Kalina cycle employed in the present study is shown in Fig. 8. This configuration is
usually used for low temperature applications (120-400°C). The heat recovered from the kiln, preheater and cooler is
used to evaporate the ammonia-water mixture in a heat exchanger. The aqueous ammonia solution (83% ammonia
mass fraction) leaves the evaporator and directly enters the separator. In the separator, ammonia-rich steam is directly
sent to the turbine and the dilute solution enters the recuperator. The ammonia-rich vapor exits from turbine and is
mixed with the dilute fluid passing through the recuperator. The mixed solution then enters a heat exchanger
(recuperator) to exchange heat with the cold flow from the pump before entering to the condenser where it is
condensed into saturated liquid. Cooling water available in the cement plant with an average temperature of 20 ℃ is
used to cool Kalina cycle condenser.
4.1 Kalina cycle thermodynamic analysis
For the analysis of the Kalina cycle, the following assumptions should be considered: steady-state operation of
the cycle, saturated liquid at condenser outlet, saturated steam at the outlet of the turbine, condenser cooling water is
at 20 ℃, isenthalpic throttling process, complete liquid-vapor separation in the separator, pumps and turbines
isentropic efficiency is 80%, negligible pressure and heat losses in the pipelines, heat exchanger efficiency of 80%, all
equipment are adiabatic, and negligible changes in the kinetic and potential energies. Mass and energy balance is
considered for each cycle component, as follows:
Evaporator: ṁ 1 · (h2 – h1) = ṁ gas · (hout − hin) (13)
Separator: ṁ 2 · h2 = ṁ 3 · h3 + ṁ 4 · h4 (14)
Recuperator: ṁ 6 · (h7 – h6) = ṁ 9 · (h1 – h9) (15)
Turbine: WT = ṁ 3 · (h3 – h5) (16)
Pump: WP = ṁ 8 · (h9 – h8) (17)
Condenser: ṁ 7 · (h8 – h7) = ṁ cw · cpcw · (Tcw,out − Tcw,in) (18)
Mixer: ṁ 6 · h6 = ṁ 4 · h4 + ṁ 5 · h5 (19)
The relationship between the mass flow rate of the mixture and the amount of ammonia in the mixture related
to Figure 8 are given by:
Page 8
ṁ 2= ṁ 3+ ṁ 4 (20)
ṁ 2 x2= ṁ 3 x3+ ṁ 4 x4 (21)
ṁ 3= ṁ 5 (22)
ṁ 6= ṁ 5+ ṁ 4 (23)
ṁ 6 x6= ṁ 5 x5+ ṁ 4 x4 (24)
ṁ 6= ṁ 7 (25)
ṁ7= ṁ 8 (26)
ṁ9= ṁ 1 (27)
The performance of Kalina cycle coupled can be evaluated by estimating the thermal efficiency of the cycle.
ȠI = (WT – WP) / Qc (28)
Where WT, WP, and Qc are turbine power, pump power, and heat rate input from the cooler exhaust gas. The
second law efficiency of the cycle is calculated as:
ȠII = ȠI / Ƞmax (29)
Figure 8. Kalina cycle integration and layout using Aspen software
4.2 Aspen simulation and model validation
Investigations of waste heat recovery in Al arish cement plant has been carried out using Aspen HYSIS
software V8.4. Aspen HYSYS is used extensively in industry and academia for steady-state and dynamic simulation,
process design, performance modelling, and optimization. It includes tools for estimation of physical properties and
liquid-vapor phase equilibrium, heat and material balances, and simulation of many types of chemical engineering
equipment. It also provides built-in blocks simulating basic process components such as heat exchangers, separators,
turbines, and pumps required for the modelling of the cycles. In the present study, shell and tube heat exchangers are
used for waste heat recovery. The inlet hot gas is fed into the shell side and the ammonia water mixture flow inside
the tubes. The inlet conditions for hot gas such as temperature, pressure, flow rate, and mass fractions of gas
components are set based on site measurements during normal operation. The Flow rate of Ammonia-Water through
heat exchangers and mass fraction are set based on recommended values from previous research. On the other hand,
the hot gas outlet temperature from the heat exchanger for the preheater is set to be 200 ℃ which is necessary for raw
mill process. Drum type separator with minimum separator inlet vapor quality of 5% is selected. For turbines, the
isentropic and mechanical efficiency are assumed as 90%. The mechanical efficiency of the pump is assumed to be
80%. The condenser cooling water is set at 20 ℃ and ammonia vapor quality is set to zero at the condenser outlet.
Detailed design parameters fed to ASPEN software are shown in Table 3. The calculated heat exchanger heat transfer
Page 9
area, mass flow rate in each component, pump and turbine power are obtained for each case as will be discussed and
analyzed in the following sections.
The numerical model of Kalina cycle is validated by comparison with previously published data of a base
model of Kalina cycle power plant in Husavik, Iceland [14, 17]. Figure 9 shows the model developed in [14, 17] for
the Kalina power plant of Husavik using hot water from a geothermal heat source at 124 ℃. The cycle has high and
low temperature recuperators (HTR and LTR). HTR is the main generator of Kalina cycle and LTR is used for pre-
heating of ammonia–water mixture using hot Ammonia exiting from the turbine. The cycle parameters reported in
[14, 17] and the values of mass flow rate for each component are used as input data for the present ASPEN simulation
as shown in Fig. 9. The condenser is cooled using water at 5 ℃. The turbine inlet pressure is 32.3 bar, ammonia mass
fraction of 82%, turbine isentropic efficiency of 90%, and pump isentropic efficiency of 80%. As shown in Figure 9,
the present ASPEN simulation results are in good agreement with the results reported by Ogriseck [14]. The
maximum difference in the values of temperature does not exceed 3.5% and is attributed as due to uncertainty in the
value of HTR and LTR heat exchangers efficiency. However, the mass fraction and mass balance are in excellent
agreement. The net power output from the cycle is estimated to be about 2.26 MW in close agreement with the value
of 2.37 reported in [14].
Based on the validation of the present model, it can be used as an analysis tool for studying the integration of kalian
cycle in the cement plant. In the present study two design alternatives for Kalina cycle integration in the cement plant
are proposed. In the first proposal, separate cycle is integrated with each heat recovery component. In the second
proposal, WHR from different components are combined to drive a single Kalina cycle. The results of this analysis
are presented in the following sections.
5. Kalina Cycle Driven by Separate WHR from Cooler, Preheater, and Kiln
Design parameters for separate Kalina cycles driven by separate waste heat recovery from cooler, preheater, and
kiln are summarized in Table 3. Design parameters shown in Table 3 are selected based on a parametric analysis of
the effect of turbine inlet pressure, mass flow rate, ammonia water concentration on Kalina cycle performance. The
case of WHR from cooler is considered for this analysis. During a certain study, other design parameters are kept
constant at the values shown in Table 3. Figure 10 shows the effect of turbine inlet pressure on turbine power of the
Kalina cycles. It can be observed that, the turbine power and cycle efficiency increase with the increase of turbine
inlet pressure. Figure 11 shows that the turbine power and cycle efficiency increase with the increase of ammonia
water concentration. In practice, 90% ammonia fraction is the break point of this behavior and the efficiency starts to
decrease sharply [15]. Value of ammonia water concentration adopted in the present study is 83% as used in [14, 17].
On the other hand, as expected, the increase of turbine mass flow rate results in the decrease of turbine inlet and outlet
temperatures. However, high values of mass flow rate would result in difficulty to in the condensation process using
same water-cooling source from cooling tower and require a large condensation area. Also, low condensation
pressures, may result in incomplete condensation at the end of the condenser and would cause damages to the
circulation pump. Based on the above results, design values of 40 bar, 7 bar, and 17 kg/s for turbine inlet pressure,
outlet pressure, and mass flow rate are adopted in the present study based on recommended turbine manufacturer data
of axial multi-stage turbine and optimization study reported in [13].
Design parameters for integration of Kalina cycle for WHR from cool, preheater and kiln are shown in Table 3.
The ASPEN plus flow sheet for all the cases is shown in Fig. 8. Figure 12 shows Kalina cycle simulation using Aspen
software in running mode for the case of WHR from the kiln surface. The results of ASPEN simulation are
summarized below in Table 4. The net power is the difference between turbine power and pump power. The values of
turbine output power and cycle efficiency using WHR from the cooler and preheater are significantly higher than
those obtained using the kiln.
Page 10
6. Kalina Cycle Driven by Combination of WHR from Cooler, Preheater, and Kiln
In the previous Sections, three separate Kalina cycles have been implemented to recover waste heat from the
cooler, preheater, and kiln. In the present section, three heat exchangers are proposed to be implemented in series to
recover the waste heat from the cooler, preheater, and kiln to heat ammonia water mixture before entering the
separator and turbine of single Kalina cycle. Figure 13 shows the configuration of the proposed Kalina cycle. Design
parameters for the proposed system is shown in Table 3. Figure 14 shows simulation results of Kalina cycle driven by
combination of waste heat from cooler, preheater, and kiln. Table 5 summarizes the performance parameters for
combined WHR. As compared to separate WHR shown in Table 4, combined WHR shows an improved thermal
performance. The combined waste heat recovery also offers the advantage of a smaller number of system components
as compared to separate cycles. An economic analysis would highlight the benefit of this issue.
7. Economic Analysis and Comparisons
Kalina cycle main cost include the cost of heat exchangers, recuperators, condensers, pumps, and turbines. The
cost of heat exchanger, recuperator, and condenser are function of the surface area (A) for heat transfer which can be
estimated as function of the logarithmic mean temperature difference ∆Tm and the overall heat transfer coefficient U.
Aspen software has been used to estimate the heat transfer surface areas for all components in Kalina cycle. Detailed
calculations of required components surface areas, pump and turbine power, and cost analysis for separate and
combined heat recovery have been performed. The cost function for each heat exchanger CHE is written as [16].
CHE = Co (30)
Where the base cost Co is taken as 588 US$/m2 and n= 0.8 according to quotations from experienced professional
manufacturing companies. The cost of pumps and turbines can be calculated as function of pump or turbine power in
kW using Eq. (31).
CPT = Co (31)
Where the base cost (Co) for the turbine is 4405 US$/kW and1120 US$/kW for pump. The exponent (n) is taken as
0.7 and 0.8 for turbine and pump, respectively. The total cost is obtained by adding 20% of equipment cost for
operation and maintenance and 20% for pipelines installations and infra-structure. Table 6 shows a summary of
required components surface areas, pump and turbine power, and cost analysis for separate and combined waste heat
recovery. The results show that a cost saving of about 23% with about 7% increase of total produced electric power
have been obtained using Kalina cycle in combined WHR as compared to separate WHR design. Considering the cost
of 1 kWh in Egypt, the payback periods for separate and combined WHR are 30, and 21 months, respectively.
Figure 9. Kalina Model validation, comparison with Ogriseck [14].
Page 11
Figure 10. Effect of turbine inlet pressure on turbine
power
Figure 11. Effect of ammonia/water concentration on
turbine power
Table 3. Design parameters for separate Kalina cycles driven by separate and combined WHR from cooler, preheater,
and kiln
Component Parameter Separate WHR
from cooler
Separate
WHR from
preheater
Separate
WHR from
kiln
Combined WHR
WHR
(Evaporator)
Shell and tube
Temperature of inlet mixture fluid 60 C 60 C 50 C 60 C
Inlet temperature of hot gas 254 C 315 C 314 C 254 C, 315 C, 314 C
cooler, preheater, kiln,
respectively
Outlet temperature of hot gas (Calculated) 96 C 200 C 111 C, 242.4 C, 129.2 C
cooler, preheater, kiln,
respectively
Heat exchanger arrangement Counter-flow Counter-flow Counter-flow
Ammonia mass fraction 83% 83% 83% 83%
Mass flow rate of fluid mixture 17 kg/s 17 kg/s 8 kg/s 27.7 kg/s
Separator Drum
Minimum separator inlet vapor quality 5% 5% 5% 5%
Recuperator Drum type
Turbine
Type Axial Multistage Condensation Back pressure turbine [14]
Rated speed 8000 rpm 8000 rpm
Isentropic efficiency 90% 90% 90% 90%
Mechanical efficiency 90% 90% 90% 90%
Outlet pressure 7 bar 7 bar 7 bar 7 bar
Inlet pressure 40 bar 40 bar 40 bar 40 bar
Turbine Inlet Temperature (simulation
result)
151.8 C 144.4 C 103.4 C 242.4 C
Minimum turbine outlet vapor quality 90% 90% 90% 90%
Condenser Shell and tube type
Condenser cooling water inlet temperature 20 C 20 C 20 C 20 C
Cooling water flow rate 300 kg/s 300 kg/s 144 kg/s 500 kg/s
Pump Pump efficiency 80% 80% 80% 80%
Pump power (Calculated) 106 (kW) 106 (kW) 53 (kW) 53 (kW)
Table 4. ASPEN simulation results of Kalina cycles using separate WHR from cooler, preheater, and kiln Case Pump Power
(kW)
Turbine Power (kW) Net Power (kW) Cycle Efficiency
Cooler WHR 106 3313 3207 32.4 %
Preheater WHR 106 3064 2958 28.5 5%
Kiln WHR 53 806 753 23.2%
Total 265 7130 6865
1000
1250
1500
1750
2000
2250
2500
2750
3000
3250
3500
25 28 31 34 37 40
Turb
ine
po
wer
(kw
)
Turbine inlet pressure (bar)
1500
1750
2000
2250
2500
2750
3000
3250
3500
65% 70% 75% 80% 85%
Turb
ine
po
wer
(kw
)
Ammonia/water concentration
Page 12
Table 5: ASPEN simulation results of Kalina cycle driven by combined WHR from cooler, preheater, and kiln Pump Power (kW) Turbine Power (kW) Net Power (kW) Cycle Efficiency
185 7537 7352 30%
Table 6. Comparison of heat transfer surface area, pump and turbine power, and cost analysis for combined
and separate waste heat recovery Case Component Cooler
WHR
Preheater
WHR
Kiln
WHR
Total S
epa
rate
WH
R
WHR Exchanger area (m2) 1500 1378 338 3216
Condenser area (m2) 3102 2880 707 6689
Recuperator area (m2) 462 428 105 995
Total heat transfer surface area (m2) 10900
Pump power (kW) 106 106 53 265
Turbine Power (kW) 3313 3064 753 7130
Total cost ($) 9059046
Com
bin
ed W
HR
WHR Exchanger area (m2) 1850 1690 406 3946
Condenser area (m2) 4411 4411
Recuperator area (m2) 646 646
Total heat transfer surface area 8273
Pump power (kW) 185
Turbine Power (kW) 7357
Total cost ($) 6959720
Figure 12. Aspen simulation results for WHR from kiln using Kalina cycle
Page 13
Figure 13. Kalina cycle driven by combination of waste heat from cooler, preheater, and kiln
Figure 14. Aspen simulation results for combined WHR from cooler, preheater, and kiln using Kalina cycle
Conclusions
Detailed waste heat analysis and recovery from a typical cement plant using Kalina cycle have been carried out
using ASPEN software. The annual heat losses from the kiln surface, preheater, and the cooler are estimated as 79.23,
44.32, and 43.6 GWh at average temperatures of about 314, 314, and 254 ℃, respectively. The present analysis
indicates WHR for power generation with a maximum efficiency of 44 to 50% can be integrated with the cement
plant.
Two design schemes for Kalina cycle integration in the cement plant using separate and combined WHR from the
kiln surface, cooler, and preheater have been investigated. The design parameters for each configuration have been
determined following a parametric study for the effect of turbine inlet pressure, mass flow rate, and ammonia water
Page 14
concentration. The efficiency of the Kalina cycle increases as the ammonia concentration at the evaporator outlet
increases and the turbine inlet pressure increases.
The results show that, for separate WHR, turbine output electric power from cooler, preheater and kiln shell are
3.31 MW, 3.06 MW, and 753 kW, respectively with total net output power of approximately 6.865 MW. Values of
the cycle efficiency are 32.4%, 28.55 %, and 23.2 % for WHR from cooler, preheater, and kiln, respectively. The low
efficiency of WHR from the kiln is attributed to the use or secondary shell with limitations on surface heat transfer
due to mechanical parts rotation and maintenance requirements as well as low convection heat transfer.
The value of net power output using combined WHR is about 7.35 MW as compared to 6.86 using separate WHR
design. A cost saving of about 23% with about 7% increasing of total produced electricity power have been obtained
using Kalina cycle in combined WHR as compared to separate WHR design.
Nomenclature A Area, m
2 The radiation heat losses, kW
Ak kiln surface area, m2 T Preheater temperature, C
CHE The cost for each heat exchanger, US$ U the overall heat transfer coefficient, W/(m2 K)
CPT The cost of pumps and turbines, US$ Volume flow rate, m3/s
Ceq Equipment Cost, US$ W out Turbine output power, kW
Co the base cost function, US$/ m2 W pump Electrical power needed for pump, kW
specific heat, J/(K kg) x Ammonia water concentration
convection heat transfer coefficient, W/(m2.K) ρ Density, kg/m
3
j Number of Kiln length, Emissivity, dimensionless
mass flow rate, kg/s σ Stefan Boltzmann constant, W/m2K
4
Q conv Convection heat losses, kW maximum possible efficiency of waste heat
recovery, dimensionless
Ƞ Kalina cycle efficiency, dimensionless
References
[1] International Finance Corporation, Institute for Industrial Productivity, (2014). Waste heat recovery for the
cement sector: market and supplier analysis. World Bank
https://openknowledge.worldbank.org/handle/10986/20022 . (23 May 2021, date last accessed).
[2] Mirolli, M.D (2005) . The Kalina cycle for cement kiln waste heat recovery power plants. Cement Industry
Technical Conference. IEEE Xplore,330- 336. https://doi.org/10.1109/CITCON.2005.1516374.
[3] Siemens AG .(2009). How does cement production become energy efficient and environmentally friendly.
https://static.dc.siemens.com/datapool/industry/industrysolutions/cement/en/Cement-production-en.pdf. (23 May
2021, date last accessed).
[4] Leibowitz H., Mirolli, M. (1997). First Kalina combined-cycle plant tested successfully. Power Engineering, vol.
101, no. 5, 44.
[5] Tahsin, E., Vedat, A. (2005). Energy auditing and recovery for dry type cement rotary kiln systems a case study.
Energy Conversion and Management, 46(4): 551-562. https://doi.org/10.1016/j.enconman.2004.04.007
[6] Ulrich Terblanche (2012). Effective use of excess heat in a cement plant. Master of Science Thesis, KTH School
of Industrial Engineering and Management, http://www.diva-
portal.org/smash/get/diva2:563005/FULLTEXT01.pdf. (23 May 2021, date last accessed).
[7] Söğüt, Z., Oktay, Z., Karakoc, T. (2010). Mathematical modeling of heat recovery from a rotary kiln. Applied
Thermal Engineering, 30:817-825. https://doi.org/10.1016/j.applthermaleng.2009.12.009
[8] Widuramina, S, Ida, H., Lars-André , T . (2018). Waste heat availability in the raw meal department of a cement
plan. Case Studies in Thermal Engineering, 11: 1-14. https://doi.org/10.1016/j.csite.2017.12.001
[9] Kyoung, Hoon Kim (2019). Thermodynamic analysis of kalina based power and cooling cogeneration cycle
employed once through configuration. Energies, 12(8): 1536. https://doi.org/10.3390/en12081536
Page 15
[10] Kolar, D., Gupta, A. (2018). Thermodynamic analysis of Kalina cycle configurations for utilization of
geothermal energy. Progress in Industrial Ecology – An International Journal, 12(1/2).
https://doi.org/10.1504/PIE.2018.095885
[11] Mehri, A., Seyed, M., Mortaza, Y., Marc, A. R. (2014). Energy and exergy analyses of a new combined
cycle for producing electricity and desalinated water using geothermal Energy. Sustainability, 6(4): 1796-1820.
https://doi.org/10.3390/su6041796
[12] Yana G., Alexander S. Bruce H., Jigar S. (2014). Waste heat recovery for the cement sector: market and
supplier analysis, International Finance Corporation, DOI: 10.13140/RG.2.2.31140.53126.
[13] Star Cement (2013). Waste Heat Recovery Project at Star Cement project design document form for small
scale project activities. Clean Development Mechanism (CDM),
https://cdm.unfccc.int/Projects/Validation/DB/8SAN5D0PFEKY35I25XSI86STSRIOJ5/view.html. (23 May
2021, date last accessed).
[14] Sirko Ogriseck. (2009). Integration of Kalina cycle in a combined heat and power plant, A case study.
Applied Thermal Engineering. 29 (14-15): 2843. https://doi.org/10.1016/j.applthermaleng.2009.02.006
[15] Wang, J., Yan, Z., Zhou, E., Dai, Y. (2013). Parametric analysis and optimization of a Kalina cycle driven by
solar energy. Applied Thermal Engineering, 50:408–415, https://doi.org/10.1016/j.applthermaleng.2012.09.002.
[16] Carlos, E., Campos, R., José, C., Escobar, P., César, R. (2013). Exergetic and economic comparison of ORC
and Kalina cycle for low temperature enhanced geothermal system in Brazil. Applied Thermal Engineering,
52(1):109–119. https://doi.org/10.1016/j.applthermaleng.2012.11.012.
[17] Hjartarson H., Maack R., Johannesson S., 2003, Húsavík Energy - Multiple use of geothermal energy
Thermie project nr. GE 321 / 98 / IS / DK, International Geothermal Conference, Reykjavik, Iceland.
Submitted: 18.04.2021 Reviesed: 26.05.2021 Accepted 28.05.2021