Page 1
University of Rhode Island University of Rhode Island
DigitalCommons@URI DigitalCommons@URI
Open Access Master's Theses
2013
SEPARATING THE EFFECTS OF TEMPERATURE AND SEPARATING THE EFFECTS OF TEMPERATURE AND
COMMUNITY COMPOSITION ON THE MAGNITUDE OF COMMUNITY COMPOSITION ON THE MAGNITUDE OF
HETEROTROPHIC PROTIST GRAZING RATES IN NARRAGANSETT HETEROTROPHIC PROTIST GRAZING RATES IN NARRAGANSETT
BAY BAY
Samantha C. DeCuollo University of Rhode Island, [email protected]
Follow this and additional works at: https://digitalcommons.uri.edu/theses
Recommended Citation Recommended Citation DeCuollo, Samantha C., "SEPARATING THE EFFECTS OF TEMPERATURE AND COMMUNITY COMPOSITION ON THE MAGNITUDE OF HETEROTROPHIC PROTIST GRAZING RATES IN NARRAGANSETT BAY" (2013). Open Access Master's Theses. Paper 168. https://digitalcommons.uri.edu/theses/168
This Thesis is brought to you for free and open access by DigitalCommons@URI. It has been accepted for inclusion in Open Access Master's Theses by an authorized administrator of DigitalCommons@URI. For more information, please contact [email protected] .
Page 2
SEPARATING THE EFFECTS OF TEMPERATURE AND COMMUNITY
COMPOSITION ON THE MAGNITUDE OF HETEROTROPHIC PROTIST
GRAZING RATES IN NARRAGANSETT BAY
BY
SAMANTHA C. DECUOLLO
A THESIS SUBMITTED IN PARTIAL FULFILLMENT OF THE
REQUIREMENTS FOR THE DEGREE OF
MASTER OF SCIENCE
IN
OCEANOGRAPHY
UNIVERSITY OF RHODE ISLAND
2013
Page 3
MASTER OF SCIENCE THESIS
OF
SAMANTHA C. DECUOLLO
APPROVED:
Thesis Committee: Major Professor Susanne Menden-Deuer
David Smith
Tatiana Rynearson
Gavino Puggioni
Nasser H. Zawia DEAN OF THE GRADUATE SCHOOL
UNIVERSITY OF RHODE ISLAND 2013
Page 4
ABSTRACT
Understanding the relative effects of phytoplankton assemblage and
temperature on heterotrophic protist grazing rates remains underdeveloped due to
seasonal constraints that result in concurrent changes in both variables. In order to
separate effects of temperature and community composition on microherbivory, we
used the dilution method to measure grazing rates at in-situ and cooled incubation
temperatures conducted in parallel during summer/autumn 2012, in Narragansett Bay,
Rhode Island, USA. Chain-forming diatoms dominated the microphytoplankton,
whereas aloricate ciliates dominated the microzooplankton. Weekly environmental
variability –not primarily characterized by temperature– had a significant effect on
phytoplankton-species composition. Initial autotrophic biomass averaged 127 g C L-1
± 149 and heterotrophic biomass averaged 459 g C L-1 ± 281. Temporal change was
the principal factor associated with assemblage structure differences, having a greater
effect than temperature and incubation. Total autotrophic biomass increased
significantly, 600% at ambient and >200% at cooled temperatures, resulting in a
significant change in the phytoplankton assemblage structure over the incubation
period. Ambient phytoplankton growth and grazing rates averaged 1.77 d-1 ± 0.53 and
0.63d-1 ± 0.41, respectively. Temporal changes in phytoplankton species composition
did not have a significant effect on grazing rates. An average 6.4°C decrease in
temperature significantly lowered rates by an average of 1.9-fold for growth and 3.3-
fold for grazing. The percent primary production consumed was on average 1/3 lower
Page 5
in the cooled treatment. These results suggest that temperature plays a larger role in
regulating grazing magnitude than phytoplankton prey species composition.
Page 6
iv
ACKNOWLEDGMENTS
I would like to thank my major professor Susanne Menden-Deuer for her
tremendous mentorship and attentiveness that she has given me in support of my
work. This manuscript was greatly improved by the critical review of Drs. S. Menden-
Deuer, M. Gomez-Chiarri, T. Rynearson, D. Smith, G. Puggioni, and E. Harvey.
Thank you to: Ed Baker with assistance regarding the experimental set-up, lab mates
Amanda Montalbano and Françoise Morrison, as well as phytoplankton identification
experts Malcolm McFarland, Dr. Jan Rines, and Dr. Lucie Maranda. In addition, thank
you to Narragansett Bay Long-Term Monitoring Program director Dr. T. Rynearson,
Graduate School of Oceanography, University of Rhode Island (USA). Funding for
this project was provided by the University of Rhode Island (URI) in support of the
Narragansett Bay Long-Term Monitoring Program. Additional funding was provided
to S.M.D. by the Office of Naval Research grant no. 0002453 and the National
Science Foundation grant no. 0001916. A portion of this work was conducted at the
Rhode Island EPSCoR supported Center for Marine Life Science under EPSCoR
Grant #1004057 to URI for equipment funding.
I also give great thanks to the many scientists whose dedication, knowledge, and
expertise helped to make this project a success. Thank you to friends and family for
their love and words of encouragement they have provided over the past two years.
Page 7
v
PREFACE
This thesis is written in manuscript style rather than using the traditional
segregation of the thesis into chapters. The manuscript text is written in the formatting
style appropriate for submission to Marine Ecology Progress Series, and is followed
by appendices containing detailed, ancillary information regarding analysis techniques
and additional findings that will likely stand alone in an additional submission, but
that may also be included in the published paper.
Page 8
vi
TABLE OF CONTENTS
ABSTRACT .................................................................................................................. ii
ACKNOWLEDGMENTS .......................................................................................... iv
PREFACE ..................................................................................................................... v
TABLE OF CONTENTS ............................................................................................ vi
LIST OF TABLES ..................................................................................................... vii
LIST OF FIGURES ................................................................................................. viiii
MANUSCRIPT I .......................................................................................................... 1
CHAPTER 1 ................................................................................................................. 2
INTRODUCTION ............................................................................................. 2
CHAPTER 2 ................................................................................................................. 8
MATERIALS AND METHODS ....................................................................... 8
CHAPTER 3 ............................................................................................................... 16
RESULTS ........................................................................................................ 16
CHAPTER 4 ............................................................................................................... 28
DISCUSSION .................................................................................................. 28
APPENDICES ............................................................................................................ 43
LITERATURE CITED .............................................................................................. 49
FIGURE LEGENDS .................................................................................................. 57
Page 9
vii
LIST OF TABLES
TABLE PAGE
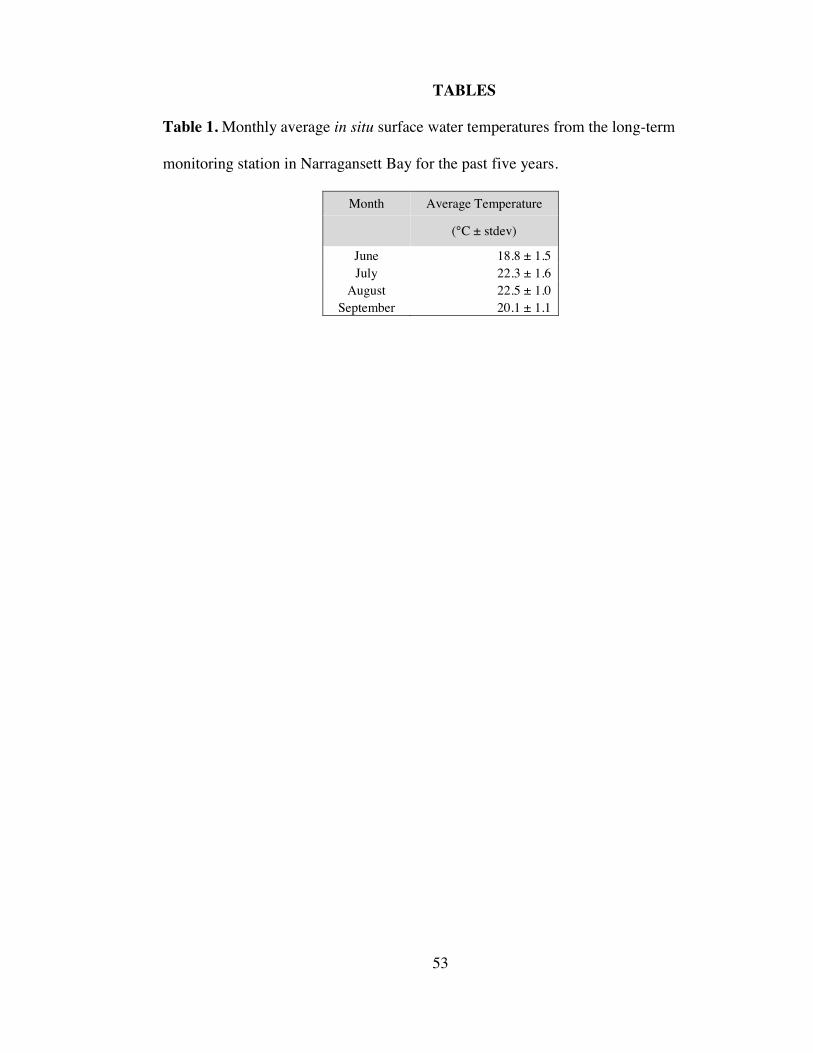
Table 1. Monthly average in situ surface temperature from Narragansett Bay .......... 53
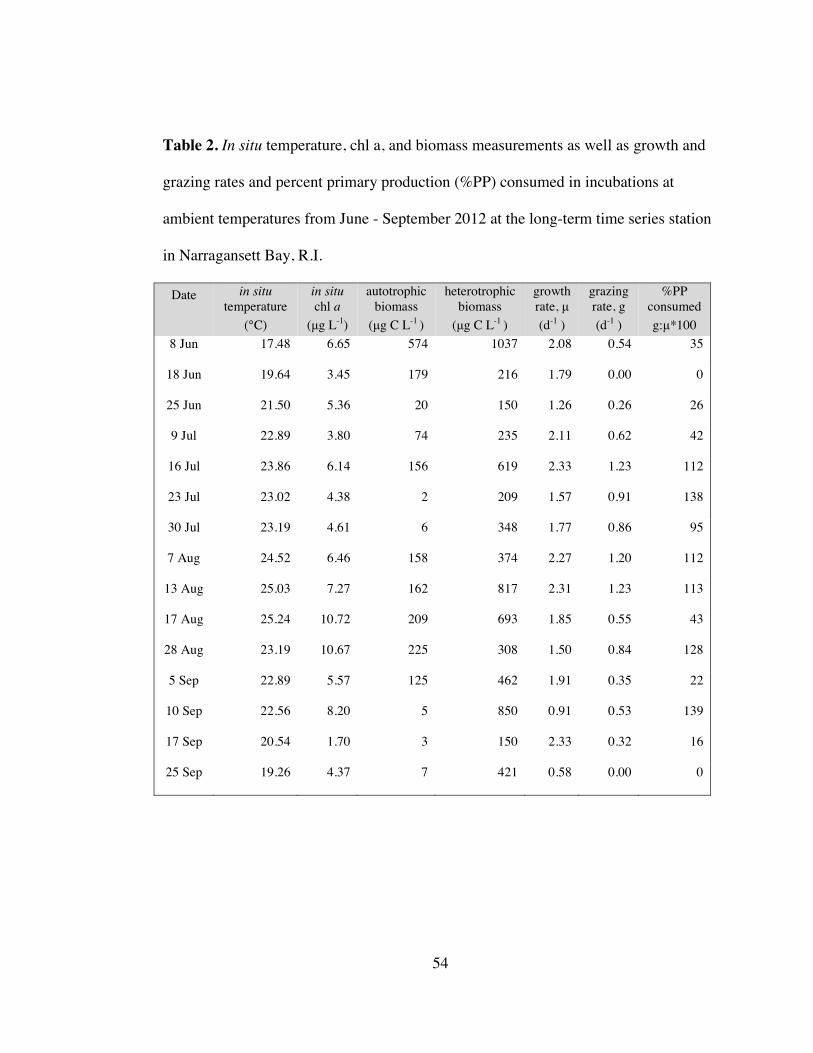
Table 2. In situ temperature, chl a, biomass & rates from experiments .................... 54
Table 3. Comparison of nutrient-amended and unamended phytoplankton apparent
growth rates ................................................................................................................. 55
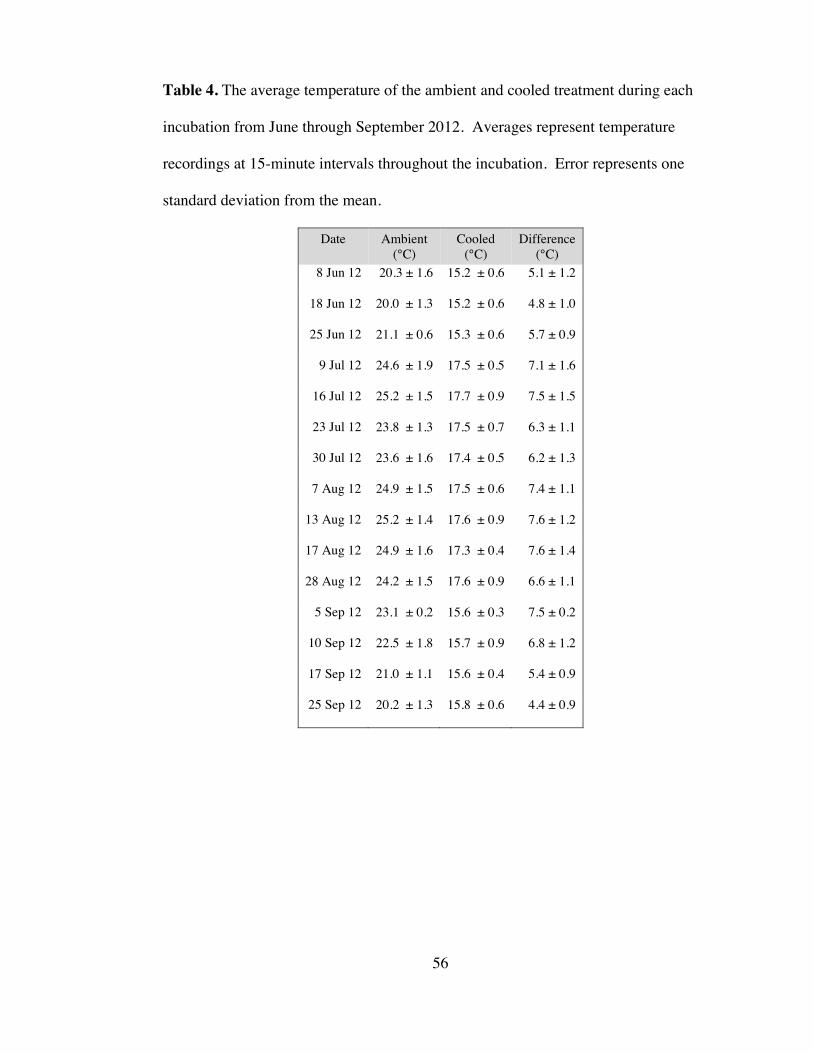
Table 4. Average temperatures over incubation period .............................................. 56
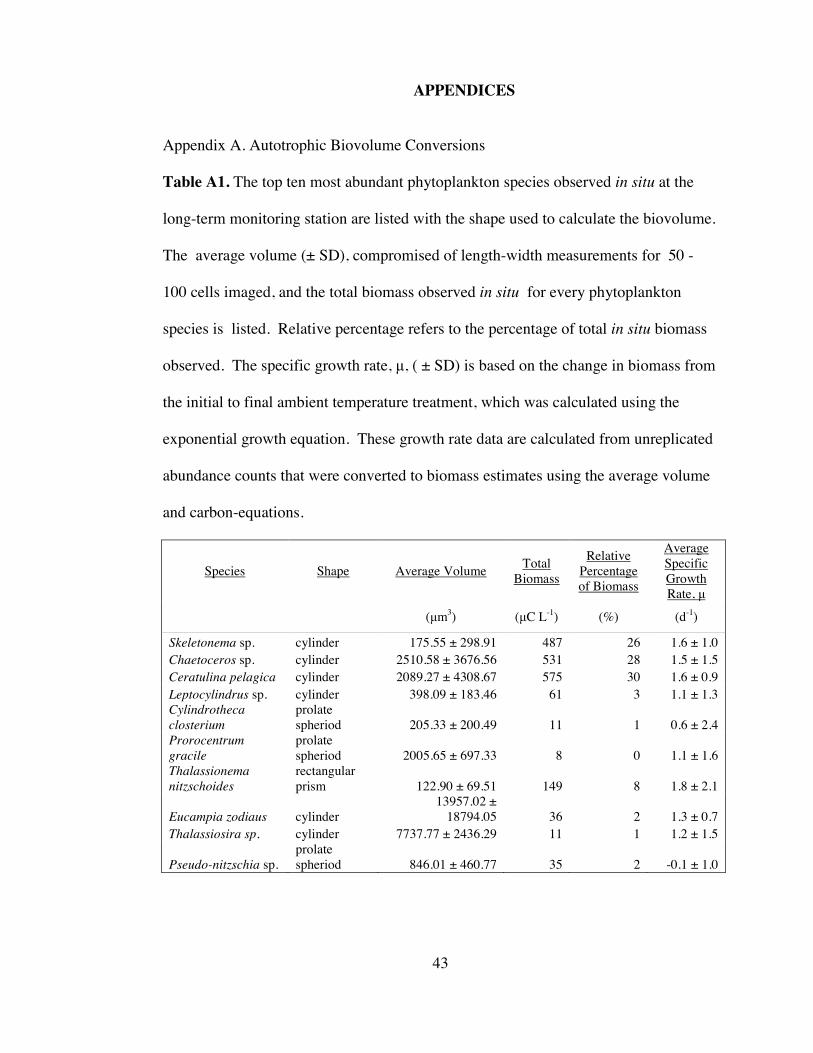
Table A1. Autotrophic biovolume conversions .......................................................... 43
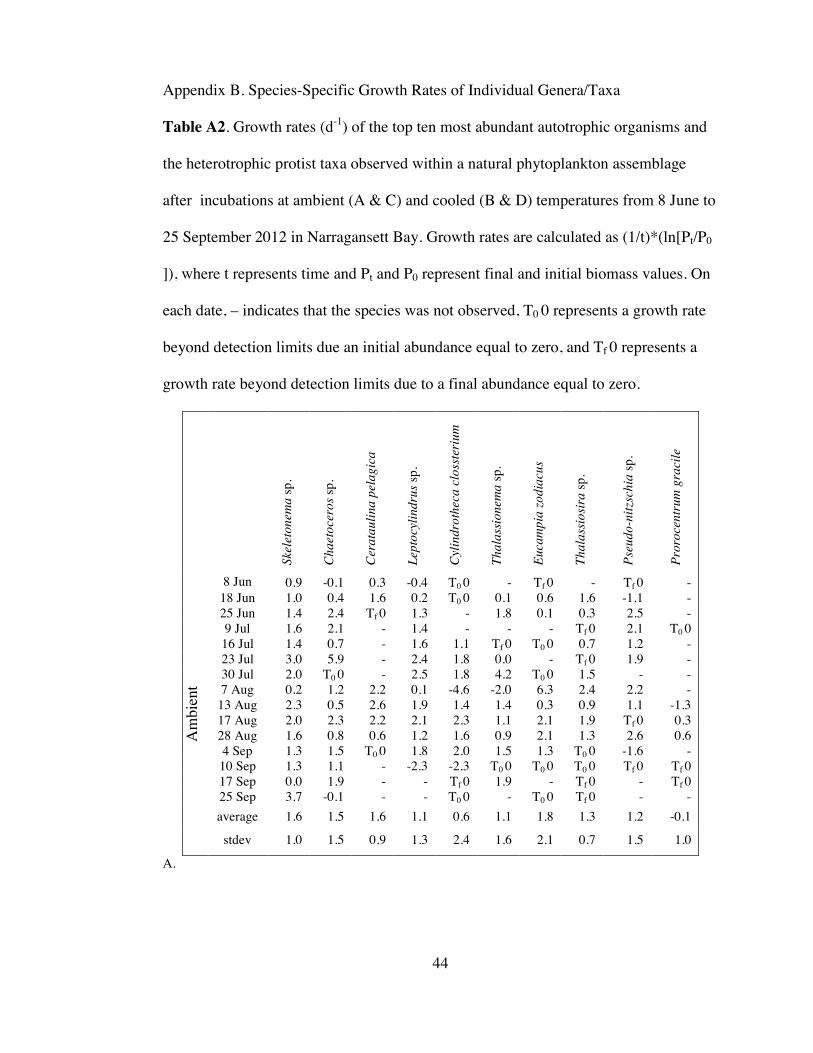
Table A2. Species-specific growth rates ..................................................................... 44
Page 10
viii
LIST OF FIGURES
FIGURE PAGE
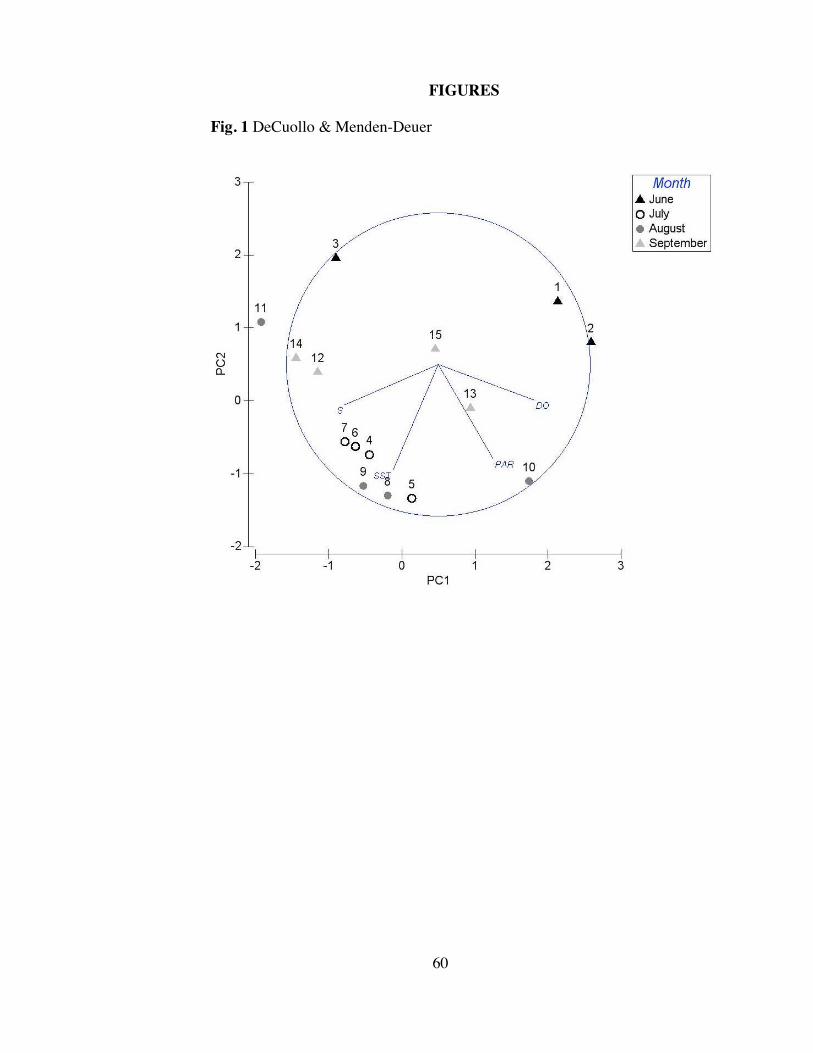
Figure 1. PCA of Narragansett Bay environmental variables. .................................... 60
Figure 2. Biomass estimates of autotrophic and heterotrophic protist community .... 61
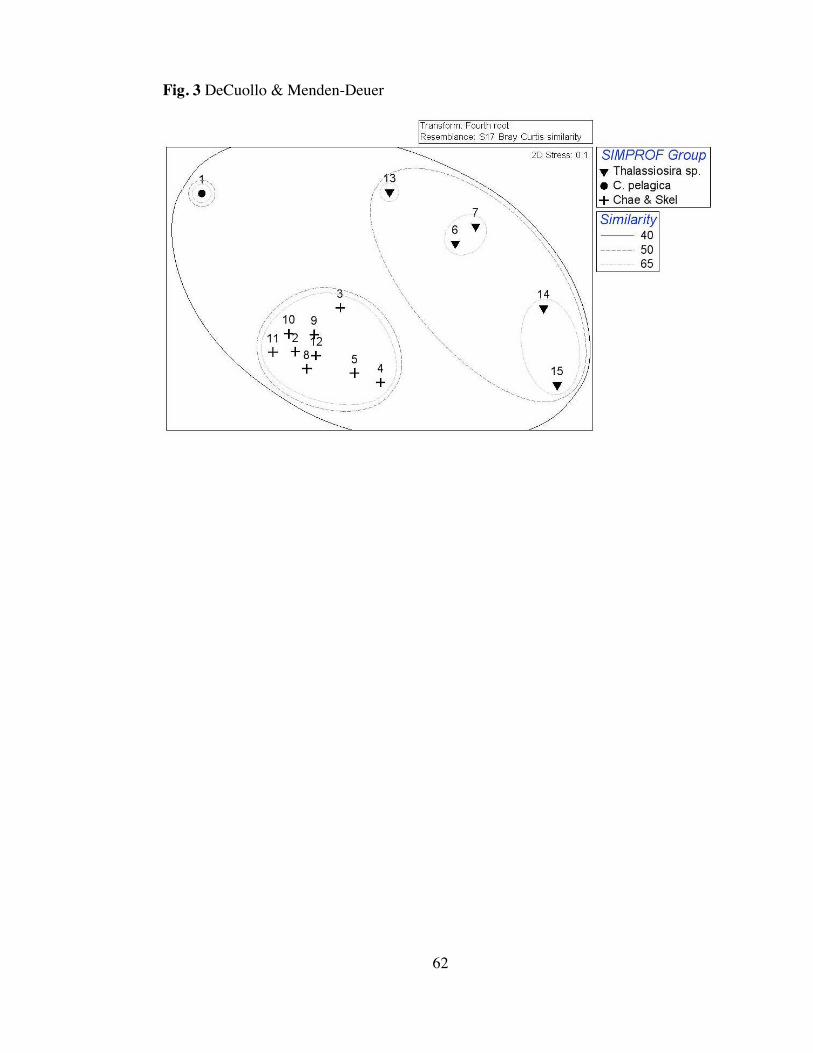
Figure 3. Autotrophic assemblage MDS ..................................................................... 62
Figure 4. In situ chlorophyll a concentration and ambient rates ................................. 63
Figure 5. Average rates of phytoplankton specific growth rates and heterotrophic
protist grazing for ambient and cooled treatments ..................................................... 64
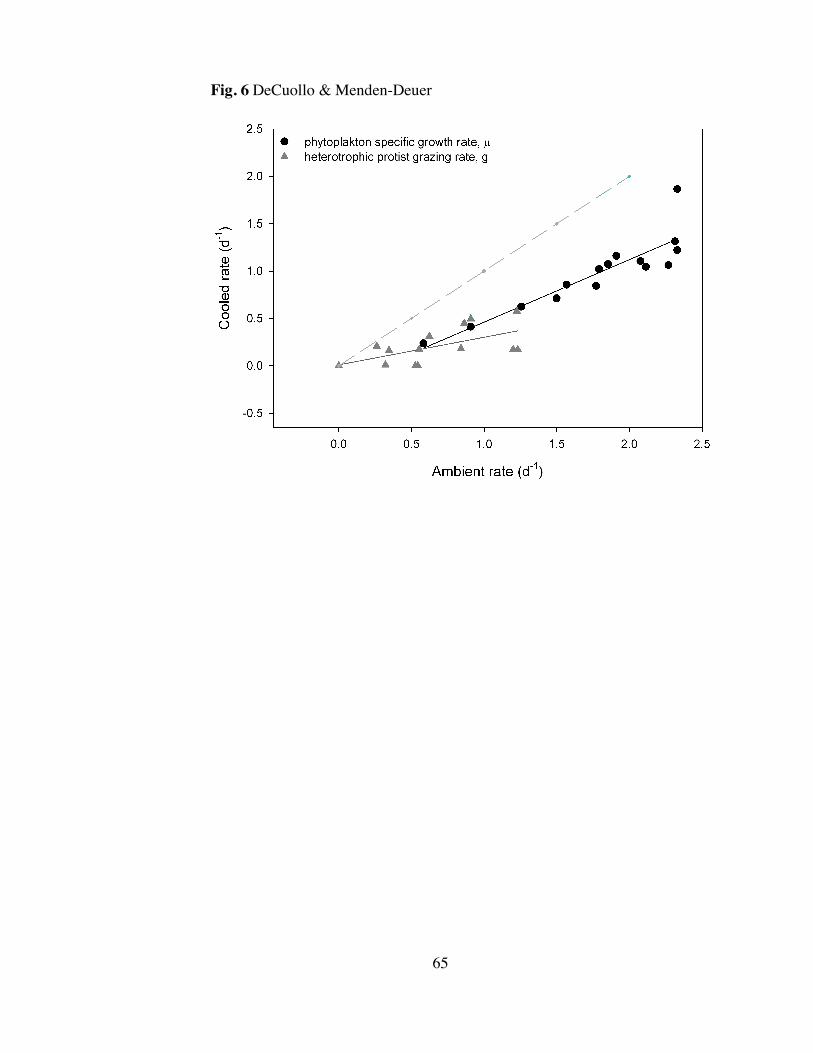
Figure 6. Regression of phytoplankton specific growth rates and heterotrophic protist
grazing rates in ambient vs. cooled treatments ........................................................... 65
Figure 7. %PP consumed for ambient and cooled treatments ..................................... 66
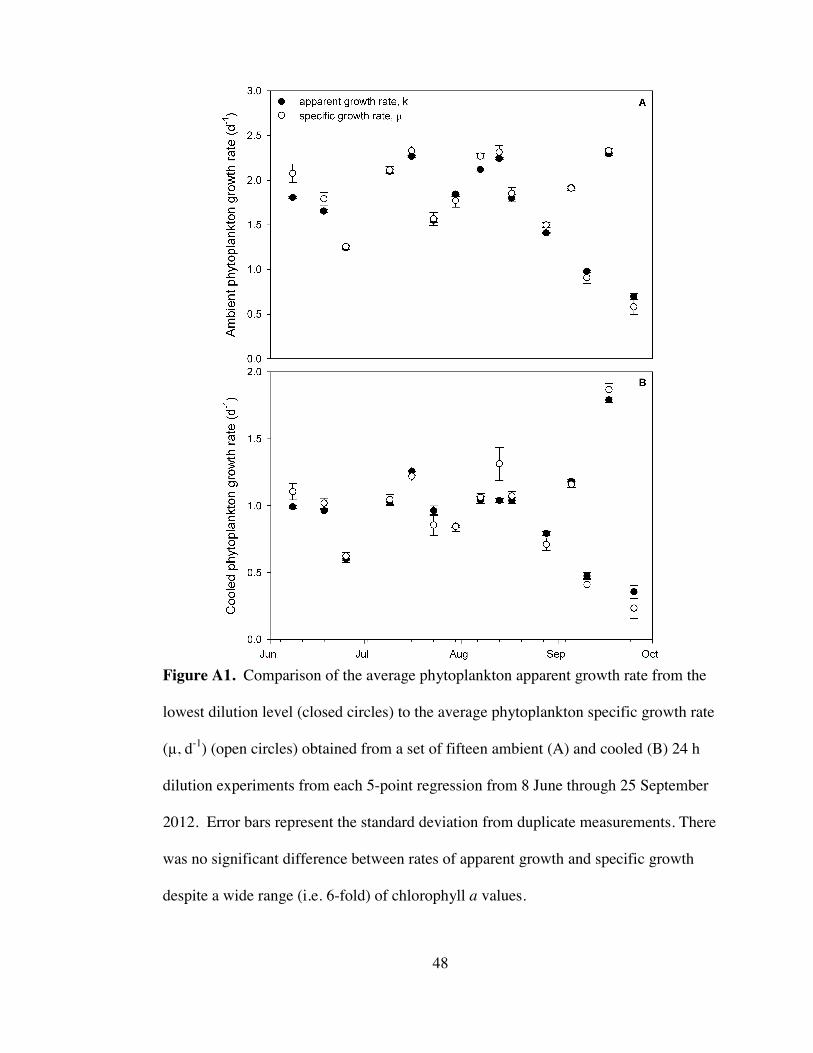
Figure A1. Comparison between the apparent growth rates at the lowest dilution and
the phytoplankton specific growth rates ..................................................................... 48
Page 11
1
MANUSCRIPT – I
Separating the Effects of Temperature and Community Composition on the
Magnitude of Heterotrophic Protist Grazing Rates in Narragansett Bay
Samantha C. DeCuollo and Susanne Menden-Deuer*
Graduate School of Oceanography, University of Rhode Island, Narragansett, RI,
USA
*[email protected]
This manuscript is formatted for the anticipated publication in the scientific journal
Marine Ecology Progress Series (2014).
Key Words: Heterotrophic Protist, Phytoplankton, Grazing, Estuary, Temperature,
Assemblage structure, Dilution
Running head: Temperature’s and Assemblage’s Effects on Grazing
Page 12
2
INTRODUCTION
Single-celled eukaryotic herbivores within the microzooplankton, commonly
termed heterotrophic protists, play a prominent role in the marine food web by grazing
on average 67% of the daily global phytoplankton production (Landry & Calbet 2004).
The magnitude of protistan herbivory determines the amount of photosynthetically
derived carbon that becomes available to higher trophic levels as a result of grazing
(Deason & Smayda 1982, Stoecker & Capuzzo 1990, Sherr & Sherr 1994) and has
been observed to vary both globally and temporally. Though insight regarding the
range of grazing magnitude is well established from a plethora of in situ heterotrophic
protist grazing rates collected around the globe (Landry & Calbet 2004), reliable
predictors of grazing magnitude remain un-developed (Li et al. 2011).
Drivers of Protistan Herbivory
Plankton community structure and temperature have both gained considerable
attention as potential variables that mediate heterotrophic protist grazing on
phytoplankton. Microzooplankton grazing rates have been positively correlated with
temperature in the North Pacific (Strom et al. 2001), the Antarctic (Caron et al. 2000),
and the Mediterranean (Modigh & Franzè 2009). The findings that temperature is rate
limiting may be regarded as a natural progression of the original research conducted
by Eppley (1972), which documented that rates of phytoplankton specific growth
increase exponentially with temperature up to ~40°C. More recent developments
suggest that metabolic rates, including growth, vary according to a specific,
quantitative relationship between body size and temperature (Brown et al. 2004).
Page 13
3
However, temperature alone cannot predict rate magnitude. For instance,
microzooplankton grazing magnitude also varies the available prey type due to
predators’ prey preferences. Compiled data from dilution experiments show that
grazing magnitude has occasionally exceed 0.4 d-1 at low temperatures (<10°C) and
exhibits a wide range (0 - >2 d-1) at temperatures >10°C, thereby suggesting that
species composition likely plays a role in altering grazing magnitude (Caron et al.
2000). Additional evidence points towards the ability of heterotrophic protists to
detect and/or ingest desirable over less-desirable prey items (Buskey et al. 1997). At
least as much importance is attributed to species composition as to temperature by
Lawrence & Menden-Deuer (2012), who observed that grazing in Narragansett Bay
was most substantial when Skeletonema sp. was abundant or when surface
temperatures were highest. However, due to the seasonal constraints that resulted in
concurrent changes in both temperature and species composition in their study, the
relative effect of temperature and prey species composition on grazing rate could not
be differentiated quantitatively. Moreover, several studies attempting to identify
driving factors in mediating predator prey interactions are specific to certain species
and locations, as well as limited by the scope of species and variables considered
(reviewed in Caron & Hutchins 2012). Therefore, tremendous value exists behind
evaluating grazing rates within complex phytoplankton assemblages and in situ to
better predict which factors mediate protistan herbivory. Conducting grazing
experiments under controlled and manipulated temperatures but constant species
composition may help reveal whether species composition or temperature, or both,
mediate the magnitude of heterotrophic protist grazing.
Page 14
4
Long-Term Plankton Time Series Station in Narragansett Bay
Narragansett Bay is home to the long-term phytoplankton-monitoring project,
possibly one of the world’s longest running plankton time series. Initiated in 1957, the
sampling and processing methods have since expanded; at present, data collection
includes a weekly analysis of the biological (i.e. community composition and
abundance of phytoplankton, zooplankton, and ctenophores) and physical (i.e.
temperature, salinity, turbidity, size-fractionated chlorophyll a, and nutrients)
parameters.
The historical context of a well-known time series, such as the Long-Term
Monitoring Program (Borkman & Smayda 2009), offers a unique opportunity to
concurrently analyze the variation in environmental conditions and phytoplankton
assemblages. Predictability in sea surface temperature measurements exists for
temperate Narragansett Bay. Based on sea-surface temperatures made weekly from
2007 – 2011 spanning a four-month period between June and September at the Long-
Term Time Series Station, summertime water temperatures have been predictably
warm (~20.5°C); on average, the variation in temperature across the period was small
(i.e. 7.9°C), whereas seasonal variation over an annual scale during the same period
was tremendous, averaging 23.0°C, with seasonal variations reaching 15.4°C and
15.8°C during the winter and spring seasons, respectively. Additionally at the station,
Karentz & Smayda (1984) observed that Skeletonema numerically dominated the
diatom genera across a twenty-two year period (1959 - 1980) and exhibited a bimodal
maximal occurrence during winter-early spring and again in mid-summer (i.e.
August); though Borkman & Smayda (2009) observed a rapid ca. 50% decline in
Page 15
5
Skeletonema abundance in 1980, nonetheless Skeletonema was observed at relatively
stable reduced abundances post-1990. A seasonal study of protistan grazing has
identified that these conditions (i.e. peak Skeletonema concentrations and warm
temperatures) coincide with the annually highest grazing pressure on
microphytoplankton (Lawrence & Menden-Deuer 2012). Therefore, the warm
temperatures and the presence of the genus Skeletonema indicate that summer in
Narragansett Bay is an appropriate location to detect optima grazing events and to
address the question regarding the relative importance of the effects of temperature
and species composition on grazing magnitude.
Use of the Dilution Method to Quantify Heterotrophic Protist Grazing
When predator and prey are similar in size, typical grazing experiments that
rely on separation by filtration are not appropriate. The dilution method is a widely
used method to quantify grazing by heterotrophic protists on phytoplankton in the
same size range (Landry & Calbet 2004, Dolan & McKeon 2005, Weinbauer et al.
2011). The dilution method aims to manipulate the number of predator-prey
encounters to measure the grazing rate by comparing the rates of disappearance of
phytoplankton pigment across a dilution gradient (Landry & Hassett 1982). The
dilution method assumes that (1) phytoplankton growth is unaffected by
phytoplankton concentration (i.e. growth is equal at all dilution levels); (2) predator-
prey encounter rates are proportional to clearance rates (i.e. grazers will always feed at
a constant and maximal rate) and (3) the change in population density of
phytoplankton is exponential. A series of dilutions is applied to a homogeneous
community of whole seawater and distributed into bottles, where each bottle
Page 16
6
represents one dilution. This distributes a well-mixed phytoplankton community
across a series of dilutions to create lower prey abundances in more diluted bottles and
higher prey abundances in less diluted bottles. If no predators exist, one would expect
to observe no significant difference in growth rates across all bottles (i.e. a constant
specific growth rate). With grazers, increasing dilution levels decrease the potential for
microzooplankton-phytoplankton encounters, decreasing the potential for
consumption. Thus, as predator-prey encounter rates increase, the net growth rate
decreases. The method is used to determine the rates of phytoplankton growth and
heterotrophic protist grazing.
Motivation
The goal of this study was to test the hypothesis that temperature alters the
grazing magnitude of heterotrophic protists while controlling for a changing species
community composition in order to evaluate the relative importance of each factor.
We investigated this by measuring grazing rates in parallel incubations at two
temperatures with the same species composition to determine to what degree the
magnitude of grazing rates were affected by either incubation temperature or
phytoplankton community composition. We conducted experiments during the
summer, when temperatures were relatively consistent and when the temperature
variation was minimal compared to the annual temperature range as well as inferior
relative to other environmental variables, thereby ascertaining an advantage by
allowing us to assume trivial temporal temperature variations from week to week.
Constraining the study period to the summer minimized weekly temperature
Page 17
7
differences and limited additional confounding and indirect effects of temperature,
such as those previously associated with the seasonal progression of the plankton
assemblage structure (Pratt 1959, Durbin et al. 1975). Fifteen dilution experiments
were conducted weekly to bi-weekly from the early summer (June 2012) through mid-
autumn (September 2012) on an unfiltered plankton assemblage to separate the effects
of temperature and phytoplankton assemblage structure on the grazing rate of
heterotrophic protists. Our findings show that temperature significantly altered
grazing rates during short-term incubations and that the temporal (i.e. weekly) change
was the most significant driver of assemblage structure.
Page 18
8
MATERIALS AND METHODS
The individual effects of temperature and community composition on
heterotrophic protist grazing rates were assessed on a plankton assemblage collected
on fifteen dates from the site of the Narragansett Bay long-term plankton time series
from 8 June through 25 September 2012 using the dilution method–a well-established
technique used to quantify protistan herbivory rates (Landry & Hassett 1982).
Sampling Methods
Surface seawater was collected from the Long-Term Time Series Station (41°
34.5’N, 71° 24.3’W) located in Narragansett Bay, Rhode Island, USA. For a map of
the sampling site location, see Lawrence & Menden-Deuer (2012; Fig. 1). Water was
sampled using bucket grabs, gently poured through a 200 m mesh –hereafter termed
whole seawater– to remove macrozooplankton grazers, and stored in dark, 10 L
carboys during transit to the laboratory. A portion of whole seawater was 0.2 m
gravity-filtered (Pall capsule) to create filtered seawater. Appropriate volumes of
whole seawater were added to filtered seawater to create a dilution series, of five
dilutions at 10, 25, 50, 75, and 100% whole seawater. Each dilution was partitioned
into duplicate clear, 1 L bottles using polycarbonate tubing. The bottles were secured
to rotating plankton wheels (rotation rates approximated 3 - 4 rpm) for a 24 h duration
under ambient light conditions. Two identical, parallel sets were prepared and
incubated on separate plankton wheels - each assigned a temperature treatment
(detailed below).
Page 19
9
Nutrient limitation of phytoplankton growth has been detected during the
summer months in Narragansett Bay (Lawrence & Menden-Deuer 2012). Therefore,
to prevent nutrient limitation, bottles were enriched with inorganic nitrogen and
phosphorus to a concentration of 10 and 2 M L-1, respectively; these values represent
averages of the maximum nutrient concentration observed in situ at the Long Term
Time Series Station between Spring 2003 and December 2009. To account for the
effects of nutrient limitation on phytoplankton growth, two additional bottles of non-
nutrient amended whole seawater were included in the ambient temperature treatment.
A paired t-test was used to determine if nutrient addition significantly enhanced the
apparent net growth rates in nutrient amended and un-amended treatments and a 2-
way ANOVA was used to detect the significance of the interaction between nutrient
addition and temperature.
Physical data, including salinity, surface seawater temperature (°C), and
dissolved oxygen percent variation (%), were collected on station using an in situ
profiler (Yellow Springs Instrument YSI 6920 V2). These data, in addition to
photosynthetically available radiation (PAR) (mol photons m-2 s-1), were used for
subsequent analysis to identify associations between environmental conditions,
growth, grazing, and community composition.
Temperature Treatments
To separate the effects of temperature and community composition on
heterotrophic protist grazing magnitude, dilution experiments were completed in pairs,
where each dilution series set was assigned to a temperature treatment. An ambient
Page 20
10
treatment used flow-through bay water to mimic in situ temperature conditions
whereas a cooled treatment continuously circulated freshwater through a chiller to a
target temperature that was 5°C below the monthly surface seawater temperature
average from the last five years observed at the Long-Term Time Series Station (Table
1). Our experimental set-up relied on relatively steady in situ temperatures from week
to week to control for the effects of temperature. The temperature in each incubator
was monitored at 15-minute intervals using HOBOware equipment (Hobo Inc.).
A cool treatment was selected over a warm treatment, as it guaranteed that
experimental temperature did not exceed the maximum temperature tolerable to any
one species within the natural assemblage and ensured that the temperature difference
between treatments was within the range of ambient temperature variability that could
occur in Narragansett Bay over a 24 h period and seasonally.
Rate Analyses
To quantify autotrophic growth within each bottle, chlorophyll a and
phaeophytin concentrations were measured at the start and endpoint of each 24 h
incubation period by filtering triplicate subsamples from each bottle of each dilution
level following the method described by Graff & Rynearson (2011). Volumes filtered
ranged from 30 to 60 mL. Variation in chl a concentration measurements was low;
throughout the study period, the coefficient of variation (CV) of all triplicate chl a
measurements taken from all dilution levels averaged 3.8%, with a range from 0.1% to
11.9%.
Page 21
11
Phytoplankton apparent growth rates (k, d-1) were calculated for each bottle as
k = (1/t)*(ln[Pt/P0 ]), where t represents time and Pt and P0 represent final and initial
chlorophyll a concentrations. A model 1 linear regression analysis of k versus dilution
level (n=10) was used to yield rates of phytoplankton specific growth (, d-1) and
heterotrophic protist grazing (g, d-1) from the y-intercept and the negative slope of the
regression, respectively (Landry & Hassett 1982). Lack of statistical significance in
the regression slope (p-value > 0.05) was interpreted as an event with no measurable
grazing (i.e. g = 0 d-1). In order to more accurately represent the effects of nutrient
limitation on in situ growth, phytoplankton specific growth rates were further
calculated as = k + g, where k represents the apparent phytoplankton growth rate
from the undiluted bottle (Landry et al. 2005), and were reported for in situ
Narragansett Bay conditions.
To compare the relative grazing pressure across sample dates, the percentage
of primary production consumed (%PP) by heterotrophic protists was calculated for
each treatment on all dates using the equation %PP = g/*100; %PP was only
calculated when phytoplankton growth was significant (i.e. > 0 d-1) and when
grazing was detected (i.e. g > 0.01 d-1) (Landry & Calbet 2004).
Autotrophic & Heterotrophic Protist Biomass Estimates
To assess the taxonomic diversity and to quantify changing community
composition over time, subsamples of 100 mL whole seawater were taken at the start
of the experiment and again after incubations at each of the two temperature
treatments. Samples were preserved by adding acid Lugol’s to the subsample to a final
Page 22
12
concentration of < 1% Lugol’s solution. Phytoplankton cells within the size range 10 -
>200 m were identified at 200x magnification and counted in 1 mL Sedgewick rafter
chambers under a light microscope equipped with phase contrast at 100x
magnification. Heterotrophic protists (i.e. microzooplankton cells within the size
range 10 – 200 m) were enumerated at 100x magnification in settled 10 mL aliquots,
by quantifying each slide in its entirety using inverted microscopy (Utermöhl 1958).
Species identification was based on Hoppenrath et al. (2009) and Tomas (1997) and
categorized as either autotrophic or hetero/mixotrophic according to the literature.
Phytoplankton cells were identified to at least the genus level and heterotrophic
protists were designated to belong to a coarse taxonomic or functional group (i.e.
aloricate ciliates, ebridian flagellates, heterotrophic dinoflagellates, tintinnids, and
radiolaria).
Phytoplankton and heterotrophic protist numerical abundances were converted
to biomass estimates (g C L-1) for each sample. A rank order of cell abundance was
applied to identify the top ten most abundant phytoplankton species. The top ten most
common species comprised over 99% of the total cells observed throughout the study
period. The average carbon content (g C) for the top ten most abundant
phytoplankton species and for the complete heterotrophic protist community was
calculated based on empirical length width measurements taken on 50 - 100 cells of
each type using ImageJ software. Biomass for aloricate ciliates, diatoms, ebridian
flagellates, heterotrophic dinoflagellates, tintinnids, and radiolaria were calculated
using the carbon conversion provided in Menden-Deuer & Lessard (2000) (Appendix
Page 23
13
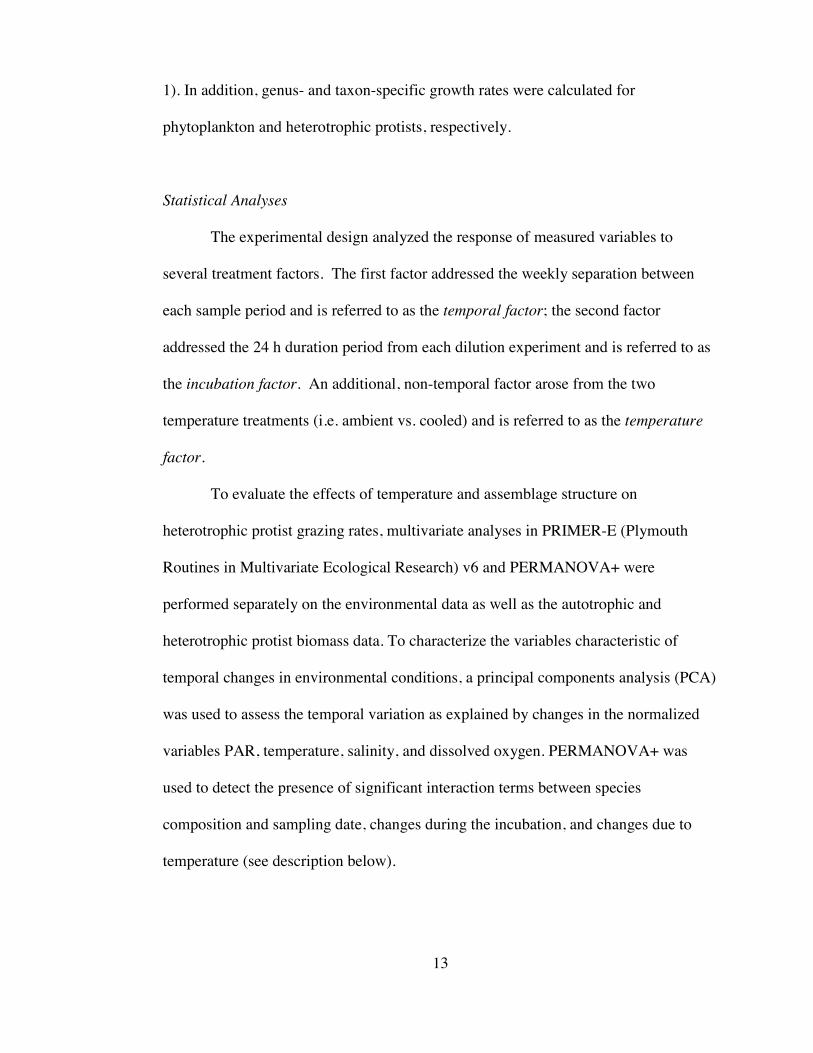
1). In addition, genus- and taxon-specific growth rates were calculated for
phytoplankton and heterotrophic protists, respectively.
Statistical Analyses
The experimental design analyzed the response of measured variables to
several treatment factors. The first factor addressed the weekly separation between
each sample period and is referred to as the temporal factor; the second factor
addressed the 24 h duration period from each dilution experiment and is referred to as
the incubation factor. An additional, non-temporal factor arose from the two
temperature treatments (i.e. ambient vs. cooled) and is referred to as the temperature
factor.
To evaluate the effects of temperature and assemblage structure on
heterotrophic protist grazing rates, multivariate analyses in PRIMER-E (Plymouth
Routines in Multivariate Ecological Research) v6 and PERMANOVA+ were
performed separately on the environmental data as well as the autotrophic and
heterotrophic protist biomass data. To characterize the variables characteristic of
temporal changes in environmental conditions, a principal components analysis (PCA)
was used to assess the temporal variation as explained by changes in the normalized
variables PAR, temperature, salinity, and dissolved oxygen. PERMANOVA+ was
used to detect the presence of significant interaction terms between species
composition and sampling date, changes during the incubation, and changes due to
temperature (see description below).
Page 24
14
All biomass data were fourth-root transformed to down weigh the contribution
of the dominant genus/species groups and had a Bray-Curtis resemblance measure
applied. A single-linkage CLUSTER and SIMPROF analysis, based on weekly
biomass values, were used to segregate sample dates into three statistically significant
assemblages. A one-way SIMPER further defined the average similarity within each
assemblage and identified those species which contributed most to assemblage
discrimination (i.e. that were most influential in typifying an assemblage). A series of
ordination plots were used to visualize similarities in assemblage structure and
environmental variables across sample dates where distance is proportional to
similarity: points that are close together represent similarity in assemblage structure
and points that are further apart represent dissimilarity in assemblage structure. In the
figures, sample dates are represented in numerical order and increase with increasing
sample date (e.g. 1 corresponds to 8-June-12, the first sampling date, and 15
corresponds to the last sampling date).
To determine if temperature altered the phytoplankton specific growth and
heterotrophic protist grazing rates, a paired t-test was used to determine statistically
significant differences between the ambient and cooled rates. A linear relationship was
used to describe the relationship between ambient and cooled rates and to compare the
outcome to a 1:1 relationship. In addition, the reliability of a 2-point dilution was
assessed using a paired t-test, which compared phytoplankton specific growth rates
calculated based on a 2-point and 5-point dilution (Worden & Binder 2003).
For further statistical analysis grazing rates were categorized as low, average,
and above average grazing, g (d-1) rates; averages were calculated separately for the
Page 25
15
ambient and cooled treatment. The categories were applied as a-priori groups in the
form of factors in subsequent multivariate analyses to determine the effect of grazing
magnitude on assemblage structure. In addition, the sensitivity of the conclusions to
the chosen category was tested and indicated robustness across several divisions of
grazing. Unless otherwise stated, all errors presented represent one standard deviation
of the mean. Statistical significant was assigned at p < 0.05.
Data Sources
Photosynthetically active radiation data were provided by the Narragansett Bay
National Estuarine Research Reserve System-wide Monitoring Program, which is
supported by a grant under the Federal Coastal Zone Management Act, administered
by the Office of Ocean and Coastal Resource Management, National Oceanic and
Atmospheric Administration, Silver Spring, MD. Data can be access at the NERRS
Centralized Data Management Office, Baruch Marine Field Lab, University of South
Carolina at http://cdmo.baruch.sc.edu.). NOAA/OCRM support research was
conducted under an award from the Estuarine Reserves Division, Office of Ocean and
Coastal Resource Management, National Ocean Service, National Oceanic and
Atmospheric Administration.
Page 26
16
RESULTS
In Situ Biological & Environmental Conditions of Narragansett Bay
Throughout the observation period, environmental and biological variations
exhibited temporal patterns, which represented the progression of the 2012 summer
season. In situ temperatures averaged 22.3 ± 2.2°C and ranged from a low of 17.5°C
(8 June 2012) early in the season to a high of 25.0°C (17 August 2012) mid-season.
This was on average 1.8°C warmer than average temperature from the same time
period between 2007 to 2011 (Table 2).
In situ chl a concentrations varied by more than 6-fold and averaged 5.96 ±
2.52 g L-1. Chl a values peaked at 10.72 g L-1 (17 August 2012) and were lowest at
1.70 g L-1 (17 September 2012) towards the end of the study period. No significant
relationship between chl a concentration and in situ temperature was detected (p =
0.09).
Heterotrophic protist biomass exceeded autotrophic biomass for all fifteen
sampling dates. Autotrophic biomass averaged 127 ± 149 g C L-1 and heterotrophic
protist biomass averaged 459 ± 281 g C L-1. The temporal variation in autotrophic
biomass was 300-fold and exceeded the temporal variation in heterotrophic protist
biomass, which varied by 7-fold. Biomass maxima for both autotrophs and
heterotrophic protists coincided with cool in situ temperatures. On the earliest and
coolest (17.5°C) date, 8 June 2012, biomass values peaked at 574 g C L-1 and 1037
g C L-1, for the autotrophic and heterotrophic protist community, respectively.
Heterotrophic protist biomass reached minima of 150 g C L-1 on two occasions; the
first occurred on 25 June 2012 and the second on 17 September 2012. The minimum
Page 27
17
autotrophic biomass, 2 g C L-1, was observed on 23 July 2012 though similar values
were observed later in the season.
Temperature contributed minimally to the temporal environmental variation
observed in Narragansett Bay. A principal components analysis (PCA) characterized
temporal variations in PAR, temperature, salinity, and dissolved oxygen percent
variation (Fig. 1). The greatest changes in environmental conditions were due to
dissolved oxygen percent saturation, salinity, and PAR; the PC1 axis had a roughly
equal weighted combination of contributions from these three variables. The first two
axes of the PCA accounted for a combined 72.7% of the explained variation, with the
first and second axes explaining 44.4% and 28.3%, respectively, indicating its
appropriateness as an indicator of the observed variability among sample dates.
Dissolved oxygen percent saturation values ranged from 81 to 113.5%, exhibiting
dominance in PC1 and trending with PAR. Salinity values averaged 30.6 and ranged
from 29.1 (18 June 2012) to 31.2 (9 July 2012). PAR values averaged 768 ± 342
mol photons m-2 s-1 and ranged from a minimum of 45 mol photons m-2 s-1 (25 June
2012) to a maximum of 1148 mol photons m-2 s-1 (16 July 2012). Temperature and
PAR primarily characterized the PC2 axis. A seasonal trajectory regarding
temperature was evident on PC2, in which June was relatively cool (<20°C), July to
mid-August became relatively warm (>22.5°C), and a subsequent decrease in
temperature continued for the remaining mid-autumn dates. Samples from July
through mid-August clustered tightly, indicating similar environmental conditions
during this period.
Page 28
18
Composition of In Situ Assemblages
Chain-forming diatoms numerically dominated the 10-200 m observed size
fraction throughout the study period. Three species of diatoms dominated the majority
of the autotrophic biomass, and are listed with their average relative percentage across
the study period: Ceratulina pelagica (30%), Chaetoceros sp. (28%), and Skeletonema
sp. (26%). However, over 98% of C. pelagica’s biomass was observed on only one
date, 8 June 2012, which was characterized by a unique bloom event of this species.
The heterotrophic protist species community composition was variable and was
dominated by aloricate ciliates, which accounted for 54% of the total observed
heterotrophic protist biomass across all sampling dates. The most numerically
abundant taxa included aloricate ciliates (< 30 m) followed by heterotrophic
dinoflagellates consisting of thecate dinoflagellates (< 20 m) and Gyrodinium sp.
Tintinnid genera included Stensomella sp. and Favella sp. We observed only one
species of ebridian flagellate, Ebria tripartita. Heterotrophic dinoflagellates
dominated the heterotrophic protist biomass on 18 June 2012 through 16 July 2012
and again on 7 August 2012 (Fig. 2).
Observed Variability & Temporal Patterns Associated with In Situ Biomass and
Assemblage Structure
Temporal change was the principal factor associated with assemblage structure
differences, having a greater effect than incubation temperature or the incubation. The
passage of time from week to week resulted in significant alterations of the
autotrophic assemblage structure (p < 0.001) such that sample dates were temporally
Page 29
19
segregated into three statistically distinct species assemblages over the study period
(Fig. 3). The three assemblages were defined as the late-spring assemblage, the
summer assemblage, and the late-summer/autumn assemblage. Biomass of the late-
spring assemblage was overwhelmingly dominated by Cerataulina pelagica, which
composed 98% of the assemblage’s biomass. The late-spring assemblage only
consisted of a single date, 8 June 2012, which was the day that autotrophic biomass
values peaked at 574 g C L-1. Due to the lone sample date for this assemblage, an
average Bray-Curtis similarity was not calculated. The summer assemblage had an
average biomass of 107 ± 82 g C L-1 and exhibited a high degree of similarity, i.e.
74%, made up mainly of contributions from the chain-forming diatom species
Skeletonema sp., Chaetoceros sp., and Leptocylindrus sp. With the onset of autumn,
Narragansett Bay’s in situ autotrophic assemblage shifted away from diatoms towards
dinoflagellates and relatively smaller (<10 m), un-enumerated flagellates. Exceptions
to this temporal pattern included two sample dates, July 23rd and July 30th, which
grouped with the autumn samples. The abundance of un-enumerated flagellates likely
explains the two orders of magnitude variation in the autotrophic biomass observed.
Biomass of the late-summer/autumn assemblage averaged 73 ± 99 g C L-1 and was
dominated by Thalassiosira sp., followed by Skeletonema sp. and Chaetoceros sp. The
late-summer/autumn assemblage was in general characterized by the inclusion of more
dinoflagellates, a greater diversity of autotrophs, and a larger range in biomass values,
thereby resulting in a lower average Bray-Curtis similarity, i.e. 58%, compared to the
summer assemblage. Similarity of the late-summer/autumn assemblage was made up
of contributions from three chain-forming diatom species: Thalassiosira sp.,
Page 30
20
Skeletonema sp., and Chaetoceros sp. It is important to note that although
Thalassiosira sp. characterized the late-summer/autumn assemblage, the average
biomass of the species was still higher in the summer assemblage. The between-
assemblage dissimilarity of the summer and late-summer/autumn assemblage was
54.2% and was largely due to contributions by Skeletonema sp. and Chaetoceros sp.,
which contributed 10.9% and 10.4% to the total dissimilarity, respectively.
Temporal change also resulted in significant changes in the heterotrophic
protist assemblage (p < 0.001). We found no evidence of group structure among the
biomass of the five heterotrophic protist taxa. Neither the single linkage, complete
linkage or group averaged dendrograms yielded significant clustering across all
sample dates. Incubation temperature also co-varied with assemblage structure to a
significant degree for both the heterotrophic protist (p = 0.01) and autotrophic (p =
0.04) biomass assemblage.
In Situ Rate Measurements in Narragansett Bay
Phytoplankton growth and heterotrophic protist grazing rates were similar in
magnitude throughout the study period (Fig. 4). Phytoplankton specific growth rates
averaged 1.14 d-1 ± 0.45 and were positive throughout the study period. Specific
growth rates ranged from a minimum of 0.39 d-1 (10 September 2012) to a maximum
of 2.01 d-1 (17 September 2012). Heterotrophic protist grazing rates averaged 0.63 ±
0.41 d-1. The highest grazing rate, 1.25 d-1, occurred on 16 July 2012. No grazing was
measured on 18 June and 25 September 2012. Heterotrophic protist growth rates were
positive for all taxa expect for ebridian flagellates; average growth rates varied for
Page 31
21
each group of heterotrophic protist, with the ebridian flagellates group having the
lowest average growth rate of 0.0 d-1 and the tintinnid group averaging the highest
growth rate of 1.2 d-1.
Grazing rates were unrelated to initial autotrophic and heterotrophic protist
biomass as well as unrelated to the biomass of individual phytoplankton genera
(maximum R2 = 0.23; minimum p = 0.05). The relative percentage of primary
production consumed (i.e. g:) averaged 68% ± 51 and ranged from a minimum of <1
(18 June & 25 September 2012) to a maximum of 139 (10 September 2012). The
percentage consumed was also not significantly related to autotrophic (p = 0.94) or
heterotrophic protist (p = 0.66) biomass. The addition of nutrients significantly
increased phytoplankton growth rates at both temperatures (p < 0.001); on average,
nutrient additions increased phytoplankton growth rates by a factor of 1.6 and 1.3 for
the ambient and cooled treatment, respectively, though no significant interaction was
detected between nutrient addition and temperature (p = 0.11) (Table 3).
Temperature Treatments
The manipulated incubation temperature in the cooled treatment differed
significantly from the ambient treatment (p < 0.001) by an average of 6.4 °C (Table 4).
The temperature difference between treatments ranged from a maximum of 7.6°C (13
August 2012) to a minimum of 4.4°C (25 September 2012). The targeted temperature
difference of 5.0°C between treatments was exceeded for all but two dates, in which
the average difference between treatments reached 4.8 °C (18 June 2012) and 4.4 °C
(25 September 2012). In general, the temperature difference between ambient and
Page 32
22
cooled incubators increased with increasing in situ temperatures such that the greatest
differences (>6 °C) between treatments were observed when it was warmest.
Within the flow-through incubators, ambient and cooled water temperatures
averaged 23.0 ± 2.0°C and 16.6 ± 1.1°C, respectively. The average daily water
temperature for both the ambient and cooled treatments reached minima at similar
times resulting in values of 20.0 ± 1.3°C (18 June 2012) and 15.2 ± 0.6°C (8 June and
18 June 2012) respectively. However, we observed maximum water temperatures on
different dates for each treatment, neither of which corresponded to the in situ
maximum. The ambient incubator reached a maximum temperature on 13 August
2012 (average = 25.2 ± 1.4°C), whereas the cooled incubator reached a maximum on
16 July 2012 (average = 17.7 ± 0.9°C). Temperature within each incubation also
varied. Daily variability averaged 4.6°C ± 1.2 and 2.3°C ± 0.8°C for the ambient and
cooled incubators, respectively (daily variability data not shown). The daily ambient
variability exceeded cooled variability and reflects the daily variation in solar
irradiance and temperature of the source water for the ambient treatment; because the
cooled treatment was hooked up to a chiller, the over variation in temperature was, on
average, 2.3°C less in the cooled treatment.
Altered Rates In Response to Temperature Treatments
Temperature had a significant effect on phytoplankton growth and
heterotrophic protist grazing rates (Fig. 5). An on average 6.4°C decrease in
temperature resulted in a significant decrease in phytoplankton specific growth rate (,
d-1) by a factor of 1.9 (y = 0.66011*x - 0.19923; R2 = 0.81; p < 0.001) and a decreased
Page 33
23
grazing rate (g, d-1) by a factor of 3.3 (y = 0.29136*x + 0.010067; R2 = 0.40; p = 0.01)
(Fig. 6).
Similar ranges in %PP consumed were observed for both treatments (Fig. 7).
Cooling the temperature decreased the %PP consumed by 31% on average, but the
difference was not significant between the two treatments (p = 0.07), as both growth
and grazing rates were lowered by cooled temperature. Protistan herbivory exceeded
phytoplankton growth rates in both temperature treatments. On 10 September 2012,
the maximum ambient %PP, i.e. 139%, was observed. However, a %PP similar in
magnitude, i.e. 138%, was observed on 23 July 2012, when the maximum cooled
%PP, 137%, occurred. %PP consumed in the cooled treatment exceeded the ambient
treatment for the following two dates: 25 June & 30 July.
Species-specific growth rates were also altered in response to temperature.
Contrary to temperature’s significant effects on phytoplankton growth, temperature
significantly decreased the growth rate of only one heterotrophic protist taxa, (i.e.
radiolaria; p=0.04). All other heterotrophic protist growth rates were not significantly
different across temperature treatments (max p=0.9).
Effects of Incubation on Biomass and Assemblage Structure
Over the incubation period, increases in total biomass and shifts in assemblage
structure varied in degree relative to trophic level and to temperature. Large,
consistent increases in phytoplankton biomass existed in all fifteen incubations for
both temperatures. Autotrophic biomass increased significantly (p = 0.01), averaging a
600% and 200% increase, across both the ambient and cooled incubations,
Page 34
24
respectively; the change in biomass over the incubation period was on the same order
of magnitude as the temporal range in autotrophic biomass measured over the entire
sampling period, i.e. 300%. The autotrophic assemblage was significantly altered by
ambient (p = 0.003) and cooled (p = 0.01) incubation temperatures; assemblage
changes due to an incubation were smaller relative to that variation which resulted
from a temporal shift. Discrimination between the initial and final autotrophic
assemblages was primarily attributed to increases in the biomass of four species:
Skeletonema sp., Chaetoceros sp., Eucampia zodiacus, and Cerataulina pelagica.
These species were not only the greatest contributors to the observed changes in
assemblage structure over the 24 h period, but also made up greater than 90% of the
total biomass observed, across all observations in situ and after 24 h. Average
dissimilarities between the initial and final autotrophic assemblage were 46% and 44%
for the ambient and cooled incubations, respectively.
By contrast, incubation generally resulted in smaller biomass changes for
heterotrophic protists compared to the large changes in autotrophic biomass.
Heterotrophic protist biomass increased by an average of 80% and 60%, which
represented a significant increase (p = 0.003) for the ambient, but an insignificant
increase (p = 0.05) for the cooled treatment. The change in biomass was an order of
magnitude higher than the temporal variation in heterotrophic protist biomass, i.e. 7%.
In seven experiments spanning six experimental dates, i.e. in three ambient treatments
and four cooled treatments, total heterotrophic protist biomass declined over the
incubation period, with an average decline of 17% and 21%, respectively. However,
reduction in biomass did not appear to be associated with temperature. A maximum
Page 35
25
decline in heterotrophic biomass, 38%, was observed in a cooled treatment on 17
August. The heterotrophic protist assemblage was also significantly altered by the
incubation (p = 0.01), but the alteration was not greater than the variation in
assemblage structure due to temporal shifts. Changes in tintinnid biomass contributed
most to the observed difference over the 24 h period. Interestingly, although tintinnid
biomass was the best discriminating group to explain the effect of a 24 h treatment, it
did not account for the majority of the heterotrophic protist biomass. The average
dissimilarity between the initial and final heterotrophic protist assemblage was 28%
for both temperature treatments. For both assemblages, there were no significant
interactions between the temporal factor and the 24 h treatment effect (min p = 0.09).
Effects of Temperature on Final Biomass and Assemblage Structure
Temperature differences resulted in observed biomass differences, which were
amplified in the autotrophic assemblage relative to the heterotrophic protist
assemblage. On average, final autotrophic biomass was 1.1-fold higher in the ambient
treatment compared to the cooled treatment and this difference was significant (p =
0.02). Exceptions to biomass in the ambient treatment exceeding that of the cooled
treatment existed on two dates (i.e. 8 June and 18 June), in which cooled autotrophic
biomass exceeded ambient biomass by 20% and 28%, respectively. In comparison,
heterotrophic protist biomass was, on average, only 0.2-fold higher in the ambient
treatment and this difference was not significant (p = 0.9). On several dates,
heterotrophic biomass in the cooled treatment exceeded ambient heterotrophic
biomass (i.e. 8 June, 16 July, 23 July, 13 August, 28 August, and 25 September). It is
Page 36
26
important to note that, on average, the biomass increased for all phytoplankton species
and for all heterotrophic protist taxa except for radiolarian, implying that the
incubation treatments, including temperature manipulations, were reasonably well-
tolerated by diverse taxa of both functional groups.
Although the total biomass differed in the two temperature treatments, the
assemblage structure was conserved. Temperature has an insignificant effect on the
final autotrophic (p = 0.3) and the heterotrophic protist (p = 0.07) assemblages.
Dissimilarities between the ambient and cooled assemblages averaged 44% and 25%
for the autotrophic and heterotrophic protist assemblages, respectively. Nonetheless,
biomass changes within a few main genera helped to explain the more subtle effects of
temperature on each assemblage. Regarding the autotrophic assemblage, the observed
differences were attributed to contributions by Chaetoceros sp., Skeletonema sp.,
Cerataulina pelagica, and Eucampia zodiacus, which made up the majority of the
observed biomass and, together, accounted for 55% of the average dissimilarity
between the ambient and cooled treatments. The species-specific growth rates for
these four phytoplankton groups were lowered to the greatest degree in response to
lower temperatures, though these differences were insignificant (max p=0.10).
Eucampia zodiacus had its growth rate most altered by temperature. Regarding the
heterotrophic protist assemblage, differences were due primarily to changes in
tintinnid, ebridian flagellate, and aloricate ciliate biomass, which together accounted
for 66% of the average dissimilarity between treatments. Though all heterotrophic
protist taxa grew more slowly in the cooled treatment, radiolaria was the only
Page 37
27
heterotrophic protist taxa to experience a significant decrease in growth in response to
temperature (p=0.04).
Page 38
28
DISCUSSION
The aim of this study was to elucidate the effects that temperature and
community composition have on the magnitude of heterotrophic protist grazing rates
within a microplankton assemblage from Narragansett Bay. We observed that a ~6°C
reduction in temperature for short-term (i.e. 24 h) incubations significantly decreased
both phytoplankton growth and heterotrophic protist grazing rates, and that protistan
herbivory rates were reduced to a greater extent than autotrophic growth rates. Cooled
temperatures decreased phytoplankton growth rates by ~2-fold and decreased
microzooplankton grazing rates by ~3-fold. Dual experiments at two temperature
treatments successfully maintained consistent phytoplankton and heterotrophic protist
species assemblages, making it possible to separate the effects of temperature and
community composition on the magnitude of heterotrophic protist grazing rates.
Patterns Regarding In Situ Assemblage Structure
The phytoplankton assemblage was typical of the Narragansett Bay
community, as it included the chain-forming diatoms Chaetoceros and Skeletonema,
two well-known genera that constitute part of the principal phytoplankton species in
Narragansett Bay (Smayda 1957, Karentz & Smayda 1984, Karentz & Smayda 1998).
Phytoplankton abundance in this study varied by ~150-fold and was within the range
of cell concentrations previously observed during a summertime study spanning a 22
yr period (Karentz & Smayda 1998).
Over the observation period, temporal changes were the most significant driver
of the autotrophic and heterotrophic protist assemblage. Occasional drastic changes
Page 39
29
existed in each assemblage from week to week – a variation that has been observed in
periods as short as one day (Strom et al. 2001).
A persistent heterotrophic protist assemblage existed throughout the summer.
Heterotrophic protists are known to be abundant in estuarine ecosystems and the taxa
present in this study were similar to those found previously in Narragansett Bay
(Lawrence & Menden-Deuer 2012). Numerically, the abundance of heterotrophic
protists exceeded that observed in the Arctic summer (Sherr et al. 2003) and at similar
latitudes in a European coastal ecosystem (Modigh & Franzè 2009). At times,
heterotrophic dinoflagellates dominated the biomass, which consisted of genera such
as Gyrodinium and Protoperidinium, which are known to feed preferentially on
diatoms (Buskey et al. 1997). Heterotrophic protist grazing rates were lower than
previously reported from this location; the magnitude of average heterotrophic protist
grazing rates measured (i.e. 0.63 d-1) was more similar to the annual average measured
at the same location (i.e. 0.66 d-1) than to the average that Lawrence & Menden-Deuer
reported for the late spring to summer months (i.e. 1.15 d-1) (2012). However, it is
important to note that Lawrence & Menden-Deuer’s average grazing for the same
period was based on non-nutrient amended experiments whereas our experiments were
in nutrient-replete conditions and corrected for nutrient-amendment. The initial
biomass of heterotrophic protists was significantly correlated to autotrophic biomass,
which supports previous research that suggests that autotrophic biomass is a good
indicator of the biomass of heterotrophic species (Burkhill et al. 1995). Strom et al.
(2001) further investigated this idea and ultimately detected a strong positive
relationship between larger (> 8 m) phytoplankton (based on chl a measurements)
Page 40
30
and both ciliate and dinoflagellate biomass, which did not extend to the lower-size
spectrum. The relationship highlights the important relationship predator-prey
interactions between phytoplankton and microzooplankton and is evidence that the
microzooplankton assemblage is structurally dependent on the phytoplankton
community.
Observed variations in the in situ autotrophic and heterotrophic protist
assemblage over the four-month period helped to distinguish the inherent temporal
characteristics and unique patterns associated in each assemblage. The in situ
heterotrophic protist assemblage was unstructured, whereas the in situ autotrophic
assemblage varied by month. Monthly shifts in the autotrophic assemblage structure
are well-known phenomena, in which a shift from phytoplankton to smaller flagellates
occurs as the summer progresses (Pratt 1959, Durbin et al. 1975). The highly variable
heterotrophic protist community composition observed in this study has also been
observed previously. Vigil et al. (2009) found evidence of a significant dominant taxa
change within one to two weeks with a similarly diverse species assemblage. For both
assemblages, temperature and species community composition co-varied, suggesting
that both factors likely are influential in mediating grazing on phytoplankton. Our
results suggest that the in situ heterotrophic protist community structure was extremely
variable from week to week and very resilient. The heterotrophic protist community
was numerically persistent throughout the season regardless of changes in autotrophic
composition; the observation could be indicative of the predators’ quick capability to
respond to temporal changes, such as autotrophic assemblage shifts, allowing the
predators to utilize the niches that become available with a changing autotrophic
Page 41
31
community.
Heterotrophic Protist Grazing During Summer Months in Narragansett Bay
Protist grazing accounts for the majority of phytoplankton mortality in the
ocean. In this study, on average, heterotrophic protists grazed 79% of the daily
phytoplankton primary production and exceeded 100% consumption on six occasions,
which supports grazing as a large phytoplankton loss factor. Our values exceeded the
overall average for the world’s oceans (67%; Landry & Calbet 2004) and were only
slightly less than previous observations in Narragansett Bay during the same time
period (Lawrence & Menden-Deuer 2012). Variation in heterotrophic protist grazing
rates occurred over a wide range of chl a concentrations, which varied by
approximately 6-fold throughout the study, and were similar to values previously
reported for estuarine ecosystems (Durbin et al. 1975, Oviatt 2004). High primary
production consumption has been linked to warmer temperatures or peak Skeletonema
sp. concentrations (Lawrence & Menden-Deuer 2012), two conditions which typically
characterize the environmental and biological conditions of summer in Narragansett
Bay.
Changes in environmental conditions were not driven by changes in
temperature over the four-month study period. The lack of association between
temperature and seasonal shifts provided the opportunity to separate the effects of
temperature from shifts in phytoplankton assemble structure and the resulting effects
on heterotrophic protist grazing rates. The relative consistency in temperature differed
from previous research, which found that temperature was the main contributor,
Page 42
32
relative to other environmental variables, of the observed environmental variation in
Narragansett Bay (Lawrence & Menden-Deuer 2012). We attributed this difference to
the length of the observation period. Lawrence and Menden-Deuer’s research was
conducted over the course of one year whereas our study took place over four months.
In temperate regions, such as Narragansett Bay, a short study confined to the summer
months holds an advantage over longer studies when testing temperature’s effects, as
longer study would yield a considerably greater range in in situ temperatures
compared to a shorter study where temperatures tend to be consistently warm.
Temperature Treatments
Our experimental set-up successfully maintained a significant temperature
difference across treatments, thereby allowing us to investigate the individual effects
on temperature on a unique natural plankton assemblage multiples times over the four-
month study period. The unusually warm summer of 2012 resulted in the unintended
consequence of exaggerating temperature differences between treatments. Overall,
water temperatures in Narragansett Bay in summer 2012 were 2.5 ± 1.1°C warmer
than average. Consequently, our average ambient temperature treatment was
consistently higher than the calculated seasonal average, resulting in an achieved
average difference of 6.4°C and an overshot of the targeted 5°C difference between
treatments. Previous research has observed an increase in the mean annual water
temperature at Woods Hole by 0.04°C yr-1 since 1960 (Nixon et al. 2004), but the
difference is not enough to account for the higher-than-expected water temperatures
that we observed. Grazers are thought to graze at higher rates in warmer temperatures
Page 43
33
(Burkhill et al. 1995, Caron et al. 2000, Strom et al. 2001), thereby altering the grazing
magnitude. As a result, our grazing rates could have been inflated, but on average, our
grazing rates were lower than previously observed.
The ambient treatment had a higher daily temperature variability compared to the
cooled incubator, because incubators were un-shaded from the Sun’s radiation.
Exposure to radiation likely heated the ambient tank to a greater degree than the
cooled tank, as the chiller buffered temperatures of the latter tank. Un-even heating
could have put additional stress on the phytoplankton in the ambient treatment.
However, we did not observe any evidence of phytoplankton stress (i.e. mortality) in
the incubators and there was no significant difference in taxa-specific mortality rates
due to temperature.
Temperature-Induced Shifts of Growth and Grazing Rates
Temperature is a key driver of metabolic rates (Eppley 1872, Gillooly 2001,
Gillooly 2002, Brown 2004). We anticipated that a decrease in temperature would
result in decreased growth based on a relationship originally described by Eppley
(1972). Significant decreases in phytoplankton specific growth rates were observed
after exposure to lower temperatures by a factor of 1.9. The outcome of these
experiments agrees well with prior documentation that the specific growth rate of
phytoplankton is directly related to temperature (Goldman & Carpenter 1974, Suzuki
& Takahashi 1995, Montagnes & Franklin 2001, Strom et al. 2001, Montagnes et al.
2003). Heterotrophic protist grazing rates were also significantly lowered in response
to a decrease in temperature by a factor of 3.3. The decrease was also expected, as
Page 44
34
microzooplankton grazing rates have been previously correlated to ambient seawater
temperatures in Narragansett Bay (Lawrence & Menden-Deuer 2012), as well as in the
Antarctic (Burkhill et al. 1995), the North Pacific (Strom et al. 2000), and the
Mediterranean (Modigh and Franzè 2009). The subsequent decrease in grazing rates
due to temperature has also been observed to decrease grazing rates to an exaggerated
degree at temperatures 0 C (Caron et al. 2000). Additionally, Rose et al. (2000)
completed dilution experiments over the course of three days until reliable
microzooplankton grazing rates were obtained because 24 h was too short to detect
grazing at low temperatures, but we did not have this issue. It is important to note,
however, that a large portion of the studies investigate rate responses using a
temperature increase.
Interestingly, on average, the decrease in the magnitude of the rates due to
temperature was specific to the metabolic process measured. An average 6.4°C
decrease in temperature lowered the grazing response of heterotrophic protists to a
greater degree relative to the growth response of phytoplankton (i.e. 3.3 > 1.9). The
observation supports increasing evidence that low temperatures constrain grazing rates
relative to phytoplankton growth rates. Investigation of this idea has already been
considered for cold environments; Rose & Caron (2007) proposed that low
temperatures (<5 °C) put a relatively larger constraint on microzooplankton growth
compared to phytoplankton growth, although the available data <5°C were limited for
that study. Additional work completed by Rose et al. (2009) suggested that
microzooplankton grazers are more sensitive to temperature-induced shifts compared
to phytoplankton. Our results show that similar findings also apply to temperate
Page 45
35
environments and have important implications regarding the trophic transfer of energy
by providing evidence that the trophic dynamics between microzooplankton predators
and their phytoplankton prey are largely controlled by temperature changes.
Percent primary production consumed differed by ~30% across temperature
treatments, but the difference was insignificant. If grazing was lowered significantly,
and to a greater degree than phytoplankton, then we would have expected to see a
significant difference in the percent of primary production consumed, but this was not
observed. This lack of significance is likely an expression of tight coupling between
predation and growth rates in microplankton. Microzooplankton growth rates can
equal or exceed phytoplankton growth, and so the increases in the growth rates of
phytoplankton should be quickly matched by microzooplankton (Banse 1992). Though
temperature altered the absolute rates, it did not significantly alter the rate of trophic
transfer from prey to predator, meaning that the grazers behaved similarly in both
treatments by removing relatively equal amounts of phytoplankton. The latter piece of
information is highly interesting, in that it provides evidence not only that the
heterotrophic protists were able to acclimate to their temperature-manipulated
environment, but that at higher temperatures, the microplankton system runs at a
higher rate output.
An unequal rate response of predators and prey in response to temperature
would have far reaching consequences for phytoplankton ecology. Based on short-
term, un-acclimated temperature manipulated experiments, we know that lowering the
temperature exaggerates the decrease in grazing rates compared to phytoplankton
growth rates, resulting in an increase in phytoplankton biomass. If the same
Page 46
36
mechanism applies to warming ocean temperatures, than we can expect
microherbivory rates to intensify and to be faster than temperature-induced shifts in
phytoplankton growth rates, which is a projection that has already been recognized
(López-Urrutia et al. 2006, Chen et al. 2012). The result would be a lower
phytoplankton biomass due to the increased metabolic activity of grazers (Keller
1999). Similar observations have already been made for higher trophic-level
interactions between predator and prey. For example, zooplankton abundances were
observed to decrease in the summer due to ctenophore predation (Oviatt 2004). If
projected onto future global temperature projections, which predicts increases between
1.8 and 5.8°C in the next 100 years (IPCC 2001), the change in grazing magnitude
would strongly impact future atmospheric CO2 levels, climate, and export to the deep
ocean. Coastal New England ecosystems have already been impacted (Nixon et al.
2004) due to an increase in surface oceanic temperature during the most recent
warming period (Levitus et al. 2000). When combined with current global respiration
and production values, phytoplankton are projected to consume four gigatons of C yr-1
less by the end of this century - equivalent to about one-third of our current worldwide
CO2 industrial emissions (López-Urrutia et al. 2006). Though it is easy to assume that
warmer temperatures might result in grazing rates that increase to a greater degree
relative to phytoplankton growth rates, resulting in a decrease in phytoplankton
biomass, we have not tested this and therefore cannot assume the effects of warming
on a natural assemblage. Sherr & Sherr (2009) point out that blooms occur all over the
world over a range of latitudes in which temperature varies and therefore other factors
aside from water temperature likely constrain phytoplankton bloom development.
Page 47
37
Temperature-Induced Shifts in Assemblage Structure
The autotrophic and heterotrophic protist assemblage structure at the end of the
incubations were identical for both temperatures, indicating that the species
composition, though not biomass, remained robust in response to an average 6.4°C
decrease in temperature. Analyzing the growth rates of those contributors which
accounted for assemblage structure differences can help to further investigate a natural
assemblage's sensitivity to temperature and to confirm that the assemblage structure
was not compromised by the temperature change. First, insignificant changes in the
species-specific growth rates of the top autotrophic (i.e. Chaetoceros sp., Skeletonema
sp., Cerataulina pelagica, and Eucampia zodiacus) and the heterotrophic protist taxa
(i.e. tintinnids, ebridian flagellates, and aloricate ciliates) suggest that these organisms
thrived within the range of temperatures in the incubators. Second, the average growth
rates of all of these groups were positive, which confirms the survival of all groups
across treatments. If consistent negative growth rates had been observed, that would
suggest that a temperature change amplified the struggle for survival, but this was not
observed.
It is important to recognize that some organisms are more sensitive to a
temperature change than others, and that this sensitivity can be reflected in subtle, yet
amplified, alteration in rates. For example, Chaetoceros sp. was the only
phytoplankton group that had its growth significantly altered by temperature.
Significant differences in growth would suggest that it is either more sensitive to cool
temperature (i.e. a direct result of the organism not growing as well in the cool water),
Page 48
38
more sensitive to general shifts in temperature (i.e. a direct result of the organism
experiencing a new environmental conditions), or grazed on preferentially in cold
treatments (i.e. an indirect result of increased grazing in the cooled treatment). The
latter is unlikely, as their siliceous spines support evidence that this species is
unappetizing to predators. Regarding increased sensitivity to a general shift in
temperature, we are limited by only growth in response to cool temperature, and thus
do not have ample data to appropriately answer the question. However, separating out
these effects requires additional experimentation with and without the presence of
grazers, an option that could be incorporated into future experiments had the lowest
dilution bottle been inspected. Tintinnids were the most sensitive to the temperature
treatment (i.e. highlighted as the main contributor responsible for the differences in the
heterotrophic protist assemblage across treatments) but was not the largest in biomass,
implying that tintinnids are more temperature-sensitive than other heterotrophic protist
taxa. There is likely a limit to the degree of cooling, which heterotrophic protists
and/or phytoplankton can withstand, but we found no evidence that the threshold-
temperature for the natural assemblages was reached. It is like that some species are
more sensitive to temperature than others, but additional experiments observing the
performance of phytoplankton and microzooplankton at a range of temperatures would
have to be conducted to further address the tolerance of the community to a larger
temperature differential.
Effect of Incubation on Biomass and Assemblage Structure
A common outcome of 24 h, nutrient-amended dilution experiments is a
Page 49
39
notable increase in the autotrophic biomass, which was observed in our experiment;
increases in the diatom assemblage under these conditions have been observed
previously (Landry et al, 1995, Juhl and Murrell, 2005, Modigh and Franzè 2009).
Increases in the biomass of several phytoplankton species included Eucampia
zodiacus, Skeletonema sp., Cerataulina pelatica, and Chaetoceros sp. The large
increases in these four species yielded high growth rates (i.e. 1.5 d-1) and explained
the significant shift in the autotrophic assemblage over the incubation period. Modigh
and Franzè (2009) minimized nutrient additions in order to avoid creating bloom
conditions that have the potential to significantly alter assemblage structure. However
evidence from previous dilution experiments indicate that summertime nutrient-
limitation exists and if left untreated, results in lower phytoplankton specific growth
rates (Lawrence & Menden-Deuer 2012). One major assumption of the dilution
method is that nutrients must be unlimited across all dilutions so that phytoplankton
growth is unlimited. In order to follow in accordance with the assumption and to limit
confounding variables, decreasing the amount of nutrients added was not an option for
our experiment.
The significant increase in heterotrophic protist biomass over the incubation
period has also been observed previously. Modigh & Franzè (2009) found significant
changes resulting in a more than 2-fold increase in biomass of the grazer populations,
as well as a significant shift in the composition of the heterotrophic protist assemblage
and significant changes in ciliate and heterotrophic dinoflagellate abundance over the
same length of incubation time. Other research has observed no change in
heterotrophic protist biomass (Paterson et al. 2007). Further, others have observed
Page 50
40
changes in grazer communities when comparing the initial and final assemblages,
especially across various dilution levels (Dolan et al. 2000). For example, tintinnid
ciliates have been show to vary apparent growth rates in proportion to available
nanoplanktonic prey, and do not grow well or change their lorica size at low dilutions
(Dolan et al. 2000). This suggests that the dilution series can create artifacts, which
can lead to a favored survival of different species across the dilution series or the over
or underestimation of grazing. When comparing heterotrophic protist growth rates in
the ambient and cooled treatment in our study, negative growth was not associated
with any one taxa or treatment. Although we do not have data from different dilutions,
we propose that our findings suggest that complex interactions unrelated to the level of
dilution, such as a lack of a prey item or the presence of a predator was a more likely
culprit attributed to these random mortality events of heterotrophic protists rather than
a treatment effect. In future experiments, investigating the protistan population at low
dilutions will ensure these artifacts do not occur. In summary, evidence exists that
grazer communities can be dynamic during dilution experiments, and should be
assessed in the future when measuring grazing magnitude, so as not to over or
underestimate grazing mortality.
Microzooplankton growth can be used as a relative measure of the efficiency
between predator and prey energy transfer, a point stressed by Verity et al. (1986,
1993), and applied to this study to further explain the biomass changes within the
heterotrophic protist community. Cooler temperatures constrained heterotrophic
protist growth to a greater degree than in the ambient treatment. As a result,
heterotrophic protist biomass increased significantly in the ambient treatment due to
Page 51
41
ample supply of prey. However, this increase was limited in the cooled treatment –
likely due to the decrease in the metabolic rates of heterotrophic protists in response to
cooler temperatures, as the environment was likely prey-saturated. Therefore, in both
treatments, grazer biomass increased in response to the fast-growing autotrophs, but
this increase in grazer population was curtailed in the cooled treatment, thereby
limiting the amount of primary production consumed.
One option to minimize the additional dynamics within grazer communities
that are introduced due to dilution experiment incubations may be to consider
acclimating the plankton assemblages. The dilution experiment and our experiment
assumed that the organisms phenotypically acclimate such that a plankton assemblage
is forced to survive in an altered environment. Previous research has shown that when
environmental conditions change, the most sensitive organisms become excluded and
the most resistant individuals become favored, thereby increasing community
tolerance but altering the natural assemblage structure (Fogg 2001). For this study,
seasonal changes in the in situ temperature over the four-month period altered the
autotrophic and heterotrophic protist assemblages significantly and to a much greater
degree than did a sudden decrease in temperature with the use of a short-term
incubation. The incubation period had an insignificant effect on the community
composition of the natural phytoplankton assemblage whereas incubation temperature
appeared to have a significant effect. Though both of these tests were significant, it
does imply that the assemblage structure may not be sensitive to changes in short-term
incubation experiments, as the p-value was near the significance cut-off. A incubation
period > 24 hr may reveal possible temperature treatment effects, but assumptions of
Page 52
42
the dilution method, including the assumption that ample nutrients exist to sustain
unlimited phytoplankton growth, could introduce artifacts. In addition, the results
provide evidence that temperature acclimation of the phytoplankton may not be
necessary when running 24 h dilution experiments. Our results indicate that
phytoplankton genera- and heterotrophic protist taxa-specific growth rates in the
cooled treatment were comparable to the ambient treatment. Had a catastrophic shock
been implemented via the treatments, a higher rate of mortality would have been
observed in the cooled treatment. The fact that the species that dominated in situ also
dominated within our dilution bottles containing 100% seawater, also supports the
argument which deems acclimation unnecessary.
Concluding Remarks
Quantitative observations for this study conclude that a 6.4°C temperature shift
within a short-term incubation period altered heterotrophic grazing rates to a greater
degree than autotrophic rates. Temporal changes, which were not solely characterized
by temperature, were the most significant driver of both autotrophic and heterotrophic
protist plankton assemblages. Overall, the findings confirm that temperature is a
significant modulator of metabolic rates and that it plays a larger role in mediating
protistan herbivory than summertime phytoplankton community composition. The
study highlights evidence of a differing sensitivity of photosynthetic and respiration
rates to temperature that could be applied to future models of microplankton food
webs to determine events in which microzooplankton grazing pressure is constrained
relative to phytoplankton growth within marine environments.
Page 53
43
APPENDICES
Appendix A. Autotrophic Biovolume Conversions Table A1. The top ten most abundant phytoplankton species observed in situ at the
long-term monitoring station are listed with the shape used to calculate the biovolume.
The average volume (± SD), compromised of length-width measurements for 50 -
100 cells imaged, and the total biomass observed in situ for every phytoplankton
species is listed. Relative percentage refers to the percentage of total in situ biomass
observed. The specific growth rate, , ( ± SD) is based on the change in biomass from
the initial to final ambient temperature treatment, which was calculated using the
exponential growth equation. These growth rate data are calculated from unreplicated
abundance counts that were converted to biomass estimates using the average volume
and carbon-equations.
Species Shape Average Volume Total Biomass
Relative Percentage of Biomass
Average Specific Growth Rate,
(m3) (C L-1) (%) (d-1)
Skeletonema sp. cylinder 175.55 ± 298.91 487 26 1.6 ± 1.0 Chaetoceros sp. cylinder 2510.58 ± 3676.56 531 28 1.5 ± 1.5 Ceratulina pelagica cylinder 2089.27 ± 4308.67 575 30 1.6 ± 0.9 Leptocylindrus sp. cylinder 398.09 ± 183.46 61 3 1.1 ± 1.3 Cylindrotheca closterium
prolate spheriod 205.33 ± 200.49 11 1 0.6 ± 2.4
Prorocentrum gracile
prolate spheriod 2005.65 ± 697.33 8 0 1.1 ± 1.6
Thalassionema nitzschoides
rectangular prism 122.90 ± 69.51 149 8 1.8 ± 2.1
Eucampia zodiaus cylinder 13957.02 ±
18794.05 36 2 1.3 ± 0.7 Thalassiosira sp. cylinder 7737.77 ± 2436.29 11 1 1.2 ± 1.5
Pseudo-nitzschia sp. prolate spheriod 846.01 ± 460.77 35 2 -0.1 ± 1.0
Page 54
44
Appendix B. Species-Specific Growth Rates of Individual Genera/Taxa
Table A2. Growth rates (d-1) of the top ten most abundant autotrophic organisms and
the heterotrophic protist taxa observed within a natural phytoplankton assemblage
after incubations at ambient (A & C) and cooled (B & D) temperatures from 8 June to
25 September 2012 in Narragansett Bay. Growth rates are calculated as (1/t)*(ln[Pt/P0
]), where t represents time and Pt and P0 represent final and initial biomass values. On
each date, – indicates that the species was not observed, T0 0 represents a growth rate
beyond detection limits due an initial abundance equal to zero, and Tf 0 represents a
growth rate beyond detection limits due to a final abundance equal to zero.
A.
Skel
eton
ema
sp.
Chae
toce
ros s
p.
Cera
taul
ina
pela
gica
Lept
ocyl
indr
us sp
.
Cylin
drot
heca
clo
sste
rium
Thal
assio
nem
a sp
.
Euca
mpi
a zo
diac
us
Thal
assio
sira
sp.
Pseu
do-n
itzsc
hia
sp.
Pror
ocen
trum
gra
cile
Am
bien
t
8 Jun 0.9 -0.1 0.3 -0.4 T0 0 - Tf 0 - Tf 0 - 18 Jun 1.0 0.4 1.6 0.2 T0 0 0.1 0.6 1.6 -1.1 - 25 Jun 1.4 2.4 Tf 0 1.3 - 1.8 0.1 0.3 2.5 - 9 Jul 1.6 2.1 - 1.4 - - - Tf 0 2.1 T0 0 16 Jul 1.4 0.7 - 1.6 1.1 Tf 0 T0 0 0.7 1.2 - 23 Jul 3.0 5.9 - 2.4 1.8 0.0 - Tf 0 1.9 - 30 Jul 2.0 T0 0 - 2.5 1.8 4.2 T0 0 1.5 - - 7 Aug 0.2 1.2 2.2 0.1 -4.6 -2.0 6.3 2.4 2.2 -
13 Aug 2.3 0.5 2.6 1.9 1.4 1.4 0.3 0.9 1.1 -1.3 17 Aug 2.0 2.3 2.2 2.1 2.3 1.1 2.1 1.9 Tf 0 0.3 28 Aug 1.6 0.8 0.6 1.2 1.6 0.9 2.1 1.3 2.6 0.6 4 Sep 1.3 1.5 T0 0 1.8 2.0 1.5 1.3 T0 0 -1.6 - 10 Sep 1.3 1.1 - -2.3 -2.3 T0 0 T0 0 T0 0 Tf 0 Tf 0 17 Sep 0.0 1.9 - - Tf 0 1.9 - Tf 0 - Tf 0 25 Sep 3.7 -0.1 - - T0 0 - T0 0 Tf 0 - - average 1.6 1.5 1.6 1.1 0.6 1.1 1.8 1.3 1.2 -0.1
stdev 1.0 1.5 0.9 1.3 2.4 1.6 2.1 0.7 1.5 1.0
Page 55
45
Cool
ed
8 Jun -0.1 Tf 0 0.4 0.8 - - 0.3 - 1.1 - 18 Jun 0.6 0.9 1.3 -0.6 T0 0 0.3 0.9 2.4 0.7 - 25 Jun 0.5 0.7 0.7 0.5 - 0.3 -0.1 Tf 0 1.3 - 9 Jul 1.4 1.0 - 0.3 - - - -0.4 1.2 T0 0 16 Jul 1.0 0.3 - 1.4 0.7 -0.4 T0 0 Tf 0 0.7 - 23 Jul 0.5 3.1 - 1.5 0.4 Tf 0 - Tf 0 0.7 - 30 Jul 1.8 T0 0 - 2.0 1.0 3.2 T0 0 0.4 - T0 0 7 Aug 0.9 1.7 -0.1 0.8 1.8 0.8 1.4 2.4 0.9 T0 0
13 Aug 0.6 1.1 2.3 0.7 1.0 1.1 -0.2 1.3 -0.8 0.2 17 Aug 1.5 2.0 1.0 1.5 1.9 0.6 0.7 2.3 Tf 0 1.1 28 Aug 1.0 0.1 0.1 0.5 0.8 0.7 0.2 1.7 1.4 0.2 4 Sep 0.8 -0.2 T0 0 1.0 0.9 0.5 0.0 T0 0 Tf 0 - 10 Sep 0.9 -1.1 - -1.9 0.9 - - T0 0 Tf 0 Tf 0 17 Sep 1.3 0.2 - - Tf 0 0.0 - -0.3 - Tf 0 25 Sep 3.7 -0.6 T0 0 - T0 0 T0 0 - -1.4 - - average 1.1 0.7 0.8 0.6 1.0 0.7 0.4 0.9 0.8 0.5 stdev 0.9 1.1 0.8 1.0 0.5 1.0 0.6 1.4 0.7 0.5
B. C.
Radi
olar
ia
Alo
ricat
e Ci
late
s
Din
ofla
gella
tes
Tint
inni
ds
Ebrid
ian
Flag
ella
tes
Am
bien
t
8 Jun - -0.3 1.9 T0 0 - 18 Jun - 1.6 0.6 T0 0 - 25 Jun - 1.9 0.5 - - 9 Jul - 1.3 0.4 T0 0 - 16 Jul 1.6 -0.4 0.0 1.4 - 23 Jul - 1.2 1.9 2.2 - 30 Jul 1.0 0.8 1.4 1.7 - 7 Aug Tf 0 0.4 0.1 0.3 T0 0
13 Aug 1.1 0.2 -1.1 0.3 -0.5 17 Aug 0.3 -0.1 -1.2 1.6 0.8 28 Aug - -0.7 -0.7 1.1 T0 0 4 Sep - -0.6 -0.5 0.7 -0.8 10 Sep - 0.5 0.3 0.3 0.5 17 Sep - 0.2 1.6 4.2 - 25 Sep - 0.4 1.5 -0.3 - average 1.0 0.4 0.4 1.2 0.0
stdev 0.5 0.8 1.1 1.2 0.8
Page 56
46
D. Appendix C. Assessing the 2 vs. 5-Point Dilution Method
Questions persist regarding the appropriate number of dilution levels needed to
confirm linearity in heterotrophic protist clearance rates across dilution levels
(Lawrence & Menden-Deuer 2012). Some scientists have substituted the
phytoplankton specific growth rate with the apparent growth rate from the lowest
dilution level to work around this caveat. Worden & Binder (2003) developed a 2-
point modification of the dilution method to increase the dilution method’s spatial and
temporal resolution while subsequently reducing the effort required to conduct a
dilution experiment. The approach has been shown to be a viable alternative (Strom &
Fredrickson 2008), but continues to be widely questioned. To address this question,
phytoplankton apparent growth rate values from the lowest dilution level (i.e. 10%
Radi
olar
ia
Alo
ricat
e Ci
late
s
Din
ofla
gella
tes
Tint
inni
ds
Ebrid
ian
Flag
ella
tes
Cool
ed
8 Jun - 0.6 1.1 - - 18 Jun - 0.9 0.3 - - 25 Jun - 1.1 0.2 - - 9 Jul - 0.6 0.2 - - 16 Jul 0.3 1.7 0.2 0.0 - 23 Jul - 1.5 2.9 1.3 - 30 Jul 0.6 0.4 1.0 1.1 - 7 Aug -2.3 -0.5 0.0 1.0 -
13 Aug 0.7 0.3 -0.4 -0.5 0.4 17 Aug -0.9 -0.6 -1.9 0.1 1.3 28 Aug - -0.9 - 2.0 - 4 Sep - -0.2 -0.4 0.9 -1.9 10 Sep - -0.1 -0.3 -0.7 Tf 0 17 Sep - -0.1 2.1 3.9 - 25 Sep - 0.4 0.7 -0.1 - average -0.3 0.3 0.4 0.8 -0.1
stdev 1.3 0.8 1.2 1.3 1.7
Page 57
47
whole seawater) were compared to nutrient-amended phytoplankton specific growth
rates using a paired t-test.
A major assumption of the dilution method is that microzooplankton clearance
rates are related to the number of predator-prey encounters (i.e. grazers will always
feed at a constant and maximal rate). A multi-level dilution method therefore has the
advantage of being able to identify non-linear feeding responses, which has been
previously observed in productive estuaries (Gallegos 1989, Lessard & Murrell 1998;
Worden & Binder 2003). Using a paired t-test, we compared phytoplankton growth
and grazing rate estimates based on the empirically determined 5-point dilution to a
hypothetical 2-point dilution (i.e. calculating growth and grazing rates based only on
the apparent growth rates from 10% and 100% whole seawater). Our results indicate
that there was no significant difference between the apparent growth rate (k) obtained
from the 10% whole seawater and the specific growth rate () obtained from our 5-
point regression for both the ambient (p = 0.13) and the cooled (p = 0.18) treatments.
We observed no difference in rates, irrespective of a 2 or 5-point dilution, over a range
of chlorophyll values (i.e. 6-fold variation) and throughout a study period in which the
autotrophic and heterotrophic assemblages changed significantly. Though previous
authors have suggested a 2-point dilution as providing possibly only a conservative
estimate (Lawrence & Menden-Deuer 2012) there was no support for this suggestion.
Therefore, we concluded that the rate measurements derived using the 2 and 5-point
modification is indistinguishable and confirmed prior research that made the same
observations (Strom & Fredrickson 2008; Worden & Binder 2003).
Page 58
48
Figure A1. Comparison of the average phytoplankton apparent growth rate from the
lowest dilution level (closed circles) to the average phytoplankton specific growth rate
(, d-1) (open circles) obtained from a set of fifteen ambient (A) and cooled (B) 24 h
dilution experiments from each 5-point regression from 8 June through 25 September
2012. Error bars represent the standard deviation from duplicate measurements. There
was no significant difference between rates of apparent growth and specific growth
despite a wide range (i.e. 6-fold) of chlorophyll a values.
Page 59
49
LITERATURE CITED
Banse, K. (1992) Grazing, temporal changes of phytoplankton concentrations, and the microbial loop in the open sea. In Falkowski, P.G. and Woodhead, A.D. (eds), Primary Productivity and Biogeochemical Cycles in the Sea. Plenum Press, New York, pp. 409-440.
Borkman, D. G., & Smayda, T. (2009) Multidecadal (1959–1997) changes in Skeletonema abundance and seasonal bloom patterns in Narragansett Bay, Rhode Island, USA. J Sea Res, 61:84–94.
Brown, J. H., Gillooly, J. F., Allen, A. P., Savage, V. M., & West, B. (2004) Toward a Metabolic Theory of Ecology. Ecology, 85:1771–1789.
Burkill, P. H., Edwards, E. S. & Sleigh, M.A. (1995) Microzooplankton and their role in controlling phytoplankton growth in the marginal ice zone of the Bellingshausen Sea. Deep-Sea Res Pt II, 42:1277–1290.
Caron, D.A. & Hutchins, D.A. (2012) The effects of changing climate on microzooplankton grazing and community structure: drivers, predictions and knowledge gaps. J Plankton Res, 0:1-18.
Caron, D. A., Dennett, M. R., Lonsdale, D. J., Moran, D. M., & Shalapyonok, L. (2000) Microzooplankton herbivory in the Ross Sea, Antarctica. Deep-Sea Res Pt II, 47:3249–3272.
Chen, B., Landry, M. R., Huang, B., & Liu, H. (2012) Does warming enhance the effect of microzooplankton grazing on marine phytoplankton in the ocean? Limnol Oceanogr, 57:519–526.
Deason, E. E., & Smayda, T.J. (1982) Ctenophore-zooplankton-phytoplankton interactions in Narragansett Bay, Rhode Island, USA, during 1972-1977. J Plankton Res, 4:203-217.
Dolan, J.R., Gallegos, C.L & Moigis, A. (2000) Dilution effects on microzooplankton in dilution grazing experiments. Mar Ecol Prog Ser, 200:127-139.
Dolan, J.R. & MeKeon, K. (2005) The reliability of grazing rate estimates from dilution experiments: Have we over-estimated rates of organic carbon consumption by microzooplankton? Ocean Sci 1:1-7.
Durbin, E. G., Krawiec, R. W. & Smayda, T.J. (1975) Seasonal studies on the relative importance of different size fractions of phytoplankton in Narragansett Bay (USA). Mar Biol, 32:271–287.
Eppley, R. W. (1972) Temperature and phytoplankton growth in the sea. Fish B-NOAA, 70:1063–1085.
Falkowski, P. G. (1998). Biogeochemical Controls and Feedbacks on Ocean Primary Production. Science, 281:200–206.
Field, C., Behrenfeld, M., Randerson, J., & Falkowski, P. (1998) Primary production of the biosphere: integrating terrestrial and oceanic components. Science, 281:237–40.
Fogg, G.E. 2001. Algal adaptation to stress – some general remarks. In Rai LC, Gaur JP, eds. Algal adaptation to environmental stresses. Physiological, biochemical and molecular mechanisms. Berlin, Germany: Springer, 1-20.
Gallegos, C.L. (1989) Microplankton grazing on phytoplankton in the Rhode River, Maryland: non-linear feeding kinetics. Mar Ecol Prog Ser, 57:23-33.
Page 60
50
Gillooly, J.F., Brown, J.H., West, G.B., Savage, V.M. & Charnov, E.L. (2001) Effects of Size and Temperature on Metabolic Rate. Science, 293:2248-2251.
Gillooly, J.F., Charnov, E.L., West, G.B., Savage, V.M & Brown, J.H. (2002) Effects of size and temperature on developmental time. Nature, 417:70-73.
Goldman JC (1984) Conceptual role for microaggregates in pelagic waters. B Mar Sci, 35:462-476.
Goldman, J.C & Carpenter, E.J. (1974) A kinetic approach to the effect of temperature in algal growth. Limnol Oceanogr, 19:756-766.
Graff, J. R., & Rynearson, T. A. (2011) Extraction method influences the recovery of phytoplankton pigments from natural assemblages. Limnol Oceanogr-Meth, 9:129–139.
Intergovernmental Panel on Climate Change (IPCC). (2011). Contribution of Working Group I to the Third Assessment Report of the Intergovernmental Panel on Climate Change. Climate Change 2001: The Scientific Basis, J. Houghton et al., eds. Cambridge University Press, Cambridge, UK, 1-88.
Juhl, A.R. & Murrell, M.C. (2005) Interactions between nutrients, phytoplankton growth, and microzooplankton grazing in a Gulf of Mexico estuary, Aquat Microb Ecol, 38:147-156.
Karentz, D. & Smayda, T.J. (1984) Temperature and seasonal occurrence patterns of 30 dominant phytoplankton species in Narragansett Bay over a 22-year period (1959-1980) Mar Ecol Prog Ser, 18:277-293.
Karentz D. & Smayda, T.J. (1998) Temporal patterns and variations in phytoplankton community organization and abundance in Narragansett Bay during 1959-1980. J Plankton Res, 20:145-168.
Keller, A. A., Oviatt, C. A., Walker, H. A., & Hawk, J. D. (1999) Predicted impacts of elevated temperature on the magnitude of the winter-spring phytoplankton bloom in temperate coastal waters: A mesocosm study. Limnol Oceanogr, 44:344–356.
Landry, M. Constantinou, R., J., & Kirshtein, J. (1995) Microzooplankton grazing in the central equatorial Pacific during February and August, 1992. Deep-Sea Res Pt II, 42:657–671.
Landry, M., & Calbet, A. (2004) Microzooplankton production in the oceans. ICES J Mar Sci, 61:501–507.
Landry, M.R., Constantinou, J. & Kirshtein, J. (1995) Microzooplankton grazing in the central equatorial Pacific during February and August, 1992. Deep-Sea Res Pt II, 42:657-671.
Landry, M. R., & Hassett, R. P. (1982) Estimating the grazing impact of marine micro-zooplankton. Mar Biol, 67:283–288.
Lawrence, C. & Menden-Deuer, S. (2012) Drivers of protistan grazing pressure: seasonal signals of plankton community composition and environmental conditions. Mar Ecol Prog Ser, 459:39-52.
Lessard, E.J. & Murrell, M.C. (1998) Microzooplankton herbivory and phytoplankton growth in the northwestern Sargasso Sea. Aquat Microb Ecol, 16:173-188.
Levitus, S. (2000). Warming of the World Ocean. Science, 287:2225–2229. Li, Q.P., Franks, P.J.S., & Landry M.R. (2011) Microzooplankton grazing dynamics:
parameterizing grazing models with dilution experiment data from the California Current Ecosystem. Mar Ecol Prog Ser, 438:59-69.
Page 61
51
López-Urrutia, A., San Martin, E., Harris, R. P., & Irigoien, X. (2006) Scaling the metabolic balance of the oceans. P Natl Acad Sci USA, 103:8739–44.
Martin, J.H. (1965) Phytoplankton-zooplankton relationships in Narragansett Bay. Limnol Oceanogr, 10:185-191. Menden-Deuer, S., & Lessard, E.J. (2000) Carbon to Volume Relationships for
Dinoflagellates, Diatoms, and other protist plankton. Limnol Oceanogr, 45:569–579.
Modigh, M. & Franzè, G. (2009) Changes in phytoplankton and microzooplankton populations during grazing experiments at a Mediterranean coastal site. J Plankton Res, 31:853–864.
Montagnes, D. J. S., Kimmance, S. A., & Atkinson, D. (2003) Using Q 10 : Can growth rates increase linearly with temperature? Aquat Microb Ecol, 32:307–313.
Montagnes, D. J. S., & Franklin, D. J. (2001) Effect of Temperature on diatom volume, growth rate, and carbon and nitrogen content: Reconsidering some paradigms. Limnol Oceanogr, 46:2008–2018.
Nixon, S., Granger, S., Buckley, B., Lamont, M., Rowell, B. (2004) A One Hundred and Seventeen Year Coastal Water Temperature Record from Woods Hole , Massachusetts. Estuaries, 27:397–404.
Oviatt, C. (2004) The Changing Ecology of Temperate Coastal Waters During a Warming Trend. Estuaries, 27:895–904.
Pratt, D.M., (1959) The phytoplankton of Narragansett Bay. Limnol Oceanogr, 4:425-440.
Rhee, G. & Gotham, I. (1981) The Effect of Environmental Factors on Phytoplankton Growth : Temperature and the Interactions of Temperature with Nutrient Limitation. Limnol Oceanogr, 26:635–648.
Riding, R. (1992). The algal breath of life. Palaeoclimatology, 359:13-14. Rose, J. M., & Caron, D. A. (2007) Does low temperature constrain the growth rates
of heterotrophic protists? Evidence and implications for algal blooms in cold waters. Limnol Oceanogr, 52:886–895.
Rose, J.M, Feng, Y. DiTullio, G.R., Dunbar, R.B., Hare, C.E., Lee, P.A., Lohan, M., Long, M. Smith Jr., W.O., Shost, B., Tozzi, S., Zhang, Y. & Hutchins, D.A. Synergistic effects of iron and temperature on Antarctic phytoplankton and microzooplankton assemblages. Biogeosciences, 6:3131-3147.
Schofield, O., Grzymski, J., Moline, M., & Mjovine, R. (1998) Impact of temperature acclimation on photosynthesis in the toxic red-tide dinoflagellate Alexandrium fundyense ( Ca28 ). J Plankton Res, 20:1241–1258.
Sherr, B. F. & Sherr E. B. (1994) Bacterivory and Herbivory: Key Roles of Phagotrophic Protists in Pelagic Food Webs. Microb Ecol, 28:223–235.
Sherr, E. B., Sherr, B. F., Wheeler, P.A. & Thompson K. (2003) Temporal and spatial variation in stocks of autotrophic and heterotrophic microbes in the upper water column of the central Arctic Ocean. Deep-Sea Res Pt 1, 50:557–571.
Sherr, E., & Sherr, B. (2009) Capacity of herbivorous protists to control initiation and development of mass phytoplankton blooms. Aquat Microb Ecol, 57:253–262.
Smayda, T. J. (1957) Phytoplankton studies in lower Narragansett Bay. Limnol Oceanogr, 2:342-359.
Page 62
52
Staehr, P.A. & Birkeland, M.J. (2006) Temperature acclimation of growth, photosynthesis and respiration in two mesophylic phytoplankton species. Phycologia, 45:648-656.
Staehr, P. & Sand-Jensen, K. (2006) Seasonal changes in temperature and nutrient control of photosynthesis, respiration and growth of natural phytoplankton communities. Freshwater Biol, 51:249–262.
Stoecker, D. K., & Capuzzo, J. M. (1990) Predation on Protozoa: its importance to zooplankton. J Plankton Res, 12:891-908.
Strom, S.L. & Fredrickson, K.A. (2008) Intense stratification leads to phytoplankton nutrient limitation and reduced microzooplankton grazing in the southeastern Bering Sea. Deep-Sea Res II, 55:1761-1774.
Strom, S. L., Macri, E. L. & Olson, M. B. (2007) Microzooplankton grazing in the coastal Gulf of Alaska: Variations in top-down control of phytoplankton. Limnol Oceanogr, 52:1480–1494.
Strom, S. L., M. A. Brainard, J. L. Holmes, & Olson M. B. (2001) Phytoplankton blooms are strongly impacted by microzooplankton grazing in coastal North Pacific waters. Mar Biol, 138:355–368.
Suikkanen, S., Pulina, S., Engström-Öst, J., Lehtiniemi, M., Lehtinen, S., & Brutemark, A. (2013) Climate Change and Eutrophication Induced Shifts in Northern
Summer Plankton Communities. PLoS ONE, 8:1–10. E66475. Doi:10.1371/journal.pone.0066475.
Suzuki, Y. & Takahashi, M. (1995) Growth responses of several diatom species isolated from various environments to temperature. J Phycol, 31:880-888.
Tsuda, A. & Kawaguchi, S. (1997) Microzooplankton grazing in the surface water of the Southern Ocean during an austral summer. Polar Biol, 18:240-245.
Weinbauer, M.G., Bonilla-Findji, O., Chan, A.M., Dolan, J.R., Short, S.M., imek, K. Wilhelm, S.W. & Suttle, C.A. (2011) Synechococcus growth in the ocean may depend on the lysis of heterotrophic bacteria. J Plankton Res, 33:1465-1476.
Worden, A.Z. & Binder, B.J. (2003) Application of dilution experiments for measuring growth and mortality rates among Prochlorococcus and Synechococcus populations in oligotrophic environments. Aquat Microb Ecol, 30:159-174.
Utermöhl, J. (1958) Zur Vervollkommnung der quantitativen Phytoplankton-Methodik. Mitt Int Ver Theor Angew Limnol, 9:1-38.
Verity, P.G. (1986) The relative food value of diatoms, dinoflagellates, flagellates, and cyanobacteria for tintinnid ciliates. Arch Protistenkd 131:71-84.
Verity, P.G., Stoecker, D.K., Sieracki, M.E., Burkhill, P.H., Edwards, E.S. & Tronzo C.R. (1993) Abundance, biomass, and distribution of heterotrophic dinoflagellates during the North Atlantic spring bloom. Deep-Sea Res II, 40: 227-244.
Vigil, P., Countway, P., Rose, J., Lonsdale, D., Gobler, C. & Caron, D. (2009) Rapid shifts in dominant taxa among microbial eukaryotes in estuarine ecosystems. Aquat Microb Ecol, 54:83–100.
Page 63
53
TABLES
Table 1. Monthly average in situ surface water temperatures from the long-term
monitoring station in Narragansett Bay for the past five years.
Month Average Temperature
(°C ± stdev)
June 18.8 ± 1.5 July 22.3 ± 1.6
August 22.5 ± 1.0 September 20.1 ± 1.1
Page 64
54
Table 2. In situ temperature, chl a, and biomass measurements as well as growth and
grazing rates and percent primary production (%PP) consumed in incubations at
ambient temperatures from June - September 2012 at the long-term time series station
in Narragansett Bay, R.I.
Date in situ temperature
in situ chl a
autotrophic biomass
heterotrophic biomass
growth rate,
grazing rate, g
%PP consumed
(°C) (g L-1) (g C L-1 ) (g C L-1 ) (d-1 ) (d-1 ) g:*100 8 Jun 17.48 6.65 574 1037 2.08 0.54 35
18 Jun 19.64 3.45 179 216 1.79 0.00 0
25 Jun 21.50 5.36 20 150 1.26 0.26 26
9 Jul 22.89 3.80 74 235 2.11 0.62 42
16 Jul 23.86 6.14 156 619 2.33 1.23 112
23 Jul 23.02 4.38 2 209 1.57 0.91 138
30 Jul 23.19 4.61 6 348 1.77 0.86 95
7 Aug 24.52 6.46 158 374 2.27 1.20 112
13 Aug 25.03 7.27 162 817 2.31 1.23 113
17 Aug 25.24 10.72 209 693 1.85 0.55 43
28 Aug 23.19 10.67 225 308 1.50 0.84 128
5 Sep 22.89 5.57 125 462 1.91 0.35 22
10 Sep 22.56 8.20 5 850 0.91 0.53 139
17 Sep 20.54 1.70 3 150 2.33 0.32 16
25 Sep 19.26 4.37 7 421 0.58 0.00 0
Page 65
55
Table 3. Comparison of phytoplankton apparent growth rates (k, d-1) from nutrient
amended (+) and un-amended (-) incubations. A significant nutrient enhancement
effect was observed for all but the last sampling date (italicized).
ambient cooled
Date k + nutrients k - nutrients k + nutrients k - nutrients
8 Jun 1.499 -0.022 1.252 -0.027
18 Jun 1.691 -0.602 0.016 0.128
25 Jun 1.021 -0.227 0.409 -0.124
9 Jul 1.571 -0.835 0.797 -0.569
16 Jul 1.224 -0.202 1.113 -0.503
23 Jul 0.745 -0.916 0.435 -0.404
30 Jul 1.008 -0.129 0.388 0.134
7 Aug 1.0802 -0.700 0.8688 -0.373
13 Aug 1.108 -0.454 0.685 -0.163
17 Aug 1.365 0.348 0.843 -0.140
28 Aug 0.645 -0.419 0.582 -0.222
5 Sep 1.59 0.367 0.993 0.460
10 Sep 0.465 -0.439 0.325 -0.047
17 Sep 2.04 1.130 1.8969 1.526
25 Sep 0.43 0.350 0.2592 0.176
Page 66
56
Table 4. The average temperature of the ambient and cooled treatment during each
incubation from June through September 2012. Averages represent temperature
recordings at 15-minute intervals throughout the incubation. Error represents one
standard deviation from the mean.
Date
Ambient (°C)
Cooled (°C)
Difference (°C)
8 Jun 12 20.3 ± 1.6 15.2 ± 0.6 5.1 ± 1.2
18 Jun 12 20.0 ± 1.3 15.2 ± 0.6 4.8 ± 1.0
25 Jun 12 21.1 ± 0.6 15.3 ± 0.6 5.7 ± 0.9
9 Jul 12 24.6 ± 1.9 17.5 ± 0.5 7.1 ± 1.6
16 Jul 12 25.2 ± 1.5 17.7 ± 0.9 7.5 ± 1.5
23 Jul 12 23.8 ± 1.3 17.5 ± 0.7 6.3 ± 1.1
30 Jul 12 23.6 ± 1.6 17.4 ± 0.5 6.2 ± 1.3
7 Aug 12 24.9 ± 1.5 17.5 ± 0.6 7.4 ± 1.1
13 Aug 12 25.2 ± 1.4 17.6 ± 0.9 7.6 ± 1.2
17 Aug 12 24.9 ± 1.6 17.3 ± 0.4 7.6 ± 1.4
28 Aug 12 24.2 ± 1.5 17.6 ± 0.9 6.6 ± 1.1
5 Sep 12 23.1 ± 0.2 15.6 ± 0.3 7.5 ± 0.2
10 Sep 12 22.5 ± 1.8 15.7 ± 0.9 6.8 ± 1.2
17 Sep 12 21.0 ± 1.1 15.6 ± 0.4 5.4 ± 0.9
25 Sep 12 20.2 ± 1.3 15.8 ± 0.6 4.4 ± 0.9
Page 67
57
FIGURE LEGENDS
Figure 1. Principal component analysis (PCA) characterizing salinity (S), sea-surface
temperature (SST), photosynthetically available radiation (PAR), and dissolved
oxygen (DO) variation from weekly samples taken between 8 June to 25 September
2012 in Narragansett Bay. The first and second axes of the PCA accounted for 44.4%
and 28.3% of the explained variation among sample dates, respectively. Temperature
was not a main driver of the seasonal variation observed.
Figure 2. Biomass estimates (g C L-1) of the weekly Narragansett Bay autotrophic
and heterotrophic protist assemblages from 8 June through 25 September 2012 in situ
(A, D) at the Long-Term Monitoring Station, and after a 24 h dilution experiment
incubated at ambient (B, E) and cooled (C, F) temperatures.
Figure 3. Non-metric multi-dimensional scaling (MDS) ordination of the three
significantly (p < 0.05) distinct autotrophic species assemblages, represented by the
biomass of the ten most abundant diatom species, observed weekly in situ from 8 June
to 25 September 2012 in Narragansett Bay. The discriminating species are indicated
for each assemblage (e.g. triangle: Thalassiosira sp.; circle: C. pelagica = Cerataulina
pelagica; cross: Chae & Skel = Chaetoceros sp. & Skeletonema sp.). CLUSTER’s
percent similarity overlay (similarity circles) indicates the degree similarity in
assemblage structure.
Figure 4. Initial chlorophyll a concentrations (grey bars) as well as ambient rates of
phytoplankton specific growth (closed circles) and heterotrophic protist grazing rates
(open circles) obtained from dilution experiments using a phytoplankton assemblage
from Narragansett Bay. Error bars represent the standard error from triplicate chl a
Page 68
58
measurements from duplicate bottles. Growth and grazing rates were similar in
magnitude and phytoplankton growth exceeded heterotrophic protist grazing for the
majority of the sample dates.
Figure 5. Rates of phytoplankton specific growth (A) and heterotrophic protist
grazing (B) from 8 June to 25 September 2012 that resulted after an incubation period
at ambient (closed circles) and cooled (open circles) temperatures. The error bars
represent the standard error from duplicate measurements. Note the change in y-axis
range. Ambient rates exceeded cooled rates for all instances when non-zero
measurements occurred. An on average 6.4°C decrease in temperature significantly
reduced rates of phytoplankton growth and heterotrophic protist grazing.
Figure 6. Linear regressions (solid lines) of cooled versus ambient rate data of
phytoplankton specific growth (black circles) and heterotrophic protist grazing rates
(grey triangles) from two temperatures across fifteen samples dates from 8 June
through 25 September 2012. Relationships are plotted alongside the one-to-one line
(dashed line). An on average 6.4°C decrease in temperature resulted in a decreased
heterotrophic protist grazing response that was greater in magnitude than the
corresponding decrease in the phytoplankton specific growth response.
Figure 7. Percent primary production (%PP) consumed by heterotrophic protists by
sample date (A) and in situ temperature of Narragansett Bay (B) from incubations at
two temperatures -ambient (closed symbols) and cooled (open symbols)- from 8 June
through 25 September 2012. In the top graph, the horizontal dashed line indicates
where phytoplankton growth is equal to heterotrophic protist grazing. Values of
Page 69
59
ambient %PP were on average 1/3 greater than cooled values, but the difference was
insignificant and unrelated to in situ temperatures.
Page 70
60
FIGURES
Fig. 1 DeCuollo & Menden-Deuer
Page 71
61
Fig. 2 DeCuollo & Menden-Deuer
Page 72
62
Fig. 3 DeCuollo & Menden-Deuer
Page 73
63
Fig. 4 DeCuollo & Menden-Deuer
Page 74
64
Fig. 5 DeCuollo & Menden-Deuer
Page 75
65
Fig. 6 DeCuollo & Menden-Deuer
Page 76
66
Fig. 7 DeCuollo & Menden-Deuer