Separation and Characterization of Petroleum Hydrocarbons and Surfactant in Oi:;imulsion Dispersion Samples Zhendi Wang and Merv Fingas Emergencies Science Division ETC, Environment Canada 3439 River Road, Ottawa, Ontario Canada, KIA OH3 ABSTRACT Orimulsion is an oil-in-water emulsion, into which a nonionic surfactant has been added in order to stabilize the emulsion. Many countries have shown great interest in this new bitumen-based fuel because of its competitive price, guaranteed long-term supply, and no need for major infrastructure changes for use in existing power stations. In view of the increasing importance of Orimulsion as an alternative fuel, it becomes necessary to have a better understanding of its physical properties, chemical composition, and toxicity to aquatic organisms. This paper reports detailed separation and characteriz.ation results of petroleum hydrocarbons and surfactant in Orimulsion dispersions. A membrane filtration method has been developed and applied for separation of oil particulates from surfactant-water phase of Orimulsion dispersion samples which were used for fish toxicity tests. The separated oil particulates were analysed using GC-MS and GC-FID. GC analysis results demonstrate that (1) the saturates in Orimulsion are dominantly composed of GC-unresolvable aliphatic hydrocarbons; (2) Orimulsion does not contain BTEX and lighter alkylbenzenes, and concentrations of alkylated PAHs are low, relative to most crudes; (3) the concentrations ofbiomarker compounds are significantly higher than most oils. The HPLC technique was used to identify and quantify the nonionic surfactant in the water phase. The surfactant was identified as polyethoxylated nonylphenol with oligomers having ethylene oxide (EO) number ranging from 8 to 24 (average BO = 20). The surfactant concentration in the source Orimulsion was estimated to be around 0.5%. INTRODUCTION Interest in new fuels is strong among many utility and industrial power operators as a result ofboth economics and shortage ofpetroleum. Orimulsion is one of these new fuels. Orimulsion is a trade name given to a new liquid fuel (an oil-in-water emulsion) produced in Venezuela, into which a nonionic surfactant is added in order to stabilize the emulsion and render its viscosity similar to heavy fuel oil (HFO). Many countries, particularly US, Canada and Great Britain, have shown great interest in this new bitumen-based fuel, because no major infrastructure changes are required (only some modifications to existing fuel transport, handling, and storage systems are required) to use this new fuel in existing HFO-fired power stations. Orimulsion is not classified by OPEC as a conventional crude oil and will therefore not be affected by Venezuela's OPEC production and export quota. Another attraction is that the producer of Orimulsion, Petroleos De Venezuela SA (PDVSA), offers long-term contracts of 15-20 . .
Transcript
Separation and Characterization of Petroleum Hydrocarbons and Surfactant in Oiimulsion Dispersion Samples
Zhendi Wang and Merv Fingas Emergencies Science Division
ETC Environment Canada 3439 River Road Ottawa Ontario
Canada KIA OH3
ABSTRACT
Orimulsion is an oil-in-water emulsion into which a nonionic surfactant has been added in order to stabilize the emulsion Many countries have shown great interest in this new bitumen-based fuel because of its competitive price guaranteed long-term supply and no need for major infrastructure changes for use in existing power stations In view ofthe increasing importance ofOrimulsion as an alternative fuel it becomes necessary to have a better understanding of its physical properties chemical composition and toxicity to aquatic organisms This paper reports detailed separation and characterization results of petroleum hydrocarbons and surfactant in Orimulsion dispersions A membrane filtration method has been developed and applied for separation of oil particulates from surfactant-water phase of Orimulsion dispersion samples which were used for fish toxicity tests The separated oil particulates were analysed using GC-MS and GC-FID GC analysis results demonstrate that (1) the saturates in Orimulsion are dominantly composed of GC-unresolvable aliphatic hydrocarbons (2) Orimulsion does not contain BTEX and lighter alkylbenzenes and concentrations ofalkylated P AHs are low relative to most crudes (3) the concentrations ofbiomarker compounds are significantly higher than most oils The HPLC technique was used to identify and quantify the nonionic surfactant in the water phase The surfactant was identified as polyethoxylated nonylphenol with oligomers having ethylene oxide (EO) number ranging from 8 to 24 (average BO = 20) The surfactant concentration in the source Orimulsion was estimated to be around 05
INTRODUCTION
Interest in new fuels is strong among many utility and industrial power operators as a result ofboth economics and shortage ofpetroleum Orimulsion is one ofthese new fuels Orimulsion is a trade name given to a new liquid fuel (an oil-in-water emulsion) produced in Venezuela into which a nonionic surfactant is added in order to stabilize the emulsion and render its viscosity similar to heavy fuel oil (HFO) Many countries particularly US Canada and Great Britain have shown great interest in this new bitumen-based fuel because no major infrastructure changes are required (only some modifications to existing fuel transport handling and storage systems are required) to use this new fuel in existing HFO-fired power stations Orimulsion is not classified by OPEC as a conventional crude oil and will therefore not be affected by Venezuelas OPEC production and export quota Another attraction is that the producer of Orimulsion Petroleos De Venezuela SA (PDVSA) offers long-term contracts of 15-20
years with the price of the product adjusted in line with any changes in the price levels ofsteam coal its main competitor in the fuel market
In September 1988 the New Btunswick Power Commission ofCanada launched Orimulsion into the commercial testing market by adapting one of its 100 MW units at Dalhousie to use the new fuel The New Brunswick Power Commission has signed a 20shyyear contract with PDVSA The first delivery ofOrimulsion took place in early 1994 Since 1988 several reports and reviews on physical properties experimental spills spill modelling and marketing strategies ofOrimulsion have been published [1-5] However no comprehensive study has been conducted and reported on the quantitative chemical composition ofOrimulsion and on separation and analysis ofpetroleum hydrocarbons and surfactant(s) of Orimulsion In view of the importance of Orimulsion as an alternative fuel detailed re-evaluation of physical and chemical properties of Orimulsion characterization ofpetroleum hydrocarbons and surfactant(s) in Orimulsion dispersions and toxicity study ofOrimulsion is definitely needed
In this paper we report results of separation and characterization ofpetroleum hydrocarbons and surfactant in Orimulsion dispersions which were used for fish toxicity tests A membrane filtration method has been developed and applied for separation of Orimulsion oil particulate from the surfactant-water phase of Orimulsion dispersion samples The separated Orimulsion oil particulates were then re-dissolved and analysed using gas chromatography-mass spectrometry (GC-MS) and capillary GC equipped with flame ionization detector (GC-FID) for determination oftotal petroleum hydrocarbons (TPH) n-alkane distribution polycyclic aromatic hydrocarbons (PAHs) and their alkylated homologues and biomarker terpanes and steranes High performance liquid chromatography (HPLC) was used to identify and quantify the nonionic surfactant in the water phase
EXPERIMENTAL
Orimulsion dispersion samples used for fish tests The Orimulsion dispersions used for fish tests were received from Aquatic
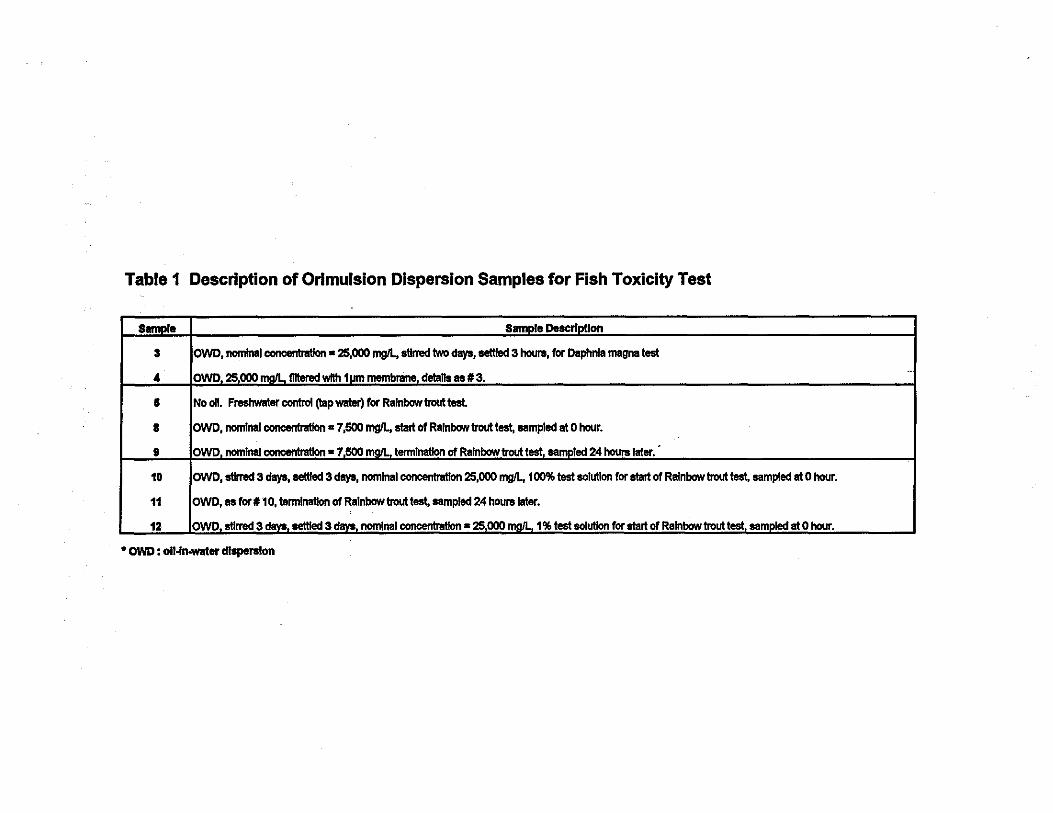
Toxicology Section Environmental Quality Laboratory Environment Canada Atlantic Region The detailed description ofthe Orimulsion dispersion samples is presented in Table l ln brief oil-in-water dispersions (OWD) were prepared by adding Orimulsion to water in various ratios to obtain dispersions with desired concentrations for example 25000 and 7500 mgfL The dispersions were then stirred and settled before adding the fish The dispersion samples were removed from mid-depth in the water column by means ofa clean siphori All were stored in clean 1-L glass jars The jars were filled with no air space tightly capped and stored at 4 degC until shipping The samples were stored in a cold room at 4 degC for analysis after they were received
The aquatic toxicity results have been reported elsewhere [ 5]
Surfactants and oils Surfactants and crude oils were obtained from various sources and stored in a
Membrane filtration A membrane filtration method was developed and used for separation of
Table 1 Description of Orimulslon Dispersion Samples for Fish Toxicity Test
s sie Descrlnllon
3
4
OWD nominal cot 1ceuliatlon bull 25000 mglL stirred two days seltled 3 hours for Daphnla magna test -shy
OWD 25000 mnll mtered with 1um membrane details asll 3
bull 8
9
No oil FreshWater control (lap water) for Rainbow trout test
OWD nominal cotitei ibatloi1 bull 7500 mglL start of Rainbow trout test eampled at Ohour
OWD nominal cot1te111iation bull 7 500 ~bull termination of Rainbow trout test eamDled 24 hours later
10
11
12
OWD stirred 3 days seltled 3 days nomlnal concentration 25000 mgL 100 test solution for start of Rainbow trout test sampled at 0 hour
OWD as for ti 10 termination of Rainbow trout test eampled 24 hours later
OWD stirred 3 seltled 3 nominal conce111iation bull 25000 ~bull 1test solution for start of Rainbow trout test samoled at Ohour
bull OWD oll~n-er dispersion
Orimulsion oil particulates from the surfactant-water phase The detailed membrane filtration procedures are described as follows
-the jars were vigorously shlucen for 5 minutes before sampling because Orimulsion tends to settle in fresh water
-100 mL ofthe well-shaken samples was immediately transferred from the midshydepth ofthe bottle to a pre-prepared filter funnel by means of a clean disposable pipet For 4 (1-microm pre-filtered) and 12 (1 test solution) 200 mL of samples were transferred and filtered For 5 (freshwater control) a liquid-liquid extraction technique was applied to extract any possible hydrocarbons from 1-L ofthe sample
-samples were filtered by vacuum through the Supelco (Bellefonte PA) Nylon 66 045 microm membrane by which the Orimulsion oil particulates were separated from the surfactant-water phase and were trapped on the membrane The clean and colourless filtered surfactant-water solution was used for surfactant analysis by HPLC
-the Orimulsion oil particulates were completely transferred to a beaker by dichloromethane (DCM) and the Orimulsion oil solutions in DCM were then dried by passage through anhydrous sodium sulphate
-the dried Orimulsion oil solutions were concentrated by rotary evaporation and solvent-exchanged to hexane phase and were then made up to an appropriate volume
-aliquots ofthe concentrated Orimulsion oil hexane solutions were blown down with nitrogen to residues and weighed on a microbalance to obtain total solventshyextractable materials (fSEM)
Column chromatographic fractionation ofOrimulsion extracts The microcolumn fractionation technique was employed for sample cleanup and
fractionation of the concentrated Orimulsion extracts [6-8] Appropriate aliquots of extracts (containing TSEM- 20 mg) were applied to the 3-gram silica gel column which had been preconditioned with 12 mL of hexane Half of the hexane fraction (Fl) was used for analysis of saturates and biomarker compounds half of the 50 benzene fraction (F2) was used for analysis oftarget P AHs and alkylated P AH homologues The remaining halfofFl and F2 was combined (F3) and used for the determination oftotal hydrocarbons (fPH) These three fractions were concentrated under a stream ofnitrogen
~-to appropriate volumes spiked with internal standards and then adjusted to accurate pre-injection volumes for GC analysis
Capillary gas chromatography (GC) and gas chromatography-mass spectrometry (GCMS)
Analyses for n-alkane distribution and total petroleum hydrocarbons (fPH) were performed on a Hewlett-Packard (HP) 5890 gas chromatograph equipped with a flameshyionization detector (FID) and an HP 7673 autosampler A 30-m x 032-mm id (025-microm film) DB-5 fused silica capillary column (JampW Folsom CA USA) was used The carrier gas was helium (25 mLmin) The injector and detector temperatures were set at 290 degc and 300 degC respectively The following temperature program was used 2-min hold at 50 degc ramp to 300 degc at 6 degCmin and 16-minhold at 300degc A 1-microL aliquot was injected in the splitless mode with a 1-min purge-off
Analyses of target polycyclic aromatic hydrocarbons (PAHs) and biomarker compounds were performed on an HP Model 5890 GC equipped with a Model HP 5972 mass selective detector (MSD) System control and data acquisition were achieved with
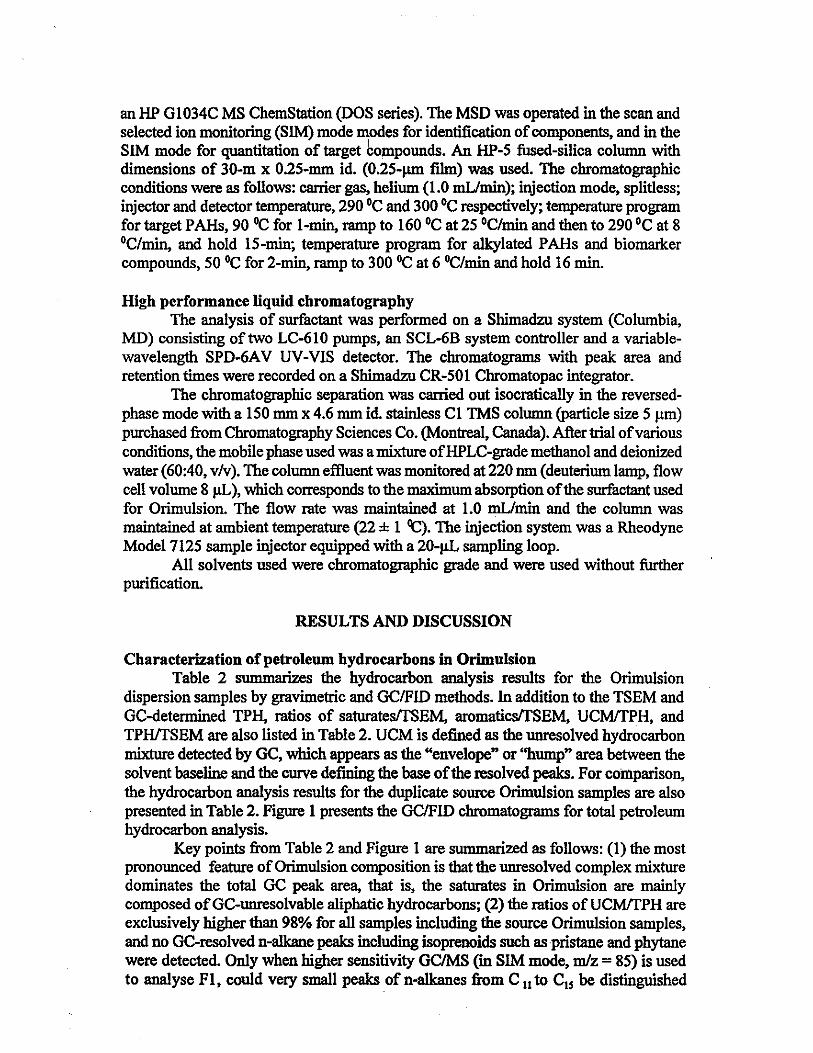
an HP Q 1034C MS ChemStation (DOS series) The MSD was operated in the scan and selected ion monitoring (SIM) mode modes for identification ofcomponents and in the SIM mode for quantitation of target lompounds An HP-S fused-silica column with dimensions of 30-m x 02S-mm id (02S-microm film) was used The chromatographic conditions were as follows carrier gas helium (10 mUmin) injection mode splitless injector and detector temperature 290 degc and 300 degc respectively temperature program for target P AHs 90 degC for 1-min ramp to 160 degc at 2S degCmin and then to 290 degc at 8 degCmin and hold IS-min temperature program for alkylated PAHs and biomarker compounds SO 0c for 2-min ramp to 300 degc at 6 degctmin and hold 16 min
High performance liquid chromatography The analysis of surfactant was performed on a Shimadzu system (Columbia
MD) consisting of two LC-610 pumps an SCL-6B system controller and a variableshywavelength SPD-6AV UV-VIS detector The chromatograms with peak area and retention times were recorded on a Shimadzu CR-SOl Chromatopac integrator
The chromatographic separation was carried out isocratically in the reversedshyphase mode with a lSO mm x 46 mm id stainless Cl TMS column (particle size S microm) purchased from Chromatography Sciences Co (Montreal Canada) After trial ofvarious conditions the mobile phase used was a mixture ofHPLC-grade methanol and deionized water (6040 vv) The column effluent was monitored at 220 nm (deuterium lamp flow cell volume 8 microL) which corresponds to the maximum absorption ofthe surfactant used for Orimulsion The flow rate was maintained at 10 mUmin and the column was maintained at ambient temperature (22 plusmn 1 degC) The injection system was a Rheodyne Model 712S sample injector equipped with a 20-microL sampling loop
All solvents used were chromatographic grade and were used without further purification
RESULTS AND DISCUSSION
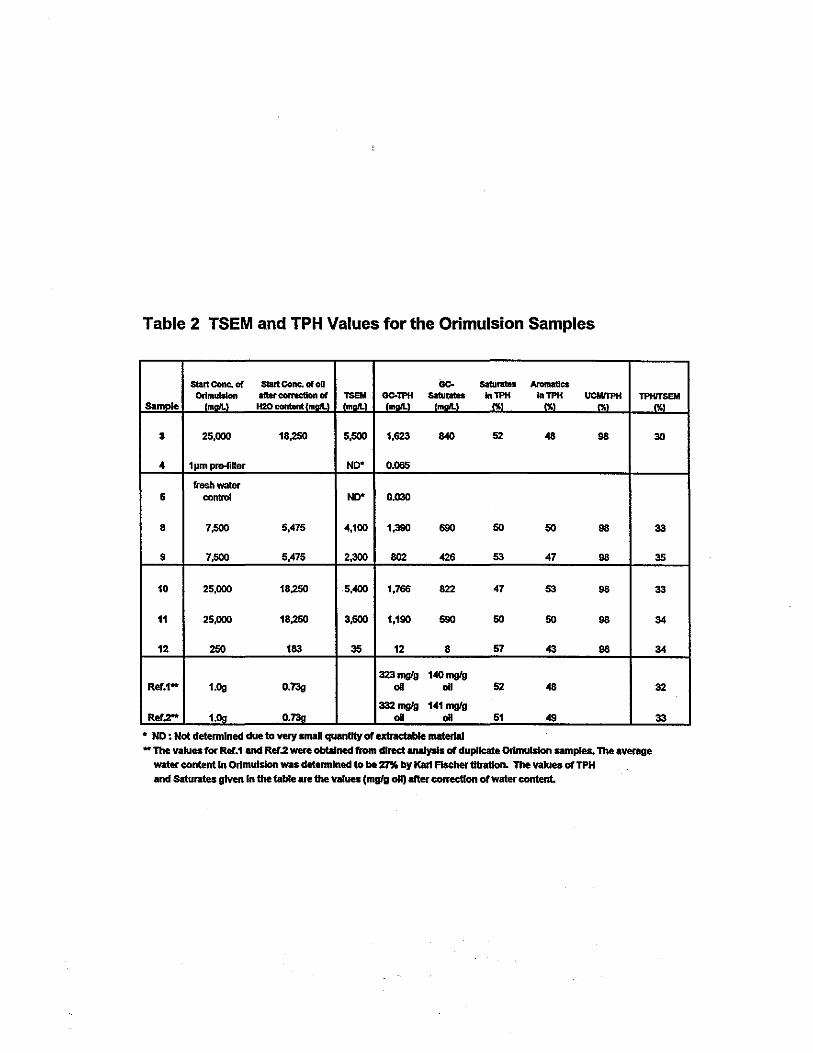
Characterization ofpetroleum hydrocarbons in Orimulsion Table 2 summarizes the hydrocarbon analysis results for the Orimulsion
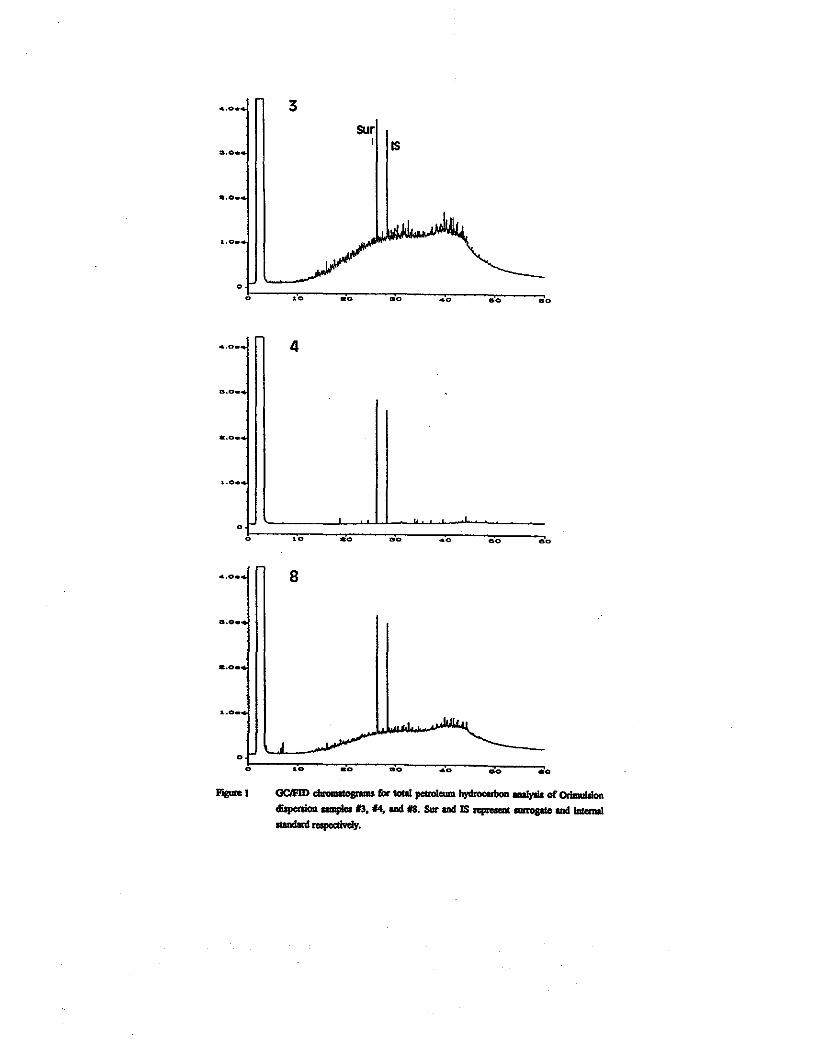
dispersion samples by gravimetric and GCFID methods In addition to the TSEM and QC-determined TPH ratios of saturatesTSEM aromaticsTSEM UCMTPH and TPHTSEM are also listed in Table 2 UCM is defined as the unresolved hydrocarbon mixture detected by QC which appears as the envelope or hump area between the solvent baseline and the curve defining the base ofthe resolved peaks For comparison the hydrocarbon analysis results for the duplicate source Orimulsion samples are also presented in Table 2 Figure 1 presents the GCFID chromatograms for total petroleum hydrocarbon analysis
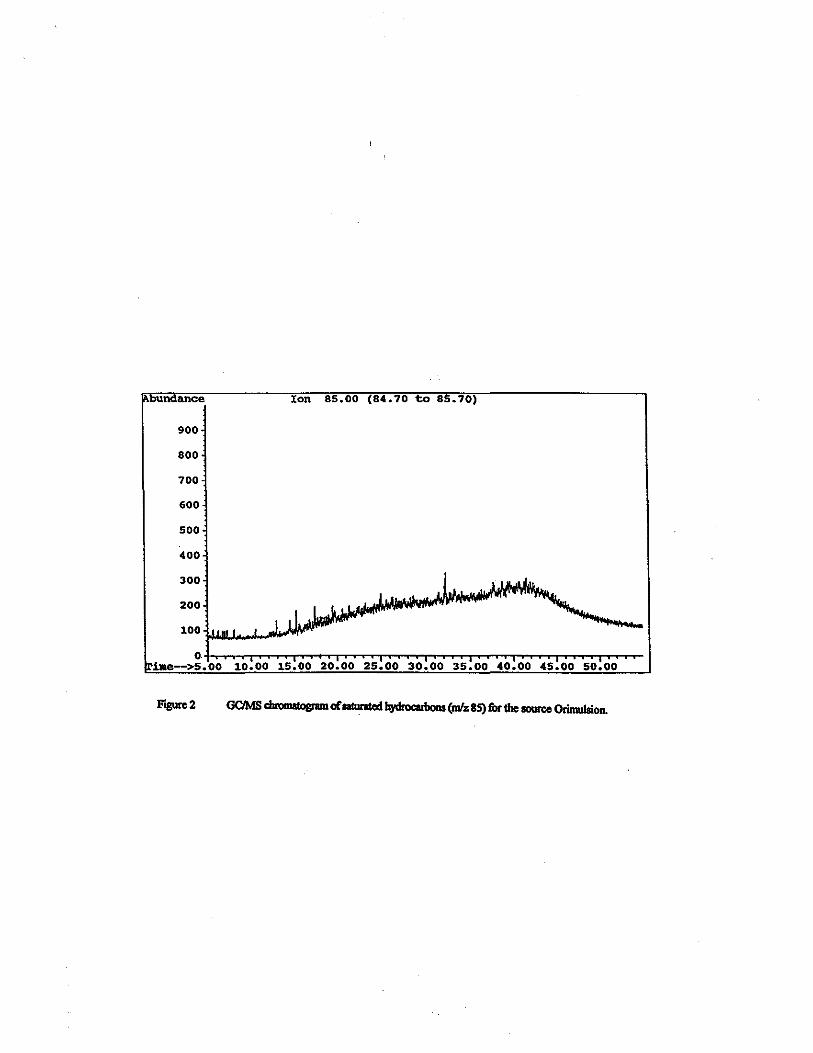
Key points from Table 2 and Figure 1 are summarized as follows (1) the most pronounced feature ofOrimulsion composition is that the unresolved complex mixture dominates the total QC peak area that is the saturates in Orimulsion are mainly composed ofQC-unresolvable aliphatic hydrocarbons (2) the ratios of UCMTPH are exclusively higher than 98 for all samples including the source Orimulsion samples and no Ge-resolved n-alkane peaks including isoprenoids such as pristane and phytane were detected Only when higher sensitivity GCMS (m SIM mode mz = 8S) is used to analyse Fl could very small peaks of n-alkanes from C 11 to C15 be distinguished
Table 2 TSEM and TPH Values for the Orimulsion Samples
SamDle
start Cone Of Ortmulslon
fm
startCone of oU after correction of
H2Q content fmll I
TSEM fm
OC-lPH Geshy middot--middotmiddot lPH-middot
lnlPH-middot UCMTJH-middot TPHITSEM _
3
4
25000
1microm prefilter
18250 5500
ND
1623
0065
MO 52 48 98 30
freshwater 6 control ND 0030
8 7500 5475 4100 1390 690 50 50 98 33
9 7500 5475 2300 802 426 53 47 98 35
10 25000 18250 s400 1766 822 47 53 98 33
11 25000 18250 3500 1190 690 50 50 98 34
12 250 183 35 12 8 57 43 98 34
323mgg 140mgg Ref1shy 10g 073g oil oil 52 48 32
332mgg 141 mgg Ref2 1 07n oil oil 51 49 33
bull ND Not determined due to YeJY small quantity of exlnlctable material
-The values for Ref1 and Ref2 were obtained from direct analysis of duplicate Orlmulslon samples The average water content In Orlmulslon was determined to be 27 by Karl Fischer titration The values of TPH and Saturates given In the table are the values (mggall) after correction orwater content
bullbull bull bull 0
bullo
tobull
3 sur
I IS
bullo
10
0
0 bullo bullo ao bullo 00 00
bullo 4
oo
bullmiddotObullbull
10
0
bullo
0 bullO
8
bullo ao bullo oo 00
oo
eo
10
0 bullbull bullbull ao bullbull Figurel GCllDgt _ flaquo -i petroleum bydrocllboa lllllylil or Orimublon
dispenioA ampla 13 14 ad 8 Sur ad IS __ ad iotoma1
- respoctlwl
(Figure 2) The whole chromatographic profiles of Orimulsion look like that of extremely highly weathered and de_graded crudes (3) the TPHs (saturates plus aromatics) are only 30-35 of the total weight of TSEM indicating relatively high portion (-70) of resins and asphaltenes in Orimulsion This result is understandable because one significant feature ofBitumen-type oil is the high percentage ofresin and asphaltenes in the oil (4) the aromatics are approximately 50 of the TPH for all samples far higher than the values of aromatics for light and medium crudes
Compared to sample 8 (its starting nominal concentration is 7500 mgL measured TSEM = 4100 mgL) the TSEM values determined for samples 3 10 and 11 (their starting nominal concentrations are 25000 mgL TSEM values are 5500 5400 and 3500 mgL respectively) are much lower than expected Repeated analyses give roughly the same results The most possible reason for this may be that the samples were not uniform before sampling due to 3 hours settling time for 3 and 3 days settling time for 10 and 11 respectively (see Table l for sample description) Some concentration gradient would be expected because Orimulsion tends to settle in water
Sample 4 showed a extremely low value ofTPH demonstrating that the l microm membrane can effectively remove almost l 00 ofOrimulsion oil particulates from the surfactant-water phase
At the point of termination of the Rainbow trout test (24 hour duration) the concentrations ofTPH for 9 and 11 were determined to be 802 mgLand 1190 mgL 42 and 33 lower than the TPH concentrations for the corresponding starting samples 8 and 10 respectively That means that the test fish was killed due to consumption absorption and adsorption ofOrimulsion (possibly by both petroleum hydrocarbons and surfactant) during the toxicity test As the toxicity study concluded a spill of Orimulsion will result in a higher exposure to oil and therefore a higher risk to aquatic organisms than would a spill ofheavy fuel oil [5]
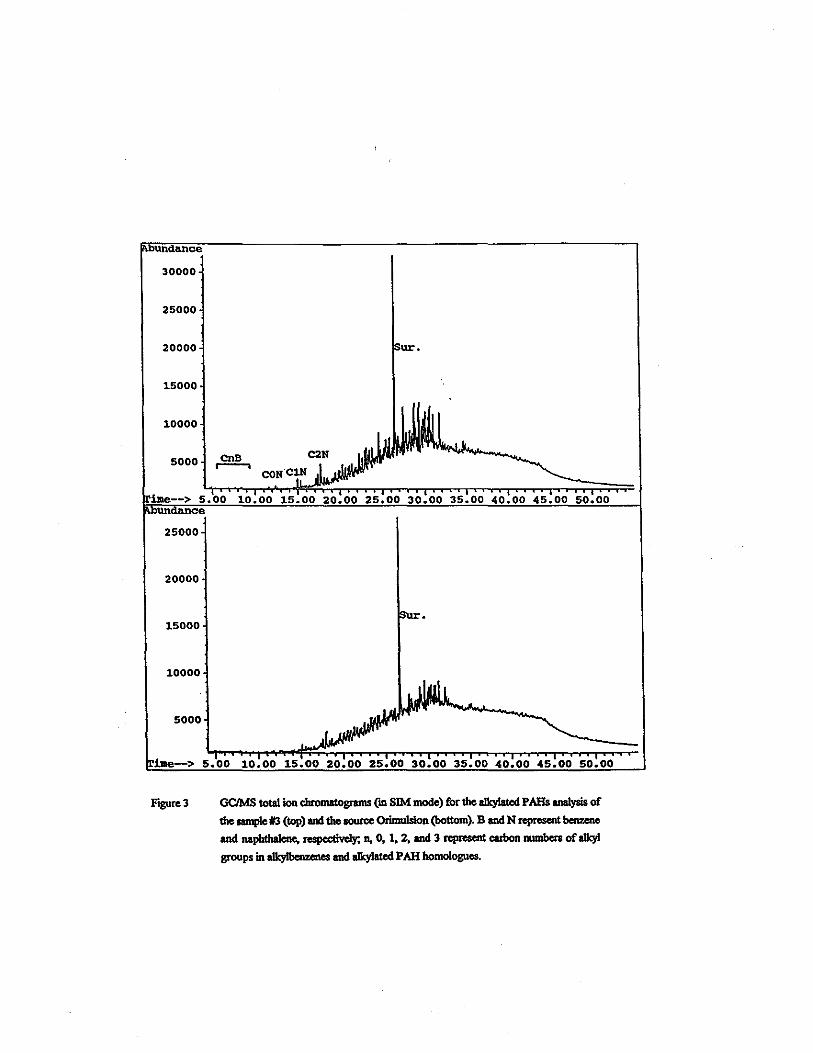
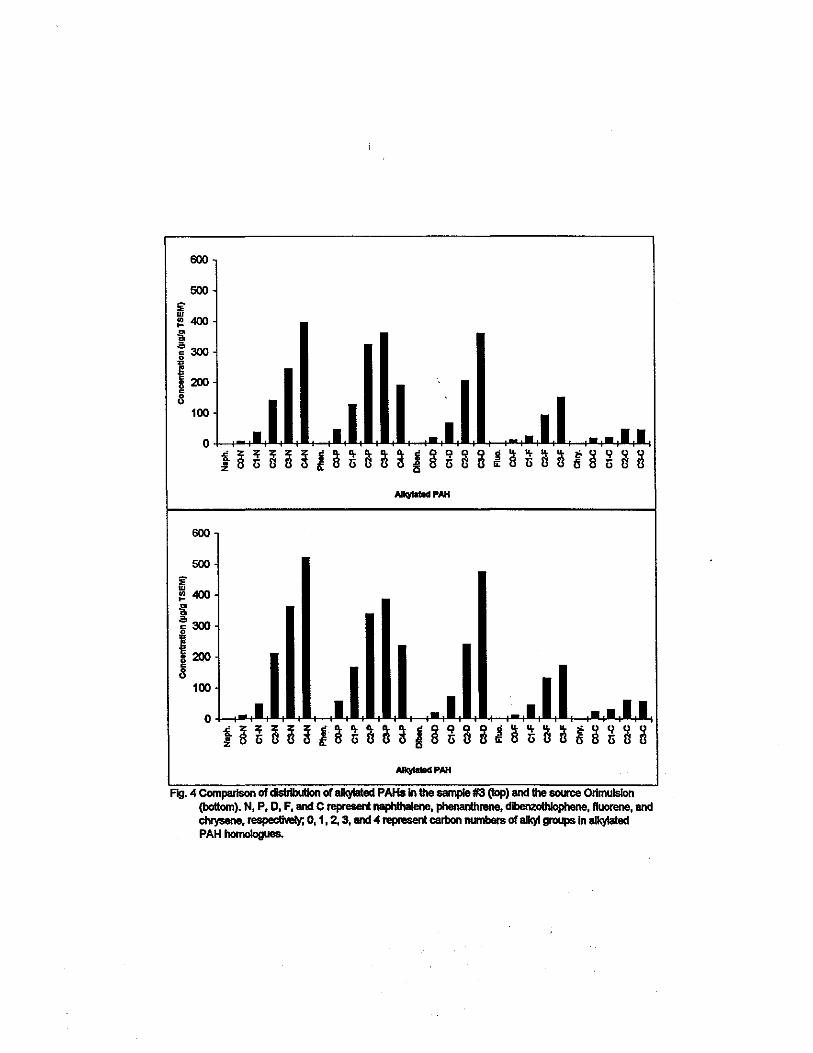
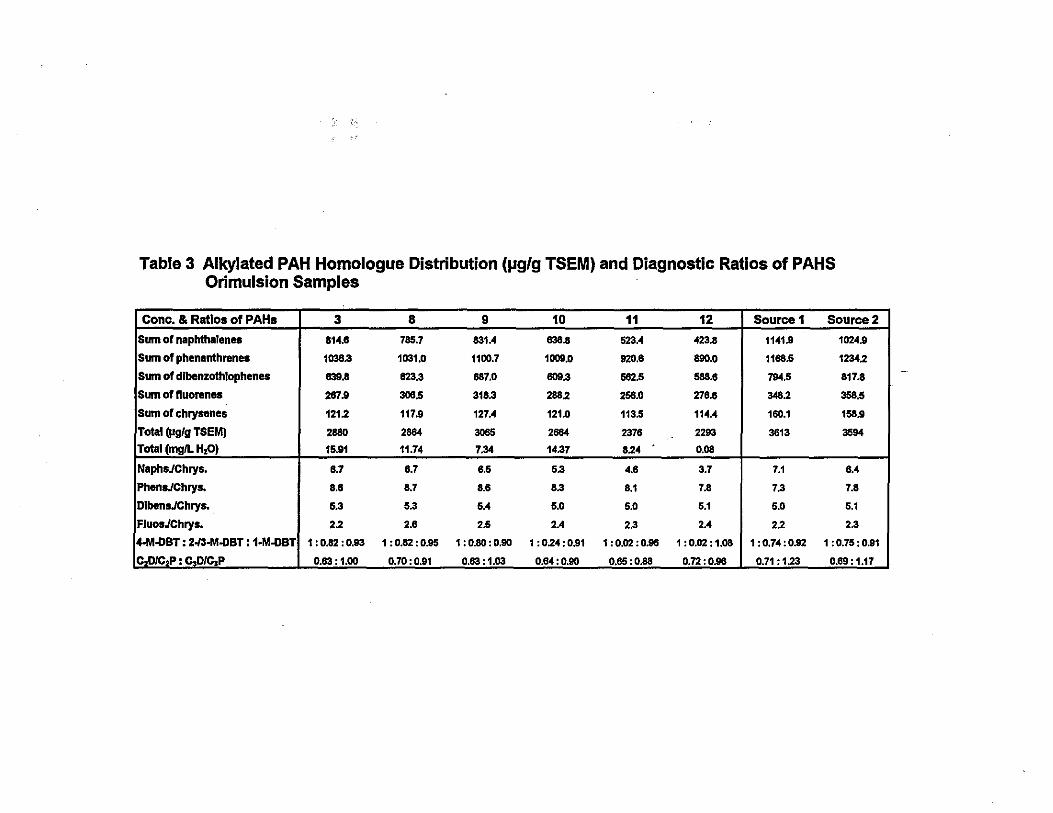
Figure 3 shows the GCMS total ion chromatograms in the SIM mode for the alkylated P AHs Table 3 summarizes analysis results of the 5 target alkylated P AH series and diagnostic ratios ofthe source-specific-marker P AH compounds [9] As an example Figure 4 depicts graphically the distribution ofalkylated P AHs for the source oil and sample 3 Note that the total P AHs in Table 3 are expressed in both microgig TSEM and mgL of H20 TSEM gives a reasonably equal basis for the determination of the relative composition changes ofhydrocarbons in Orimulsion samples It is only by this way that the quantitation results are comparable
The sum of the 5 target alkylated PAHs was determined to be in the range of 2300-2900 microgig ofTSEM Major alkyl PAH composition characteristics are outlined as follows (1) compared to most crude oils the concentrations of the total of 5 target alkylated PAHs in Orimulsion are low (2) Orimulsion does not contain BTEX (the collective name ofbenzene toluene ethylbenzene and the xylene isomers) and lighter alkylbenzene compounds evidenced by the fact that no alkylbenzene peaks were detected before the retention time of 15 minutes (3) the distribution pattern with the alkyl naphthalene and phenanthrene series being the most abundant among the 5 target alkylated P AH series is observed for the source oil However for the fish test oil-inshywater dispersion samples the loss of alkyl naphthalene series relative to the alkyl phenanthrene series is obvious mainly due to the higher solubility ofnaphthalenes in water (4) different from most oils the distribution abundances ofltltC1ltCiltC in each alkyl P AH group except for the alkyl chzysene series is very pronounced (for most oils
Fig 4 Comparison of distribution of alkyfated PAiis In the ampample 3 (lop) and the source Otlmulslon bottom) N P D F and C represent naphlhalene phenanthrene dibenzolhlophene ftuorene and chrysene respectiYely 0 1 2 3 llld 4 represent carbon numbers of alkyl groups In alkylated PAH homologues
this kind ofdistribution patterns is seen only when they have been highly weathered) After the 24 hour Rainbow trout toxicity test the concentrations of the target
PAH homologues were determined to be 734 mgL for 9 and 824 mgL for 11 respectively Compared to the concentrations of the target PAHs in the corresponding start dispersion samples (11 74 mgL for 8 and 1437 mgL for10) approximately 13 of the target PAHs were reduced which is in good agreement with the TPH analysis results Other compositional changes ofP AHs are summarized as follows (1) in general the alkyl dibenzothiophene and fluorene series did not show changes in their ratios to the alkyl chrysenes compared to the source oil However decrease in ratios of the alkyl naphthalene series to the alkyl chrysenes is noticed This trend is especially obvious for the paired samples 11 and 12 (the ratios of the alkyl naphthalenes to the alkyl chrysenes were determined to be 52 and 46 respectively) indicating that in addition of being more soluble in water the alkyl naphthalenes may preferentially be absorbed andor adsorbed by the test fish (2) compared to the source Orimulsion (1075092) the changes ofthe isomeric distribution of4- 2-3- and 1-methyldibenzothiophene for samples 10 (1024096) 11 (1002108) and 12 (1002108) are pronounced This may be mainly because of preferential biodegradation of 2-3shymethyldibenzothiophene resulting in decrease of the ratio relative to 4shymethyldibenzothiophene [9]
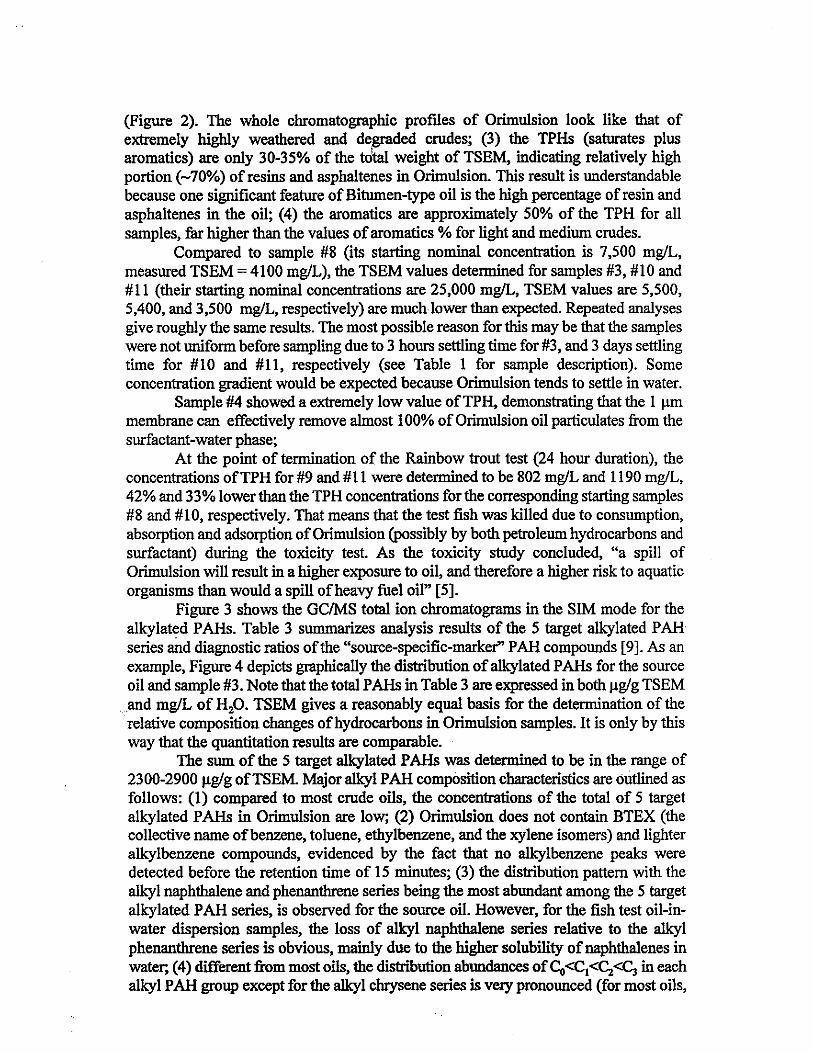
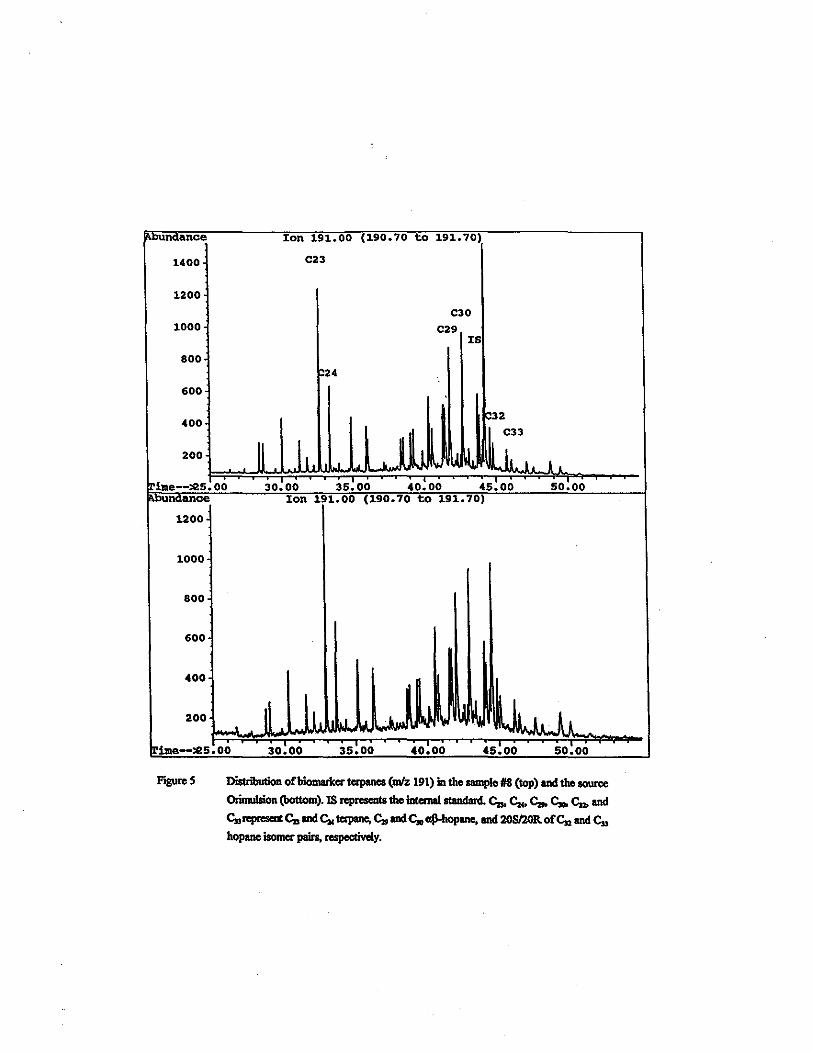
Compared to most oils significantly higher amounts ofbiomarker compounds were detected in the source and the toxicity test Orimulsion samples For example the concentrations of~-terpane and lt-hopane were determined to be in the range of230shy244 and 210-222 microgig ofTSEM Figure 5 shows distribution profiles ofbiomarker terpanes at mlz 191 for the source oil and sample 8 The terpane distribution reflects the petroleum inputs Figure 5 is characterized by the terpane distribution in a wide range from C20 to Cis with ~ to lt tricyclic terpanes and lt to ~ o~-pentacyclic hopanes being the most prominent The GCMS measurements demonstrate that the profiles and patterns ofthe mz 191and217 (the steranes are mainly dominated by C27
C28 and lt 20R20S sterane compounds) ion chromatograms of the samples are identical to each other and to the source oil In addition the biomarker compounds of the Orimulsion samples did not show any noticeable changes in their absolute concentrations in comparison to the source oil and the ratios of five pairs of target terpanes ~Cu cJc TsTm c2 20S20R and CJ3 20S20R are almost same for all samples as well indicating the composition of biomarkers is virtually unaltered No biomarker compounds were detected for the fresh water control 5 and only extremely low concentrations ofbiomarkers were detected for sample 4 (the concentrations ofthe most abundant~ andlt were determined to be less than 5 microgL ofwater) which was pre-filtered using 1 microm membrane further confirming that the petroleum particulates in Orimulsion can be effectively separated using membrane filtration technique
Identification of surfactant in Orimulsion Orimulsion is simply a trade name in which bitumen content is entirely derived
from Venezuelas Orinoco region and to which the addition of water (as described above the water content was determined to be 27) and a surfactant turns its consistency into an emulsion with a viscosity resembling heavy fuel oil Theoretically speaking there are two different types ofemulsions oil-in-water emulsions where the very fine oil-in-water droplets disperse in water phase water-in-oil emulsions where the
bUn ance
1400
1200
1000
800
600
400
1200
1000
800
600
Xon 19100 (19070 to 19170)
C23
C30
C29 XS
24
32
3000 3500 4000 4500 Xon 19100 (19070 to 19170)
5000
illle-15 oo 3000 3500 4000 4500 sooo
Figure S Distributionofbiomarmtcrpanes (mz 191) in the wnpleS (top) and the source
OrioWion (bottom) IS represents the inlemal standard C C C C C and
Crqxosem C and C terpane C and C ajl-bopane and 20Sl20R ofC and C
hopane isomer pain respeclively
Table 3 Alkylated PAH Homologue Distribution (microgg TSEM) and Diagnostic Ratios of PAHS Orimulsion Samples
water-in-oil droplets disperse in oil phase Orimulsion is an oil-in-water emulsion In order to stabilize the oil-in-water emulsion and prevent the water and bitumen from separation the surfactant added to Oriihulsion has to meet the following criteria (I) the hydrophilic-lipophilic balance (HLB) value ofthe surfactant must be high enough (2) the hydrophillic part of the surfactant molecules must be large enough to be able to dissolve in water (for example polyethoxylated octylphenol with average ethoxy units smaller than 7 is not dissolved in water and a dispersion forms) Only such surfactant molecules can effectively act by adsorbing at the oil-water interface forming a molecular film which behaves as a mechanical barrier that protects oil-in-water droplets from coalescence In addition as an economical consideration the surfactant must be inexpensive enough to keep the cost ofOrimulsion as low as possible
The best candidates which can meet such criteria are non-ionic surfactants which have relatively greater number ofethylene oxide (BO) units in the hydrophillic chain of molecules such as for example sorbitan ester surfactants Tween type surfactants polyethoxylated octylphenols polyethoxylated nonylphenols and polyethoxylated amine derivatives [10) It has been long established that the HLB values increase in direct proportion to the number of BO units of the molecule and that the surfactants having HLB values around IS can serve well as oil-in-water emulsifiers [10I I] For example the HLB values for nonylphenol ethoxylates with BO= IS 20 and 30 are lSO 160 and I 72 respectively Thus the range of searching for the best surfactant candidates is greatly narrowed As for identification ofthe unknown surfactant(s) used in Orimulsion it could be achieved through comparison ofits HPLC chromatographic pattern and behaviour and retention times ofresolved peaks to those structure-known surfactants
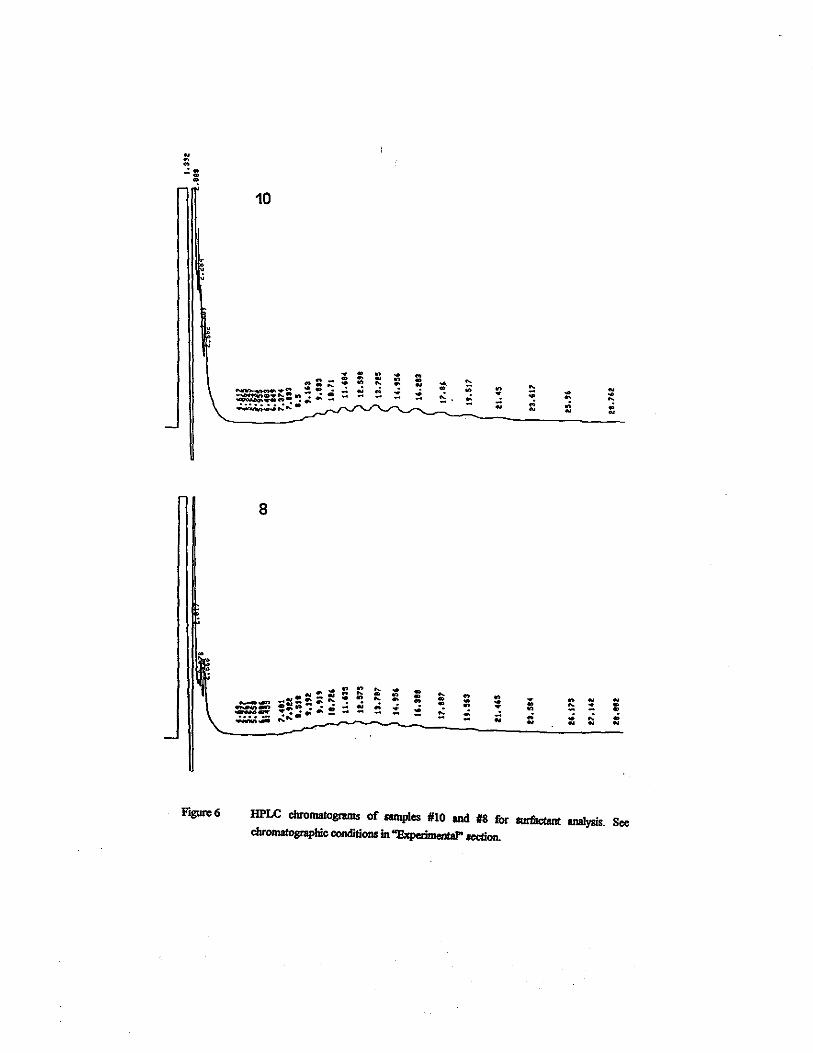
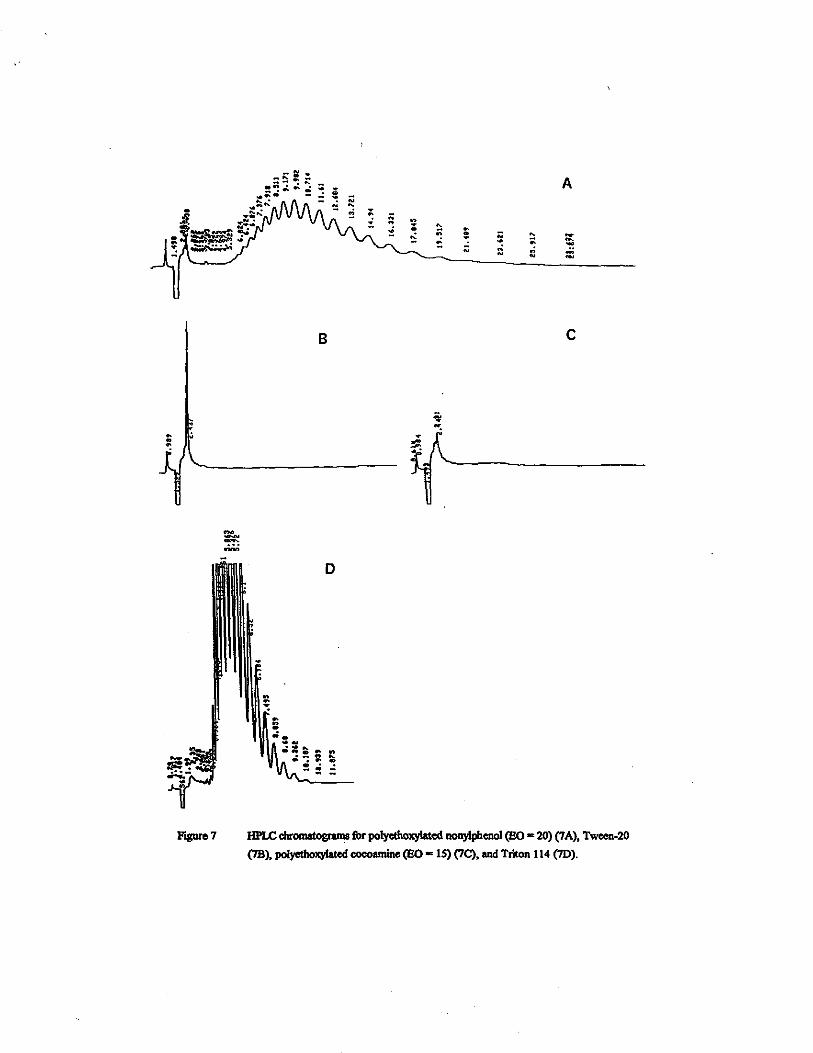
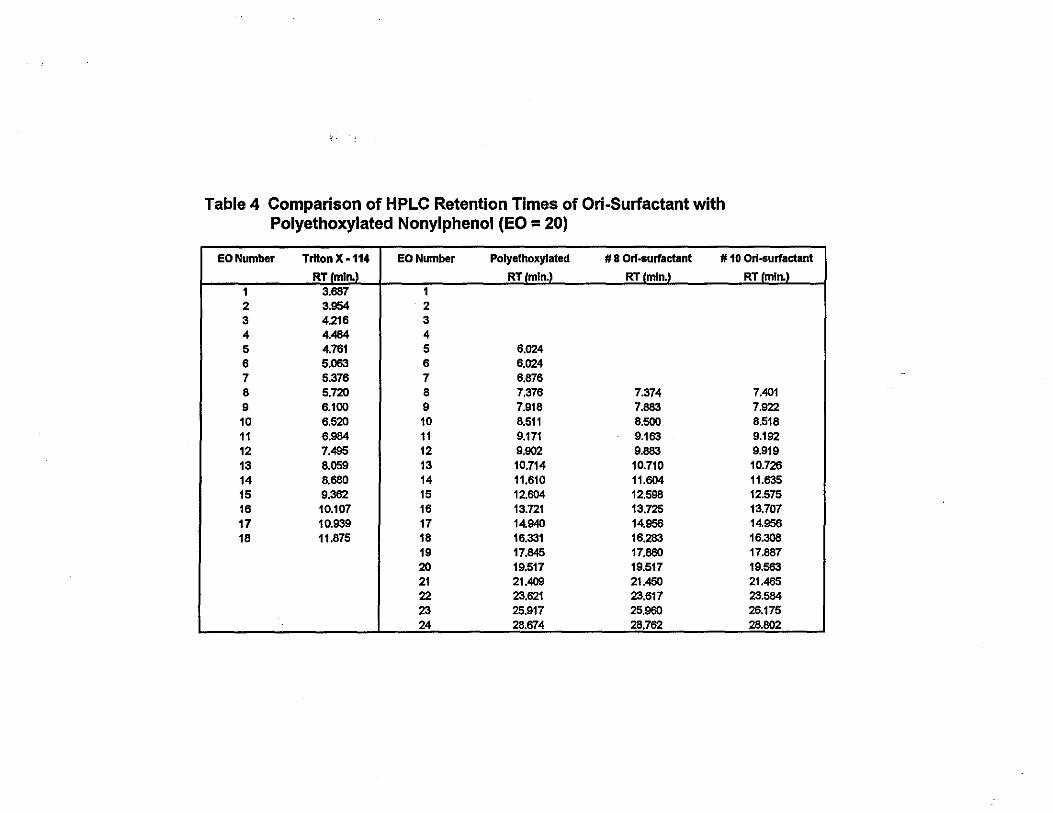
Figure 6 shows the chromatograms obtained from measurement ofthe surfactantshywater phase ofOrimulsion samples 10 and 8 In order to determine the surfactant used in Orimulsion over IS possible target nonionic surfactants were studied using HPLC and their chromatographic characteristics and patterns were carefully examined and compared with that of Orimulsion samples For examples Figure 7 presents representative chromatograms of polyethoxylated nonylphenol (B0=20) Tween-20 polyethoxylated cocoamine (BO=lS) and Triton X-114 These different types of surfactants show significantly different chromatographic behaviour But one common characteristic is that all of these surfactants have relatively high HLB values and relatively larger hydrophillic parts in their molecules (the separation and characterization ofsorbitan ester surfactants has been reported elsewhere [I213]) It can be clearly seen from comparison of Figures 6 and 7 that among all surfactants measured here the chromatogram of polyethoxyiated nonylphenoI (B0=20) matches chromatograms of surfactant in Orimulsion samples best Table 4 summarizes the chromatographic retention times of Orimulsion samples IO and 8 and polyethoxylated nonylphenol (B0=20) and Triton X-114 It is clear from Table 4 that the retention times of polyethoxylated nonylphenol (B0=20) oligomer peaks match samples IO and 8 extremely well
Figure 6 Figure 7 and Table 4 clearly demonstrate that (I) the chromatographic pattern and profile the distribution of oligomers of the unknown surfactant in Orimulsion shows great similarity to polyethoxylated (B0=20) nonylphenol but different from other possible target nonionic surfactants (2) the retention times of the oligomer peaks with varying BO numbers match to each other extremely well for the
10
-bull N ft bull
n
~ bull - ~ ~
n ~ N ~ N - t bull ~ bull
---middot~~-I - bull ~ ~ ~ bull N i
8
bull ~ nbull n ~ ~ n _ == N bull - bull --A -- bulln N~ n------ bulln - - bull ~
n
l ~
t = bullbull n
i N
- ~ ---- bull N N -N
Figure6 HPLC chromatograms of lllllples 10 and 11$ for IUdilctant analysis See chromatographic conditions in llxperimenta letlion
known and unknown surfactant Hence the surfactant used to emulsify Orimulsion is identified to be a polyethoxylated nqnylphenol surfactant with average EO number around 20 or greater (3) The oligomer8 with EO number from 8 to 24 in the Orimulsion surfactant were characterized Due to the detection limit and concentration limit oligomers with EO number smaller than 8 and greater than 24 were not characterized or not detected
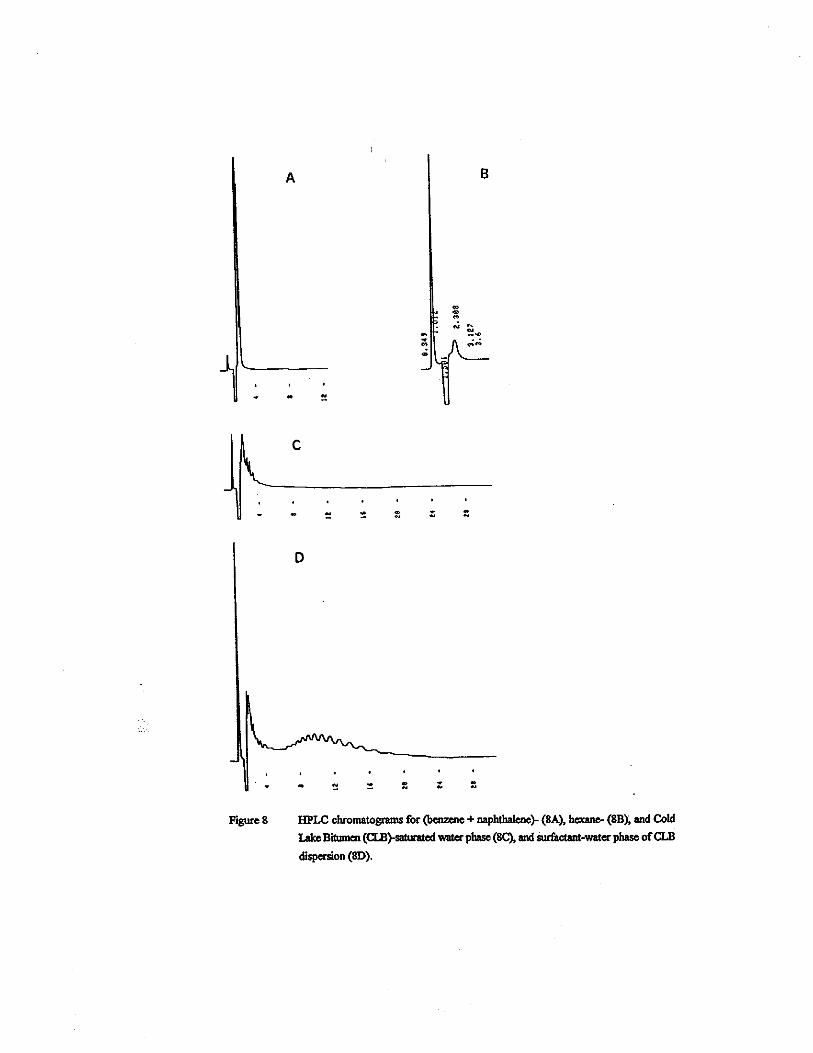
It is noticed that there are several quite large early-eluted peaks (prior to -4 minutes) in Figure 6 which is thought most probably to be some water-soluble polar and aromatic compounds from oil hydrocarbons In order to confirm this hypothesis (naphthalene+ benzene)- hexane- Cold Lake Bitumen (CLB)-saturated water phase were analysed using HPLC under exact same analytical conditions as for analysing Orimulsion surfactant The CLB crude was chosen because it has similar physical properties and chemical composition to Orinoco bitumen Figure 8 presents chromatograms of (naphthalene + benzene)- hexane- Cold Lake Bitumen (CLB)shysaturated water phase For comparison purposes the HPLC chromatogram ofwatershysurfactant water phase of CLB dispersion is alsomiddotpresented in Figure 8 Compared to Figures S and 6 one can immediately conclude that those large early-eluted peaks before -4 minutes in the chromatograms are from Orinoco crude components and not from the added surfactant These oil components are most probably aromatic and polar compounds which have certain solubilities in water and are almost not retained by the column due to their relatively high polarity Fortunately they do not affect characterization and quantitation ofsurfactant oligomers
Estimation of concentration of the surfactant used for Orimulsion Because oflack ofVenezuela Orinoco crude the CLB crude was applied as the
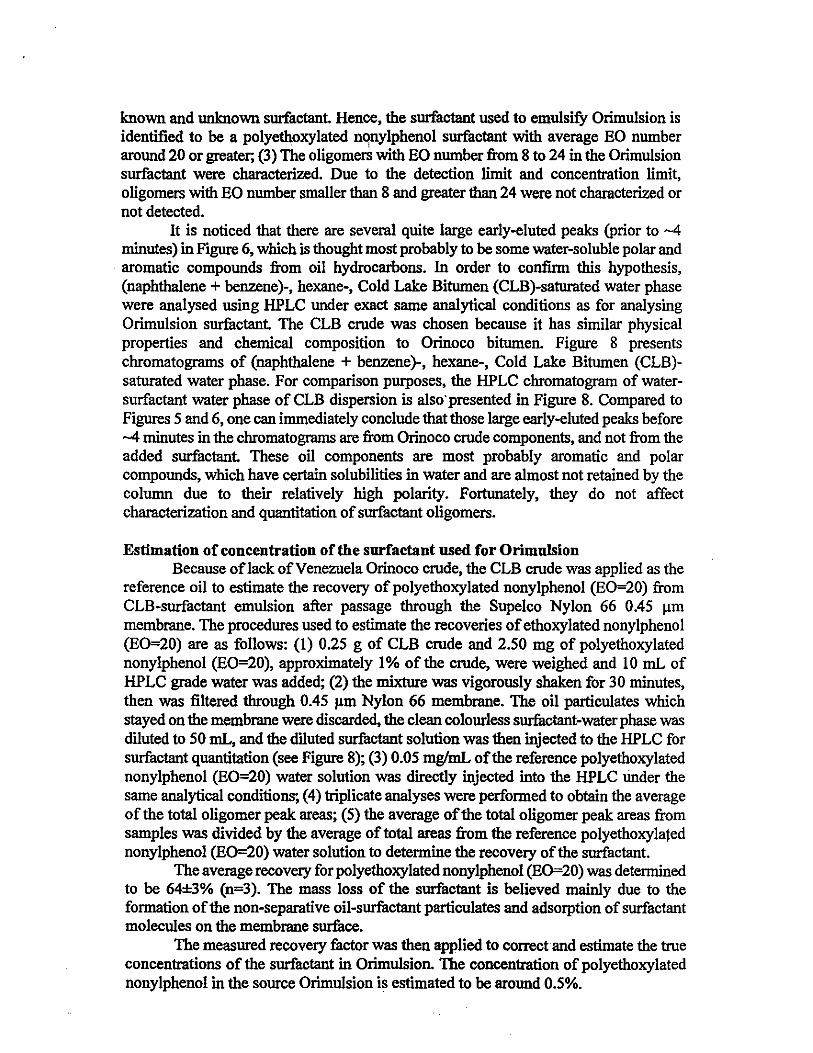
reference oil to estimate the recovery of polyethoxylated nonylphenol (E0=20) from CLB-surfactant emulsion after passage through the Supelco Nylon 66 045 microm membrane The procedures used to estimate the recoveries ofethoxylated nonylphenol (E0=20) are as follows (1) 025 g of CLB crude and 250 mg of polyethoxylated nonylphenol (E0=20) approximately 1 of the crude were weighed and 10 mL of HPLC grade water was added (2) the mixture was vigorously shaken for 30 minutes then was filtered through 045 microm Nylon 66 membrane The oil particulates which stayed on the membrane were discarded the clean colourless surfactant-water phase was diluted to SO mL and the diluted surfactant solution was then injected to the HPLC for surfactant quantitation (see Figure 8) (3) 005 mgmL ofthe reference polyethoxylated nonylphenol (E0=20) water solution was directly injected into the HPLC tinder the same analytical conditions (4) triplicate analyses were performed to obtain the average of the total oligomer peak areas (S) the average ofthe total oligomer peak areas from samples was divided by the average of total areas from the reference polyethoxylated nonylphenol (E0=20) water solution to determine the recovery of the surfactant
The average recovery for polyethoxylated nonylphenol (E0=20) was determined to be 64plusmn3 (n=3) The mass loss of the surfactant is believed mainly due to the formation ofthe non-separative oil-surfactant particulates and adsorption of surfactant molecules on the membrane surface
The measured recovery factor was then applied to correct and estimate the true concentrations of the surfactant in Orimulsion The concentration of polyethoxylated nonylphenol in the source Orimulsion is estimated to be around 05
BA
c
D
Figures HPLC ohromatognuns for (beozene +naphthalene- (SA) hexane- (SB) and Cold
Lake Bitumen (ClB-saturated water phase (SC) and surfactant-water phase ofClB
dispersion (SD)
CONCLUSION
A reliable and effective combined method ofusing membrane filtration capillary GC and HPLC techniques has been developed and applied for separation characterization quantitation of petroleum hydrocarbons and nonionic surfactant in complicated oil-in-water dispersion samples used for aquatic toxicity tests The simplicity and directness of the method is obvious Identification of the surfactant in Orimulsion was achieved by (1) narrowing the searching range based on theoretical considerations and analysis and (2) comparing chromatographic profiles oligomer distribution patterns and retention times of oligomer peaks The surfactant in Orimulsion was identified as polyethoxylated nonylphenol with oligomers having EO numbers ranging from 8 to 24 (average EO units around 20) The concentration of polyethoxylated nonylphenol in the source Orimulsion was estimated to be around 05
ACKNOWLEDGEMENT The authors would like to thank Mr Michael Landriault and Mrs Lise Sigouin
for their help in performing the sample cleanup and drawing figures and tables
REFERENCES
[1] S L Ross Environmental Research Limited Behaviour and Control ofSpills of Orimulsiontrade 1987
[2] S L Ross Environmental Research Limited The Risk Fate and Behaviour of Orimulsiontrade Spills at Dalhousie N B 1992
[3] Zlantar M Orimulsion the revolutionary new fuel for power and industry Financial Times Business Information London 1989
[4] BITOR Comparative Summary Between Orimulsion Produced by the Primary Emulsification andDilution Methods BITOR May 1994
[5] Jokuty P Whiticar S Fingas M Wang Z Doe K Kyle D Lambert P and Fieldhouse B Orimulsion Physical Properties Chemical Composition Dispersibility and Toxicity September 1995
[6] Wang Z D Fingas M Li K J Chromatogr Sci 1994 32 361-366 [7] Wang Z D Fingas M Li K J Chromatogr Sci 1994 32 367-382 [8] Wang Z D Fingas M Sergy G Environ Sci Technol 1994 28 1733-1746 [9] Wang Z D and Fingas M Environ Sci Techno 1995 29 2842-2849 [10] Cross J ed Nonionic Surfactants Chemical Analysis Marcel Dekker New
York 1987 [ 11] Becher P in Nonionic Surfactants (M Schick ed) Marcel Dekker New York
1967 [12] Wang Z D and Fingas M HRC 1994 17 15-19 [13] Wang Z D and Fingas M HRC 1994 17 85-90
separation and characterization of petroleum hydrocarbons and surfactant in norimulsion dispersion samples
Emergenvies science division
abstract
years with the price of the product adjusted in line with any changes in the price levels ofsteam coal its main competitor in the fuel market
In September 1988 the New Btunswick Power Commission ofCanada launched Orimulsion into the commercial testing market by adapting one of its 100 MW units at Dalhousie to use the new fuel The New Brunswick Power Commission has signed a 20shyyear contract with PDVSA The first delivery ofOrimulsion took place in early 1994 Since 1988 several reports and reviews on physical properties experimental spills spill modelling and marketing strategies ofOrimulsion have been published [1-5] However no comprehensive study has been conducted and reported on the quantitative chemical composition ofOrimulsion and on separation and analysis ofpetroleum hydrocarbons and surfactant(s) of Orimulsion In view of the importance of Orimulsion as an alternative fuel detailed re-evaluation of physical and chemical properties of Orimulsion characterization ofpetroleum hydrocarbons and surfactant(s) in Orimulsion dispersions and toxicity study ofOrimulsion is definitely needed
In this paper we report results of separation and characterization ofpetroleum hydrocarbons and surfactant in Orimulsion dispersions which were used for fish toxicity tests A membrane filtration method has been developed and applied for separation of Orimulsion oil particulate from the surfactant-water phase of Orimulsion dispersion samples The separated Orimulsion oil particulates were then re-dissolved and analysed using gas chromatography-mass spectrometry (GC-MS) and capillary GC equipped with flame ionization detector (GC-FID) for determination oftotal petroleum hydrocarbons (TPH) n-alkane distribution polycyclic aromatic hydrocarbons (PAHs) and their alkylated homologues and biomarker terpanes and steranes High performance liquid chromatography (HPLC) was used to identify and quantify the nonionic surfactant in the water phase
EXPERIMENTAL
Orimulsion dispersion samples used for fish tests The Orimulsion dispersions used for fish tests were received from Aquatic
Toxicology Section Environmental Quality Laboratory Environment Canada Atlantic Region The detailed description ofthe Orimulsion dispersion samples is presented in Table l ln brief oil-in-water dispersions (OWD) were prepared by adding Orimulsion to water in various ratios to obtain dispersions with desired concentrations for example 25000 and 7500 mgfL The dispersions were then stirred and settled before adding the fish The dispersion samples were removed from mid-depth in the water column by means ofa clean siphori All were stored in clean 1-L glass jars The jars were filled with no air space tightly capped and stored at 4 degC until shipping The samples were stored in a cold room at 4 degC for analysis after they were received
The aquatic toxicity results have been reported elsewhere [ 5]
Surfactants and oils Surfactants and crude oils were obtained from various sources and stored in a
Membrane filtration A membrane filtration method was developed and used for separation of
Table 1 Description of Orimulslon Dispersion Samples for Fish Toxicity Test
s sie Descrlnllon
3
4
OWD nominal cot 1ceuliatlon bull 25000 mglL stirred two days seltled 3 hours for Daphnla magna test -shy
OWD 25000 mnll mtered with 1um membrane details asll 3
bull 8
9
No oil FreshWater control (lap water) for Rainbow trout test
OWD nominal cotitei ibatloi1 bull 7500 mglL start of Rainbow trout test eampled at Ohour
OWD nominal cot1te111iation bull 7 500 ~bull termination of Rainbow trout test eamDled 24 hours later
10
11
12
OWD stirred 3 days seltled 3 days nomlnal concentration 25000 mgL 100 test solution for start of Rainbow trout test sampled at 0 hour
OWD as for ti 10 termination of Rainbow trout test eampled 24 hours later
OWD stirred 3 seltled 3 nominal conce111iation bull 25000 ~bull 1test solution for start of Rainbow trout test samoled at Ohour
bull OWD oll~n-er dispersion
Orimulsion oil particulates from the surfactant-water phase The detailed membrane filtration procedures are described as follows
-the jars were vigorously shlucen for 5 minutes before sampling because Orimulsion tends to settle in fresh water
-100 mL ofthe well-shaken samples was immediately transferred from the midshydepth ofthe bottle to a pre-prepared filter funnel by means of a clean disposable pipet For 4 (1-microm pre-filtered) and 12 (1 test solution) 200 mL of samples were transferred and filtered For 5 (freshwater control) a liquid-liquid extraction technique was applied to extract any possible hydrocarbons from 1-L ofthe sample
-samples were filtered by vacuum through the Supelco (Bellefonte PA) Nylon 66 045 microm membrane by which the Orimulsion oil particulates were separated from the surfactant-water phase and were trapped on the membrane The clean and colourless filtered surfactant-water solution was used for surfactant analysis by HPLC
-the Orimulsion oil particulates were completely transferred to a beaker by dichloromethane (DCM) and the Orimulsion oil solutions in DCM were then dried by passage through anhydrous sodium sulphate
-the dried Orimulsion oil solutions were concentrated by rotary evaporation and solvent-exchanged to hexane phase and were then made up to an appropriate volume
-aliquots ofthe concentrated Orimulsion oil hexane solutions were blown down with nitrogen to residues and weighed on a microbalance to obtain total solventshyextractable materials (fSEM)
Column chromatographic fractionation ofOrimulsion extracts The microcolumn fractionation technique was employed for sample cleanup and
fractionation of the concentrated Orimulsion extracts [6-8] Appropriate aliquots of extracts (containing TSEM- 20 mg) were applied to the 3-gram silica gel column which had been preconditioned with 12 mL of hexane Half of the hexane fraction (Fl) was used for analysis of saturates and biomarker compounds half of the 50 benzene fraction (F2) was used for analysis oftarget P AHs and alkylated P AH homologues The remaining halfofFl and F2 was combined (F3) and used for the determination oftotal hydrocarbons (fPH) These three fractions were concentrated under a stream ofnitrogen
~-to appropriate volumes spiked with internal standards and then adjusted to accurate pre-injection volumes for GC analysis
Capillary gas chromatography (GC) and gas chromatography-mass spectrometry (GCMS)
Analyses for n-alkane distribution and total petroleum hydrocarbons (fPH) were performed on a Hewlett-Packard (HP) 5890 gas chromatograph equipped with a flameshyionization detector (FID) and an HP 7673 autosampler A 30-m x 032-mm id (025-microm film) DB-5 fused silica capillary column (JampW Folsom CA USA) was used The carrier gas was helium (25 mLmin) The injector and detector temperatures were set at 290 degc and 300 degC respectively The following temperature program was used 2-min hold at 50 degc ramp to 300 degc at 6 degCmin and 16-minhold at 300degc A 1-microL aliquot was injected in the splitless mode with a 1-min purge-off
Analyses of target polycyclic aromatic hydrocarbons (PAHs) and biomarker compounds were performed on an HP Model 5890 GC equipped with a Model HP 5972 mass selective detector (MSD) System control and data acquisition were achieved with
an HP Q 1034C MS ChemStation (DOS series) The MSD was operated in the scan and selected ion monitoring (SIM) mode modes for identification ofcomponents and in the SIM mode for quantitation of target lompounds An HP-S fused-silica column with dimensions of 30-m x 02S-mm id (02S-microm film) was used The chromatographic conditions were as follows carrier gas helium (10 mUmin) injection mode splitless injector and detector temperature 290 degc and 300 degc respectively temperature program for target P AHs 90 degC for 1-min ramp to 160 degc at 2S degCmin and then to 290 degc at 8 degCmin and hold IS-min temperature program for alkylated PAHs and biomarker compounds SO 0c for 2-min ramp to 300 degc at 6 degctmin and hold 16 min
High performance liquid chromatography The analysis of surfactant was performed on a Shimadzu system (Columbia
MD) consisting of two LC-610 pumps an SCL-6B system controller and a variableshywavelength SPD-6AV UV-VIS detector The chromatograms with peak area and retention times were recorded on a Shimadzu CR-SOl Chromatopac integrator
The chromatographic separation was carried out isocratically in the reversedshyphase mode with a lSO mm x 46 mm id stainless Cl TMS column (particle size S microm) purchased from Chromatography Sciences Co (Montreal Canada) After trial ofvarious conditions the mobile phase used was a mixture ofHPLC-grade methanol and deionized water (6040 vv) The column effluent was monitored at 220 nm (deuterium lamp flow cell volume 8 microL) which corresponds to the maximum absorption ofthe surfactant used for Orimulsion The flow rate was maintained at 10 mUmin and the column was maintained at ambient temperature (22 plusmn 1 degC) The injection system was a Rheodyne Model 712S sample injector equipped with a 20-microL sampling loop
All solvents used were chromatographic grade and were used without further purification
RESULTS AND DISCUSSION
Characterization ofpetroleum hydrocarbons in Orimulsion Table 2 summarizes the hydrocarbon analysis results for the Orimulsion
dispersion samples by gravimetric and GCFID methods In addition to the TSEM and QC-determined TPH ratios of saturatesTSEM aromaticsTSEM UCMTPH and TPHTSEM are also listed in Table 2 UCM is defined as the unresolved hydrocarbon mixture detected by QC which appears as the envelope or hump area between the solvent baseline and the curve defining the base ofthe resolved peaks For comparison the hydrocarbon analysis results for the duplicate source Orimulsion samples are also presented in Table 2 Figure 1 presents the GCFID chromatograms for total petroleum hydrocarbon analysis
Key points from Table 2 and Figure 1 are summarized as follows (1) the most pronounced feature ofOrimulsion composition is that the unresolved complex mixture dominates the total QC peak area that is the saturates in Orimulsion are mainly composed ofQC-unresolvable aliphatic hydrocarbons (2) the ratios of UCMTPH are exclusively higher than 98 for all samples including the source Orimulsion samples and no Ge-resolved n-alkane peaks including isoprenoids such as pristane and phytane were detected Only when higher sensitivity GCMS (m SIM mode mz = 8S) is used to analyse Fl could very small peaks of n-alkanes from C 11 to C15 be distinguished
Table 2 TSEM and TPH Values for the Orimulsion Samples
SamDle
start Cone Of Ortmulslon
fm
startCone of oU after correction of
H2Q content fmll I
TSEM fm
OC-lPH Geshy middot--middotmiddot lPH-middot
lnlPH-middot UCMTJH-middot TPHITSEM _
3
4
25000
1microm prefilter
18250 5500
ND
1623
0065
MO 52 48 98 30
freshwater 6 control ND 0030
8 7500 5475 4100 1390 690 50 50 98 33
9 7500 5475 2300 802 426 53 47 98 35
10 25000 18250 s400 1766 822 47 53 98 33
11 25000 18250 3500 1190 690 50 50 98 34
12 250 183 35 12 8 57 43 98 34
323mgg 140mgg Ref1shy 10g 073g oil oil 52 48 32
332mgg 141 mgg Ref2 1 07n oil oil 51 49 33
bull ND Not determined due to YeJY small quantity of exlnlctable material
-The values for Ref1 and Ref2 were obtained from direct analysis of duplicate Orlmulslon samples The average water content In Orlmulslon was determined to be 27 by Karl Fischer titration The values of TPH and Saturates given In the table are the values (mggall) after correction orwater content
bullbull bull bull 0
bullo
tobull
3 sur
I IS
bullo
10
0
0 bullo bullo ao bullo 00 00
bullo 4
oo
bullmiddotObullbull
10
0
bullo
0 bullO
8
bullo ao bullo oo 00
oo
eo
10
0 bullbull bullbull ao bullbull Figurel GCllDgt _ flaquo -i petroleum bydrocllboa lllllylil or Orimublon
dispenioA ampla 13 14 ad 8 Sur ad IS __ ad iotoma1
- respoctlwl
(Figure 2) The whole chromatographic profiles of Orimulsion look like that of extremely highly weathered and de_graded crudes (3) the TPHs (saturates plus aromatics) are only 30-35 of the total weight of TSEM indicating relatively high portion (-70) of resins and asphaltenes in Orimulsion This result is understandable because one significant feature ofBitumen-type oil is the high percentage ofresin and asphaltenes in the oil (4) the aromatics are approximately 50 of the TPH for all samples far higher than the values of aromatics for light and medium crudes
Compared to sample 8 (its starting nominal concentration is 7500 mgL measured TSEM = 4100 mgL) the TSEM values determined for samples 3 10 and 11 (their starting nominal concentrations are 25000 mgL TSEM values are 5500 5400 and 3500 mgL respectively) are much lower than expected Repeated analyses give roughly the same results The most possible reason for this may be that the samples were not uniform before sampling due to 3 hours settling time for 3 and 3 days settling time for 10 and 11 respectively (see Table l for sample description) Some concentration gradient would be expected because Orimulsion tends to settle in water
Sample 4 showed a extremely low value ofTPH demonstrating that the l microm membrane can effectively remove almost l 00 ofOrimulsion oil particulates from the surfactant-water phase
At the point of termination of the Rainbow trout test (24 hour duration) the concentrations ofTPH for 9 and 11 were determined to be 802 mgLand 1190 mgL 42 and 33 lower than the TPH concentrations for the corresponding starting samples 8 and 10 respectively That means that the test fish was killed due to consumption absorption and adsorption ofOrimulsion (possibly by both petroleum hydrocarbons and surfactant) during the toxicity test As the toxicity study concluded a spill of Orimulsion will result in a higher exposure to oil and therefore a higher risk to aquatic organisms than would a spill ofheavy fuel oil [5]
Figure 3 shows the GCMS total ion chromatograms in the SIM mode for the alkylated P AHs Table 3 summarizes analysis results of the 5 target alkylated P AH series and diagnostic ratios ofthe source-specific-marker P AH compounds [9] As an example Figure 4 depicts graphically the distribution ofalkylated P AHs for the source oil and sample 3 Note that the total P AHs in Table 3 are expressed in both microgig TSEM and mgL of H20 TSEM gives a reasonably equal basis for the determination of the relative composition changes ofhydrocarbons in Orimulsion samples It is only by this way that the quantitation results are comparable
The sum of the 5 target alkylated PAHs was determined to be in the range of 2300-2900 microgig ofTSEM Major alkyl PAH composition characteristics are outlined as follows (1) compared to most crude oils the concentrations of the total of 5 target alkylated PAHs in Orimulsion are low (2) Orimulsion does not contain BTEX (the collective name ofbenzene toluene ethylbenzene and the xylene isomers) and lighter alkylbenzene compounds evidenced by the fact that no alkylbenzene peaks were detected before the retention time of 15 minutes (3) the distribution pattern with the alkyl naphthalene and phenanthrene series being the most abundant among the 5 target alkylated P AH series is observed for the source oil However for the fish test oil-inshywater dispersion samples the loss of alkyl naphthalene series relative to the alkyl phenanthrene series is obvious mainly due to the higher solubility ofnaphthalenes in water (4) different from most oils the distribution abundances ofltltC1ltCiltC in each alkyl P AH group except for the alkyl chzysene series is very pronounced (for most oils
Fig 4 Comparison of distribution of alkyfated PAiis In the ampample 3 (lop) and the source Otlmulslon bottom) N P D F and C represent naphlhalene phenanthrene dibenzolhlophene ftuorene and chrysene respectiYely 0 1 2 3 llld 4 represent carbon numbers of alkyl groups In alkylated PAH homologues
this kind ofdistribution patterns is seen only when they have been highly weathered) After the 24 hour Rainbow trout toxicity test the concentrations of the target
PAH homologues were determined to be 734 mgL for 9 and 824 mgL for 11 respectively Compared to the concentrations of the target PAHs in the corresponding start dispersion samples (11 74 mgL for 8 and 1437 mgL for10) approximately 13 of the target PAHs were reduced which is in good agreement with the TPH analysis results Other compositional changes ofP AHs are summarized as follows (1) in general the alkyl dibenzothiophene and fluorene series did not show changes in their ratios to the alkyl chrysenes compared to the source oil However decrease in ratios of the alkyl naphthalene series to the alkyl chrysenes is noticed This trend is especially obvious for the paired samples 11 and 12 (the ratios of the alkyl naphthalenes to the alkyl chrysenes were determined to be 52 and 46 respectively) indicating that in addition of being more soluble in water the alkyl naphthalenes may preferentially be absorbed andor adsorbed by the test fish (2) compared to the source Orimulsion (1075092) the changes ofthe isomeric distribution of4- 2-3- and 1-methyldibenzothiophene for samples 10 (1024096) 11 (1002108) and 12 (1002108) are pronounced This may be mainly because of preferential biodegradation of 2-3shymethyldibenzothiophene resulting in decrease of the ratio relative to 4shymethyldibenzothiophene [9]
Compared to most oils significantly higher amounts ofbiomarker compounds were detected in the source and the toxicity test Orimulsion samples For example the concentrations of~-terpane and lt-hopane were determined to be in the range of230shy244 and 210-222 microgig ofTSEM Figure 5 shows distribution profiles ofbiomarker terpanes at mlz 191 for the source oil and sample 8 The terpane distribution reflects the petroleum inputs Figure 5 is characterized by the terpane distribution in a wide range from C20 to Cis with ~ to lt tricyclic terpanes and lt to ~ o~-pentacyclic hopanes being the most prominent The GCMS measurements demonstrate that the profiles and patterns ofthe mz 191and217 (the steranes are mainly dominated by C27
C28 and lt 20R20S sterane compounds) ion chromatograms of the samples are identical to each other and to the source oil In addition the biomarker compounds of the Orimulsion samples did not show any noticeable changes in their absolute concentrations in comparison to the source oil and the ratios of five pairs of target terpanes ~Cu cJc TsTm c2 20S20R and CJ3 20S20R are almost same for all samples as well indicating the composition of biomarkers is virtually unaltered No biomarker compounds were detected for the fresh water control 5 and only extremely low concentrations ofbiomarkers were detected for sample 4 (the concentrations ofthe most abundant~ andlt were determined to be less than 5 microgL ofwater) which was pre-filtered using 1 microm membrane further confirming that the petroleum particulates in Orimulsion can be effectively separated using membrane filtration technique
Identification of surfactant in Orimulsion Orimulsion is simply a trade name in which bitumen content is entirely derived
from Venezuelas Orinoco region and to which the addition of water (as described above the water content was determined to be 27) and a surfactant turns its consistency into an emulsion with a viscosity resembling heavy fuel oil Theoretically speaking there are two different types ofemulsions oil-in-water emulsions where the very fine oil-in-water droplets disperse in water phase water-in-oil emulsions where the
bUn ance
1400
1200
1000
800
600
400
1200
1000
800
600
Xon 19100 (19070 to 19170)
C23
C30
C29 XS
24
32
3000 3500 4000 4500 Xon 19100 (19070 to 19170)
5000
illle-15 oo 3000 3500 4000 4500 sooo
Figure S Distributionofbiomarmtcrpanes (mz 191) in the wnpleS (top) and the source
OrioWion (bottom) IS represents the inlemal standard C C C C C and
Crqxosem C and C terpane C and C ajl-bopane and 20Sl20R ofC and C
hopane isomer pain respeclively
Table 3 Alkylated PAH Homologue Distribution (microgg TSEM) and Diagnostic Ratios of PAHS Orimulsion Samples
water-in-oil droplets disperse in oil phase Orimulsion is an oil-in-water emulsion In order to stabilize the oil-in-water emulsion and prevent the water and bitumen from separation the surfactant added to Oriihulsion has to meet the following criteria (I) the hydrophilic-lipophilic balance (HLB) value ofthe surfactant must be high enough (2) the hydrophillic part of the surfactant molecules must be large enough to be able to dissolve in water (for example polyethoxylated octylphenol with average ethoxy units smaller than 7 is not dissolved in water and a dispersion forms) Only such surfactant molecules can effectively act by adsorbing at the oil-water interface forming a molecular film which behaves as a mechanical barrier that protects oil-in-water droplets from coalescence In addition as an economical consideration the surfactant must be inexpensive enough to keep the cost ofOrimulsion as low as possible
The best candidates which can meet such criteria are non-ionic surfactants which have relatively greater number ofethylene oxide (BO) units in the hydrophillic chain of molecules such as for example sorbitan ester surfactants Tween type surfactants polyethoxylated octylphenols polyethoxylated nonylphenols and polyethoxylated amine derivatives [10) It has been long established that the HLB values increase in direct proportion to the number of BO units of the molecule and that the surfactants having HLB values around IS can serve well as oil-in-water emulsifiers [10I I] For example the HLB values for nonylphenol ethoxylates with BO= IS 20 and 30 are lSO 160 and I 72 respectively Thus the range of searching for the best surfactant candidates is greatly narrowed As for identification ofthe unknown surfactant(s) used in Orimulsion it could be achieved through comparison ofits HPLC chromatographic pattern and behaviour and retention times ofresolved peaks to those structure-known surfactants
Figure 6 shows the chromatograms obtained from measurement ofthe surfactantshywater phase ofOrimulsion samples 10 and 8 In order to determine the surfactant used in Orimulsion over IS possible target nonionic surfactants were studied using HPLC and their chromatographic characteristics and patterns were carefully examined and compared with that of Orimulsion samples For examples Figure 7 presents representative chromatograms of polyethoxylated nonylphenol (B0=20) Tween-20 polyethoxylated cocoamine (BO=lS) and Triton X-114 These different types of surfactants show significantly different chromatographic behaviour But one common characteristic is that all of these surfactants have relatively high HLB values and relatively larger hydrophillic parts in their molecules (the separation and characterization ofsorbitan ester surfactants has been reported elsewhere [I213]) It can be clearly seen from comparison of Figures 6 and 7 that among all surfactants measured here the chromatogram of polyethoxyiated nonylphenoI (B0=20) matches chromatograms of surfactant in Orimulsion samples best Table 4 summarizes the chromatographic retention times of Orimulsion samples IO and 8 and polyethoxylated nonylphenol (B0=20) and Triton X-114 It is clear from Table 4 that the retention times of polyethoxylated nonylphenol (B0=20) oligomer peaks match samples IO and 8 extremely well
Figure 6 Figure 7 and Table 4 clearly demonstrate that (I) the chromatographic pattern and profile the distribution of oligomers of the unknown surfactant in Orimulsion shows great similarity to polyethoxylated (B0=20) nonylphenol but different from other possible target nonionic surfactants (2) the retention times of the oligomer peaks with varying BO numbers match to each other extremely well for the
10
-bull N ft bull
n
~ bull - ~ ~
n ~ N ~ N - t bull ~ bull
---middot~~-I - bull ~ ~ ~ bull N i
8
bull ~ nbull n ~ ~ n _ == N bull - bull --A -- bulln N~ n------ bulln - - bull ~
n
l ~
t = bullbull n
i N
- ~ ---- bull N N -N
Figure6 HPLC chromatograms of lllllples 10 and 11$ for IUdilctant analysis See chromatographic conditions in llxperimenta letlion
known and unknown surfactant Hence the surfactant used to emulsify Orimulsion is identified to be a polyethoxylated nqnylphenol surfactant with average EO number around 20 or greater (3) The oligomer8 with EO number from 8 to 24 in the Orimulsion surfactant were characterized Due to the detection limit and concentration limit oligomers with EO number smaller than 8 and greater than 24 were not characterized or not detected
It is noticed that there are several quite large early-eluted peaks (prior to -4 minutes) in Figure 6 which is thought most probably to be some water-soluble polar and aromatic compounds from oil hydrocarbons In order to confirm this hypothesis (naphthalene+ benzene)- hexane- Cold Lake Bitumen (CLB)-saturated water phase were analysed using HPLC under exact same analytical conditions as for analysing Orimulsion surfactant The CLB crude was chosen because it has similar physical properties and chemical composition to Orinoco bitumen Figure 8 presents chromatograms of (naphthalene + benzene)- hexane- Cold Lake Bitumen (CLB)shysaturated water phase For comparison purposes the HPLC chromatogram ofwatershysurfactant water phase of CLB dispersion is alsomiddotpresented in Figure 8 Compared to Figures S and 6 one can immediately conclude that those large early-eluted peaks before -4 minutes in the chromatograms are from Orinoco crude components and not from the added surfactant These oil components are most probably aromatic and polar compounds which have certain solubilities in water and are almost not retained by the column due to their relatively high polarity Fortunately they do not affect characterization and quantitation ofsurfactant oligomers
Estimation of concentration of the surfactant used for Orimulsion Because oflack ofVenezuela Orinoco crude the CLB crude was applied as the
reference oil to estimate the recovery of polyethoxylated nonylphenol (E0=20) from CLB-surfactant emulsion after passage through the Supelco Nylon 66 045 microm membrane The procedures used to estimate the recoveries ofethoxylated nonylphenol (E0=20) are as follows (1) 025 g of CLB crude and 250 mg of polyethoxylated nonylphenol (E0=20) approximately 1 of the crude were weighed and 10 mL of HPLC grade water was added (2) the mixture was vigorously shaken for 30 minutes then was filtered through 045 microm Nylon 66 membrane The oil particulates which stayed on the membrane were discarded the clean colourless surfactant-water phase was diluted to SO mL and the diluted surfactant solution was then injected to the HPLC for surfactant quantitation (see Figure 8) (3) 005 mgmL ofthe reference polyethoxylated nonylphenol (E0=20) water solution was directly injected into the HPLC tinder the same analytical conditions (4) triplicate analyses were performed to obtain the average of the total oligomer peak areas (S) the average ofthe total oligomer peak areas from samples was divided by the average of total areas from the reference polyethoxylated nonylphenol (E0=20) water solution to determine the recovery of the surfactant
The average recovery for polyethoxylated nonylphenol (E0=20) was determined to be 64plusmn3 (n=3) The mass loss of the surfactant is believed mainly due to the formation ofthe non-separative oil-surfactant particulates and adsorption of surfactant molecules on the membrane surface
The measured recovery factor was then applied to correct and estimate the true concentrations of the surfactant in Orimulsion The concentration of polyethoxylated nonylphenol in the source Orimulsion is estimated to be around 05
BA
c
D
Figures HPLC ohromatognuns for (beozene +naphthalene- (SA) hexane- (SB) and Cold
Lake Bitumen (ClB-saturated water phase (SC) and surfactant-water phase ofClB
dispersion (SD)
CONCLUSION
A reliable and effective combined method ofusing membrane filtration capillary GC and HPLC techniques has been developed and applied for separation characterization quantitation of petroleum hydrocarbons and nonionic surfactant in complicated oil-in-water dispersion samples used for aquatic toxicity tests The simplicity and directness of the method is obvious Identification of the surfactant in Orimulsion was achieved by (1) narrowing the searching range based on theoretical considerations and analysis and (2) comparing chromatographic profiles oligomer distribution patterns and retention times of oligomer peaks The surfactant in Orimulsion was identified as polyethoxylated nonylphenol with oligomers having EO numbers ranging from 8 to 24 (average EO units around 20) The concentration of polyethoxylated nonylphenol in the source Orimulsion was estimated to be around 05
ACKNOWLEDGEMENT The authors would like to thank Mr Michael Landriault and Mrs Lise Sigouin
for their help in performing the sample cleanup and drawing figures and tables
REFERENCES
[1] S L Ross Environmental Research Limited Behaviour and Control ofSpills of Orimulsiontrade 1987
[2] S L Ross Environmental Research Limited The Risk Fate and Behaviour of Orimulsiontrade Spills at Dalhousie N B 1992
[3] Zlantar M Orimulsion the revolutionary new fuel for power and industry Financial Times Business Information London 1989
[4] BITOR Comparative Summary Between Orimulsion Produced by the Primary Emulsification andDilution Methods BITOR May 1994
[5] Jokuty P Whiticar S Fingas M Wang Z Doe K Kyle D Lambert P and Fieldhouse B Orimulsion Physical Properties Chemical Composition Dispersibility and Toxicity September 1995
[6] Wang Z D Fingas M Li K J Chromatogr Sci 1994 32 361-366 [7] Wang Z D Fingas M Li K J Chromatogr Sci 1994 32 367-382 [8] Wang Z D Fingas M Sergy G Environ Sci Technol 1994 28 1733-1746 [9] Wang Z D and Fingas M Environ Sci Techno 1995 29 2842-2849 [10] Cross J ed Nonionic Surfactants Chemical Analysis Marcel Dekker New
York 1987 [ 11] Becher P in Nonionic Surfactants (M Schick ed) Marcel Dekker New York
1967 [12] Wang Z D and Fingas M HRC 1994 17 15-19 [13] Wang Z D and Fingas M HRC 1994 17 85-90
separation and characterization of petroleum hydrocarbons and surfactant in norimulsion dispersion samples
Emergenvies science division
abstract
(Figure 2) The whole chromatographic profiles of Orimulsion look like that of extremely highly weathered and de_graded crudes (3) the TPHs (saturates plus aromatics) are only 30-35 of the total weight of TSEM indicating relatively high portion (-70) of resins and asphaltenes in Orimulsion This result is understandable because one significant feature ofBitumen-type oil is the high percentage ofresin and asphaltenes in the oil (4) the aromatics are approximately 50 of the TPH for all samples far higher than the values of aromatics for light and medium crudes
Compared to sample 8 (its starting nominal concentration is 7500 mgL measured TSEM = 4100 mgL) the TSEM values determined for samples 3 10 and 11 (their starting nominal concentrations are 25000 mgL TSEM values are 5500 5400 and 3500 mgL respectively) are much lower than expected Repeated analyses give roughly the same results The most possible reason for this may be that the samples were not uniform before sampling due to 3 hours settling time for 3 and 3 days settling time for 10 and 11 respectively (see Table l for sample description) Some concentration gradient would be expected because Orimulsion tends to settle in water
Sample 4 showed a extremely low value ofTPH demonstrating that the l microm membrane can effectively remove almost l 00 ofOrimulsion oil particulates from the surfactant-water phase
At the point of termination of the Rainbow trout test (24 hour duration) the concentrations ofTPH for 9 and 11 were determined to be 802 mgLand 1190 mgL 42 and 33 lower than the TPH concentrations for the corresponding starting samples 8 and 10 respectively That means that the test fish was killed due to consumption absorption and adsorption ofOrimulsion (possibly by both petroleum hydrocarbons and surfactant) during the toxicity test As the toxicity study concluded a spill of Orimulsion will result in a higher exposure to oil and therefore a higher risk to aquatic organisms than would a spill ofheavy fuel oil [5]
Figure 3 shows the GCMS total ion chromatograms in the SIM mode for the alkylated P AHs Table 3 summarizes analysis results of the 5 target alkylated P AH series and diagnostic ratios ofthe source-specific-marker P AH compounds [9] As an example Figure 4 depicts graphically the distribution ofalkylated P AHs for the source oil and sample 3 Note that the total P AHs in Table 3 are expressed in both microgig TSEM and mgL of H20 TSEM gives a reasonably equal basis for the determination of the relative composition changes ofhydrocarbons in Orimulsion samples It is only by this way that the quantitation results are comparable
The sum of the 5 target alkylated PAHs was determined to be in the range of 2300-2900 microgig ofTSEM Major alkyl PAH composition characteristics are outlined as follows (1) compared to most crude oils the concentrations of the total of 5 target alkylated PAHs in Orimulsion are low (2) Orimulsion does not contain BTEX (the collective name ofbenzene toluene ethylbenzene and the xylene isomers) and lighter alkylbenzene compounds evidenced by the fact that no alkylbenzene peaks were detected before the retention time of 15 minutes (3) the distribution pattern with the alkyl naphthalene and phenanthrene series being the most abundant among the 5 target alkylated P AH series is observed for the source oil However for the fish test oil-inshywater dispersion samples the loss of alkyl naphthalene series relative to the alkyl phenanthrene series is obvious mainly due to the higher solubility ofnaphthalenes in water (4) different from most oils the distribution abundances ofltltC1ltCiltC in each alkyl P AH group except for the alkyl chzysene series is very pronounced (for most oils
Fig 4 Comparison of distribution of alkyfated PAiis In the ampample 3 (lop) and the source Otlmulslon bottom) N P D F and C represent naphlhalene phenanthrene dibenzolhlophene ftuorene and chrysene respectiYely 0 1 2 3 llld 4 represent carbon numbers of alkyl groups In alkylated PAH homologues
this kind ofdistribution patterns is seen only when they have been highly weathered) After the 24 hour Rainbow trout toxicity test the concentrations of the target
PAH homologues were determined to be 734 mgL for 9 and 824 mgL for 11 respectively Compared to the concentrations of the target PAHs in the corresponding start dispersion samples (11 74 mgL for 8 and 1437 mgL for10) approximately 13 of the target PAHs were reduced which is in good agreement with the TPH analysis results Other compositional changes ofP AHs are summarized as follows (1) in general the alkyl dibenzothiophene and fluorene series did not show changes in their ratios to the alkyl chrysenes compared to the source oil However decrease in ratios of the alkyl naphthalene series to the alkyl chrysenes is noticed This trend is especially obvious for the paired samples 11 and 12 (the ratios of the alkyl naphthalenes to the alkyl chrysenes were determined to be 52 and 46 respectively) indicating that in addition of being more soluble in water the alkyl naphthalenes may preferentially be absorbed andor adsorbed by the test fish (2) compared to the source Orimulsion (1075092) the changes ofthe isomeric distribution of4- 2-3- and 1-methyldibenzothiophene for samples 10 (1024096) 11 (1002108) and 12 (1002108) are pronounced This may be mainly because of preferential biodegradation of 2-3shymethyldibenzothiophene resulting in decrease of the ratio relative to 4shymethyldibenzothiophene [9]
Compared to most oils significantly higher amounts ofbiomarker compounds were detected in the source and the toxicity test Orimulsion samples For example the concentrations of~-terpane and lt-hopane were determined to be in the range of230shy244 and 210-222 microgig ofTSEM Figure 5 shows distribution profiles ofbiomarker terpanes at mlz 191 for the source oil and sample 8 The terpane distribution reflects the petroleum inputs Figure 5 is characterized by the terpane distribution in a wide range from C20 to Cis with ~ to lt tricyclic terpanes and lt to ~ o~-pentacyclic hopanes being the most prominent The GCMS measurements demonstrate that the profiles and patterns ofthe mz 191and217 (the steranes are mainly dominated by C27
C28 and lt 20R20S sterane compounds) ion chromatograms of the samples are identical to each other and to the source oil In addition the biomarker compounds of the Orimulsion samples did not show any noticeable changes in their absolute concentrations in comparison to the source oil and the ratios of five pairs of target terpanes ~Cu cJc TsTm c2 20S20R and CJ3 20S20R are almost same for all samples as well indicating the composition of biomarkers is virtually unaltered No biomarker compounds were detected for the fresh water control 5 and only extremely low concentrations ofbiomarkers were detected for sample 4 (the concentrations ofthe most abundant~ andlt were determined to be less than 5 microgL ofwater) which was pre-filtered using 1 microm membrane further confirming that the petroleum particulates in Orimulsion can be effectively separated using membrane filtration technique
Identification of surfactant in Orimulsion Orimulsion is simply a trade name in which bitumen content is entirely derived
from Venezuelas Orinoco region and to which the addition of water (as described above the water content was determined to be 27) and a surfactant turns its consistency into an emulsion with a viscosity resembling heavy fuel oil Theoretically speaking there are two different types ofemulsions oil-in-water emulsions where the very fine oil-in-water droplets disperse in water phase water-in-oil emulsions where the
bUn ance
1400
1200
1000
800
600
400
1200
1000
800
600
Xon 19100 (19070 to 19170)
C23
C30
C29 XS
24
32
3000 3500 4000 4500 Xon 19100 (19070 to 19170)
5000
illle-15 oo 3000 3500 4000 4500 sooo
Figure S Distributionofbiomarmtcrpanes (mz 191) in the wnpleS (top) and the source
OrioWion (bottom) IS represents the inlemal standard C C C C C and
Crqxosem C and C terpane C and C ajl-bopane and 20Sl20R ofC and C
hopane isomer pain respeclively
Table 3 Alkylated PAH Homologue Distribution (microgg TSEM) and Diagnostic Ratios of PAHS Orimulsion Samples
water-in-oil droplets disperse in oil phase Orimulsion is an oil-in-water emulsion In order to stabilize the oil-in-water emulsion and prevent the water and bitumen from separation the surfactant added to Oriihulsion has to meet the following criteria (I) the hydrophilic-lipophilic balance (HLB) value ofthe surfactant must be high enough (2) the hydrophillic part of the surfactant molecules must be large enough to be able to dissolve in water (for example polyethoxylated octylphenol with average ethoxy units smaller than 7 is not dissolved in water and a dispersion forms) Only such surfactant molecules can effectively act by adsorbing at the oil-water interface forming a molecular film which behaves as a mechanical barrier that protects oil-in-water droplets from coalescence In addition as an economical consideration the surfactant must be inexpensive enough to keep the cost ofOrimulsion as low as possible
The best candidates which can meet such criteria are non-ionic surfactants which have relatively greater number ofethylene oxide (BO) units in the hydrophillic chain of molecules such as for example sorbitan ester surfactants Tween type surfactants polyethoxylated octylphenols polyethoxylated nonylphenols and polyethoxylated amine derivatives [10) It has been long established that the HLB values increase in direct proportion to the number of BO units of the molecule and that the surfactants having HLB values around IS can serve well as oil-in-water emulsifiers [10I I] For example the HLB values for nonylphenol ethoxylates with BO= IS 20 and 30 are lSO 160 and I 72 respectively Thus the range of searching for the best surfactant candidates is greatly narrowed As for identification ofthe unknown surfactant(s) used in Orimulsion it could be achieved through comparison ofits HPLC chromatographic pattern and behaviour and retention times ofresolved peaks to those structure-known surfactants
Figure 6 shows the chromatograms obtained from measurement ofthe surfactantshywater phase ofOrimulsion samples 10 and 8 In order to determine the surfactant used in Orimulsion over IS possible target nonionic surfactants were studied using HPLC and their chromatographic characteristics and patterns were carefully examined and compared with that of Orimulsion samples For examples Figure 7 presents representative chromatograms of polyethoxylated nonylphenol (B0=20) Tween-20 polyethoxylated cocoamine (BO=lS) and Triton X-114 These different types of surfactants show significantly different chromatographic behaviour But one common characteristic is that all of these surfactants have relatively high HLB values and relatively larger hydrophillic parts in their molecules (the separation and characterization ofsorbitan ester surfactants has been reported elsewhere [I213]) It can be clearly seen from comparison of Figures 6 and 7 that among all surfactants measured here the chromatogram of polyethoxyiated nonylphenoI (B0=20) matches chromatograms of surfactant in Orimulsion samples best Table 4 summarizes the chromatographic retention times of Orimulsion samples IO and 8 and polyethoxylated nonylphenol (B0=20) and Triton X-114 It is clear from Table 4 that the retention times of polyethoxylated nonylphenol (B0=20) oligomer peaks match samples IO and 8 extremely well
Figure 6 Figure 7 and Table 4 clearly demonstrate that (I) the chromatographic pattern and profile the distribution of oligomers of the unknown surfactant in Orimulsion shows great similarity to polyethoxylated (B0=20) nonylphenol but different from other possible target nonionic surfactants (2) the retention times of the oligomer peaks with varying BO numbers match to each other extremely well for the
10
-bull N ft bull
n
~ bull - ~ ~
n ~ N ~ N - t bull ~ bull
---middot~~-I - bull ~ ~ ~ bull N i
8
bull ~ nbull n ~ ~ n _ == N bull - bull --A -- bulln N~ n------ bulln - - bull ~
n
l ~
t = bullbull n
i N
- ~ ---- bull N N -N
Figure6 HPLC chromatograms of lllllples 10 and 11$ for IUdilctant analysis See chromatographic conditions in llxperimenta letlion
known and unknown surfactant Hence the surfactant used to emulsify Orimulsion is identified to be a polyethoxylated nqnylphenol surfactant with average EO number around 20 or greater (3) The oligomer8 with EO number from 8 to 24 in the Orimulsion surfactant were characterized Due to the detection limit and concentration limit oligomers with EO number smaller than 8 and greater than 24 were not characterized or not detected
It is noticed that there are several quite large early-eluted peaks (prior to -4 minutes) in Figure 6 which is thought most probably to be some water-soluble polar and aromatic compounds from oil hydrocarbons In order to confirm this hypothesis (naphthalene+ benzene)- hexane- Cold Lake Bitumen (CLB)-saturated water phase were analysed using HPLC under exact same analytical conditions as for analysing Orimulsion surfactant The CLB crude was chosen because it has similar physical properties and chemical composition to Orinoco bitumen Figure 8 presents chromatograms of (naphthalene + benzene)- hexane- Cold Lake Bitumen (CLB)shysaturated water phase For comparison purposes the HPLC chromatogram ofwatershysurfactant water phase of CLB dispersion is alsomiddotpresented in Figure 8 Compared to Figures S and 6 one can immediately conclude that those large early-eluted peaks before -4 minutes in the chromatograms are from Orinoco crude components and not from the added surfactant These oil components are most probably aromatic and polar compounds which have certain solubilities in water and are almost not retained by the column due to their relatively high polarity Fortunately they do not affect characterization and quantitation ofsurfactant oligomers
Estimation of concentration of the surfactant used for Orimulsion Because oflack ofVenezuela Orinoco crude the CLB crude was applied as the
reference oil to estimate the recovery of polyethoxylated nonylphenol (E0=20) from CLB-surfactant emulsion after passage through the Supelco Nylon 66 045 microm membrane The procedures used to estimate the recoveries ofethoxylated nonylphenol (E0=20) are as follows (1) 025 g of CLB crude and 250 mg of polyethoxylated nonylphenol (E0=20) approximately 1 of the crude were weighed and 10 mL of HPLC grade water was added (2) the mixture was vigorously shaken for 30 minutes then was filtered through 045 microm Nylon 66 membrane The oil particulates which stayed on the membrane were discarded the clean colourless surfactant-water phase was diluted to SO mL and the diluted surfactant solution was then injected to the HPLC for surfactant quantitation (see Figure 8) (3) 005 mgmL ofthe reference polyethoxylated nonylphenol (E0=20) water solution was directly injected into the HPLC tinder the same analytical conditions (4) triplicate analyses were performed to obtain the average of the total oligomer peak areas (S) the average ofthe total oligomer peak areas from samples was divided by the average of total areas from the reference polyethoxylated nonylphenol (E0=20) water solution to determine the recovery of the surfactant
The average recovery for polyethoxylated nonylphenol (E0=20) was determined to be 64plusmn3 (n=3) The mass loss of the surfactant is believed mainly due to the formation ofthe non-separative oil-surfactant particulates and adsorption of surfactant molecules on the membrane surface
The measured recovery factor was then applied to correct and estimate the true concentrations of the surfactant in Orimulsion The concentration of polyethoxylated nonylphenol in the source Orimulsion is estimated to be around 05
BA
c
D
Figures HPLC ohromatognuns for (beozene +naphthalene- (SA) hexane- (SB) and Cold
Lake Bitumen (ClB-saturated water phase (SC) and surfactant-water phase ofClB
dispersion (SD)
CONCLUSION
A reliable and effective combined method ofusing membrane filtration capillary GC and HPLC techniques has been developed and applied for separation characterization quantitation of petroleum hydrocarbons and nonionic surfactant in complicated oil-in-water dispersion samples used for aquatic toxicity tests The simplicity and directness of the method is obvious Identification of the surfactant in Orimulsion was achieved by (1) narrowing the searching range based on theoretical considerations and analysis and (2) comparing chromatographic profiles oligomer distribution patterns and retention times of oligomer peaks The surfactant in Orimulsion was identified as polyethoxylated nonylphenol with oligomers having EO numbers ranging from 8 to 24 (average EO units around 20) The concentration of polyethoxylated nonylphenol in the source Orimulsion was estimated to be around 05
ACKNOWLEDGEMENT The authors would like to thank Mr Michael Landriault and Mrs Lise Sigouin
for their help in performing the sample cleanup and drawing figures and tables
REFERENCES
[1] S L Ross Environmental Research Limited Behaviour and Control ofSpills of Orimulsiontrade 1987
[2] S L Ross Environmental Research Limited The Risk Fate and Behaviour of Orimulsiontrade Spills at Dalhousie N B 1992
[3] Zlantar M Orimulsion the revolutionary new fuel for power and industry Financial Times Business Information London 1989
[4] BITOR Comparative Summary Between Orimulsion Produced by the Primary Emulsification andDilution Methods BITOR May 1994
[5] Jokuty P Whiticar S Fingas M Wang Z Doe K Kyle D Lambert P and Fieldhouse B Orimulsion Physical Properties Chemical Composition Dispersibility and Toxicity September 1995
[6] Wang Z D Fingas M Li K J Chromatogr Sci 1994 32 361-366 [7] Wang Z D Fingas M Li K J Chromatogr Sci 1994 32 367-382 [8] Wang Z D Fingas M Sergy G Environ Sci Technol 1994 28 1733-1746 [9] Wang Z D and Fingas M Environ Sci Techno 1995 29 2842-2849 [10] Cross J ed Nonionic Surfactants Chemical Analysis Marcel Dekker New
York 1987 [ 11] Becher P in Nonionic Surfactants (M Schick ed) Marcel Dekker New York
1967 [12] Wang Z D and Fingas M HRC 1994 17 15-19 [13] Wang Z D and Fingas M HRC 1994 17 85-90
separation and characterization of petroleum hydrocarbons and surfactant in norimulsion dispersion samples
Emergenvies science division
abstract
10
-bull N ft bull
n
~ bull - ~ ~
n ~ N ~ N - t bull ~ bull
---middot~~-I - bull ~ ~ ~ bull N i
8
bull ~ nbull n ~ ~ n _ == N bull - bull --A -- bulln N~ n------ bulln - - bull ~
n
l ~
t = bullbull n
i N
- ~ ---- bull N N -N
Figure6 HPLC chromatograms of lllllples 10 and 11$ for IUdilctant analysis See chromatographic conditions in llxperimenta letlion
known and unknown surfactant Hence the surfactant used to emulsify Orimulsion is identified to be a polyethoxylated nqnylphenol surfactant with average EO number around 20 or greater (3) The oligomer8 with EO number from 8 to 24 in the Orimulsion surfactant were characterized Due to the detection limit and concentration limit oligomers with EO number smaller than 8 and greater than 24 were not characterized or not detected
It is noticed that there are several quite large early-eluted peaks (prior to -4 minutes) in Figure 6 which is thought most probably to be some water-soluble polar and aromatic compounds from oil hydrocarbons In order to confirm this hypothesis (naphthalene+ benzene)- hexane- Cold Lake Bitumen (CLB)-saturated water phase were analysed using HPLC under exact same analytical conditions as for analysing Orimulsion surfactant The CLB crude was chosen because it has similar physical properties and chemical composition to Orinoco bitumen Figure 8 presents chromatograms of (naphthalene + benzene)- hexane- Cold Lake Bitumen (CLB)shysaturated water phase For comparison purposes the HPLC chromatogram ofwatershysurfactant water phase of CLB dispersion is alsomiddotpresented in Figure 8 Compared to Figures S and 6 one can immediately conclude that those large early-eluted peaks before -4 minutes in the chromatograms are from Orinoco crude components and not from the added surfactant These oil components are most probably aromatic and polar compounds which have certain solubilities in water and are almost not retained by the column due to their relatively high polarity Fortunately they do not affect characterization and quantitation ofsurfactant oligomers
Estimation of concentration of the surfactant used for Orimulsion Because oflack ofVenezuela Orinoco crude the CLB crude was applied as the
reference oil to estimate the recovery of polyethoxylated nonylphenol (E0=20) from CLB-surfactant emulsion after passage through the Supelco Nylon 66 045 microm membrane The procedures used to estimate the recoveries ofethoxylated nonylphenol (E0=20) are as follows (1) 025 g of CLB crude and 250 mg of polyethoxylated nonylphenol (E0=20) approximately 1 of the crude were weighed and 10 mL of HPLC grade water was added (2) the mixture was vigorously shaken for 30 minutes then was filtered through 045 microm Nylon 66 membrane The oil particulates which stayed on the membrane were discarded the clean colourless surfactant-water phase was diluted to SO mL and the diluted surfactant solution was then injected to the HPLC for surfactant quantitation (see Figure 8) (3) 005 mgmL ofthe reference polyethoxylated nonylphenol (E0=20) water solution was directly injected into the HPLC tinder the same analytical conditions (4) triplicate analyses were performed to obtain the average of the total oligomer peak areas (S) the average ofthe total oligomer peak areas from samples was divided by the average of total areas from the reference polyethoxylated nonylphenol (E0=20) water solution to determine the recovery of the surfactant
The average recovery for polyethoxylated nonylphenol (E0=20) was determined to be 64plusmn3 (n=3) The mass loss of the surfactant is believed mainly due to the formation ofthe non-separative oil-surfactant particulates and adsorption of surfactant molecules on the membrane surface
The measured recovery factor was then applied to correct and estimate the true concentrations of the surfactant in Orimulsion The concentration of polyethoxylated nonylphenol in the source Orimulsion is estimated to be around 05
BA
c
D
Figures HPLC ohromatognuns for (beozene +naphthalene- (SA) hexane- (SB) and Cold
Lake Bitumen (ClB-saturated water phase (SC) and surfactant-water phase ofClB
dispersion (SD)
CONCLUSION
A reliable and effective combined method ofusing membrane filtration capillary GC and HPLC techniques has been developed and applied for separation characterization quantitation of petroleum hydrocarbons and nonionic surfactant in complicated oil-in-water dispersion samples used for aquatic toxicity tests The simplicity and directness of the method is obvious Identification of the surfactant in Orimulsion was achieved by (1) narrowing the searching range based on theoretical considerations and analysis and (2) comparing chromatographic profiles oligomer distribution patterns and retention times of oligomer peaks The surfactant in Orimulsion was identified as polyethoxylated nonylphenol with oligomers having EO numbers ranging from 8 to 24 (average EO units around 20) The concentration of polyethoxylated nonylphenol in the source Orimulsion was estimated to be around 05
ACKNOWLEDGEMENT The authors would like to thank Mr Michael Landriault and Mrs Lise Sigouin
for their help in performing the sample cleanup and drawing figures and tables
REFERENCES
[1] S L Ross Environmental Research Limited Behaviour and Control ofSpills of Orimulsiontrade 1987
[2] S L Ross Environmental Research Limited The Risk Fate and Behaviour of Orimulsiontrade Spills at Dalhousie N B 1992
[3] Zlantar M Orimulsion the revolutionary new fuel for power and industry Financial Times Business Information London 1989
[4] BITOR Comparative Summary Between Orimulsion Produced by the Primary Emulsification andDilution Methods BITOR May 1994
[5] Jokuty P Whiticar S Fingas M Wang Z Doe K Kyle D Lambert P and Fieldhouse B Orimulsion Physical Properties Chemical Composition Dispersibility and Toxicity September 1995
[6] Wang Z D Fingas M Li K J Chromatogr Sci 1994 32 361-366 [7] Wang Z D Fingas M Li K J Chromatogr Sci 1994 32 367-382 [8] Wang Z D Fingas M Sergy G Environ Sci Technol 1994 28 1733-1746 [9] Wang Z D and Fingas M Environ Sci Techno 1995 29 2842-2849 [10] Cross J ed Nonionic Surfactants Chemical Analysis Marcel Dekker New
York 1987 [ 11] Becher P in Nonionic Surfactants (M Schick ed) Marcel Dekker New York
1967 [12] Wang Z D and Fingas M HRC 1994 17 15-19 [13] Wang Z D and Fingas M HRC 1994 17 85-90
separation and characterization of petroleum hydrocarbons and surfactant in norimulsion dispersion samples
Emergenvies science division
abstract
middot
Table 4 Comparison of HPLC Retention Times of Ori-Surfactant with Polyethoxylated Nonylphenol (EO =20)
known and unknown surfactant Hence the surfactant used to emulsify Orimulsion is identified to be a polyethoxylated nqnylphenol surfactant with average EO number around 20 or greater (3) The oligomer8 with EO number from 8 to 24 in the Orimulsion surfactant were characterized Due to the detection limit and concentration limit oligomers with EO number smaller than 8 and greater than 24 were not characterized or not detected
It is noticed that there are several quite large early-eluted peaks (prior to -4 minutes) in Figure 6 which is thought most probably to be some water-soluble polar and aromatic compounds from oil hydrocarbons In order to confirm this hypothesis (naphthalene+ benzene)- hexane- Cold Lake Bitumen (CLB)-saturated water phase were analysed using HPLC under exact same analytical conditions as for analysing Orimulsion surfactant The CLB crude was chosen because it has similar physical properties and chemical composition to Orinoco bitumen Figure 8 presents chromatograms of (naphthalene + benzene)- hexane- Cold Lake Bitumen (CLB)shysaturated water phase For comparison purposes the HPLC chromatogram ofwatershysurfactant water phase of CLB dispersion is alsomiddotpresented in Figure 8 Compared to Figures S and 6 one can immediately conclude that those large early-eluted peaks before -4 minutes in the chromatograms are from Orinoco crude components and not from the added surfactant These oil components are most probably aromatic and polar compounds which have certain solubilities in water and are almost not retained by the column due to their relatively high polarity Fortunately they do not affect characterization and quantitation ofsurfactant oligomers
Estimation of concentration of the surfactant used for Orimulsion Because oflack ofVenezuela Orinoco crude the CLB crude was applied as the
reference oil to estimate the recovery of polyethoxylated nonylphenol (E0=20) from CLB-surfactant emulsion after passage through the Supelco Nylon 66 045 microm membrane The procedures used to estimate the recoveries ofethoxylated nonylphenol (E0=20) are as follows (1) 025 g of CLB crude and 250 mg of polyethoxylated nonylphenol (E0=20) approximately 1 of the crude were weighed and 10 mL of HPLC grade water was added (2) the mixture was vigorously shaken for 30 minutes then was filtered through 045 microm Nylon 66 membrane The oil particulates which stayed on the membrane were discarded the clean colourless surfactant-water phase was diluted to SO mL and the diluted surfactant solution was then injected to the HPLC for surfactant quantitation (see Figure 8) (3) 005 mgmL ofthe reference polyethoxylated nonylphenol (E0=20) water solution was directly injected into the HPLC tinder the same analytical conditions (4) triplicate analyses were performed to obtain the average of the total oligomer peak areas (S) the average ofthe total oligomer peak areas from samples was divided by the average of total areas from the reference polyethoxylated nonylphenol (E0=20) water solution to determine the recovery of the surfactant
The average recovery for polyethoxylated nonylphenol (E0=20) was determined to be 64plusmn3 (n=3) The mass loss of the surfactant is believed mainly due to the formation ofthe non-separative oil-surfactant particulates and adsorption of surfactant molecules on the membrane surface
The measured recovery factor was then applied to correct and estimate the true concentrations of the surfactant in Orimulsion The concentration of polyethoxylated nonylphenol in the source Orimulsion is estimated to be around 05
BA
c
D
Figures HPLC ohromatognuns for (beozene +naphthalene- (SA) hexane- (SB) and Cold
Lake Bitumen (ClB-saturated water phase (SC) and surfactant-water phase ofClB
dispersion (SD)
CONCLUSION
A reliable and effective combined method ofusing membrane filtration capillary GC and HPLC techniques has been developed and applied for separation characterization quantitation of petroleum hydrocarbons and nonionic surfactant in complicated oil-in-water dispersion samples used for aquatic toxicity tests The simplicity and directness of the method is obvious Identification of the surfactant in Orimulsion was achieved by (1) narrowing the searching range based on theoretical considerations and analysis and (2) comparing chromatographic profiles oligomer distribution patterns and retention times of oligomer peaks The surfactant in Orimulsion was identified as polyethoxylated nonylphenol with oligomers having EO numbers ranging from 8 to 24 (average EO units around 20) The concentration of polyethoxylated nonylphenol in the source Orimulsion was estimated to be around 05
ACKNOWLEDGEMENT The authors would like to thank Mr Michael Landriault and Mrs Lise Sigouin
for their help in performing the sample cleanup and drawing figures and tables
REFERENCES
[1] S L Ross Environmental Research Limited Behaviour and Control ofSpills of Orimulsiontrade 1987
[2] S L Ross Environmental Research Limited The Risk Fate and Behaviour of Orimulsiontrade Spills at Dalhousie N B 1992
[3] Zlantar M Orimulsion the revolutionary new fuel for power and industry Financial Times Business Information London 1989
[4] BITOR Comparative Summary Between Orimulsion Produced by the Primary Emulsification andDilution Methods BITOR May 1994
[5] Jokuty P Whiticar S Fingas M Wang Z Doe K Kyle D Lambert P and Fieldhouse B Orimulsion Physical Properties Chemical Composition Dispersibility and Toxicity September 1995
[6] Wang Z D Fingas M Li K J Chromatogr Sci 1994 32 361-366 [7] Wang Z D Fingas M Li K J Chromatogr Sci 1994 32 367-382 [8] Wang Z D Fingas M Sergy G Environ Sci Technol 1994 28 1733-1746 [9] Wang Z D and Fingas M Environ Sci Techno 1995 29 2842-2849 [10] Cross J ed Nonionic Surfactants Chemical Analysis Marcel Dekker New
York 1987 [ 11] Becher P in Nonionic Surfactants (M Schick ed) Marcel Dekker New York
1967 [12] Wang Z D and Fingas M HRC 1994 17 15-19 [13] Wang Z D and Fingas M HRC 1994 17 85-90
separation and characterization of petroleum hydrocarbons and surfactant in norimulsion dispersion samples
Emergenvies science division
abstract
separation and characterization of petroleum hydrocarbons and surfactant in norimulsion dispersion samples