Page 1
University of Massachusetts Amherst University of Massachusetts Amherst
ScholarWorks@UMass Amherst ScholarWorks@UMass Amherst
Open Access Dissertations
9-2011
Separation of Carboxylic Acids From Aqueous Fraction of Fast Separation of Carboxylic Acids From Aqueous Fraction of Fast
Pyrolysis Bio-Oils Using Nanofiltration and Reverse Osmosis Pyrolysis Bio-Oils Using Nanofiltration and Reverse Osmosis
Membranes Membranes
Achyuta Vara Prasada Rao Teella University of Massachusetts Amherst, [email protected]
Follow this and additional works at: https://scholarworks.umass.edu/open_access_dissertations
Part of the Chemical Engineering Commons
Recommended Citation Recommended Citation Teella, Achyuta Vara Prasada Rao, "Separation of Carboxylic Acids From Aqueous Fraction of Fast Pyrolysis Bio-Oils Using Nanofiltration and Reverse Osmosis Membranes" (2011). Open Access Dissertations. 485. https://scholarworks.umass.edu/open_access_dissertations/485
This Open Access Dissertation is brought to you for free and open access by ScholarWorks@UMass Amherst. It has been accepted for inclusion in Open Access Dissertations by an authorized administrator of ScholarWorks@UMass Amherst. For more information, please contact [email protected] .
Page 2
SEPARATION OF CARBOXYLIC ACIDS FROM AQUEOUS FRACTION OF FAST
PYROLYSIS BIO-OILS USING NANOFILTRATION AND REVERSE OSMOSIS
MEMBRANES
A Dissertation Presented
by
ACHYUTA VARA PRASADA RAO TEELLA
Submitted to the Graduate School of the
University of Massachusetts Amherst in partial fulfillment
of the requirements for the degree of
DOCTOR OF PHILOSOPHY
September 2011
Chemical Engineering
Page 3
© Copyright by Achyuta Vara Prasada Rao Teella 2011
All Rights Reserve
Page 4
SEPARATION OF CARBOXYLIC ACIDS FROM AQUEOUS FRACTION OF FAST
PYROLYSIS BIO-OILS USING NANOFILTRATION AND REVERSE OSMOSIS
MEMBRANES
A Dissertation Presented
by
ACHYUTA VARA PRASADA RAO TEELLA
Approved as to style and content by:
_______________________________________
David M. Ford, Chair
_______________________________________
George W. Huber, Member
_______________________________________
Sankaran Thayumanavan, Member
____________________________________
T. J. (Lakis) Mountziaris, Department Head
Chemical Engineering
Page 5
iv
ACKNOWLEDGEMENTS
I would like to express my deepest regard and appreciation to my advisor, Prof. David M.
Ford, for his encouragement, guidance and support throughout my doctoral study. His patience,
good humor and kindness have left a lasting impression on me.
I would like express my gratitude to Prof. George W. Huber and Prof. Sankaran
Thayumanavan for being my committee membranes. Their flexibility, help, and suggestions
during the course of this research have been greatly appreciated. I am greatly indebted to Dr.
Suk Joon Yoo (John) for his help in building up our lab and for sharing all his experience and
knowledge. I am also thankful to Dr. Asad Javaid for his invaluable suggestions in preparing my
proposal. It was a wonderful experience working with him in the lab. I would like to thank Prof.
Ford’s entire group members for providing a friendly and fun environment in the group. I would
also like to thank all the Chemical Engineering Department staff members who either directly or
indirectly helped me in pursuit of my research.
I would like to thank all the people I met here at UMass that made my six years of stay
happy and memorable. I owe a special gratitude to my parents, my sister Hyma, and my brothers
Hari and Venu who always supported and believed in me. Their encouragement and
unconditional love made possible what I have today. Lastly I would like to acknowledge my
funding agencies. This work was supported by UMASS Chemical Engineering Department
through start-up fund and by the U. S. Department of Energy Office of Energy Efficiency and
Renewable Energy, under grant DE-FG36-08GO18212.
Page 6
v
ABSTRACT
SEPARATION OF CARBOXYLIC ACIDS FROM AQUEOUS FRACTION OF FAST
PYROLYSIS BIO-OILS USING NANOFILTRATION AND REVERSE OSMOSIS
MEMBRANES
SEPTEMBER 2011
ACHYUTA VARA PRASADA RAO TEELLA, B.TECH., ANDHRA UNIVERSITY;
M.TECH., INDIAN INSTITUTE OF TECHNOLOGY, BOMBAY;
Ph.D., UNIVERSITY OF MASSACHUSETTS AMHERST
Directed by: Professor David M. Ford
There has been a growing interest in renewable sources of energy due to an increase in
demand and potential shortages and environmental problems associated with fossil fuels. Bio-
oils, complex liquid fuels produced from fast pyrolysis of biomass, have been recognized as one
potential source of renewable energy. However, they cannot be utilized directly due to their high
viscosity, corrosiveness, and high char content. Bio-oils readily phase separate into aqueous
phase and organic phase upon addition of water. The aqueous fraction of bio oil (AFBO) is
convenient to process and contains sugars, organic acids, hydroxyacetone, hydroxyacetaldehyde,
furfural, phenols and other organic species that can potentially be converted to hydrogen,
alkanes, aromatics, or olefins. However, the acidity of AFBO (pH ~2.5) is relatively high due to
the presence of organic acids which can impose more demands on construction equipment of the
vessels and the upgrading process. Removal of acids is essential to use AFBO as a commercial
fuel or further upgrading into fuels or chemicals. Traditional separation techniques for the
Page 7
vi
removal of acids from AFBO, like ion exchange and distillation are not attractive due to practical
limitations.
Membrane-based separations have been increasingly employed due to their inherent
advantages over conventional separations methods. Pressure driven membrane processes like
nanofiltration (NF) and reverse osmosis (RO) have been used in chemical, electronics, textile,
petrochemical, pulp and paper, and food industries as well as for the treatment of municipal
wastewater and landfill leachates. However, these processes are targeted for aqueous systems
containing little or no organic solvents. The use of membranes to separate organic solvent
solutions or organic-rich aqueous solutions is still at a very early stage.
The feasibility of removing small organic acids from the AFBO using NF and RO
membranes was studied. Experiments were conducted with commercially available polymeric
NF and RO membranes and aqueous solutions of increasing complexity, i.e. single solute
solutions of acetic acid and glucose, binary solute solutions containing both acetic acid and
glucose, and a model AFBO containing acetic acid, glucose, formic acid, hydroxyacetone,
furfural, guaiacol, and catechol. Feed concentrations (up to 34 % solute by weight) close to those
in real AFBO were chosen. These were generally at least an order of magnitude higher than
previously studied in the literature for related membrane separations. Retention factors for single
and binary solutions of acetic acid and glucose were promising so that the separation was
expected to be feasible. However, all the membranes were irreversibly damaged when
experiments were conducted with the model AFBO due to the presence of guaiacol in the feed
solution. Experiments with model AFBO excluding guaiacol were also conducted. NF
membranes showed retention factors of glucose greater than 80% and of acetic acid less than -
15% when operated at transmembrane pressures near 60 bar. Finally, the solution-diffusion (SD)
Page 8
vii
model was applied to predict the permeate flux and solute retention and compared to the
experimental results.
In another study, we explored the potential of nanocomposite membranes in gas
separations. Solubility based membrane gas separation, in which the more soluble (and perhaps
slower-diffusing) species preferentially permeates through the membranes, has received
considerable attention due to both economic and environmental concerns. In this work, we
synthesized organic-inorganic nanocomposite membranes by decorating the surfaces of
commercially available alumina substrates with a selective organic material that is physically or
chemically anchored to the porous surfaces. Hyperbranched melamine-based dendrimers and
polydimethylsiloxane (PDMS) were used as filling agents. Separation factors for
propane/nitrogen and carbon dioxide/methane were obtained for modified membranes. The
separation performance of PDMS-alumina composite membranes was comparable to the
currently best known polymers being used for this type of application.
Page 9
viii
TABLE OF CONTENTS
Page
ACKNOWLEDGEMENTS ............................................................................................... iv
ABSTRACT .........................................................................................................................v
LIST OF TABLES ...............................................................................................................x
LIST OF FIGURES ........................................................................................................... xi
CHAPTER
1. INTRODUCTION ...................................................................................................1
2. LITERATURE REVIEW ........................................................................................5
2.1Bio-oil .....................................................................................................5
2.2 Acid Removal by Traditional Methods..................................................6
2.3 Membrane Separation Technology ........................................................7
2.4 Acid Removal by Membrane Technology ...........................................24
3. EXPERIMENTAL PROCEDURE ........................................................................26
3.1 Membranes and Chemicals ..................................................................26
3.2 Permeation Set-up ................................................................................28
3.3 Concentration Polarization ...................................................................30
3.4 Model Aqueous Solutions ....................................................................34
3.5 Membrane Pretreatment .......................................................................35
3.6 Chemical Analyses...............................................................................35
4. RESULTS AND DISCUSSION ............................................................................39
4.1 Pure Water Flux ...................................................................................39
4.2 Effects of Cross Flow Velocity on Retention ......................................39
4.3 Single-solute Solutions ........................................................................41
4.4 Mixed-solute Solutions ........................................................................43
4.5 Membrane Stability ..............................................................................46
4.6 Modified Model Aqueous Fraction of Bio-oil .....................................55
4.7 Effect of Concentration on Flux ..........................................................56
Page 10
ix
4.8 Effect of Membrane Pretreatment ........................................................59
4.9 Conclusions ..........................................................................................59
5. MODELING MEMBRANE TRANSPORT AND COMPARISON WITH
EXPERIMENTAL DATA .....................................................................................63
5.1 Classification of Membrane Models ....................................................63
5.2 Comparison of Experimental and Theoretical Data.............................74
5.3 Conclusions ..........................................................................................85
6. ORGANIC-INORGANI NANOCOMPOSITE MEMBRANES FOR GAS
SEPARATIONS ....................................................................................................86
6.1 Introduction ..........................................................................................86
6.2 Experimental ........................................................................................91
6.3 Results and Discussion ......................................................................102
6.4 Conclusions ........................................................................................112
7. CONCLUSIONS AND SUMMARY ..................................................................115
8. BIBLIOGRAPHY ................................................................................................118
Page 11
x
LIST OF TABLES
Table Page
2-1 Classification of membrane separation processes………………….……………......12
3-1 Membrane parameters. All data are from the manufacturers, except for the
permeability values in parentheses that were measured in this work………………..…..27
3-2 Composition of model aqueous fraction of bio-oil……………………………..……36
4-1 Variation of observed retention, Robs, with cross flow velocity ..................................42
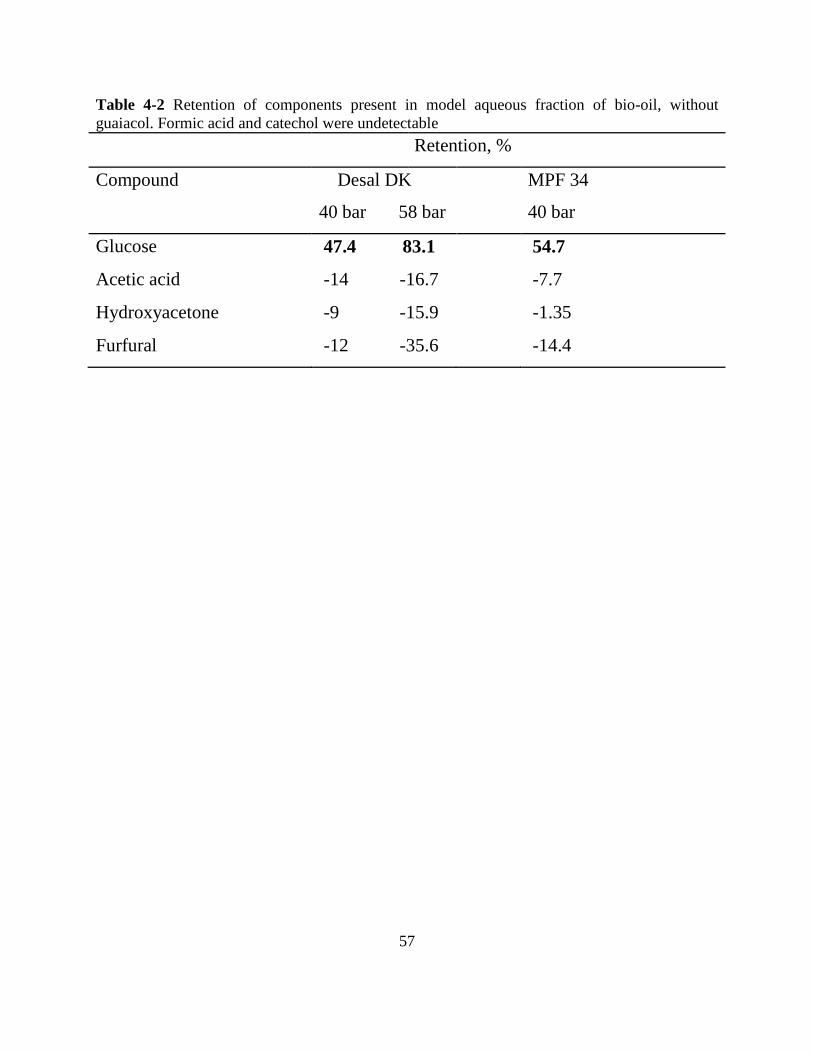
4-2 Retention of components present in model aqueous fraction of bio-oil,
without guaiacol. Formic acid and catechol were undetectable .......................................57
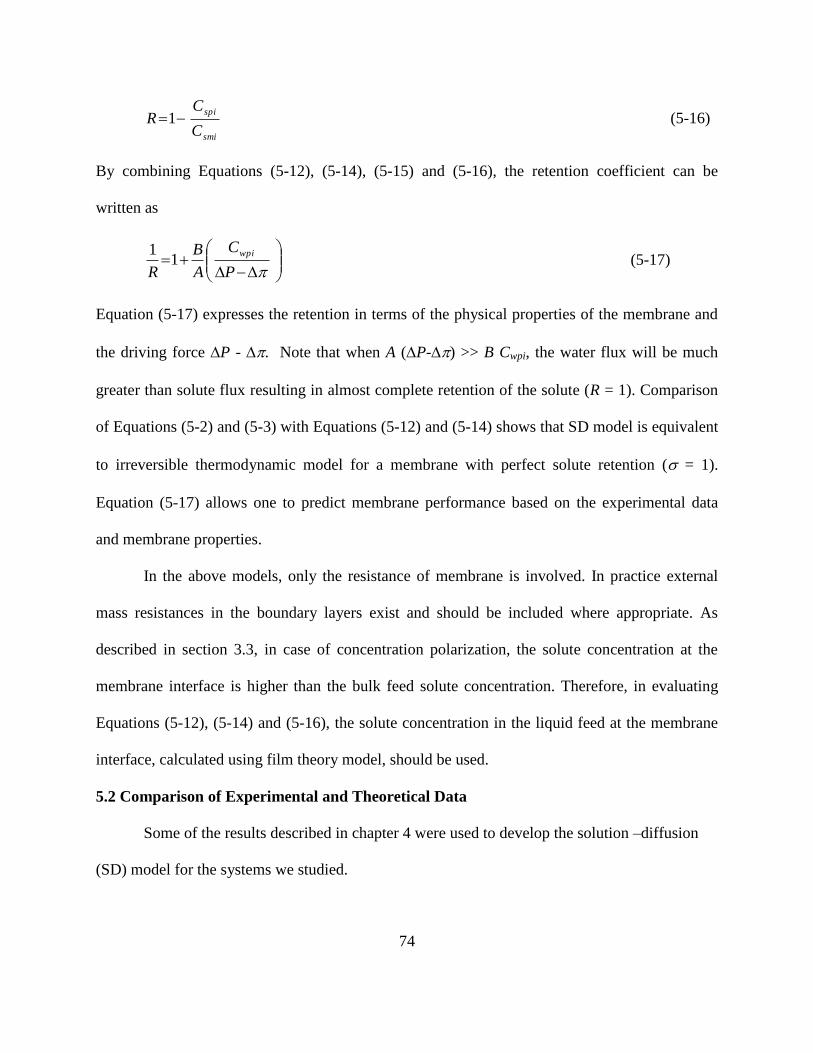
5-1 Pure water permeances of different membranes calculated from experiments.
Manufacturers’ data is provided in parenthesis for comparison .......................................77
6-1 Single gas permeance and selectivity data at 1.38 bar transmembrane
pressure for three untreated identical membranes ...........................................................103
6-2 Single gas permeance and selectivity data for dendrimer-modified
membranes at 1.38 bar transmembrane pressure for three identical membranes ............105
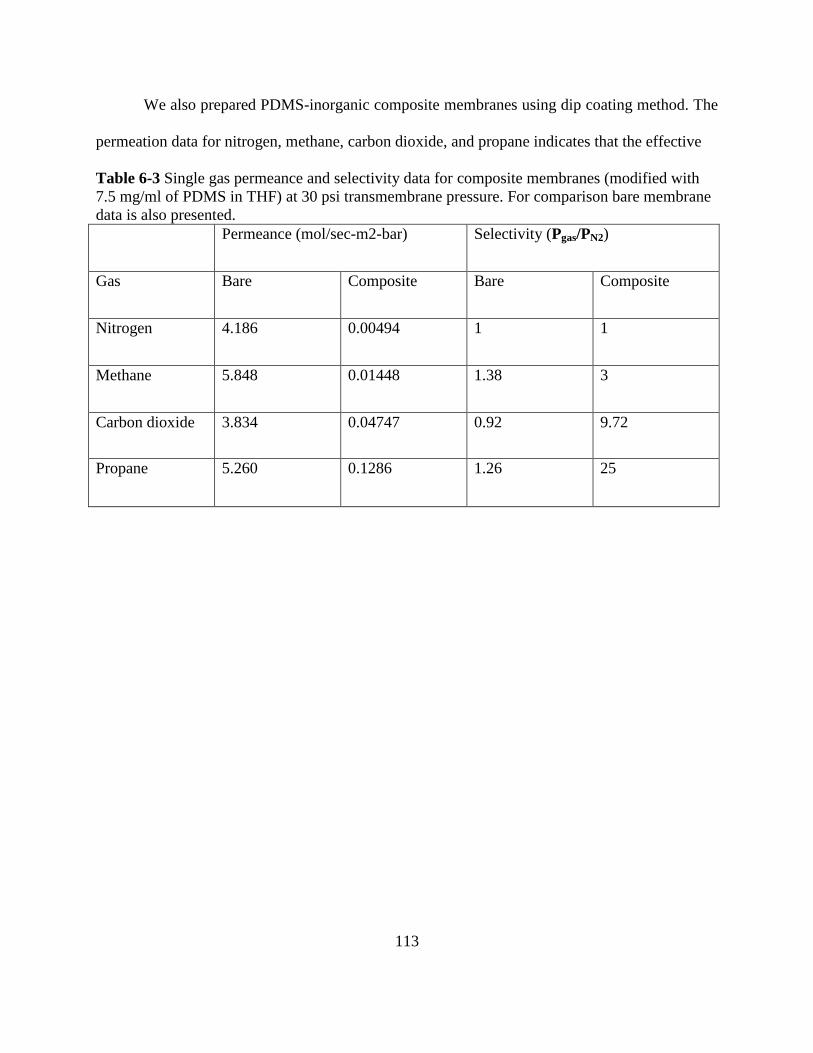
6-3 Single gas permeance and selectivity data for composite membranes
(modified with 7.5 mg/ml of PDMS in THF) at 30 psi transmembrane pressure.
For comparison bare membrane data is also presented ...................................................113
Page 12
xi
LIST OF FIGURES
Figure Page
2-1 Schematic drawing of the basic membrane process ....................................................10
2-2 Schematic diagrams of the principal types of membranes ..........................................14
2-3 Classification of pressure driven liquid phase membrane processes.....................17
2-4 A schematic demonstration of the relationship between osmosis, osmotic
equilibrium, and reverse osmosis.......................................................................................19
3-1 Schematic view of the membrane unit used................................................................29
3-2 Concentration polarization; concentration profile under steady-state
Condition............................................................................................................................32
3-3 Effect of pretreatment on pure water permeance for Desal DK membrane ................37
4-1 Use of velocity variation method to calculate the intrinsic retention Rint …………...40
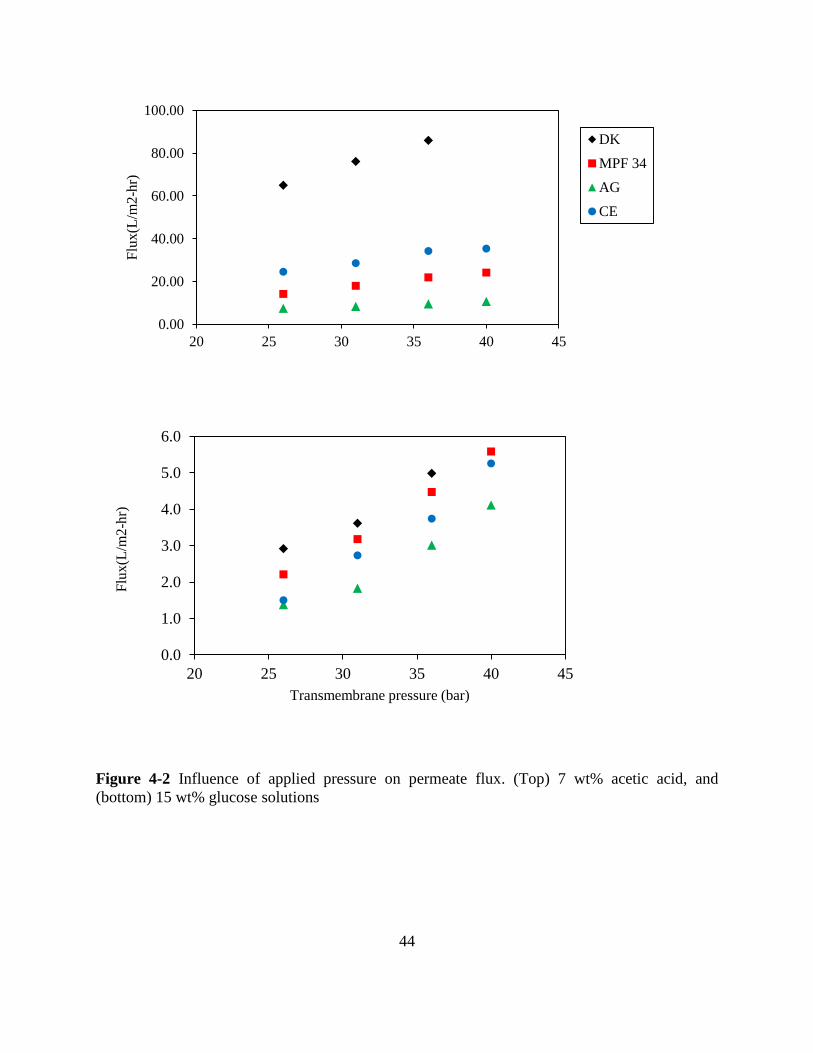
4-2 Influence of applied pressure on permeate flux. (Top) 7 wt% acetic acid,
and (bottom) 15 wt% glucose solutions.............................................................................44
4-3 Observed retention as a function of transmembrane pressure.
(Top) 7 wt% acetic acid (Bottom) 15 wt% glucose solutions...........................................45
4-4 Acetic acid retention vs. transmembrane pressure for mixed-solute solution
of 7 wt% acetic acid and 15wt % glucose, compared to 7 wt% acetic acid
retention in single-solute solution. Closed and open symbols represent single
and mixed solute retentions, respectively .........................................................................47
4-5 Glucose retention vs. transmembrane pressure for mixed-solute solution
of 7 wt% acetic acid and 15wt % glucose,compared to 15 wt% glucose
retention in single-solute solution. Closed and open symbols represent
single and mixed solute retentions, respectively…………………………………………48
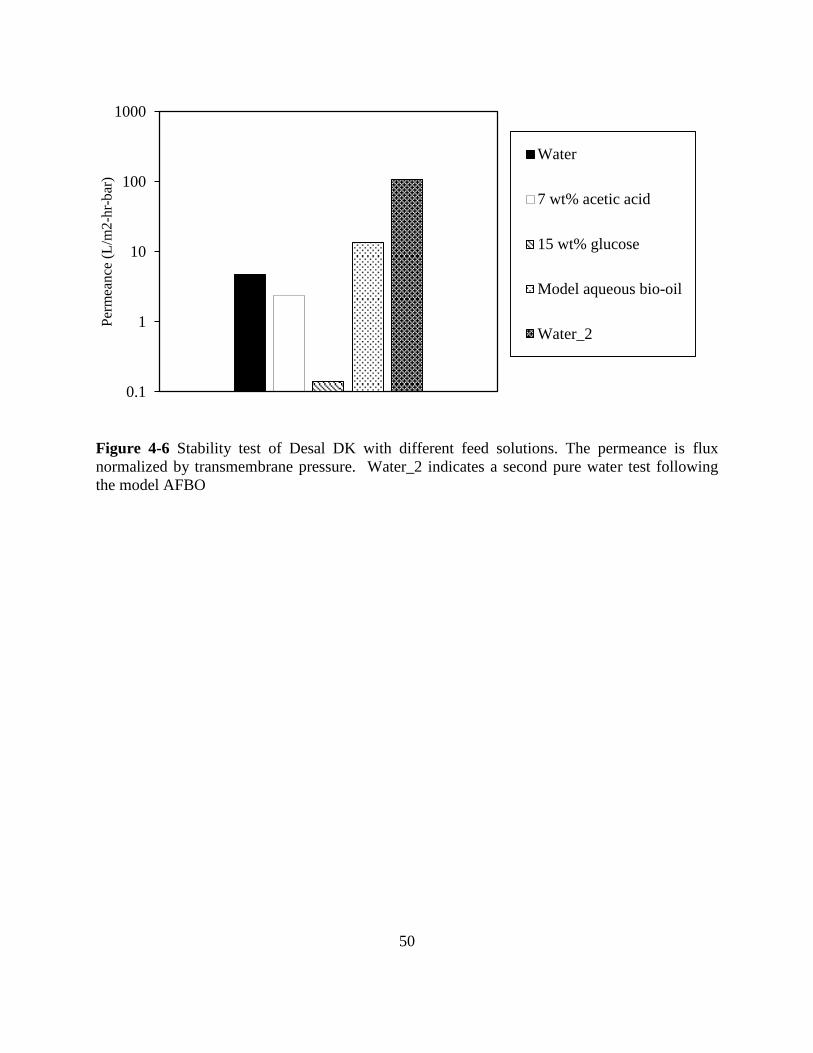
4-6 Stability test of Desal DK with different feed solutions. The permeance is
flux normalized by transmembrane pressure.Water_2 indicates a second
pure water test following the model AFBO ......................................................................50
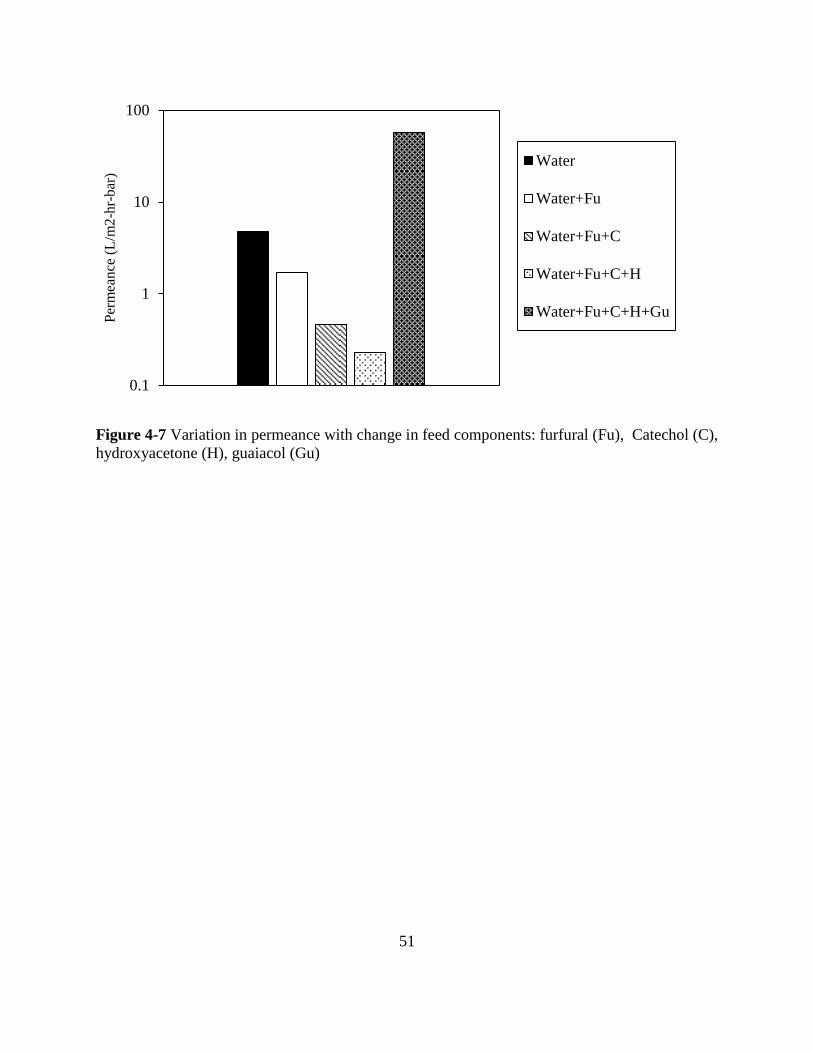
4-7 Variation in permeance with change in feed components: furfural (Fu),
Catechol (C), hydroxyacetone (H), guaiacol (Gu)……………………………………….51
Page 13
xii
4-8 Contents in feed solutions for Desal DK and MPF 34. (Top) Guaiacol
and (Bottom) Phenol .........................................................................................................53
4-9 Optical microscopic images. (A) Top layer and (B) Bottom layer of virgin
membrane (C) Top layer and (D) Bottom layer of guaiacol treated membrane………...54
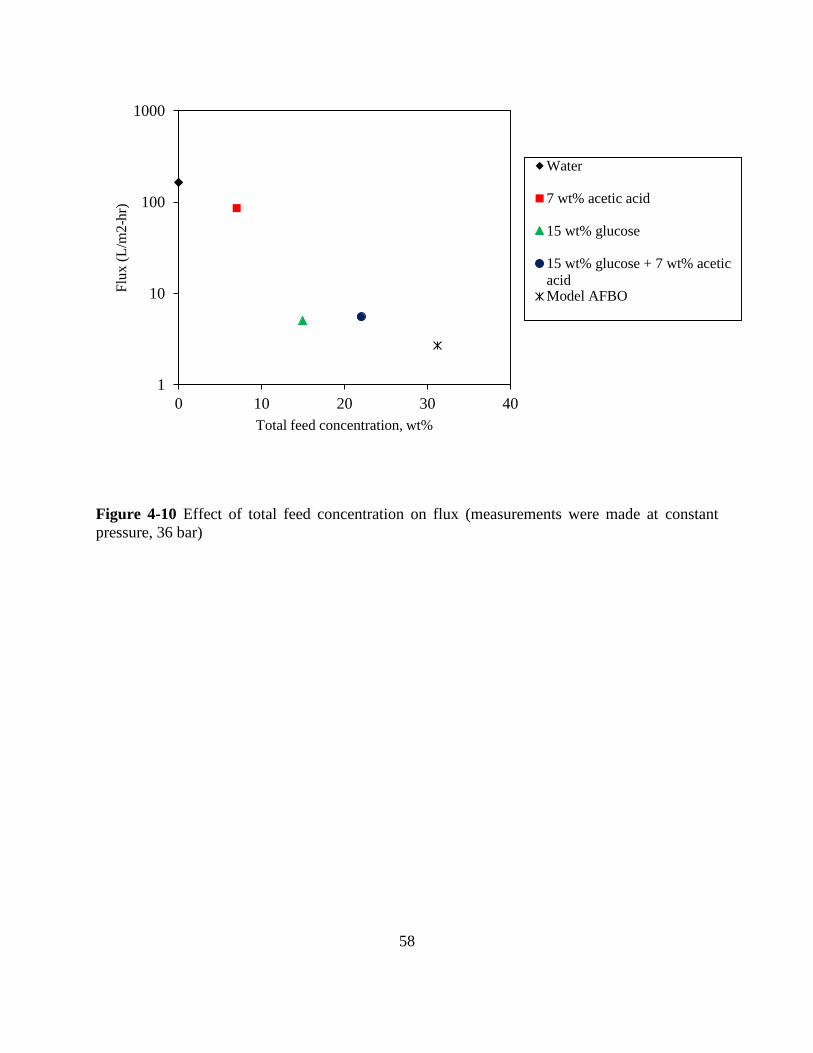
4-10 Effect of total feed concentration on flux (measurements were made at
constant pressure, 36 bar) ..................................................................................................58
4-11 Glucose retention vs. permeance of treated and untreated Desal DK
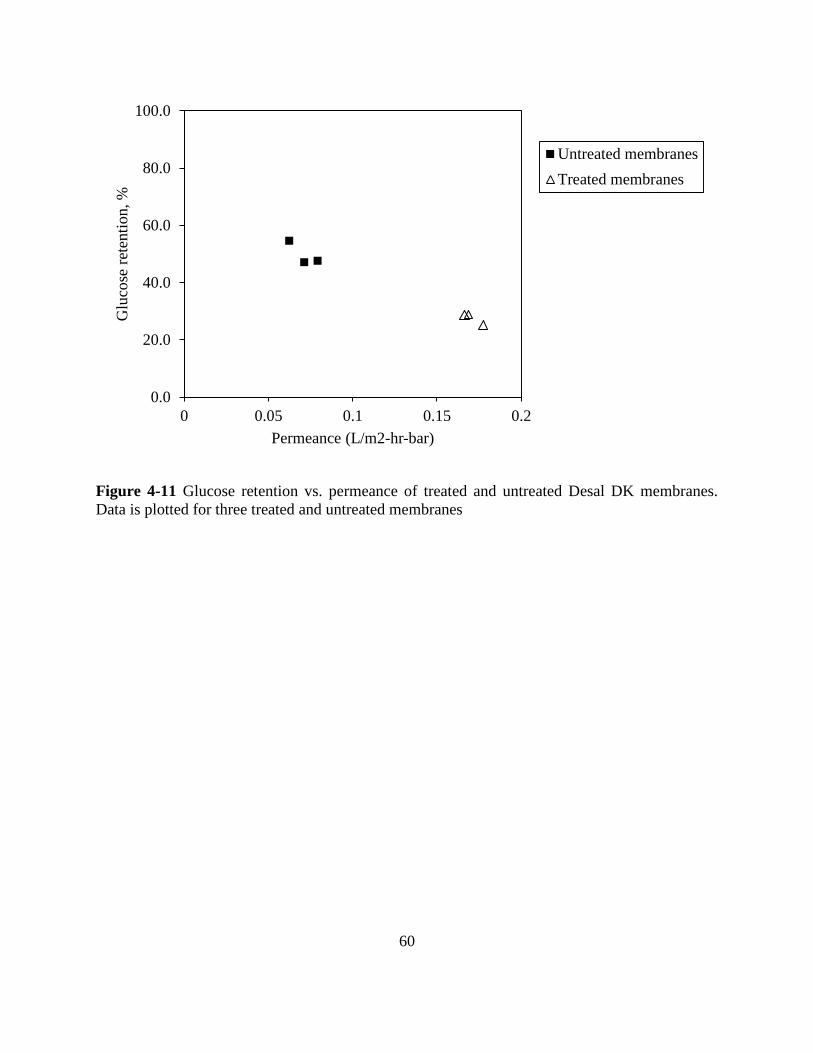
membranes. Data is plotted for three treated and untreated membranes………………..60
5-1 Schematic representation of the nominal pore size and the best theoretical
model for the principal membrane separation processes………………………………...67
5-2 Mechanisms of molecular transport through porous membranes.
(Flow is downward.) (a) Convective or bulk flow through pores; (b) diffusion
through pores; (c) restricted diffusion through pores……………………………………69
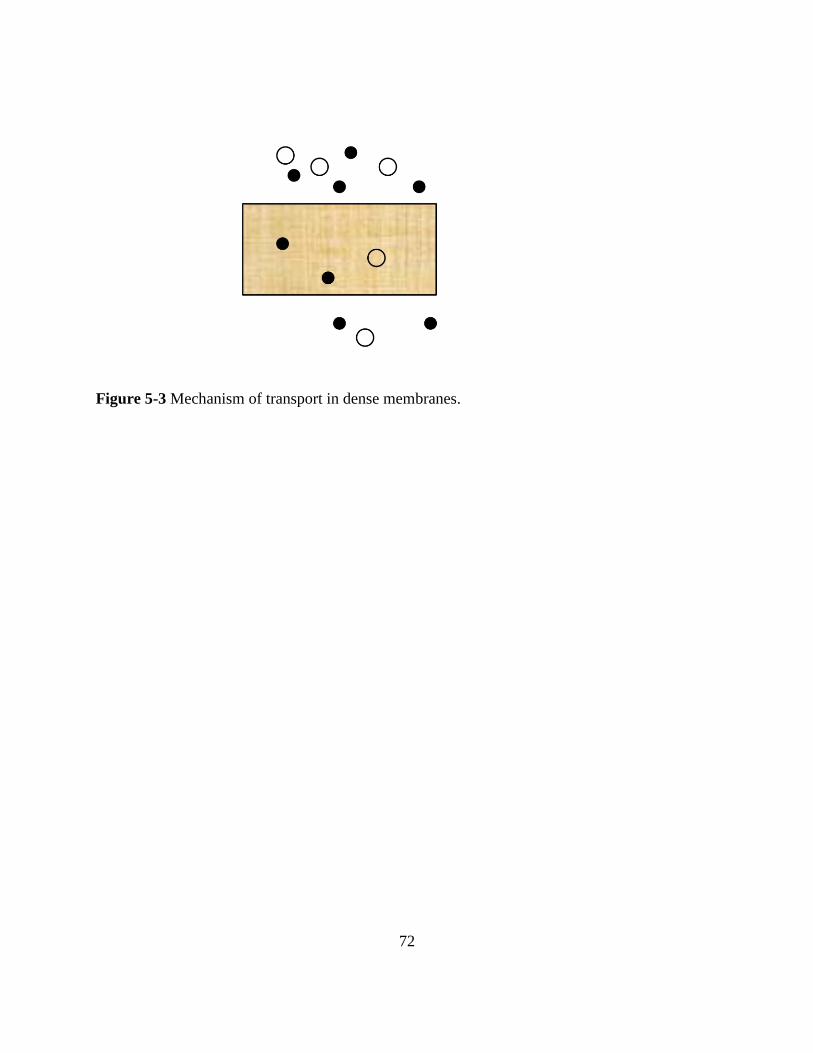
5-3 Mechanism of transport in dense membranes……………………………………….72
5-4 Pure water flux versus pressure drop of Desal DK NF membrane. • represents
.......................................................................76
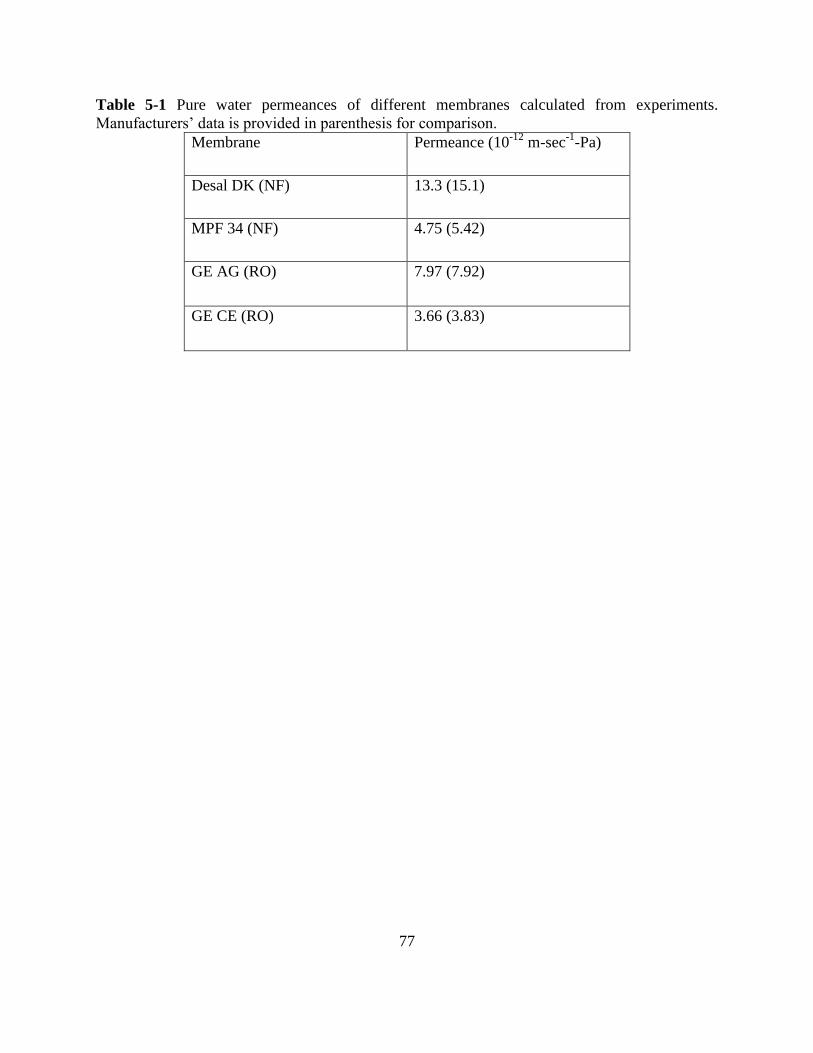
5-5 Influence of transmembrane membrane pressure on the water flux. Glucose
concentration is 15 wt%. (A) RO_AG (B) RO_CE (C) MPF 34 and (D) Desal DK…..79
5-6 Retentions as a function of transmembrane pressure. Glucose concentration
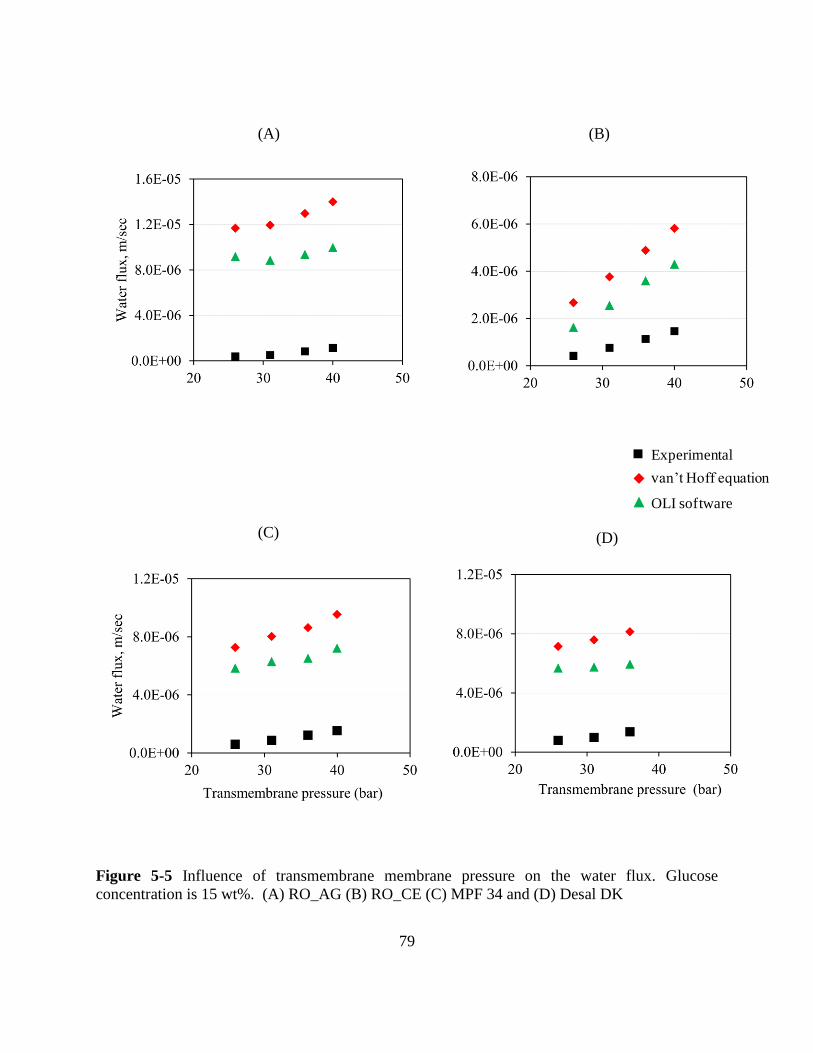
is 15 wt%. (A) RO_AG (B) RO_CE (C) MPF 34 and (D) Desal DK…………………..81
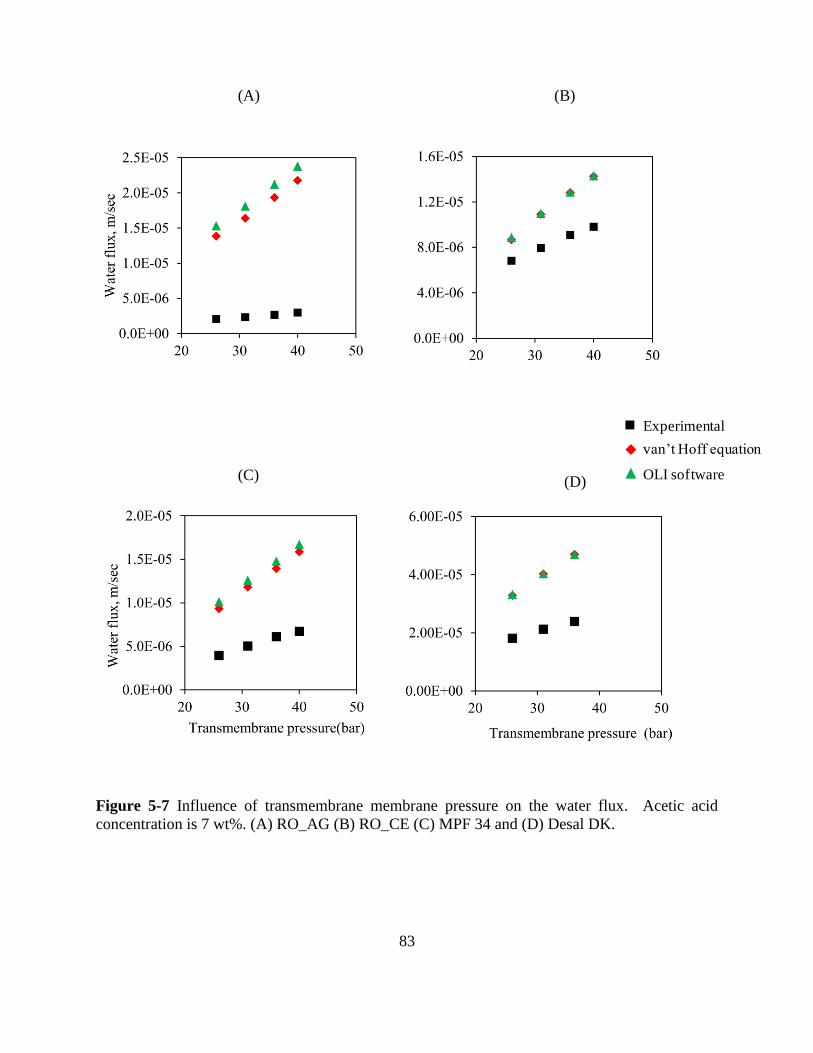
5-7 Influence of transmembrane membrane pressure on the water flux.
Acetic acid concentration is 7 wt%. (A) RO_AG (B) RO_CE (C) MPF 34
and (D) Desal DK ..............................................................................................................83
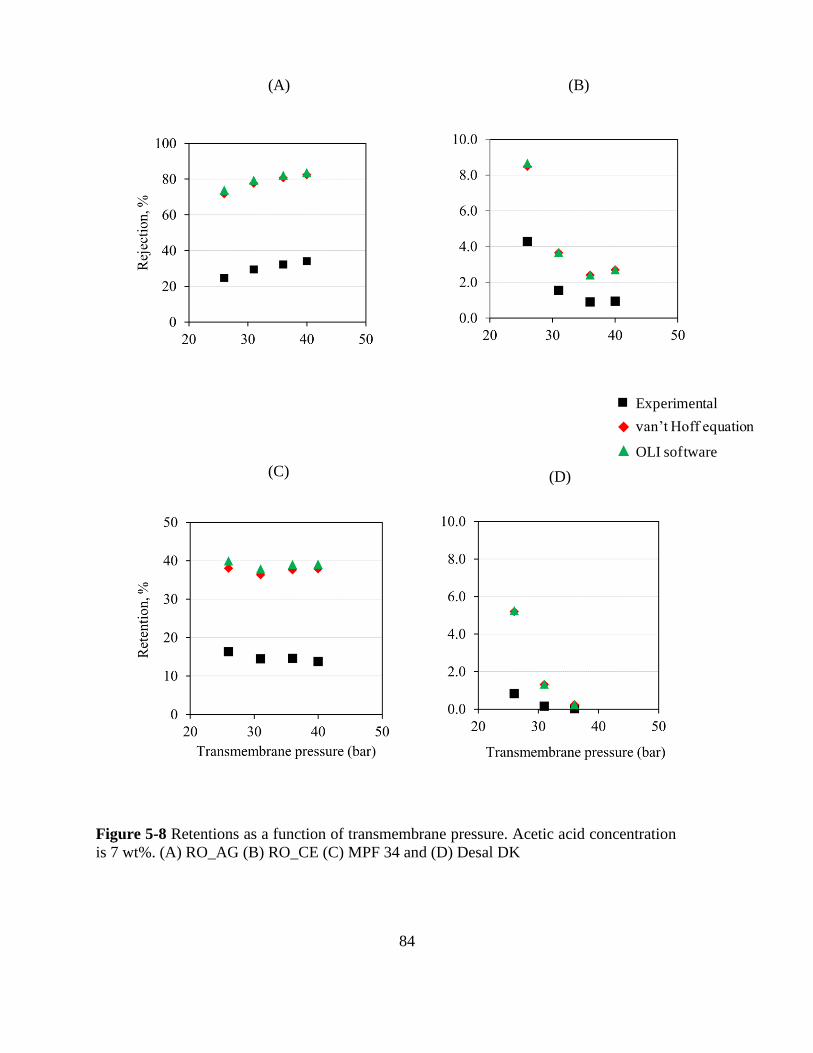
5-8 Retentions as a function of transmembrane pressure. Acetic acid
concentration is 7 wt%. (A) RO_AG (B) RO_CE (C) MPF 34 and (D) Desal DK……..84
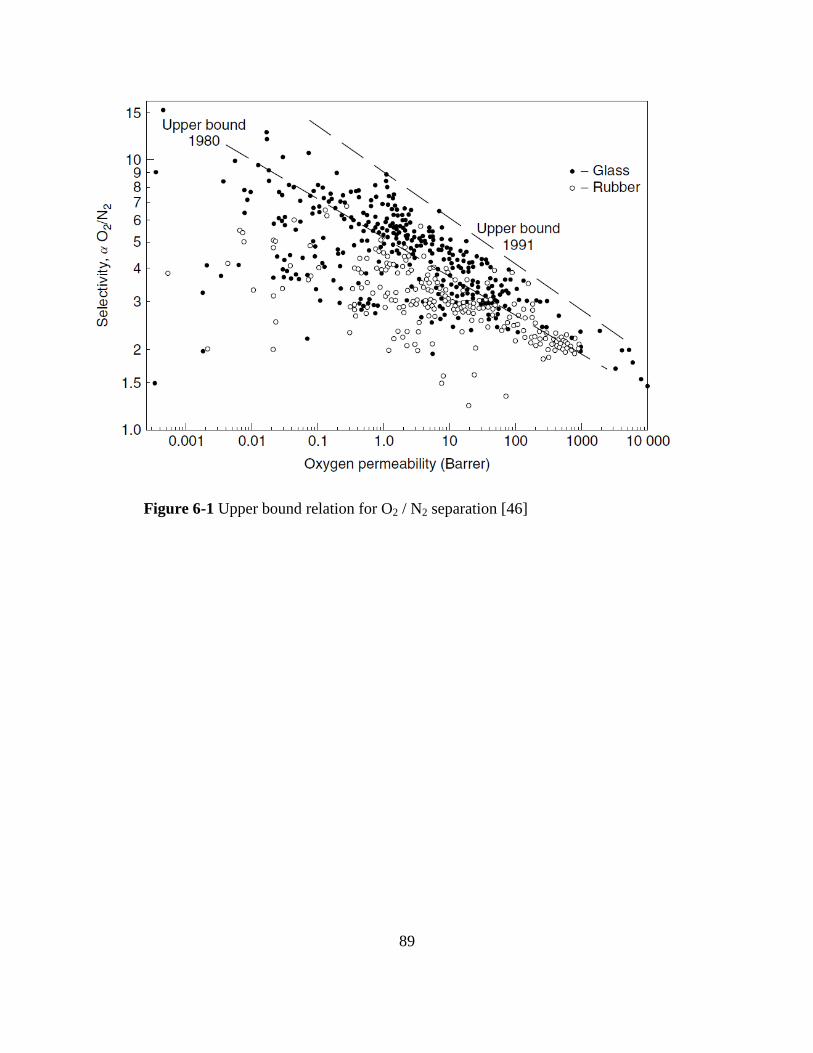
6-1 Upper bound relationship for O2 / N2 separation…………………………………….89
6-2 SEM image of 5 nm Membralox
alumina membrane……………………………..92
6-3 Growth of melamine-based dendrimer on the surface of the mesoporous
alumina membrane……………………………………………………………………….94
Page 14
xiii
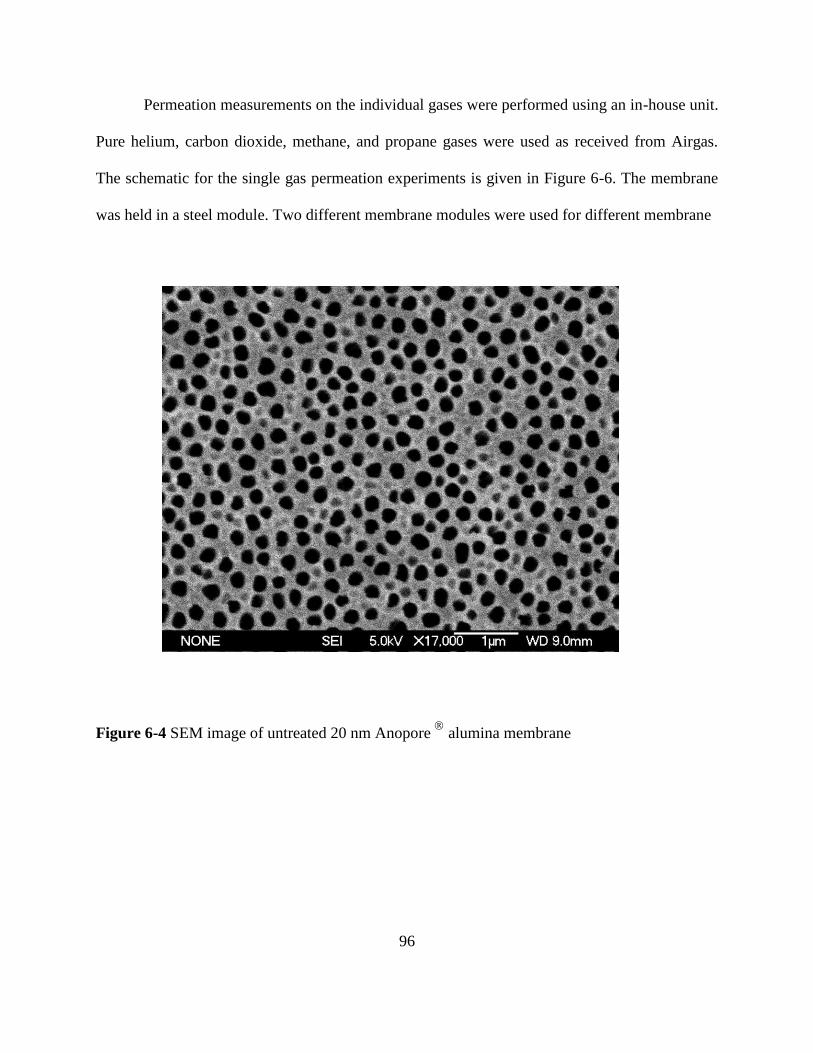
6-4 SEM image of untreated 20 nm Anopore
alumina membrane…………………….96
6-5 Schematic of the synthesis procedure..........................................................................97
6-6 Schematic of the dead-end pure gas permeation experiment......................................98
6-7 Nitrogen and propane permeances for MM24 untreated membrane,
as a function of transmembrane pressure ............................................................... 104
6-8 Effect of solvent rinsing/drying on propane and nitrogen permeances for
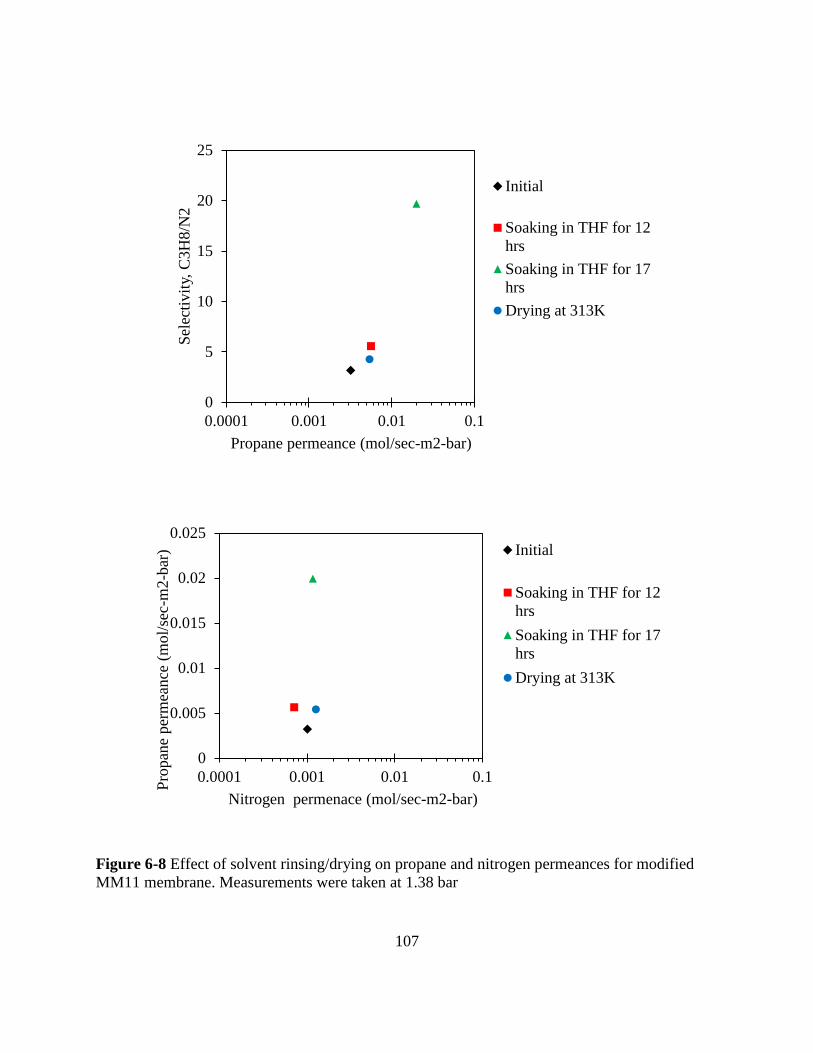
modified MM11 membrane. Measurements were taken at 1.38 bar ........................ 107
6-9 Plot of gas permeances and selectivities of different gas pairs for untreated
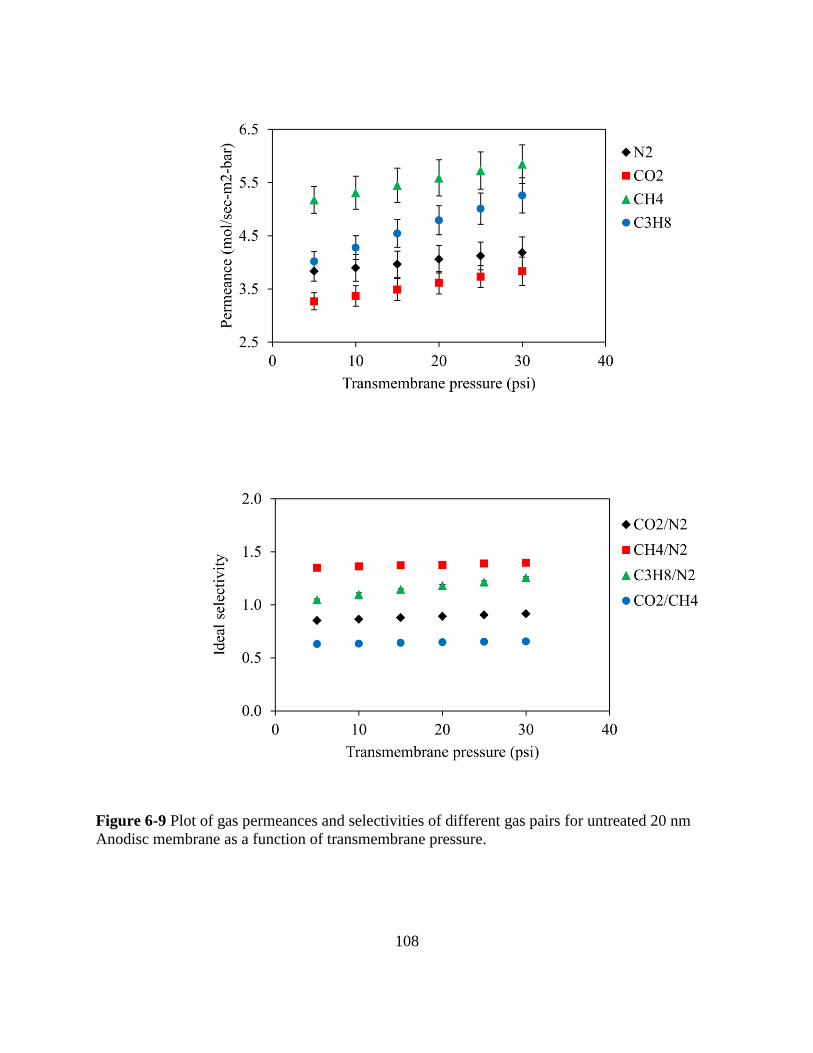
20 nm Anodisc membrane as a function of transmembrane pressure………………….108
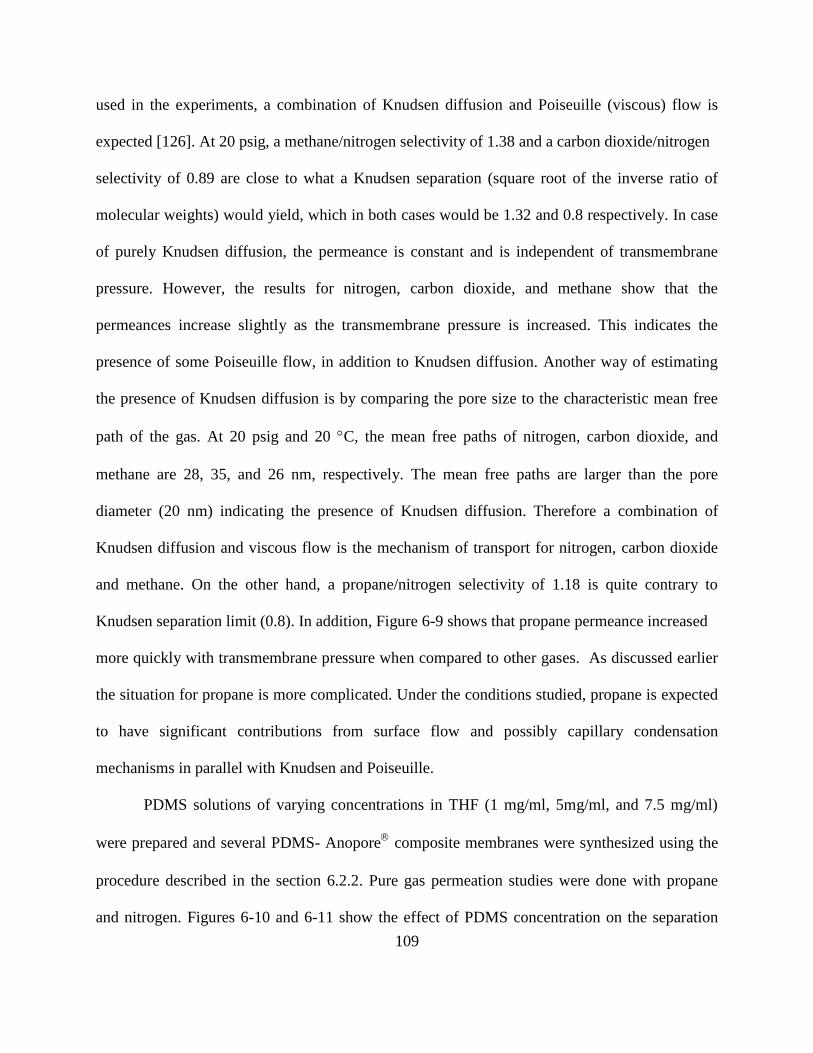
6-10 Permeances as a function of transmembrane pressure. Effect of PDMS
concentration and on nitrogen (Top) and propane (Bottom) permeance………………110
6-11 Propane/nitrogen selectivity as a function of transmembrane pressure.
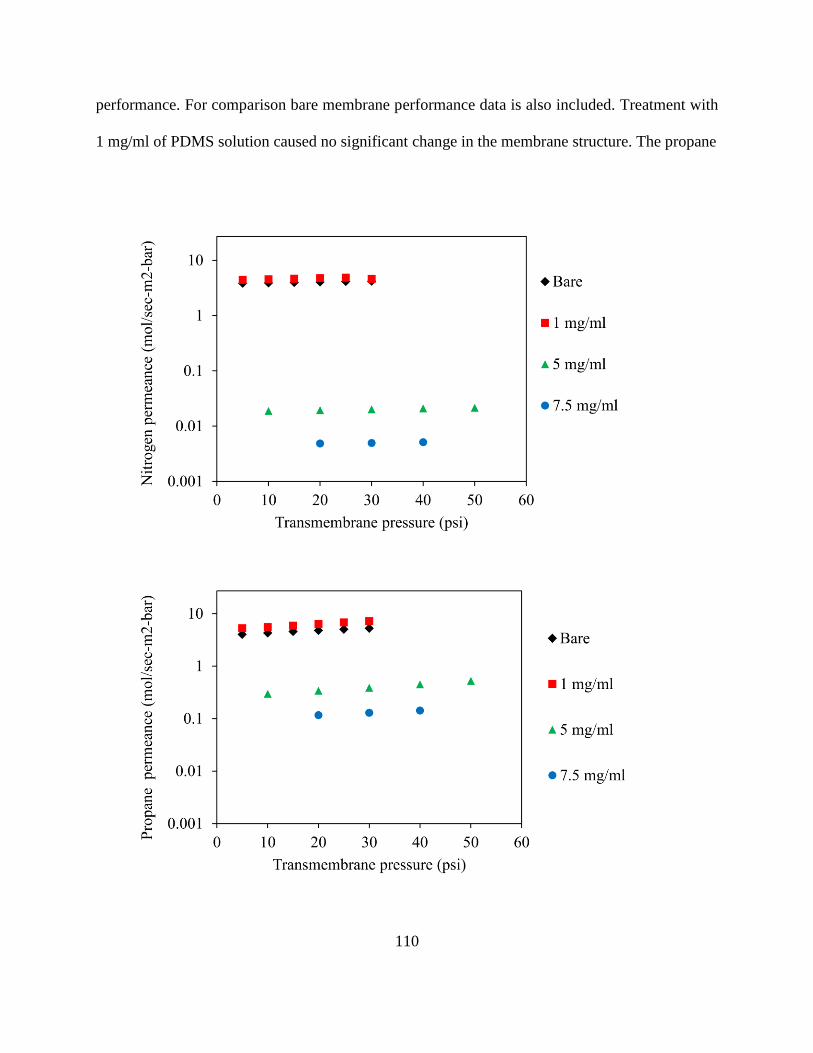
Effect of PDMS concentration………………………………………………………….111
Page 15
1
CHAPTER 1
INTRODUCTION
There is a growing interest in renewable sources of energy due to the economical,
political and environmental issues associated with fossil fuels [1]. Biomass is the only renewable
source of organic carbon. It is composed of polymers such as cellulose, hemicellulose and lignin.
The employment of these lignocellulosics directly as chemical feedstock is difficult due to their
complex structure, and thus they must be refined to forms that are easy and economical to use.
One of the promising technologies is fast pyrolysis of biomass to liquid fuels [2-4]. In fast
pyrolysis, bio-oil is produced by rapidly heating biomass to moderately high temperature (around
500 C) in the absence of oxygen followed by rapid quenching of the resulting vapors. Bio-oil is
a complex mixture of more than 300 compounds resulting from the depolymerization and
fragmentation of lignocellulosics [4]. However, the direct use of bio-oil as a fuel is limited due to
its poor fuel quality. The poor fuel quality of bio-oils is due to its high viscosity, corrosiveness
and high char content. Bio-oil can be separated into two phases by using water extraction: the
hydrophilic aqueous phase and the organophilic phase. Aqueous fraction of bio-oil (AFBO)
contains compounds like levoglucosan and glucose along with organic acids and other low
molecular weight hydrocarbons. The acidity (pH 2.5) of AFBO is relatively high due to the
presence of organic acids which can impose more demands processing equipment. Therefore
removal of acids is essential to use AFBO as a commercial fuel or as an intermediate in the
production of fuels and chemicals. Conventional acid removal methods are not attractive due to
economical and practical concerns. Membrane separation technology can be used as an
alternative for the deacidification of AFBO.
Page 16
2
Membrane separation technology has been employed in wide range of applications and
the number of such applications is growing rapidly. Today, membrane processes are used in
chemical, petrochemical, water treatment, food, dairy, pharmaceutical, paper, textile and
electronic industries [5, 6]. Membrane-based separations are often more capital and energy
efficient when compared to well-established separation processes like distillation, adsorption and
absorption.
Pressure driven membrane processes for liquid phase separations include microfiltration
(MF), ultrafiltration (UF), nanofiltration (NF) and reverse osmosis (RO). These processes can be
used to concentrate or purify a dilute (aqueous or non-aqueous) solution. Because of a driving
force, i.e., the transmembrane pressure, the solvent and various solute molecules permeate
through the membrane, while other molecules or particles are retained to various extents
dependent on the structure of the membrane. Membranes used for MF and UF applications are
typically porous and separation is accomplished by a size-sieving mechanism, where as NF and
RO membranes have an essentially non-porous separating layer and separation is governed by a
solution-diffusion mechanism.
Nanofiltration and reverse osmosis membranes for aqueous applications are quite similar
in chemical composition and membrane preparation. However, mass transport in NF is more
complicated than in RO because – in addition to solution-diffusion mechanism – size and charge
exclusion are also usually involved. Ideally, polymeric membranes for NF and RO should be
hydrophilic, resistant to chemicals, and microbial attack, and they should be mechanically,
thermally, and structurally stable over the long period of operation. Most of commercial RO and
NF membranes are polyamide-based thin film composites (TFCs). NF and RO are used when
low molecular weight solutes such as inorganic salts or small organic molecules such as glucose,
Page 17
3
and sucrose have to be separated from a solvent. The primary difference between NF and RO is
the size of the dissolved contaminants that can be removed. NF membranes are typically used for
bivalent hardness, calcium and magnesium plus sulphates and organics (sugars, dyes, and
pesticides) removal. RO membranes are typically used for total dissolved solids (TDS) and
monovalent ion removal (e.g., sea water and brackish water desalting, F-, and Cl
- removal).
However most of the applications are in water treatment, for drinking-water production [7],
desalination [8], wastewater treatment [9] and process water recycling [10].
The use of membranes to separate organic solvent solutions is still at a very early stage.
A difficult problem that prevented the utilization of NF and RO in organic solvents for a long
time was the limited stability of polymeric NF and RO membranes, and the lack of ceramic
nanofiltration membranes. For polymeric membranes various problems occurred: nonselective
flux due to membrane swelling [11], zero flux due to membrane collapse [11], membrane
deterioration [12], poor separation quality [13], etc. Developing membranes for processing
organic solvent solutions is more challenging than conventional NF and RO membranes because
different membranes must be developed for each type of solvent. The first solvent-permeable
membrane is the Starmem
series of solvent-resistant membranes developed by W. R. Grace
[14]. These membranes found their first large scale commercial use in the separation of methyl
ethyl ketone-toluene solvent mixture from lube oil [15]. Development of such solvent resistant
membranes is essential in expanding membrane technology to more important refining
operations, such as fractionation of linear and branched paraffins, or the separation of benzene
and other aromatics from paraffins and olefins in the gasoline pool.
The objective of this research was to implement membrane technology to reduce the
acidity of AFBO, thus stabilizing it for long-term storage and further processing. The main goal
Page 18
4
was to reject low molecular weight acids while retaining glucose and other heavier compounds.
Different commercially available NF and RO membranes were examined for the separation. The
effects of pretreatment, cross flow velocity, pressure and concentration on membrane
performance were explored. Chemical compatibility of these membranes against different
organic compounds was investigated.
The outline of this dissertation is as follows. Chapter II provides a background on fast
pyrolysis bio-oil and review of membrane separations used for acid removal. Chapter III
describes the experimental procedure for liquid permeation experiments and list of
chromatographic analyses used. The results and discussion of these permeation experiments are
given in Chapter IV. Chapter V details the comparison of experimental results with solution-
diffusion (SD) model calculations for single solute solutions of glucose and acetic acid. Chapter
VI details the background, experimental procedure and results and discussion of synthesis of
organic-inorganic composite membranes and their gas permeance characteristics. Finally,
Chapter VII discusses our major conclusions and gives the summary of the work conducted.
Page 19
5
CHAPTER 2
LITERATURE REVIEW
2.1. Bio-oil
Biomass is one of the main renewable energy resources available and offers the only
source of renewable solid, liquid and gaseous fuels [3, 16]. Biomass is composed of polymers
such as cellulose, hemicellulose and lignin. The utilization of these lignocellulosics directly as
chemical feedstock is difficult due to their complex structure, and thus they must be refined to
more convenient forms.
One of the simplest refining technologies is fast pyrolysis [4, 17, 18]. Fast pyrolysis is a
moderately high temperature (around 500 C) process in which biomass is rapidly heated in the
absence of oxygen and the resulting vapors are cooled to give a liquid product called bio-oil.
Depending on its source, bio-oil typically contains organics (about 70-80 wt %) of varying
polarity and water (about 20-30 wt %) [3, 19]. Organics include acids (formic, acetic,
propanoic), aldehydes (acetaldehyde, hydroxyacetaldehyde), ketones (acetone, hydroxyacetone,
hydroxybutanone), sugars (glucose, xylose, fructose), alcohols, esters, furans, furfurals,
guaiacols, and some micron sized char particles. The low cost of bio-oil production by fast
pyrolysis makes it a competitive technology compared to other biofuel technologies such as
gasification and cellulosic ethanol [20-23]. However, the direct use of bio-oil as a replacement
for petroleum derived liquid transportation fuel is limited due to its insolubility in petroleum
derived fuels, corrosiveness, phase instability, high viscosity, and high char content. The
composition of the bio-oil, storage conditions, and storage time affect the properties [24]. Further
processing is necessary to stabilize or upgrade it.
Page 20
6
Bio-oil can be separated into an aqueous phase and a heavier organic phase upon addition
of water. The aqueous fraction of bio-oil (AFBO) contains sugars, organic acids,
hydroxyacetone, hydroxyacetaldehyde, furfural, and small amounts of guaiacols that may be
further upgraded to produce hydrogen, alkanes, aromatics, or olefins [25-28]. However, the
acidity of AFBO is relatively high (pH 2.5) due to the presence of organic acids, which can
cause corrosion in downstream processing equipment that is made of low quality materials (e.g.
carbon steel). Furthermore, the organic acids could be valuable byproducts if they could be
separated and sold. Therefore, removal of acids is important to the use of AFBO as an
intermediate in the production of fuels and chemicals.
2.2 Acid Removal by Traditional Methods
There are several possible techniques for the removal of acids from AFBO. A related
separation, the removal of acetic acid from hemicellulosic hydrolysates (mixture of five and six
carbon sugars obtained from hydrolysis of hemicellulose), has been done with ion exchange
resins [29]. However, resin based separations have a number of limitations. The resins must be
regenerated with stoichiometric amounts of bases to remove the acids. The pressure drop across
the bed is usually high and pore diffusion is generally slow leading to increased processing time.
In addition to ion exchange resins, several other methods such as extraction, neutralization,
vacuum evaporation, charcoal adsorption, and over-liming have been applied to remove acetic
acid from the hydrolysates. Parajo et al. [30], Mussatto and Roberto [31], and Huang et al. [32]
provide detailed reviews of these methods. Separation of bio-oil components by distillation
would be difficult because the oil decomposes to form coke and some light gases when heated
to temperatures above 80oC [18].
Page 21
7
Membrane separation is an alternative technology to remove acids that does not require
the use of stoichiometric reagents. For example, processes such as adsorptive membrane and
membrane extraction were used to remove acetic acid from hydrolysates [33, 34]. However, the
use of membrane separation in bio-energy, in particular for acid removal, is still in its infancy.
Membrane separation technology, which is the focus of this study, is explained in detail in the
next section.
2.3 Membrane Separation Technology
Membrane technologies have seen a major growth and increase in separation applications
in the last 40 years. A membrane can be defined as a permselective barrier or interphase between
two phases. Separation is achieved because of different permeation rates of species across the
membrane. Membrane separation processes offer a number of significant benefits over
conventional separation processes, like cryogenic distillation, absorption and adsorption. First,
energy requirements, and in some cases also capital investment costs, are lower than those for
traditional separation processes in important industrial applications. Second, the required process
equipment is simple, compact, and relatively easy to operate and control. Furthermore, this
equipment is modular and can be easily scaled up or operated at partial capacity. As a result,
membrane separations have acquired a significant role in the industry.
The first recorded observation of a membrane phenomenon appears to have been by
Abbe Nollet in 1748, who discovered osmosis in natural membranes. In 1855, Fick employed
synthetic membranes, made from nitrocellulose, to develop his mathematical model of diffusion
[35]. The first reference to a separation procedure by means of a membrane is Graham’s use of
dialyzer in 1854, to separate a solution into its components [36]. In 1863, his work on porous
membranes led to Graham’s law of diffusion and subsequently, in 1866, he gave the first
Page 22
8
description of the “solution-diffusion” model for permeation of gases in nonporous membranes
[37]. During the next 30 years, Traube and Pfeffer prepared artificial membranes and their
research with osmotic phenomena led to the well known van’t Hoff osmotic pressure relationship
[38]. The first series of microfiltration membranes of graded pore size were synthesized by
Bechhold in 1907. He first defined the relationship between the membrane performance and the
physical properties such as pore size and surface tension [39]. Other early workers, especially,
Zsigmondy and Bachmann [40], Elford [41], and Ferry [42] improved on Bechhold’s technique
and by the early 1930s microporous collodian membranes were commercially available. During
the next 20 years, many other polymeric materials were found and tried in a substantial number
of applications and subsequent studies were done about diffusion across various kinds of
membranes with porous, non-porous, glassy and rubbery characteristics. By 1960, the elements
of modern science had been developed and ample knowledge was available on the relationships
between the structure and property in membranes. However, membranes were used in only a few
laboratory and small, specialized industrial applications because they were unreliable, very slow,
unselective and too expensive.
The breakthrough discovery that transformed membrane separation from laboratory to an
industrial process was the development of defect-free, high-flux, asymmetric cellulose acetate
reverse osmosis membranes by Loeb and Sourirajan in 1962 [43]. These membranes consist of
an ultrathin dense top layer (thickness < 0.5 m) on a much thicker (50 – 200 m) but more
permeable microporous sublayer, which provides the mechanical support. The flux of this
reverse osmosis membrane was 10 times higher than that of any membrane available at that time
and made reverse osmosis a practical method of desalting water.
Page 23
9
The period from 1960 to 1980 produced a substantial change in the status of membrane
technology. Several other membrane formation processes, including interfacial polymerization
and multilayer composite casting and coating, were developed for making high performance
membranes. Techniques for packaging membranes into large surface area modules, such as
spiral-wound, hollow fiber, and plate-and-frame, were also developed, and advances were made
in enhancing membrane stability. By 1980, microfiltration, ultrafiltration, reverse osmosis and
electrodialysis were all well established with large plants installed worldwide.
The principal development in the 1980s was the work of Henis and Tripodi [44] that
made industrial gas separation economically feasible. They coated an asymmetric polysulfone
membrane with a very thin homogenous layer of silicone polymer with high gas permeability.
Silicone is extremely permeable compared to polysulfone but has a much lower selectivity; thus,
the coating did not substantially change the flux or selectivity through the defect-free portions of
the polysulfone membrane. However, the coating plugged membrane defects in the membrane
and eliminated convective flow through these defects. The silicone layer also protected the
membrane during handling. The development of these composite membranes was a critical step
in the installment by Monsanto of the first successful large scale gas separations plants for
hydrogen/nitrogen separations. Considerable work is presently in progress in academic and
industrial laboratories in order to improve the economics of existing membrane processes, as
well as to extend the range of applications of this technology.
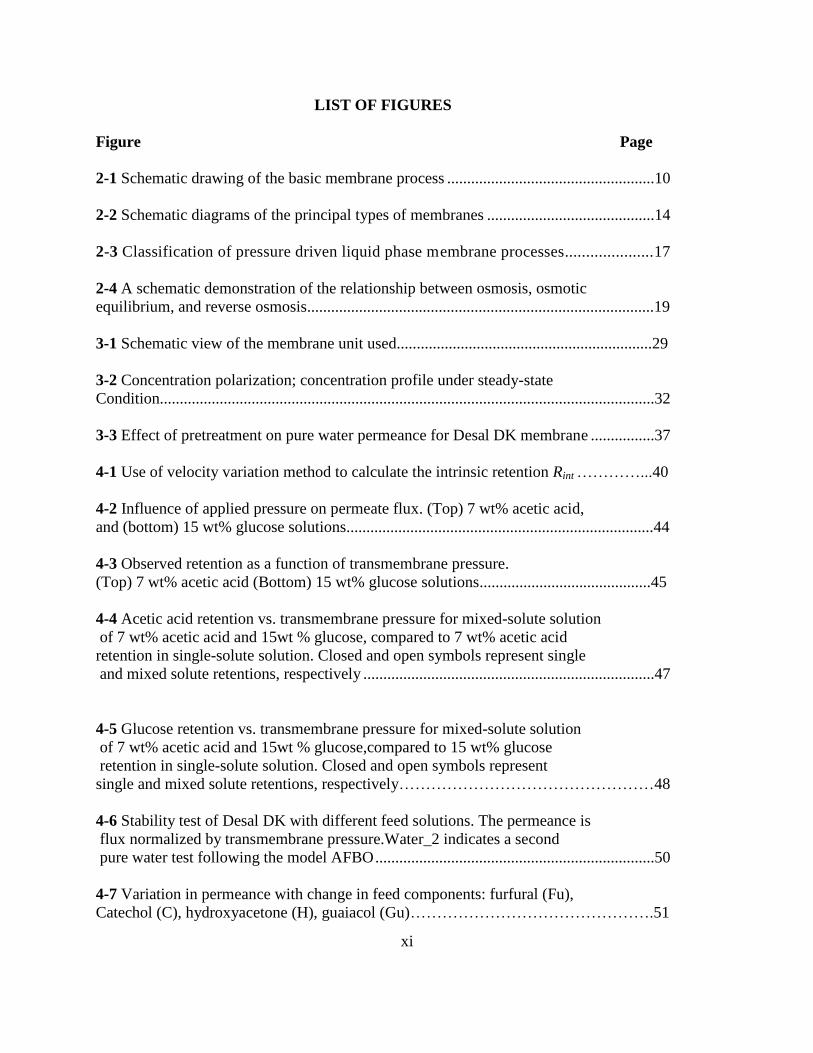
A membrane process, in its basic form, is illustrated in Figure 1. A feed stream is divided
into two streams, i.e. permeate and retentate, and either of them can be the desired product. Two
factors determine the performance or separation efficiency of a given membrane: flux and
selectivity. Flux is defined as amount of material passing per unit area per unit time and hence
Page 24
10
Figure 2-1 Schematic drawing of the basic membrane process
feed
permeate
retentate
membrane module
Page 25
11
is a measure of throughput. Selectivity is generally expressed by one of the two parameters:
retention or separation factor. Permeance and selectivity are dependent on membrane, process
conditions and feed conditions. The ideal membrane should be mechanically, chemically and
thermally resistant and the separation performance should not change after long term operation.
Transport across a membrane is a non equilibrium process and occurs under an applied driving
force. Driving forces can be gradients in pressure, activity (concentration), electric potential or
temperature. The most general driving force in membrane separation is pressure difference.
Pressure differences across the membrane can facilitate microfiltration, ultrafiltration,
nanofiltration, reverse osmosis, gas separation, vapor permeation and pervaporation.
Concentration differences across the membrane can facilitate dialysis and extraction, whereas
temperature differences can facilitate distillation. Electrodialysis can also performed with the
help of membranes when an electrical potential difference across the membrane is maintained.
Other than driving force, membranes are normally classified according to pore size or the
size of the materials they are used to separate. Membranes with pore sizes of 5 m or greater are
particulate filters. Microfiltration membranes have pore sizes in the range of 100 – 5000 nm and
are capable of removing suspended particles like blood cells and latex emulsions. Ultrafiltration
membranes have pore sizes in the range of 2 – 100 nm and can remove large molecules like
albumin or pepsin within this range. Nanofiltration membranes can separate small molecules like
dissolved salts, dissociated acids and sugar, and have pore sizes in the range 1 – 2 nm. Reverse
osmosis membranes separate ions like sodium and chloride on the molecular level and have pore
sizes in the range of few Angstroms. Non-porous membranes are used for gas separation, vapor
permeation, and pervaporation. A summary of driving forces and pore sizes associated with
various membrane processes is given in Table 2-1.
Page 26
12
Table 2-1 Classification of membrane separation processes
Process Pore size Driving force
Microfiltration 0.1 – 5 m P, 1-2 bar
Ultrafiltration 0.002 – 0.1 m P, 2-5 bar
Nanofiltration 1 – 2 nm P, 5-15 bar
Reverse osmosis < 0.5 nm P, 15-100 bar
Gas separation Non-porous P, 15-100 bar
Vapor permeation Non-porous p
Pervaporation Non-porous p
Dialysis 1 – 3 nm c
Membrane extraction Porous, hydrophobic c
Membrane distillation Porous, hydrophobic T
Electrodialysis MWCO* < 200 E
*Molecular Weight Cut-Off
Page 27
13
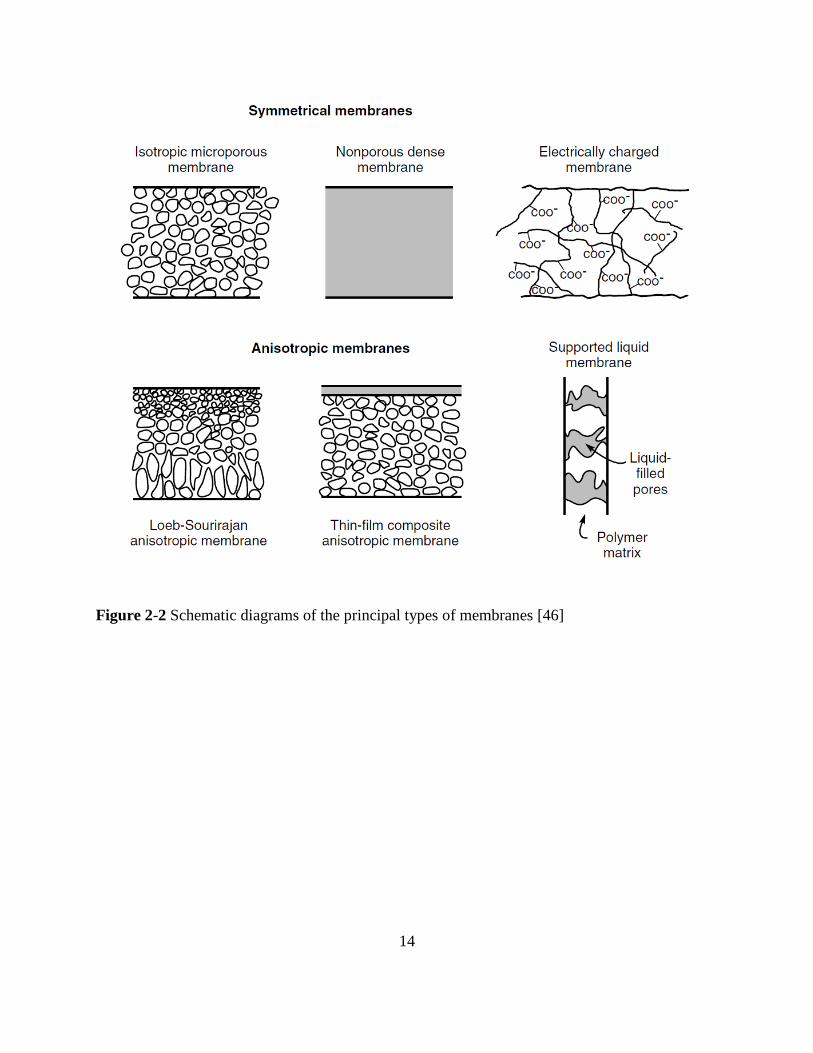
2.3.1 Membrane Classification
A membrane can be thick or thin, homogenous or heterogeneous, symmetric or
asymmetric, charged or uncharged, dense or porous, and solid or liquid. Membranes can also be
classified by nature, i.e. natural biological or synthetic membranes. Synthetic membranes can be
grouped according to their selective barrier, their structure and morphology and the membrane
material [45]. The selective barrier – porous, nonporous, charged or with chemical affinity –
determines the mode of permeation and separation. The principal types of membranes are shown
schematically in Figure 2-2. Some major characteristics of those membranes are given below.
2.3.1.1 Selective Barrier Structure
Porous membranes have a rigid, well-defined static pore structure, which depending on
the formation process can be highly connected and tortuous or non-connected and straight.
Transport through porous membranes is by viscous flow or diffusion, and the selectivity is based
on sieving mechanism. This implies that separation characteristics are mainly governed by
membrane pore size and the effective size of the components in the feed, the type of material
being crucial importance for chemical, thermal and mechanical stability but not for flux and
retention. In general, porous membranes can exhibit very high fluxes. High selectivity can be
obtained when solute size is large compared to the pore size in the membrane. Transport through
nonporous (dense) membranes can be described by solution-diffusion mechanism [46].
Therefore, the intrinsic properties of the membrane material and the permeating species
determine the extent of permeability and selectivity. Electrically charged membranes can be
either porous or nonporous, but are commonly microporous, with fixed charge groups on the
pore wall. Separation using charged membranes is achieved mainly by (Donnan) exclusion of
Page 28
14
Figure 2-2 Schematic diagrams of the principal types of membranes [46]
Page 29
15
ions of the same charge as the fixed ions of the membrane structure, and to a much lesser extent
by the pore size. Hence, the separation is affected by the charge and concentration of ions in the
solution. Finally, the molecules or moieties with specific affinity for components in the feed
form the basis for carrier-mediated transport through the membrane [46].
2.3.1.2 Cross-section Structure
Isotropic (symmetric) membranes have a uniform chemical composition structure
throughout the cross-section, and can be porous or dense. The transport resistance of species in
these membranes is proportional to the total membrane thickness. A decrease in membrane
thickness results in an increased permeation flux. As discussed in the section 2-1, an anisotropic
(asymmetric) membrane has a thin dense or porous selective barrier, supported mechanically by
a much thicker porous substructure. This type of morphology decreases the effective thickness of
the surface layer, and the flux can be enhanced without changes in selectivity. Both the above-
mentioned membranes can in principle be made from the same material. On the other hand, a
thin film composite (TFC) membrane consists of different materials for the selective barrier and
the support structure in contrast to integrally skinned anisotropic membrane (homogenous with
respect to composition). The advantage of TFC membranes is that each layer can be optimized
independently to achieve the desired membrane performance with regard to permeability,
selectivity, and chemical and thermal stability. Other examples include pore filled or pore
surface-coated composite membranes and mixed matrix membranes [47].
2.3.1.3 Membrane Materials
As mentioned earlier, membranes can be classified into two groups, i.e. biological and
Page 30
16
synthetic membranes. Biological membranes are vital for life on the earth. Every cell is
surrounded by a membrane, but these membranes differ fundamentally in structure, functionality
etc. from synthetic membranes. Synthetic membranes can be divided further into organic
(polymeric) and inorganic membranes. Both organic and inorganic membranes can be either
dense or porous depending on the type of application. In principle, all materials that form
sufficiently thin and stable films can be membranes. These include metal, glass, ceramic, and
polymers as well as molecular monolayer of liquids. However, the most important class of
membrane materials is organic, i.e. polymers or macromolecules.
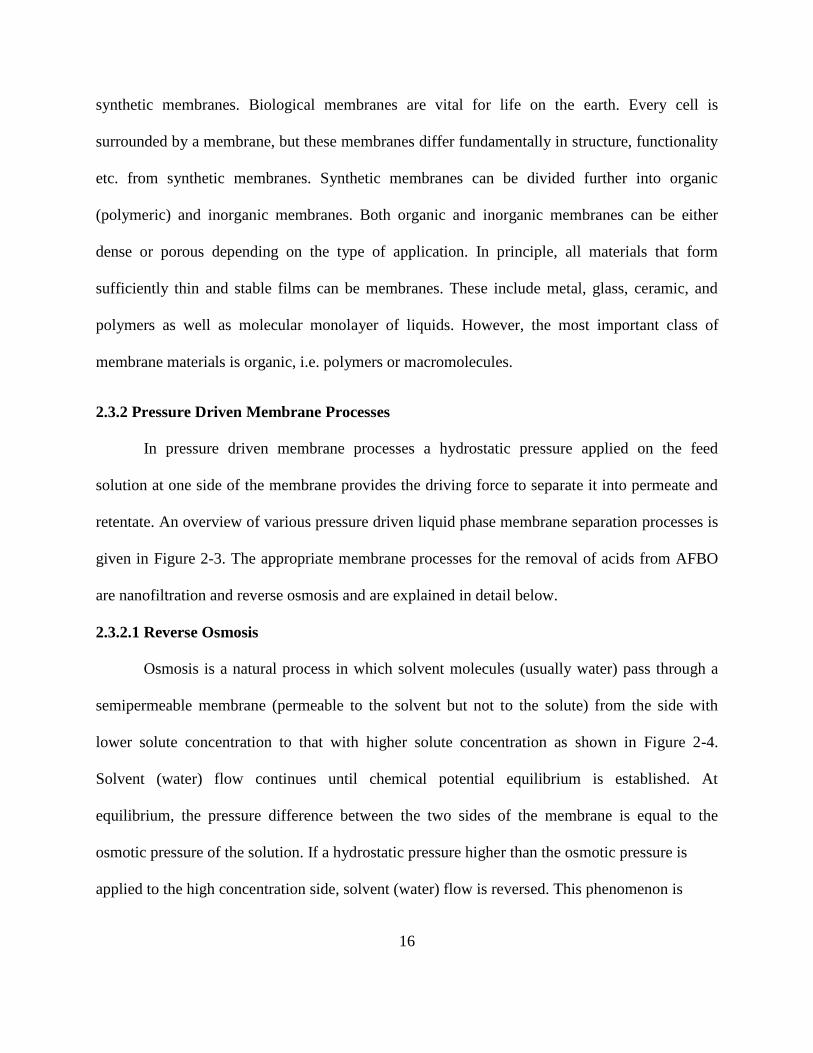
2.3.2 Pressure Driven Membrane Processes
In pressure driven membrane processes a hydrostatic pressure applied on the feed
solution at one side of the membrane provides the driving force to separate it into permeate and
retentate. An overview of various pressure driven liquid phase membrane separation processes is
given in Figure 2-3. The appropriate membrane processes for the removal of acids from AFBO
are nanofiltration and reverse osmosis and are explained in detail below.
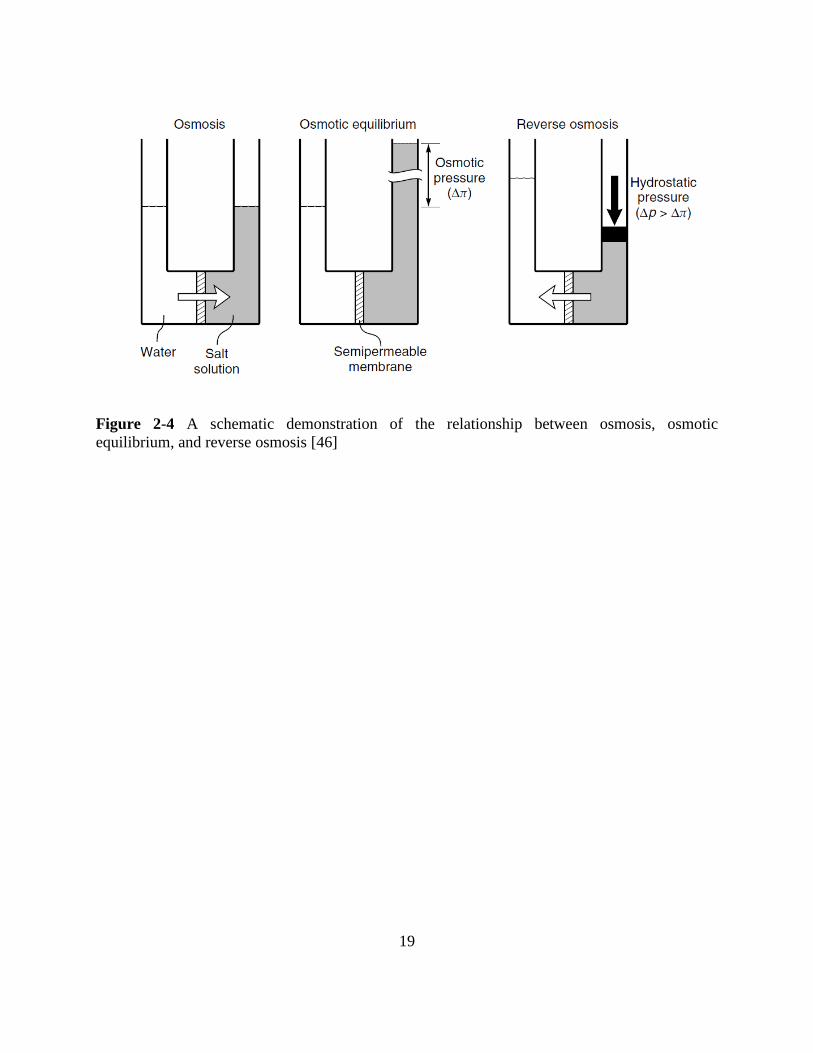
2.3.2.1 Reverse Osmosis
Osmosis is a natural process in which solvent molecules (usually water) pass through a
semipermeable membrane (permeable to the solvent but not to the solute) from the side with
lower solute concentration to that with higher solute concentration as shown in Figure 2-4.
Solvent (water) flow continues until chemical potential equilibrium is established. At
equilibrium, the pressure difference between the two sides of the membrane is equal to the
osmotic pressure of the solution. If a hydrostatic pressure higher than the osmotic pressure is
applied to the high concentration side, solvent (water) flow is reversed. This phenomenon is
Page 31
17
Figure 2-3 Classification of pressure driven liquid phase membrane processes. Reproduced from
[48].
Page 32
18
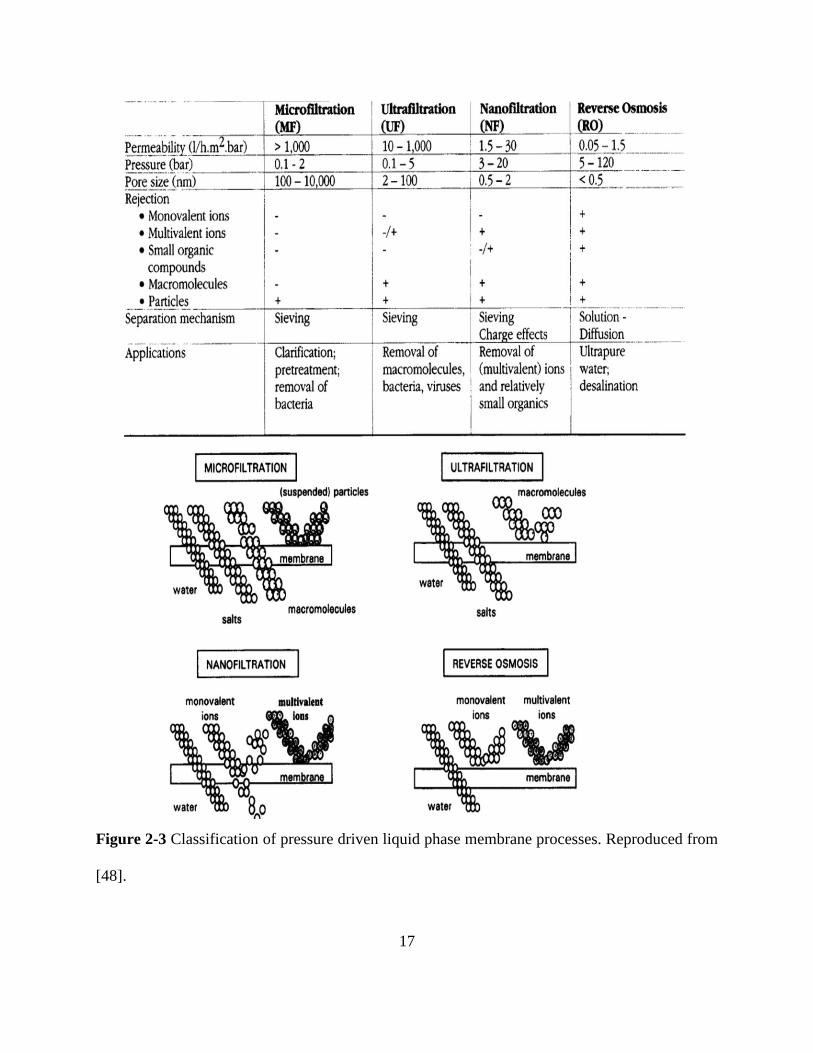
termed reverse osmosis (it has also been referred to as hyperfiltration). Reverse osmosis can be
used to remove solutes such as dissolved monovalent ions from a solution. Chemical potential
gradients across the membrane provide the driving forces for solute and solvent transport. Water
(solvent) and solute permeate through RO membranes according to the solution-diffusion
mechanism (described in detail in section 5.1.2.4) [46]. The effective water flux, Jw, through the
membrane at constant temperature can be represented by the following equation
PAJw (2-18)
where P is the pressure difference across the membrane, is the osmotic pressure differential
across the membrane, and A is water permeability coefficient. According to Equation (2-18),
when P < , water flows from the dilute to the concentrated side of the membrane by normal
osmosis. When P = , no flow occurs, and when P > , water flows from the concentrated
to the dilute side of the membrane. In practice, the membrane may be a little permeable to low
molecular solutes (retention is always less than 100%). Hence, the real osmotic pressure
difference across the membrane is where is the reflection coefficient. The value of A is
approximately in the range of 6.10-5
– 3.10-3
m3/(m
2.hr.bar) for RO membranes while for NF
membranes the permeabilities range from 3.10-3
– 2.10-2
m3/(m
2.hr.bar) [5].
The solute flux through the membrane is given by the following equation
slsos CCBJ (2-19)
where B is the solute permeability constant and Cso and Csl, respectively, are the solute
concentrations on the feed and permeate sides of the membrane. The value of B is in the range of
1.10-4
– 5.10-3
m3/(m
2.hr) for RO with NaCl as the solute with the lowest value for high retention
membranes. For nanofiltration membranes the retention for the different salts may vary
Page 33
19
Figure 2-4 A schematic demonstration of the relationship between osmosis, osmotic
equilibrium, and reverse osmosis [46]
Page 34
20
considerably, e.g. the retention for NaCl may range from 5 to 95%.
The performance of reverse osmosis is directly dependent on the properties of the
membrane material. More specifically, the structure of the membrane and the chemical nature of
the membrane polymer are what govern the flux and retention properties of the RO system. A
number of membrane materials and membrane preparation methods have been used to make
reverse osmosis membranes. Two most common types of RO membranes, based on the kind of
the polymer backbone, are cellulose acetate and aromatic polyamide [46].
Cellulose acetate (CA) membranes were the first commercially viable RO membranes
developed by Reid and coworkers in 1959 [38, 49, 50]. Their films were 5 – 20 m thick so
fluxes were very low, but pressurizing the feed salt solution to 1000 psi, they obtained salt
retentions of better than 98% in the permeate water. In 1963, Loeb and Sourirajan demonstrated
asymmetric cellulose acetate membranes which exhibited remarkably high flux and good salt
retention [43]. They used phase inversion process to prepare these membranes. Their membranes
had 10 times the flux of the best membrane of Reid and Breton and equivalent retentions. CA
membranes offer numerous advantages over other RO membranes on the market today. They are
relatively easy to synthesize and have outstanding mechanical properties. They are also relatively
resistant to attack by chlorine. However, their stability against chemicals, temperature and
bacteria is very poor. Typical operating conditions of these membranes are over the pH range 4
to 6 and at a temperature below 30 C, thus avoiding hydrolysis of the polymer.
Asymmetric CA membranes were the dominant choice for RO membranes through the
1960s to the mid-1970s, until Cadotte, then at North Star Research, produced thin film composite
(TFC) membranes using interfacial polymerization [51]. Interfacial composite membranes had
extremely high salt retentions, combined with good water fluxes. Based on aromatic polyamides,
Page 35
21
TFC membrane fluxes and retentions surpassed those of CA and currently are the industry
standard for desalination applications. In addition to high flux and retention, TFC membranes are
also stable over a larger pH and temperature range than CA [46]. However, one major drawback
of polyamide membranes is their sensitivity to chlorine. TFC membranes undergo oxidative
degradation when exposed to trace amounts of chlorine [52, 53]. The polyamide is believed to
undergo ring chlorination, which disrupts the hydrogen bonding between the chains and degrades
the polymer matrix [54]. Although various approaches have been investigated for producing
chlorine resistant aromatic polyamide materials, the advantages have been limited since most
approaches degrade membrane separation performance [55].
Reverse osmosis can be used in principle for a wide range of applications, which may be
roughly grouped as solvent purification (where permeate is the product) and solute concentration
(where retentate is the product). Most of the applications are in the purification of water, mainly
the desalination of seawater and brackish water to produce drinking water [46]. Another
important application is in the production of ultrapure water for the electronics, pharmaceutical,
and power generation industries. RO processes for waste water treatment have been applied to
the chemical, textile, petrochemical, pulp and paper, and food industries as well as for the
treatment of municipal wastewater and landfill leachates [56, 57]. The applications of RO in the
paper and pulp industry have been mainly for the removal of dissolved solids, organics, and
color from wastewaters [58, 59]. A detailed review of reverse osmosis applications has been
written by Williams et al. [60].
2.3.2.2 Nanofiltration
Nanofiltration (NF) is a relatively new category of pressure driven processes (3-20 bar)
that lies between ultrafiltration (small particle removal) and reverse osmosis (salt removal) on
Page 36
22
the membrane spectrum. The average pore size of NF membranes is around 2nm, which is
between the size of RO and UF membranes. The size of the solute molecules that are retained
and the range of operating pressures (5-20 bar) are also between those for RO (20-100 bar) and
UF (1-5 bar). Therefore, NF membranes are ideally suited for rejecting organics such as lactose,
glucose, and sucrose with molecular weights above 150 g/mol, and for rejecting multivalent ions.
Nanofiltration is closely related to RO, and is sometimes called ‘loose RO’. Similar to
RO most of the NF membranes are polyamide thin film composites (TFCs). However, the
transport in NF membranes is more complex than in RO. In addition to solution-diffusion
mechanism, size and charge exclusion are also usually involved. Commercially available
polyamide NF membranes have a surface charge due to ionizable groups. e.g. carboxylic or
sulfonic acid groups. The equilibrium between charged membrane and the bulk solution is
characterized by an electrical potential called the Donnan potential. Ions smaller than the pore
size are retained because of Donnan exclusion [61].
Reduction of hardness (i.e., Ca+2
and Mg+2
) and dissolved organics from drinking water
are the most important applications of NF membranes [62, 63]. However, the selective properties
of NF membranes make them appropriate for a wide range of unconventional applications. An
important example is the recovery of heavy metals (e.g. Ni, Fe, Cu, Zn etc.) and reclamation of
waste waters from textile mills and metal working plants [64, 65]. More recently, NF membranes
have been adopted for use in the biotechnology and pharmaceutical industries for purification of
small bioactive organic molecules such as antibiotics or separation of small organic components
from biological liquids (e.g., lactic acid separation from fermentation broths [66, 67], amino acid
removal from protein hydrolysates [68], or removal of organics from municipal wastewater [69,
70]).
Page 37
23
In contrast to aqueous systems, the use of NF membranes in organic solvents is much
more recent evolution. The first applications investigated in non aqueous media were not very
successful. Membranes showed performance loss due to chemical instability of polymeric
materials in organic solvents. Different problems occurred: zero flux due to membrane collapse,
‘infinite’ flux due to membrane swelling, membrane degradation, poor separation performance
and the like. Due to recent advancements in membrane development, NF membranes are
increasingly used for non aqueous applications [71]. Commercial solvent resistant nanofiltration
(SRNF) membranes include Koch (MPF 44 and MPF 50), NF-PES-10, StarmemTM
, and N30F.
However, some of these membranes showed visible defects after ten days exposure to one or
more organic solvents and characteristics of all the membranes changed significantly after
exposure to solvents [72, 73]. This means that these membranes should be denoted as semi-
solvent-stable instated of solvent-stable. Researchers obtained insight into the interactions
between membranes and solvents, which result in a performance that is totally different from the
performance in water [74-76].
SRNF-membranes have a strong potential for a variety of applications ranging from
pharmaceutical to chemical and food industries. Large-scale industrial applications of SRNF
membranes have been in operation since 1998 [15], the best known being the MAX-DEWAX at
the ExxonMobil refinery in Beaumont (Texas) for the recovery of dewaxing solvents from lube
oil filtrates. The membrane used in this process was an asymmetric polyimide-based membrane,
with a reported rejection for the lube oil greater than 95%. A typical application is the separation
and purification of edible oil. Recently, several articles have published on the membrane
applications in the edible oil industry for the solvent recovery (hexane, acetone, ethanol, and
isoproponol) and oil refining process [77, 78]. In the pharmaceutical industry, drugs with
Page 38
24
molecular weight (MW) higher than 300 g/mol could be recovered from solvents such as
ethanol, ethyl acetate etc at room temperature by NF-based process [79]. A detailed list of
applications is reviewed by Vandezande et al. [80]. Many more processes could be realized if
stable membranes with high selectivities, competitive flux and sufficient long-term stability were
available.
2.4 Acid Removal by Membrane Technology
The above characteristics of NF and RO would make them appropriate for removing
small acids from AFBO while retaining larger species. There is some related membrane work in
the literature. Han and Cheryan [81] were the first to use NF and RO membranes to separate
acetic acid from glucose. The average observed retentions of acetic acid and glucose were 40%
and 99% respectively. They also found that performance of membranes as measured by flux and
retention of acetic acid is influenced by pressure, pH, concentration, temperature and the
presence of other media components. Sagehashi et al [82] used RO membranes to separate
phenols and furfurals from biomass-superheated steam pyrolysis-derived aqueous solution. They
observed that almost all of the solutes were retained by the RO membrane. Weng et al [83]
performed NF experiments to separate furans and carboxylic acids from sugars in dilute acid rice
straw hydrolysates. The retention of the sugars was greater than 94% whereas negative retentions
were observed with acetic acid and furan. However, in all the above studies, the concentrations
of sugars, carboxylic acids, furans and phenols in the feed were very low (< 1wt %). The organic
feed concentration in the aqueous phase of pyrolysis oil is significantly higher with organic
concentrations above 30 wt % (see section 2.1). There are few studies published on NF using
solutions at higher concentration (> 10 wt% or 100 g/L). Sjöman et al [84] studied the separation
of xylose from glucose by NF from highly concentrated monosaccharide solutions. The total
Page 39
25
concentration of sugars is varied up to 30 wt% and they observed a xylose/glucose separation
factor over 2, but they didn’t study the effect of the presence of other organic compounds. Weng
et al [19] used NF membranes to separate acetic acid from xylose at high concentration of xylose
(100 g/L) but relatively low concentration of acetic acid (10 g/L).
There are no published systematic investigations on NF and RO separations using high
concentrations of sugars and other organic compounds that are directly relevant to pyrolysis bio-
oils. Since the membrane performance depends on the solute concentration and the presence of
other media components [84, 85], it is necessary to study the performance of NF and RO at
realistic concentrations. This research aims at implementing membrane technology to reduce the
acidity of AFBO, thus stabilizing it for long-term storage and further processing. The main goal
is to reject low molecular weight acids while retaining glucose and other valuable, heavier
compounds.
Page 40
26
CHAPTER 3
EXPERIMENTAL PROCEDURE
This chapter describes the experimental procedure for liquid permeation experiments.
Details of NF and RO membranes used and chromatographic analyses are also given.
3.1 Membranes and Chemicals
NF and RO flat sheet membranes were purchased from Wilkem Scientific (Pawtucket,
RI). The information provided by the manufacturers is summarized in Table 3-1. All the
membranes were supplied in a dry form except for MPF 34, which were supplied in a wet form
in a 0.7 % Roccal preserving solution (0.7% benzalkonium chloride + 0.25% sodium
metabisulfite in water). Desal DK and RO AG membranes are thin film composites (TFC) that
have a three–layered structure comprising active, intermediate and backing layers. The active
(top) layer of Desal DK membrane is a polyamide, with polysulfone as backing layer. The
intermediate layer is a proprietary polymer. The layers in RO AG membranes have a similar
composition. MPF 34 also consists of three layers, with a backing made of a polypropylene-
polyethylene blend. The intermediate and top polymeric layers are a proprietary polymer. RO CE
membranes are asymmetric membranes, with a continuous variation in structure across the
membrane thickness, made of cellulose acetate. Since the MPF 34 membranes were supplied in
wet form, these membranes were washed with distilled water before using them in our
experiments.
D-glucose (anhydrous), acetic acid (glacial), phenol (laboratory grade), ethanol (200
proof), methanol (laboratory grade) were purchased from Fisher Scientific. Furfural (99 %),
Page 41
27
Table 3-1 Membrane parameters. All data are from the manufacturers, except for the permeability values in
parentheses that were measured in this work.
Membrane Rejection Polymer
Pure water
permeability
constant, A
L/m2-hr-bar
pH range
@ 25 ºC
GE Osmonics
Desal DK
98 % MgSO4
Aromatic
polyamide
5.44 (4.78)
2-11
Koch MPF 34 200 MWCOa Proprietary 1.95 (1.71) 0-14
GE Osmonics
RO AG
99.5 % NaCl
Aromatic
polyamide
2.85 (2.87) 4-11
GE Osmonics
RO CE
97% NaCl
Cellulose
Acetate
1.38 (1.32) 2-8
a Molecular Weight Cut Off
Page 42
28
formic acid (98%), catechol (99%), guaiacol (99%) were purchased from Acros and
hydroxyacetone (technical) was purchased from TCI America. Aqueous solutions of model
solutions were prepared using distilled water.
3.2 Permeation Set-up
A Sepa® CF II Med/High foulant lab scale cross-flow membrane filtration unit from GE
Osmonics was used to carry out the permeation experiments. Figure 3-1 shows the schematic
diagram of the experimental equipment. The Sepa® CF II unit has three major components: cell
body, cell holder, and hydraulic hand pump. Precut rectangular membranes (19 cm × 14 cm)
with an effective area of 137 cm2 were installed in the cell body. Feed spacer and permeate
carrier were installed on the bottom and top of the membrane respectively. The unit was
pressurized using the hydraulic hand pump to a pressure greater than the expected feed pressure;
double O-rings in the cell body provide a leak-proof seal. The feed stream was pumped using an
Eldex Optos reciprocating pump from the feed vessel to the inlet. Flow continued through a
manifold into the membrane cavity and then flowed tangentially across the membrane surface.
The transmembrane pressure was monitored by two digital pressure gauges located on the inlet
and outlet of the cell. A back pressure valve was mounted on the retentate outlet to control the
transmembrane pressure. The permeate pressure was always atmospheric. All the experiments
were conducted at room temperature (21 1 C) at constant cross flow velocity of 0.026 m/s and
at different transmembrane pressures ranging from 5 to 58 bar. Both the permeate and the
retentate were recycled to feed vessel. Permeate samples were collected at each pressure and
timed to calculate permeation flux. At each flux measurement, a sample of permeate was taken
for chemical analysis. The flux was obtained by
Page 43
29
Figure 3-1 Schematic view of the membrane unit used
Pressure gauge
Feed tank
Pump
Pressure gauge
GE Osmonics Sepa CF II cell
Back pressure control valve
Retentate
Permeate
Page 44
30
tA
VJ (3-1)
where V is the volume of the permeate, A the membrane area and t the time over which the
volume V was collected. Permeance (P) is calculated by normalizing the flux with the
transmembrane pressure and is given by
p
JP
(3-2)
where p is the transmembrane pressure. The observed retention, Robs, of solute can be used to
describe membrane performance and was calculated from Equation (3-3), where Cp and Cf are
the permeate and feed concentrations of solute, respectively.
%1001
f
p
obsC
CR (3-3)
The value of R lies between 100 % (ideal semipermeable membrane; complete retention of the
solute) and 0% (completely unselective membrane; solute and solvent pass through the
membrane freely). While the permeance and observed retention serve to describe the throughput
and selectivity achieved in a given experiment, they do not entirely characterize the
membrane/solution system. The observed retention is measured directly from the experiments
and may strongly depend on concentration polarization which in turn changes with the
hydrodynamic conditions near the membrane. Therefore one must consider some further details
of the mass transfer process, as described in the next section.
3.3 Concentration Polarization
Concentration polarization is due to the accumulation of rejected species within a thin
boundary layer adjacent to the membrane surface. The polarization hampers the transport
Page 45
31
because of increase in the resistance to flow and thus reduces the flux. Also it enhances solute
leakage resulting in the loss of membrane retention. As a result of concentration polarization, the
actual concentration of solute near the membrane surface is different from the feed or bulk
concentration. A parameter other than Robs can be used to evaluate membrane retention which is
termed as intrinsic retention (Rint) and is defined by
%1001
m
p
intC
CR (3-4)
where Cm is the solute concentration in the liquid feed evaluated at the membrane surface. One
could also change the definition of Cp in Equation (3-4), but concentration polarization is
typically not important on the permeate side. Since it is difficult to experimentally probe
concentrations close to the surface, Rint is calculated theoretically from a set of Robs. A
combination of film theory and velocity variation method [86] is frequently used to calculate
intrinsic retention.
Using film theory, the concentration profile under steady state conditions is shown in
Figure 3-2 [5]. The solute concentration (Cf) is assumed constant at distances greater than from
the membrane surface. However, in most cases the solvent is being transported across the
membrane at a greater rate than the solute. This results in a local increase in solute concentration
near the membrane surface. Thus, the concentration in the boundary layer increases and reaches
a maximum value at the membrane surface (Cm). The concentration gradient also leads to a
diffusive back flow towards the bulk of the feed. The following is a mass balance for solute at
the feed side membrane interface under steady state conditions
pCJdx
dcDCJ .. (3-5)
Page 46
32
Figure 3-2 Concentration polarization; concentration profile under steady-state conditions.
Adapted from [5].
Page 47
33
where D is the solute diffusion coefficient. The boundary conditions are
C = Cm at x = 0
C = Cf at x =
Solving Equation (3-5) using the boundary conditions results in
k
J
CC
CC
pf
pmexp (3-6)
where k = D/ is called the mass transfer coefficient. Combining Equations (3-3), (3-4) and (3-
6), we obtain
k
J
R
R
R
R
int
int
obs
obs
1ln
1ln (3-7)
If one had information about k, Rint could be calculated from the experimental observations of J
and Robs. For laminar flow conditions (in our case Re20), the mass transfer coefficient, k, can be
calculated using Sherwood’s relation [5]
33.0
..86.1
L
dScRe
D
kdSh hh (3-8)
where dh is the hydraulic diameter, L is the channel length, Sh is the Sherwood number, Re is the
Reynolds number and Sc is the Schmidt number.
From Equation (3-8), the dependence of the mass transfer coefficient k on the cross flow velocity
v can be written as
c
vk
33.0
(3-9)
where 33.034.067.0537.0 LdDc h
.
Combining Equations (3-5) and (3-7) gives
Page 48
34
33.0
1ln
1ln
v
Jc
R
R
R
R
int
int
obs
obs
(3-10)
This is the basic equation for concentration polarization which shows in a simple form the two
factors (the flux J and the mass transfer coefficient k) responsible for polarization. Also it is
assumed that the diffusion coefficient, D, is independent of extent of polarization and hence c
can be considered as constant and is independent of flux and cross-flow velocity. At a constant
flux J and different cross flow velocities,
obs
obs
R
R1ln is plotted against
33.0v
J. The result is a
straight line of slope c. From the intercept, Rint is calculated. The intrinsic retention, Rint, provides
a more direct characterization of a given membrane/solution, as compared to Robs, because the
effects of feed flow velocity have been factored out. van der Berg et al showed that this model is
sensitive to chosen values of parameters and large range of observed retentions and fluxes is
required to obtain reliable mass transfer coefficients [87].
3.4 Model Aqueous Solutions
Since the complete chemical analysis of AFBO is difficult, studies containing model
compounds are helpful to understand its processing. Model compound studies also help in
understanding the interaction between different components in the bio-oil. Based on the
composition of bio-oil and literature data, Vispute and Huber [24] suggested a model solution to
represent AFBO. Initial experiments were run with single and binary solute solutions of acetic
acid and glucose to test the performance of the membranes. The model solutions used were:
single solute solutions of 7 wt% acetic acid, 3.5 wt% glucose, and 15 wt% glucose, binary solute
solutions of 5 wt% acetic acid & 10 wt% glucose and 7wt% acetic acid & 15wt% glucose and a
model AFBO whose composition is given in Table 3-2.
Page 49
35
3.5 Membrane Pretreatment
It has been observed that pretreatment by pressure impacts the flux and retention of NF
membranes [88]. Also it is important to know how membranes are treated before the actual
experiments in particular if fouling of the membranes is assessed by comparing their pure water
permeances. Therefore most of the NF membranes need to be pretreated, before actual
experiments, at high pressure in order to fully utilize their permeance. The membranes were
pressurized by filtering water at pressures 25 and 35 bar for 10 min. Permeation measurements
were made with water at different pressures, ranging from 5 to 35 bar, before and after each
successive pretreatment step. The results are shown in Figure 3-5 for Desal DK membrane. The
permeance at low pressures is increased dramatically after the first pretreatment while there is
not much change at high pressures. Second pretreatment has very little effect on the permeance
at all pressures. So we conclude that exposing the membrane to high pressure ( 25 bar) resulted
in an increase in permeance. Similar experiments were conducted with the other three
membranes but the effect of pretreatment is negligible on water permeance. So it is believed that
Desal DK membranes are sensitive to pretreatment effects. Hence permeation experiments with
model aqueous bio-oil were conducted with treated and untreated membranes to see the effect of
pretreatment on flux and retention and the results are described in section 4.10.
3.6 Chemical Analyses
High performance liquid chromatography (HPLC) and gas chromatography (GC) were
used for the analysis of feed and permeate samples. HPLC was equipped with Aminex HPX-87
H column and two detectors; refractive index (RI) and ultraviolet (UV) were used to analyze
glucose and acetic acid respectively. The mobile phase was 0.005 M H2SO4. For all other
compounds, a RTx®-VMS capillary column was used in a Agilent Technologies 7980A
Page 50
36
Table 3-2 Composition of model aqueous fraction of bio-oil
Compound Weight , % Water solubility (g/100 ml)
Water 65 -----
Glucose 15 91
Acetic acid 7 100 (miscible)
Hydroxyacetone 4.65 100 (miscible)
Formic acid 2.3 100 (miscible)
Furfural 2.3 8.3
Guaiacol 2.3 2.9
Catechol 1.45 43
Page 51
37
Figure 3-3 Effect of pretreatment on pure water permeance for Desal DK membrane
0
1
2
3
4
5
6
0 10 20 30 40
Per
mea
nce
(L
/m2
-hr-
bar
)
Transmembrane pressure (bar)
No pretreatment
Pretreatment @ 25 bar
Pretreatment @ 35 bar
Page 52
38
chromatograph equipped with a flame ionization detector (FID). The carrier gas was helium and
a single temperature programming profile was used. Feed samples were diluted by a factor of 10
to reduce the degradation of glucose in the detector. Optical microscopy was used to characterize
the membrane surface.
Page 53
39
CHAPTER 4
RESULTS AND DISCUSION
In this chapter results of the nanofiltration and reverse osmosis experiments are presented
and discussed. The key performance metrics were retention of specific species, especially acetic
acid and glucose, and total flux. Experiments were conducted to see the effect of cross flow
velocity, transmembrane pressure and total feed concentration on these metrics. The chemical
stability of these membranes against different phenolics was also studied. All the results
presented in this chapter were obtained without pretreating the membranes unless specified
explicitly.
4.1 Pure Water Flux
Pure water flux data for all four membranes used in our study are shown in Table 3-1 in
terms of the water permeability constant, A, which was obtained from the slope of pressure- flux
data as shown in Equation (4-1). The osmotic pressure () is zero, so A = J/P for pure water.
From Table 3-1, it is clear that the values measured in our lab (shown in parentheses) are
consistent with the values provided by the manufacturers.
J = A (P ) (4-1)
4.2 Effect of Cross Flow Velocity on Retention
Experiments with 3.5 wt% glucose solution were conducted at different cross flow
velocities to study its impact on glucose retention. In addition we also calculated intrinsic
retentions using a combination of film theory and velocity variation method which was explained
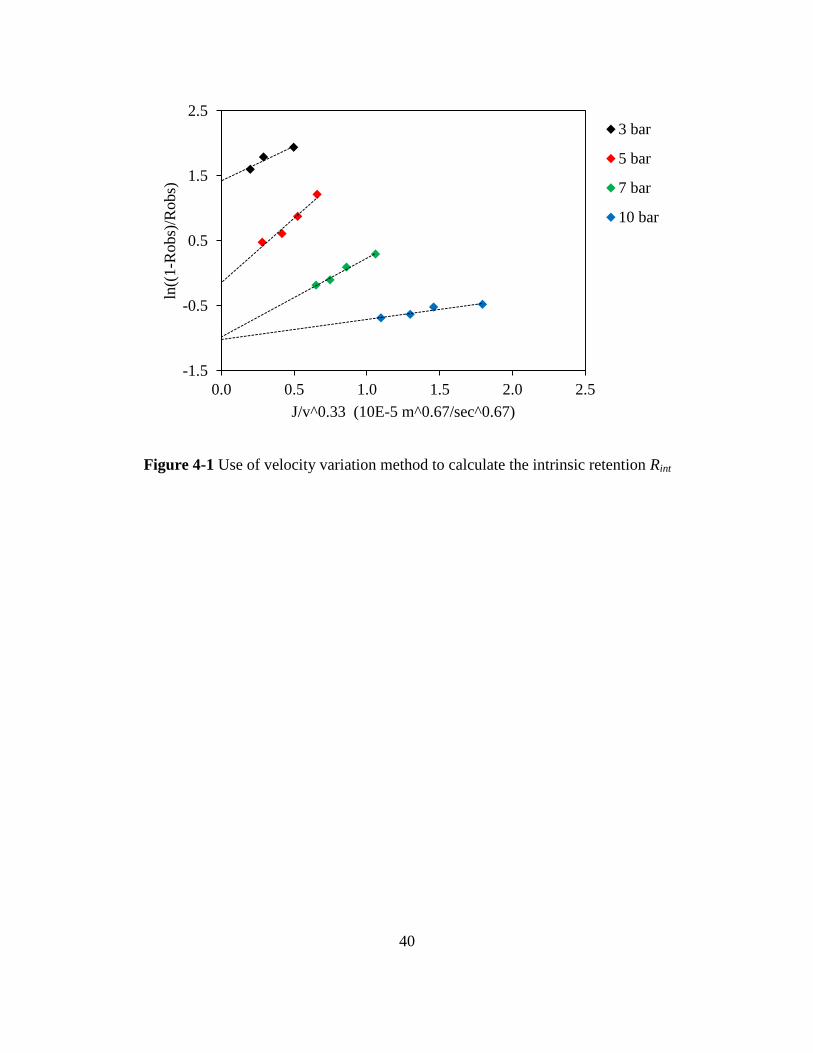
in detail in section 3.3.3. Figure 4-1 shows calculation of the intrinsic retention using Equation
(3-10). At a given flux, J, the variation of
obs
obs
R
R1ln plotted against
33.0v
J(i.e. at different
Page 54
40
Figure 4-1 Use of velocity variation method to calculate the intrinsic retention Rint
-1.5
-0.5
0.5
1.5
2.5
0.0 0.5 1.0 1.5 2.0 2.5
ln((
1-R
obs)
/Robs)
J/v^0.33 (10E-5 m^0.67/sec^0.67)
3 bar
5 bar
7 bar
10 bar
Page 55
41
cross flow velocities) should give a straight line of slope c, from the y-intercept from which Rint
is calculated. The results are summarized in Table 4-1. It is evident from the data that increasing
the cross flow velocity increased the observed retention. Therefore we confirmed that the
observed retention, Robs, is strongly dependent on the concentration polarization and accordingly
changes with the hydrodynamic conditions near the membrane. Concentration polarization is
undesirable as it exposes the membrane to an increased solute concentration, which increases the
resistance to flow and thus reduces the flux. It also decreases the observed solute retention. The
intrinsic retention, Rint, deals directly with the concentration at the membrane surface, Cm, and is
always higher than the observed retention. As the cross flow velocity increases the observed
retention approaches the intrinsic retention because concentration polarization is decreased and
Cm Cf. This agrees with the theory presented in the previous chapter. So we performed all the
experiments at the highest cross-flow velocity (0.026 m/sec) achievable with our system, but we
expect that there may still be concentration polarization effects. Note that the observed retention
increased as the transmembrane pressure is increased. A straightforward explanation is given in
the next section.
4.3 Single-solute Solutions
Experiments were carried out with single solute solutions of acetic acid (7 wt %) and
glucose (15 wt %) using all four membranes listed in Table 3-1. The effect of transmembrane
pressure on flux and solute retention was explored. The variation of flux with transmembrane
pressure is shown in Figure 4-2. In all experiments, the flux was a nearly-linear function of
transmembrane pressure and was lower than that of pure water. For example, with Desal DK
membrane at 36 bar, the fluxes of 7 wt% acetic acid and 15 wt% glucose feed solutions were 85
Page 56
42
Table 4-1 Variation of observed retention, Robs, with cross flow velocity
Transmembrane
pressure,
p (bar)
Cross flow velocity,
m/sec
Robs , %
Rint , %
3
0.0015
0.0047
0.0097
0.126
0.143
0.168
20
5
0.0028
0.0045
0.0086
0.0272
22.9
29.4
35.2
38.3
54
7
0.0034
0.0066
0.0097
0.0139
42.7
47.6
52.6
54.6
73
10
0.0039
0.0078
0.0120
0.0205
61.7
62.7
65.3
66.6
76
Page 57
43
and 5 L m-2
hr-1
respectively as compared to the pure water flux of 164 L m-2
hr-1
. For both single
solute solutions, Desal DK and RO AG membrane have the highest and lowest fluxes,
respectively. Figure 4-3 shows the effect of transmembrane pressure on acetic acid and glucose
retention. Glucose retentions up to 90% and acetic acid retentions down to -4% were observed.
For a particular membrane, glucose retention is always higher than that of acetic acid. Evidently,
the higher glucose retention is due to the larger size of the glucose molecule, which is in
accordance with the sieving effect [89, 90]. Negative retention (i.e., permeate enrichment) is
unusual but it is not an entirely new phenomenon. Weng et al [85] observed negative retentions
of acetic acid (varied between -2.3 % to 6.6%) with spiral wound Desal DK membrane module.
Lonsdale et al. [91] also observed negative retention of phenol in aqueous mixtures with
cellulose acetate membranes. Possible explanations for negative retention are charge effects and
intermolecular interactions between solvent and solute. In case of acetic acid, there is an inverse
relation between flux and retention. The flux of acetic acid solution through the membranes
decreased in the sequence DK > CE > MPF 34 > AG whereas the retention of acetic acid
followed the reverse order (although DK and CE membranes showed essentially identical
retentions). However, there is no such trend with glucose solution. In general, both flux and
solute retention increased as the transmembrane pressure increased. This can be explained using
the solution-diffusion model for solvent and solute transport through the membrane [46].
According to this model, as pressure is increased the solvent (water) flux increases faster than
solute flux and thus retention increases.
4.4 Mixed-solute Solutions
Figures 4-4 and 4-5 show, respectively, the acetic acid and glucose retentions obtained
with all the membranes for one mixture composition (7 wt% acetic acid and 15 wt% glucose).
Page 58
44
Figure 4-2 Influence of applied pressure on permeate flux. (Top) 7 wt% acetic acid, and
(bottom) 15 wt% glucose solutions
0.00
20.00
40.00
60.00
80.00
100.00
20 25 30 35 40 45
Flu
x(L
/m2
-hr)
DK
MPF 34
AG
CE
0.0
1.0
2.0
3.0
4.0
5.0
6.0
20 25 30 35 40 45
Flu
x(L
/m2
-hr)
Transmembrane pressure (bar)
Page 59
45
Figure 4-3 Observed retention as a function of transmembrane pressure. (Top) 7 wt% acetic acid
(Bottom) 15 wt% glucose solutions
-10
0
10
20
30
40
20 25 30 35 40 45
Ob
serv
ed r
eten
tio
n, %
DK
MPF 34
AG
CE
0
20
40
60
80
100
20 25 30 35 40 45
Obse
rved
ret
enti
on, %
Transmembrane pressure (bar)
Page 60
46
The data for the single-solute solutions at the same concentrations are also shown for
comparison. For acetic acid, the retentions in mixed-solute solutions are significantly lower than
those in single-solute solutions. This is favorable for the separation process proposed here. A
similar phenomenon was reported by Weng et al [85]. They investigated the separation of xylose
and acetic acid by nanofiltration and observed that the acetic acid retention was significantly
lower in the presence of xylose than that in single-solute solution. Laufenberg et al [92] studied
retention characteristics of multicomponent organics by reverse osmosis. They observed that
acetic acid retention could be lower or higher in the presence of other organic acids. In both the
cases, it was concluded that the alteration in acetic acid retention may be attributed to
intermolecular interactions between acetic acid and other components, although further studies
are required to understand the link between the intermolecular interactions and the observed
changes in retention. Other studies showed that in binary mixtures of salt and sugar, the salt
retention was decreased as the sugar concentration increased [93]. This was explained as a result
of viscosity increase in the concentration polarization layer due to high retention of sugar, which
hampered the back diffusion of the salt. In contrast, Figure 4- 5 shows that the retention of
glucose is not much affected by the presence of acetic acid, except for CE membrane for which
the retention of glucose in mixed-solute solution is slightly lower than that in single-solute
solutions. The observed flux is also slightly higher than that obtained with single-solute glucose
solution (not shown). This implies that CE membranes might be swollen in the presence of acetic
acid.
4.5 Membrane Stability
Experiments were conducted with the model AFBO, as given in Table 3-2, using Desal
DK membrane. A permeance that was unexpectedly high for this concentrated multicomponent
Page 61
47
Figure 4-4 Acetic acid retention vs. transmembrane pressure for mixed-solute solution of 7 wt%
acetic acid and 15wt % glucose, compared to 7 wt% acetic acid retention in single-solute
solution. Closed and open symbols represent single and mixed solute retentions, respectively
-30
-20
-10
0
10
20
30
40
20 25 30 35 40 45
Ob
serv
ed r
eten
tio
n, %
Transmembrane pressure (bar)
DK
MPF 34
AG
CE
Page 62
48
Figure 4-5 Glucose retention vs. transmembrane pressure for mixed-solute solution of 7 wt%
acetic acid and 15wt % glucose, compared to 15 wt% glucose retention in single-solute solution.
Closed and open symbols represent single and mixed solute retentions, respectively
30
40
50
60
70
80
90
100
20 25 30 35 40 45
Ob
serv
ed r
eten
tio
n, %
Transmembrane pressure (bar)
DK
MPF 34
AG
CE
Page 63
49
mixture was observed, indicating that the model AFBO may have damaged the membrane. The
membrane was tested again with pure water, and the flux was higher by a factor of 22 as
compared to the data in Table 3-1, strongly indicating that irreversible damage had occurred. The
results are summarized together with the permeances of single solute solutions of 7 wt% acetic
acid and 15wt% glucose in Figure 4-6. Most NF membranes are designed for treating aqueous
systems that have low levels of contaminants. Past studies have shown that exposing such
membranes to organic compounds at higher concentrations resulted in loss of structural integrity
and separation performance [73, 94]. The DK membranes were observed to curl after the
permeation experiments with AFBO, which was not the case with binary solutions of glucose
and acetic acid. These visual observations on the membranes also support the findings of Yang et
al. [94], who observed curling of NF membranes when exposed to different organic solvents.
Since the binary mixtures of glucose and acetic acid didn’t cause any damage to these
membranes, one or more of the new components of the multicomponent mixture likely were
responsible.
Permeation experiments were done with different feed solutions to further investigate the
cause of damage. Initially, an aqueous solution of furfural was filtered through the membrane.
After that catechol, hydroxyacetone, and guaiacol were added step by step. The individual
component concentrations were maintained close to those in model AFBO. At each step, the
membranes were exposed to feed solution for 30 min and the permeances were measured. The
results are shown in Figure 4-7. The permeance declined with addition of new components until
guaiacol was introduced into the feed solution. Then the permeance went up dramatically, as it
did in the case of model AFBO.
Page 64
50
Figure 4-6 Stability test of Desal DK with different feed solutions. The permeance is flux
normalized by transmembrane pressure. Water_2 indicates a second pure water test following
the model AFBO
0.1
1
10
100
1000P
erm
ean
ce (
L/m
2-h
r-b
ar)
Water
7 wt% acetic acid
15 wt% glucose
Model aqueous bio-oil
Water_2
Page 65
51
Figure 4-7 Variation in permeance with change in feed components: furfural (Fu), Catechol (C),
hydroxyacetone (H), guaiacol (Gu)
0.1
1
10
100P
erm
ean
ce (
L/m
2-h
r-b
ar)
Water
Water+Fu
Water+Fu+C
Water+Fu+C+H
Water+Fu+C+H+Gu
Page 66
52
Although polyamide membranes are known to be sensitive to chlorine via ring
chlorination [54], to our knowledge there exist no literature reports on their sensitivity to
phenolic compounds. Polyamide reverse-osmosis membranes were used by Sagehashi et al. [82]
to separate phenols and furfural from pyrolysis derived aqueous streams. Bruggen et al studied
separation performance of different NF membranes made up of polyamide and polysulfone with
a wide variety of organic compounds including phenolics. No membrane damage was reported in
either of these studies. However, the concentration of phenolics used in their experiments was an
order of magnitude lower than that in our experiments. The effect of solute concentration on
membrane compatibility was examined by performing filtration experiments with solutions of
guaiacol and phenol at different concentrations using Desal DK and MPF 34 membranes. At
each concentration, the feed solutions were filtered for 30 min and the concentration was
increased step by step. The results are summarized in Figure 4-8. Both membranes showed
similar qualitative behavior with guaiacol and phenol. Permeance initially decreased as the
concentration of the phenolic compounds in the feed solution was increased, up to a “critical
concentration” at which it started to increase. The critical concentrations at which the membranes
started to show signs of damage were different for guaiacol (~1.5 wt%) and phenol (~5 wt%).
Above the critical concentration, the active (top) layer of treated membranes developed visible
pinches while the bottom layer seemed unaffected. Optical microscopy was carried out to
characterize both virgin and guaiacol-treated Desal DK membranes. The images are shown in
Figure 4- 9. The images show that the active surface was not uniformly dissolved in guaiacol but
was damaged at certain spots. On the other hand, the bottom layer was not affected.
Experiments using RO AG and RO CE membranes were also conducted with 1.5 wt% of
guaiacol solution. The RO AG membranes developed a very high permeance similar to that of
Page 67
53
Figure 4-8 Contents in feed solutions for Desal DK and MPF 34. (Top) Guaiacol and (Bottom)
Phenol
0.1
1.0
10.0
100.0
Per
mea
nce
(L
/hr-
m2-b
ar)
Desal DK
MPF 34
0 %
0.5%
1 %
1.5%
0.1
1
10
100
Per
mea
nce
(L
/m2
-hr-
bar
)
0%
1% 3%
5%
Page 68
54
Figure 4-9 Optical microscopic images. (A) Top layer and (B) Bottom layer of virgin membrane
(C) Top layer and (D) Bottom layer of guaiacol treated membrane
(A) (C)
(B) (D)
Page 69
55
Desal DK and MPF 34 membranes. In contrast, the flux through the RO CE membrane was seen
to drop until it was no longer measurable, suggesting that the mechanism of damage may be
different for this membrane.
Experiments with aliphatic alcohols, methanol and ethanol, were also conducted. Both
the membranes, Desal DK and MPF 34, were very stable up to alcohol concentrations as high as
18 wt%. Compared to aliphatic alcohols (pKa 15), phenolics (pKa10) have a greater tendency
to deprotonate, resulting in highly water-soluble phenoxide ions, e.g. C6H5O-. (One explanation
for the greater acidity of phenolics is the delocalization of negative charge over the aromatic
ring). These phenoxide anions might react with an amide group on the membrane and convert it
to a corresponding ester, providing a possible explanation for the observation that membrane
damage occurred with phenolics but not with aliphatic alcohols. However, comparing the two
phenolics, membrane damage occurred at a lower solute concentration with guaiacol as
compared to phenol, though the pKa values of both are almost equal. At this point further
investigation is needed to explain the chemical mechanism behind the damage.
4.6 Modified Model Aqueous Fraction of Bio-oil
Due to membrane damage by guaiacol, experiments with model AFBO excluding
guaiacol were conducted using all four types of membranes at a transmembrane pressure of 40
bar. Both the RO membranes failed to yield meaningful results. With the RO CE membrane
there was no measurable flow. The active layer of RO AG membranes turned pink after treating
with model AFBO and glucose retention was very low ( 20%). The permeate solution was
believed to be contaminated due to the chemical changes that took place in the active layer;
therefore the data for RO AG is not presented here. Data at 40 bar were obtained with the two
NF membranes, Desal DK and MPF 34, and was averaged over two membrane samples in each
Page 70
56
case. Solute retentions are summarized in Table 4-2 (Columns 2 and 4). Formic acid and
catechol had very low signals in the feed and permeate and were almost undetected by GC, so
they are not shown in the table. Glucose retention is positive and all other solutes have negative
retentions. However the glucose retention is lower than that in single and binary solutions. This
result is consistent with the findings of Goulas et al. [95] who found that in mixtures of
oligosaccharides, individual sugar retentions decreased as the total sugar concentration increased.
Another possible explanation is that there might be positive coupling between glucose and other
components present in the model AFBO that in turn reduced the glucose retention.
Since the glucose retentions achieved at 40 bar with model AFBO were moderate,
experiments were performed with the Desal DK membrane at a higher pressure, 58 bar. The
results are also shown in Table 4-2 (Column 3). Glucose retention is increased from 47% to 83%
as the transmembrane pressure increased from 40 to 58 bar. Furthermore, the retentions of all
other compounds became more negative. These results indicate that the separation of acids and
other low molecular weight organic compounds from glucose is operationally feasible at high
transmembrane pressures.
4.7 Effect of Concentration on Flux
The effect of total feed concentration on flux is shown in Figure 4-10. Our results
indicate that higher the concentration of the feed solution the lower the flux. These results are
consistent with the findings of Sjöman et al [84]. With Desal DK membranes they found an order
of magnitude decrease in flux as the concentration of the feed (binary mixture of xylose and
glucose in the mass ratio 1:1) increased from 10 wt% to 30 wt%. Yang et al [94] observed
similar behavior with aqueous solutions of dyes. At a pressure of 30 bar, the water fluxes at dye
concentrations of 35 and 10000 mg/l were 24 and 18 L m-2
h-1
, respectively. Due to high feed
Page 71
57
Table 4-2 Retention of components present in model aqueous fraction of bio-oil, without
guaiacol. Formic acid and catechol were undetectable
Retention, %
Compound Desal DK
40 bar 58 bar
MPF 34
40 bar
Glucose 47.4 83.1 54.7
Acetic acid -14 -16.7 -7.7
Hydroxyacetone -9 -15.9 -1.35
Furfural -12 -35.6 -14.4
Page 72
58
Figure 4-10 Effect of total feed concentration on flux (measurements were made at constant
pressure, 36 bar)
1
10
100
1000
0 10 20 30 40
Flu
x (
L/m
2-h
r)
Total feed concentration, wt%
Water
7 wt% acetic acid
15 wt% glucose
15 wt% glucose + 7 wt% acetic
acidModel AFBO
Page 73
59
concentrations and low cross flow velocities used in our work, concentration polarization cannot
be neglected. Accordingly, flux would decrease due to the increased resistance near the
membrane surface. Also when a solute is added to the pure water, the driving force for water flux
decreases as can be seen from Equation (4- 1); the effective transmembrane pressure that drives
the feed is equal to the applied hydraulic pressure minus osmotic pressure difference. Other
possible explanations include increase in viscosity, adsorption, or blocking of the membrane
pores.
4.8 Effect of Membrane Pretreatment
In section 3.2.4, it is shown that pretreatment by pressure effects pure water permeance of
Desal DK membranes. Permeation experiments with modified AFBO were conducting using
treated and untreated membranes. The effect of pretreatment (pressurizing membranes with pure
water [88]) on membrane performance is evaluated by plotting glucose retention vs. permeance
and is shown in Figure 4-11. A trade-off relation was observed between retention and permeance
of treated and untreated membranes, i.e. high retentions are accompanied by low permeances and
vice versa. Pretreatment by pressure clearly opens up the membrane pore structure which
resulted in a subsequent increase in permeance accompanied by reduction in glucose retention.
Therefore pretreating the Desal DK membranes is not recommended when higher retentions are
required.
4.9 Conclusions
Commercially available NF and RO membranes were used to study the possibility of
separating carboxylic acids from sugars in AFBO. Initial experiments were run with single and
binary solute model aqueous solutions to test the performance of the membranes. The effects of
cross flow velocity, pressure, concentration, and pretreatment on membrane performance were
Page 74
60
Figure 4-11 Glucose retention vs. permeance of treated and untreated Desal DK membranes.
Data is plotted for three treated and untreated membranes
0.0
20.0
40.0
60.0
80.0
100.0
0 0.05 0.1 0.15 0.2
Glu
cose
ret
enti
on, %
Permeance (L/m2-hr-bar)
Untreated membranes
Treated membranes
Page 75
61
explored. Experiments with glucose solution, conducted at different cross flow velocities,
showed that increasing the cross flow velocity increased the observed retention. Therefore it is
confirmed that observed retention is strongly dependent on the concentration polarization and
hence changes with the flow conditions near the membrane surface.
Experiments with single and binary aqueous solutions of acetic acid and glucose showed
that retention factors of glucose above 90% and negative retention factors of acetic acid could be
achieved at moderate (~ 40 bar) feed pressures. Fluxes were linearly dependent on
transmembrane pressure. In general, both flux and solute retention increased as the
transmembrane pressure is increased. This can be explained using solution-diffusion model for
solvent and solute transport through the membrane. The binary experiments showed that glucose
retention is largely unaffected by the presence of acetic acid (except for the RO CE membrane)
but acetic acid retention decreases significantly in the presence of glucose. This might be
explained as an effect of viscosity increase of the concentration polarization layer due to high
retention of sugar, which hampered the back diffusion of the acetic acid resulting in reduced
acetic acid retention. Experiments with the model AFBO resulted in irreversible damage to the
membranes. Subsequent experiments identified guaiacol as the detrimental compound and
further demonstrated that phenol causes a similar effect. The active (top) layer of guaiacol
treated membranes had visible pinches while the bottom layer seemed unaffected. Optical
microscopic images of both virgin and guaiacol treated membrane had confirmed the damage.
Experiments with guaiacol-free model AFBO showed that high retentions (> 80%) of glucose are
possible with NF membranes at higher feed pressures (~ 60 bar). Finally, the effect of
pretreatment by pressure on membrane was explored. An inverse correlation was observed
Page 76
62
between retention and permeance of treated and untreated membranes, i.e. high retentions are
accompanied by low permeances and vice versa.
Page 77
63
CHAPTER 5
MODELING MEMBRANE TRANSPORT AND COMPARISION WITH
EXPERIMENTAL DATA
Transport of mobile species across a membrane takes place under one or more driving
forces. Generally speaking, a gradient in electrochemical potential acts as the driving force.
Specifically, the gradient in electrochemical potential may arise from gradients in pressure,
concentration, temperature and/or electrical potential. The transmembrane flux, or amount of
species per unit cross-sectional area per unit time crossing the membrane, is proportional to the
driving force with permeance being the proportionality constant. Both the driving force and the
permeance depend on the mechanism of transport. Therefore it is important to understand the
nature of transport in membranes. Also models that adequately characterize the membrane
performance are needed in the design of membrane processes. In this chapter the discussion is
limited to transport of liquid solutions, containing low molecular weight solutes, through the
membranes. The goal is to develop mathematical models that explain the experimental data and
allow one to predict future experiments.
5.1 Classification of Membrane Models
Many mechanistic and mathematical models have been developed to describe the
transport in membranes. These models can be categorized in to two groups: irreversible
thermodynamic and structure-related models. In the first type, the membrane is treated as a black
box in which the processes are not far from equilibrium. No information regarding the structure
of the membrane and the mechanism of transport is needed. The thermodynamics of irreversible
processes are useful especially when flow coupling exists between various components. The
Page 78
64
coupling may be either positive or negative. In positive (negative) coupling the flux of one
component increases (decreases) the flux of a second component.
In structure-related membrane models, some mechanism of transport is assumed and the
physiochemical properties of the membrane and the solution are involved. For example, the
structure parameters such as pore size, porosity, tortuosity, and the pore size distribution, the
membrane thermodynamic properties such solvent and solute solubility and the membrane
kinetic properties such as diffusivity of solute and solvent are taken into account. Again, two
types of structure-related models are developed: one for porous membranes and the other for
nonporous membranes. If all the information regarding the membrane properties is available, one
can predict the membrane performance, without having experimental data, under real operating
conditions. From this point of view, these models are more useful than the irreversible
thermodynamic approach. The individual models are discussed in detail in the following
sections.
5.1.1 Irreversible Thermodynamic (IT) Models
5.1.1.1 Basic Principles of Irreversible Thermodynamics
In irreversible or nonequilibrium thermodynamics it is assumed that the system can be
divided into small volume elements in which local equilibrium exists and therefore
thermodynamic state variables can be written for these elements. For processes near equilibrium,
all fluxes (flows) are linearly dependent on all forces. The resulting set of equations, called
phenomenological equations, can be written as follows [96]
j
n
j
iji XLJ (i = 1, 2, . . ., n) (5-1)
where Ji and Xi are the generalized fluxes and forces, respectively, and Lij is a phenomenological
Page 79
65
coefficient. This relation allows the possibility of coupling when multiple fluxes and forces are
present.
5.1.1.2 Kedem – Katchalsky Model
Irreversible thermodynamics have been applied to many types of membrane processes
and the first practical model was developed by Kedem and Katchalsky [97] for transport of non
electrolytes through membranes. For dilute, isothermal and steady state systems consisting of
solvent and solute, the transport equations are represented by
Jv = Lp (P - ) (5-2)
Js = + (1 - ) (Cs)ln Jv (5-3)
where Jv is the volume flux (usually solvent flux), Js is the solute flux, Lp is the hydraulic
permeability, = (Js/)Jv=0 is solute permeability at zero volume flux, is the reflection
coefficient, P is the transmembrane pressure, is the osmotic pressure difference across the
membrane and (Cs)ln is the logarithmic mean solute concentration in the membrane. The
imperfection of the membrane is defined by the reflection coefficient and usually has a value
between 0 and 1.
= 1 ideal semipermeable membrane, no solute transport
< 1 not a completely semipermeable membrane; solute transport
= 0 no retention.
While the thermodynamics of irreversible processes can describe membrane transport, a
major drawback is the description of the membrane as a black box from which no insight is
provided about the transport mechanisms of the membrane. Therefore, these models are not
useful for predicting separations based on membrane structure and properties. Also when there
Page 80
66
are larger gradients in the driving forces across the membrane, the application of linear laws is
limited.
5.1.2 Structure-related Models
Membranes can be macroporous, microporous or dense (nonporous). In the porous
membranes, components are permeated by convection and/or diffusion through pores and the
transport is described using pore flow models, whereas the mechanism of transport in dense
membranes is described by solution-diffusion model. The difference between these mechanisms
lies in the relative pore size and associated modes of transport in the pores. Although
mechanisms of liquid and gas transport are similar, the governing equations are slightly different
and hence they are explained separately. The models used to describe the mechanism of liquid
transport are illustrated in Figure 5-1.
5.1.2.1 Pore Models
Transport mechanisms of liquids through porous membranes are shown in Figure 5-2 a,
b, and c. These membranes have pore sizes in the range of 2 nm to 10 m. The governing
equation for one dimensional liquid transport through membranes is often expressed as follows
[98]
dx
dDN i
eiii
(5-4)
where Ni is the mass flux of component i, i is the mass density of component i, is the mass
average velocity of liquid, Dei is the effective diffusion coefficient of component i. The first term
in the above equation represents flux due to pressure-driven convection and the second term
represents flux due to diffusion.
Page 81
67
Figure 5-1 Schematic representation of the nominal pore size and the best theoretical model for
the principal membrane separation processes. Adapted from [46].
Page 82
68
5.1.2.2 Convective Flow
If the pore size is large compared to the molecular diameter and a pressure gradient exists
across the membrane, bulk or convective flow occurs through the pores as depicted in Figure 5-2
a. In this case, diffusion is typically negligible relative to bulk flow. Both ultrafiltration and
microfiltration operate in this regime and the separation occurs mainly by sieving of particles
larger than the pore size. Different pore flow models have been developed to characterize the
flow velocity,, due to the existence of different pore geometries. The bulk flow of a liquid due
to pressure gradient, through an ideal membrane consisting of cylindrical pores with orientation
perpendicular to the surface is given by the Hagen-Poiseuille law [99]. Assuming that all the
pores have the same dimension, the volumetric flux through the membrane is given by
x
PrJ
8
2
(5-5)
where P is the pressure difference across a membrane of thickness x, r is the pore radius, is
the viscosity, is the surface porosity, which is the fractional area of the membrane occupied by
the pores and is the pore tortuosity (For cylindrical perpendicular pores, = 1). In the real
membranes pores may not be cylindrical and the flux equation given by Equation (5-5) should be
modified.
5.1.2.3 Diffusion
When identical pressures but different component concentrations exist on both sides of
the membrane, the transport of liquid is via diffusion. In that case, there is no or little bulk flow
through the membrane and permselective diffusion of components through the pores results in an
effective separation as shown in Figure 5-2 b. If the pore size and molecular sizes of some
components in the feed mixture are of the same order, the diffusion of those components will be
Page 83
69
Figure 5-2 Mechanisms of molecular transport through porous membranes. (Flow is downward.)
(a) Convective or bulk flow through pores; (b) diffusion through pores; (c) restricted diffusion
through pores.
Page 84
70
restricted as shown in Figure 5-2 c. Molecules larger than the pores will be excluded from
diffusing through the membrane, resulting in enhanced separation. In a feed mixture of solvent
and solutes i, the flux for each species is given by a modified form of Fick’s law [100]
)( ipif
m
ei
i CCl
DJ (5-6)
where Dei is the effective diffusion coefficient, Cif and Cip are the concentrations of species i in
the pores at the feed and permeate membrane interfaces, respectively, and lm is the thickness of
the membrane. Generally, the effective diffusivity depends, often in a complex way, on factors
such as the porosity and tortuosity of the membrane and the ratio of molecular diameter to pore
diameter.
5.1.2.4 Solution-diffusion (SD) Model
The transport through nonporous (dense) membranes can be described in terms of
solution-diffusion mechanism as indicated in Figure 5-3. It is assumed that liquid components
(solvent and solutes) are transported under the chemical potential gradient in an uncoupled
manner. These gradients are the result of pressure and concentration differences across the
membrane. Transport usually consists of three steps: (1) absorption of liquid components into the
membrane at the upstream face, (2) activated diffusion through the solid membrane, and (3)
desorption from the downstream face. The permeated components are separated because of the
differences in solubilities and diffusivities of the components in the membrane phase. This model
is widely used to describe the transport through nonporous membranes. In this section the SD
transport model is applied to nanofiltration and reverse osmosis membranes. According to this
model, the water transport across the membrane is only by diffusion and the flux is given by
Fick’s law [101]
Page 85
71
dx
dCDJ wm
wmw (5-7)
where Dwm and Cwm are the concentration and diffusivity of water in the membrane, respectively.
Assuming the water-membrane solution obeys Henry’s law, wmw CRTdd ln , Equation (5-7)
becomes
m
wmwmwwmwm
wlTR
CD
dx
d
TR
CDJ
(5-8)
The chemical potential of any component at any temperature and pressure, i (T, P) can be
defined as
i
ref
i
ref
ii aRTPPvPTPT ln)(),(),(0
(5-9)
where i0 (T, P
ref) is the chemical potential in some standard compositional state (usually pure i)
and some reference pressure Pref
, vi is molar volume, ai is chemical activity, R is gas constant
and T is absolute temperature. For ideal dilute solutions, where the volume fraction of the solute
is small and using Equation (5-9), w can be redefined as
Pvww (5-10)
where is the osmotic pressure and is given by
w
w
av
TRln
(5-11)
Substituting Equation (5-10) into Equation (5-8), one gets
PAPlTR
vCDJ
m
wwmwm
w (5-12)
where A is the water permeability coefficient and is defined by the second equality in Equation
(5-12). In deriving this result, it has been assumed that Dwm, Cwm, and vw are independent of
Page 86
72
Figure 5-3 Mechanism of transport in dense membranes.
Page 87
73
pressure. For the solute flux it is assumed that the chemical potential difference due to pressure is
negligible and the flux is almost entirely due to concentration differences and is given by Fick’s
law
m
sm
sm
sm
smsl
CD
dx
dCDJ
(5-13)
where Dsm is the solute diffusion coefficient in the membrane and Csm is the solute
concentration difference across the membrane. In Equation (5-13), it is assumed that the
concentration profile within the membrane is linear which may not be valid at higher
concentrations. Since it is difficult to measure the solute concentration in the membrane, it is
related to the liquid phase feed and permeate concentrations using the partition coefficient, Ksm.
When this is done, Equation (5-13) becomes
spismispismi
m
smsm
s CCBCCl
KDJ (5-14)
where B is defined as the solute permeability coefficient and Csmi, and Cspi are solute
concentrations in the liquid feed and permeate at the membrane interface, respectively. Note that
the approximation that diffusion and partition coefficients are constant may not be valid at higher
concentrations, and this model doesn’t include the effect of pressure on solute transport.
Equation (5-12) predicts that water flux will be in opposite direction if P < , then will flow
in conventional direction when P > , whereas according to Equation (5-14) solute flow is
independent of pressure. Furthermore, the solute flux, Js, is related to the water flux by
Js = Jw .Cspi/Cwpi (5-15)
where Cwpi is the water concentration in the membrane on the permeate side. The selectivity of a
membrane for a given solute is expressed by retention coefficient R
Page 88
74
smi
spi
C
CR 1 (5-16)
By combining Equations (5-12), (5-14), (5-15) and (5-16), the retention coefficient can be
written as
P
C
A
B
R
wpi1
1 (5-17)
Equation (5-17) expresses the retention in terms of the physical properties of the membrane and
the driving force P - . Note that when A (P-) >> B Cwpi, the water flux will be much
greater than solute flux resulting in almost complete retention of the solute (R = 1). Comparison
of Equations (5-2) and (5-3) with Equations (5-12) and (5-14) shows that SD model is equivalent
to irreversible thermodynamic model for a membrane with perfect solute retention ( = 1).
Equation (5-17) allows one to predict membrane performance based on the experimental data
and membrane properties.
In the above models, only the resistance of membrane is involved. In practice external
mass resistances in the boundary layers exist and should be included where appropriate. As
described in section 3.3, in case of concentration polarization, the solute concentration at the
membrane interface is higher than the bulk feed solute concentration. Therefore, in evaluating
Equations (5-12), (5-14) and (5-16), the solute concentration in the liquid feed at the membrane
interface, calculated using film theory model, should be used.
5.2 Comparison of Experimental and Theoretical Data
Some of the results described in chapter 4 were used to develop the solution –diffusion
(SD) model for the systems we studied.
Page 89
75
5.2.1 Estimation of Model Parameters
Osmotic pressures of feed and permeate were calculated using two different methods:
van’t Hoff equation and OLI Stream Analyzer software (OLI systems, New Jersey). The van’t
Hoff equation, appropriate for dilute solutions, is given by
= i C R T (5-18)
where C is molar concentration of solute, R is gas constant, T is absolute temperature and i is
van’t Hoff factor that accounts for the degree of association or dissociation of solute. Since
glucose and acetic acid neither associate nor dissociate at the given experimental conditions, i =
1. OLI Stream Analyzer calculates the osmotic pressure of solutions based on the activities of
water. The pure water permeance, A, was determined from flux vs. pressure data by linear
regression using Equation (5-12). In case of pure water, the osmotic pressure () is zero. Figure
5-4 shows the pure water flux data of Desal DK NF membrane. The slope of the fitted line,
which is the constant A, is 1.32E-11 m-sec-1
-Pa-1
. The same procedure is applied to calculate
pure water permeances of different membranes. Measured values are compared with
manufacturer’s data and are shown in Table 5-1. It can be seen that there is a good agreement
between them. The parameter B was calculated from the solute flux data using Equation (5-14).
Because of the high concentrations and low cross flow velocities used it was not possible to
eliminate concentration polarization (CP). In this case, solute concentration evaluated at the
membrane surface, Csmi, is used in Equation (5-14) to include the effects of CP.
Film theory model, explained in chapter 3, was used to calculate Csmi and is explained below
1. At a given pressure drop, P, and feed concentration, Csf, permeate flux, Jw, and
permeate concentration, Cspi, were determined experimentally.
Page 90
76
Figure 5-4 Pure water flux versus pressure drop of Desal DK NF membrane. represents
experimental data. represents fitted line
0.00E+00
1.00E-05
2.00E-05
3.00E-05
4.00E-05
5.00E-05
0 1000000 2000000 3000000 4000000
Flu
x (
m/s
ec)
Transmembrane pressure (Pa)
slope = 1.32E-11
Page 91
77
Table 5-1 Pure water permeances of different membranes calculated from experiments.
Manufacturers’ data is provided in parenthesis for comparison.
Membrane Permeance (10-12
m-sec-1
-Pa)
Desal DK (NF) 13.3 (15.1)
MPF 34 (NF) 4.75 (5.42)
GE AG (RO) 7.97 (7.92)
GE CE (RO) 3.66 (3.83)
Page 92
78
2. Solute flux, Js, was calculated using Equation (5-15) and the mass transfer coefficient, k,
was calculated using Equation (3-8).
3. From Equation (3-6), Csmi can be calculated which in turn was used in the Equation (5-14)
to calculate solute permeability, B.
Once A and B as a function of transmembrane pressure are known, flux and retention can be
predicted using Equations (5-12) and (5-17).
5.2.2 Glucose – water Mixture
The effect of transmembrane pressure on water flux is shown in Figure 5-5. As confirmed
by the SD model, the water flux increased with increasing transmembrane pressure for all the
membranes tested. However, there is no good match between the experimental and theoretical
data. The model was unable to match the slope of the experimental flux against pressure and also
over-predicted the flux. This deviation might be due to large pressure and concentrations
gradients across the membrane. At high concentrations, film theory model, which is an idealized
model, cannot give accurate predictions of concentration polarization which in turn results in
inaccurate predictions of glucose concentration at the membrane interface. In our experiments,
the concentration polarization (CP) modulus, defined as Csmi/Csf, ranged from 1.04 to 1.17 as
calculated from the film theory using Equation (3-6). Weng et al [27] used the combined model,
film theory and velocity variation method, to calculate the concentration polarization modulus of
xylose at different cross flow velocities and at a lower feed concentration (xylose = 100 g/l and
acetic acid =10 g/l). A detailed description of this model is discussed in section 2.2.2. They
observed that xylose CP modulus decreased from 2.38 to 1.62 when the cross flow velocity
changed from 0.09 m/s to 0.27 m/s. According to their results, we should obtain higher CP
modulus because we performed experiments at higher concentrations (glucose = 150 g/l) and at
Page 93
79
Figure 5-5 Influence of transmembrane membrane pressure on the water flux. Glucose
concentration is 15 wt%. (A) RO_AG (B) RO_CE (C) MPF 34 and (D) Desal DK
(B)
(C)
(D)
(A)
Experimental
van’t Hoff equation
OLI software
Page 94
80
lower cross flow velocity (0.026 m/s). The inconsistency might also be due to slightly different
methods used to calculate surface concentrations. From Equation (5-12) it is clear that the water
flux depends on both the applied hydraulic pressure and osmotic pressure difference. Based on
glucose surface concentration calculated from film theory model, the osmotic pressure difference
is calculated. Hence the evaluation of surface concentration is very critical in modeling highly
concentrated solutions. We expect that Csmi/Csf should be bigger for our experiments, this will
increase and thus decrease the predicted flux, bringing it closer to the experimental data. The
effect of concentration on the ideality of the system can also be seen from the modeling data.
Data obtained from OLI software is closer to the experimental data than that of obtained by van’t
Hoff equation. OLI software, as claimed by the provider, uses the water thermodynamic data,
without any assumptions regarding the nature of the solution, to calculate the osmotic pressures
and can be used in case of concentrated solutions where as the van’t Hoff equation is valid only
for dilute systems.
Figure 5-6 provides the retention profiles of glucose at different transmembrane
pressures. According to the SD model the water flux increases with pressure but the solute flux
does not. Hence, the solute retention increases with pressure. The same trend is observed with
the experimental data. However there is a quantitative mismatch between the experimental and
theoretical data. In contrast to water flux data, both the theoretical model predictions are almost
equal. At higher concentration gradients across the membrane, the application of Equation (5-
14) is limited. It is assumed that the solute permeability is constant across the membrane and
there is a linear gradient in the concentration across the membrane which may not be true at
higher concentration gradients.
Page 95
81
Figure 5-6 Retentions as a function of transmembrane pressure. Glucose concentration is 15
wt%. (A) RO_AG (B) RO_CE (C) MPF 34 and (D) Desal DK
Experimental
van’t Hoff equation
OLI software
(C) (D)
(A) (B)
Page 96
82
Both diffusion coefficient and solubility coefficient in Equation (5-14) become functions
of concentration and vary across the membrane. Rosenbaum and Skiens [102] performed
experiments by using cellulose acetate membranes in aqueous solutions of NaCl at different
concentrations. At low concentrations (< 0.5M), there is a good agreement between the
experimental and theoretical flux data. But at higher concentrations, the data set is highly
irregular and non linear. The concentrations used in this experiment ( 0.8 M) are higher and
falls in the non linear regime. Therefore both SD model and film theory model should be
modified to account for the non-idealities introduced due to higher concentration gradients. Also
in order to reduce the concentration polarization, experiments can be performed at higher cross
flow velocities. In that case, film theory model can be used without any ambiguity.
5.2.3 Acetic acid - water Mixture
Similar trends were obtained with fluxes of acetic acid water mixtures. Figure 5-7 shows
the variation of flux with transmembrane pressure. As expected, water flux increased with
transmembrane pressure. The difference between the experimental and theoretical fluxes is
decreased compared to that glucose mixture but agreement is still not good. Figure 5-8 provides
the retention profiles of glucose at different transmembrane pressures. Since the retentions of
acetic acid, Figure 4-3, are low compared to that of glucose, the effect of concentration
polarization should also be low. Hence there is a better match between the experimental and
theoretical data. On average, the flux of glucose was over-predicted by a factor of 15 but the flux
of acetic acid was over-predicted by a factor of 4. In contrary to flux data, retention data of acetic
acid are not in good agreement with modeling data. At this point it is not clear whether the
concentration polarization or variation of water and solute permeability coefficients across the
membrane is responsible for the inconsistency between experimental and theoretical data.
Page 97
83
Figure 5-7 Influence of transmembrane membrane pressure on the water flux. Acetic acid
concentration is 7 wt%. (A) RO_AG (B) RO_CE (C) MPF 34 and (D) Desal DK.
Experimental
van’t Hoff equation
OLI software
(B)
(C)
(A)
(D) (C)
Page 98
84
Figure 5-8 Retentions as a function of transmembrane pressure. Acetic acid concentration
is 7 wt%. (A) RO_AG (B) RO_CE (C) MPF 34 and (D) Desal DK
Experimental
van’t Hoff equation
OLI software
(C) (D)
(B)
(D) (C)
(A)
Page 99
85
5.3 Conclusions
Solution-diffusion model (SD) was employed to the experimental results obtained with
single solute solutions of glucose and acetic acid. Osmotic pressures of the feed and permeate
were calculated using van’t Hoff’s equation and OLI software. Water permeability coefficients
of all the membranes were determined using corresponding pure water flux data. The values
obtained are in consistent with the manufacturer’s values. Concentration polarization is modeled
using film theory. Empirical relations were used to calculate mass transfer coefficients.
Experimental solute flux data is used to determine, solute permeability coefficients. Finally,
solvent and solute fluxes were calculated using the SD model equations and compared with
experimental data. As predicted by the SD model, both solvent flux and solute retention
increased with transmembrane pressure. However, there is no good match between the
experimental and theoretical data. The model was incapable of matching the slope of the
experimental flux against pressure and also over estimated the flux. Both SD and film theory
models are applicable in situations where the concentration and pressure gradients across the
membrane are low. We think that high concentrations used in our experiments resulted in a
mismatch between measured and calculated values.
Page 100
86
CHAPTER 6
ORGANIC-INORGANIC NANOCOMPOSITE MEMBRANES FOR GAS SEPARATION
This chapter focuses on the synthesis of organic-inorganic composite membranes and
their application to solubility-based gas separations. Composite membranes were prepared by
two different methods. In the first one, melamine-based dendrimers were grown directly off the
surface of commercially available mesoporous alumina membranes of 5 nm pore size. In the
second method, anodisc alumina membranes were modified with polydimethylsiloxane (PDMS)
using dip coating method.
6.1 Introduction
Solubility-based gas separations, where the more soluble components preferentially
permeates across the membrane, have attracted considerable interest in recent years due to both
economic and environmental concerns[103, 104]. This mode is especially advantageous in
applications where the heavier components are present in dilute concentration. Examples include
the removal of higher hydrocarbons from refinery hydrogen purge streams and recovery of
volatile organic compounds (VOCs) from process effluent streams. In gas separation with
membranes, the ideal selectivity for component A relative to component B, BA / , is defined as
the ratio of the pure component permeabilities (P) as given below
B
A
B
A
B
ABA
S
S
D
D
P
P/ (6-1)
where D is the diffusivity and S is the solubility of a particular component in the membrane.
Freeman and Pinnau summarized the design criteria for solubility-selective polymeric
membranes [104]. They point out that for separation of dilute heavy molecular weight
Page 101
87
components from light gases the diffusivity selectivity is generally in favor of the smaller mobile
species. Therefore, to achieve solubility-based separation, the polymer needs not only to have
high solubility selectivity but also a large free volume so that the ratio of diffusivities of the two
components is driven close to unity. The solubility-selectivity is greater for the larger species
simply due to van der Waals interactions, resulting in an overall higher selectivity for the larger
species. For example, to design a membrane separation system for organics/light gas that is more
selective for the organics, the ideal membrane would have the ratio of the diffusivity coefficients
of the two gases in the membrane close to unity
1gaslight
organics
D
D (6-2)
The propane/nitrogen solubility ratio based on the discussion above would be significantly
higher than one
1gaslight
organics
S
S (6-3)
leading to an overall higher propane permeability as given by equation (2-33) below
1gaslight
organics
P
P (6-4)
Both inorganic and organics membranes can be designed to achieve solubility-based gas
separations. Both materials have certain advantages and disadvantages. Presently current effort is
concentration on designing membranes that provide high permeance and high selectivity. Such
membranes can allow a positive correlation between permeability and selectivity, which is in
Page 102
88
contrast to conventional diffusivity-based separations where an upper bound is present [105].
Figure 6-1 shows this upper bound for the oxygen/nitrogen selectivity drawn as a function of
oxygen permeability. Much of the present research has focused on pushing the polymer
performance above the upper bound and into economically attractive region currently enjoyed by
inorganic membranes.
Organic-inorganic nanocomposite membranes, that combine the best characteristics of
both polymeric and inorganic materials, provide a viable method to improve membrane materials
for solubility-selective separations. Polymers fused with inorganic particles are a common
approach [106-109]. Merkel et al. doped poly (4-methyl-2-pentyne) with nanoscale fumed silica
particles and applied them to a prototype solubility-selective separation: n-butane from methane
[107]. They observed that with increasing silica wt% in the polymer there was a simultaneous
enhancement in both n-butane permeability and n-butane/methane selectivity. This was mainly
attributed due to silica-induced disruption of polymer packing and an accompanying slight
increase in the size of free volume elements.
Another approach to generate organic-inorganic nanocomposites is based on depositing
organic compounds onto a mesoporous inorganic framework. This approach allows one to
synthesize membranes that simultaneously deliver the desired chemistry and the desired free
volume for specific applications. Nanocomposite membranes prepared by this approach have
shown great promise in solubility-based separations [110-113]. Previous work in our group [110,
112] has led to structure-property relationships for membranes comprising organochlorosilanes
attached to porous alumina. This work showed that we can rationally modify permeation
properties by selecting pore size, and type and amount of organic compound deposited.
Page 103
89
Figure 6-1 Upper bound relation for O2 / N2 separation [46]
Page 104
90
In this study, we extend this concept of engineering the membrane nano-architecture by
exploring a new type of organic compound structure and chemistry, melamine-based dendrimers.
Dendrimers are a potential useful class of organic compounds for this purpose due to their wide
range of structural and chemical diversity [114-116]. Dendrimer-ceramic nanocomposite
membranes were prepared by growing several generations directly off the surface of mesoporous
alumina membrane. We achieved reasonable selectivities by engineering the dendrimeric organic
phase and carefully screening the effects of the pore size of the mesoporous substrate.
PDMS is a rubbery silicone polymer that has one of the lowest glass transition
temperatures. PDMS has been investigated extensively as a suitable material for removal of
different solvents from air or nitrogen. The permeabilities of different solvents and gases through
PDMS were studied by several groups [117, 118]. Their study showed that solvent permeabilities
strongly depend on the solvent concentration and that it is much related with the sorption of the
solvent into the polymer. Leemann et al. investigated the performance of PDMS membrane in
the removal of toluene from nitrogen [119]. They showed that within certain regimes of purity
and flow the PDMS membrane system could be an economical alternative to the conventional
processes. However, PDMS has been shown to be prone to plasticization, which may greatly
reduce its selectivity when exposed to actual gas mixtures [120]. As discussed earlier, organic-
inorganic composite membranes have shown better properties and therefore in our work we
synthesized PDMS-ceramic composite membranes using dip coating method and the gas
permeance properties of the composite membranes were evaluated.
Page 105
91
6.2 Experimental
6.2.1 Synthesis of Dendrimer-ceramic Composite Membrane
Ammonium hydroxide, dichloromethane, ethanol, hydrochloric acid, hydrogen peroxide,
methanol, tetrahydrofuran, and toluene (ACS reagent grade) were purchased from Fisher
Scientific. 3-aminopropyldimethylethoxysilane (APDMES, 99%) was purchased from Gelest
Inc. N, N-diisopropylethylamine (DIPEA, 99%) were purchased from Aldrich. Cyanuric chloride
(CC, 99%) was purchased from ACROS. All chemicals were used as received.
The membranes used in this work were Membralox
T1-70-25G-Bare, -alumina
membranes with an average pore size of 5nm (Part# S700-01227). They were purchased from
US Filter Ceramic Membrane Products, Deland, Florida. These membranes have been discussed
in detail by Liu and co-workers who have described and characterized them in two part
series[121, 122]. The membranes have an extruded tubular macroporous -alumina support with
a thickness of 2nm and an average pore size of 10 m. The macroporous support is coated by
slip casting and firing two more layers of -alumina with average pore diameters of 0.8 and 0.2
m, respectively. The final layer, which is 3-5 m thick, is a -alumina layer that is slip cast and
fired to yield an average pore size of 5 nm and a porosity of 50 % [121]. Figure 6-2 shows a
scanning electron micrograph (SEM) of the membrane cross section. The membrane tube outer
and inner diameters were 1cm and 0.7 cm respectively. The tubes were received in 25 cm
lengths, and for our experiments we cut them into 1 inch long pieces, using a laboratory glass
cutter. After cutting, the membranes were cleaned by soaking in 2:1 ethanol/water solution for 24
hours at ambient temperature. The membranes were dried at 60 C for 30 min and stored in
Page 106
92
Figure 6-2 SEM image of 5 nm Membralox
alumina membrane
Page 107
93
laboratory environment. Single gas permeation data for nitrogen and propane were obtained
according to the procedure described in section 6.2.4.
A stepwise synthesis of dendrons growing divergently from the surface of mesoporous
alumina membranes is shown in Figure 6-3. The amine functionalization of membranes was
done with a 0.1M solution of 3-animopropyldimethlyethoxysilane in toluene. Prior to treatment,
RCA (Radio Corporation of America) cleaning was applied to the membranes. For this purpose
the membrane pieces were submerged in 75 ml of 5:1:1 H2O: H2O2: NH4OH (organic cleaning
solution) and then heated to 80 C for 15 min on a hotplate. After rinsing the membranes with
deionized water, membranes were treated in the same manner using 75 ml of 6:1:1 H2O: H2O2:
HCl (ionic cleaning solution). The treated membranes were stored in an oven at 100 C before
the amine functionalization. A silane treated membrane was rinsed with toluene and THF and
then submerged into 0.15 M solution of cyanuric chloride dissolved in THF. During this step, the
surface amines were allowed to react with cyanuric chloride to give dichlorotriazine
intermediate, branch-point. The dichlorotriazine was the allowed to react with piperazine by
immersing the membranes into 0.3M solution of the piperazine in THF. The treatment with
triazine and piperazine was repeated alternately to reach each generation. Dendrimers of third
generation (G3) were grown. Finally, dodecyl amine was attached to provide the specific
chemical functionality.
6.2.2 Synthesis of Polymer-ceramic Composite Membranes
Tetrahydrofuran (ACS reagent grade) was purchased from Fisher Scientific.
Polydimethylsiloxane (PDMS: Mw 92400, Mn 46000 g/mol) was purchased from Aldrich.
Anopore
aluminum oxide membranes were purchased from Whatman and used as received.
Page 108
94
Fig
ure
6-3
Gro
wth
of
mel
amin
e-bas
ed d
endri
mer
on t
he
surf
ace
of
the
mes
oporo
us
alum
ina
mem
bra
ne
Page 109
95
Anodic aluminum membranes, irrespective of nominal pore size, have an asymmetric structure
[123-125]. The structure comprises a relatively thin (0.5 to 1.0 m) layer on top of a thicker (59
to 59.5 m) support. The asymmetry appears to be a natural consequence of the way the
membranes are made by anodic oxidation [123]. The thin “active” layer generally has the smaller
pore size, as compared to the thicker “support” layer. Anopore
membrane of nominal pore size
20 nm has the thin active layer of 25 nm pore size and the thicker support layer of 100 nm pore
size. Figure 6-4 shows a scanning electron micrograph (SEM) of the surface of the thicker
support layer.
PDMS-anopore composite membranes were prepared by simple dip coating method.
Anopore membrane was immersed in a solution of PDMS dissolved in THF and then quickly
drawn out. Figure 6-5 is a schematic of how the composite membranes were fabricated. The top
and bottom surfaces of the membrane were gently cleaned with THF to remove the PDMS
deposited on the surfaces. The dip-coated membranes were dried at 40 C. As the solvent
evaporates, the pores of the membrane are filled with PDMS. Solutions of varying
concentrations were prepared to see the effect of PDMS concentration on the membrane
performance. Single gas permeation data for nitrogen, carbon dioxide, methane, and propane
were obtained according to the procedure described in section 6.2.4.
6.2.3 Single Gas Permeation Set-up
Page 110
96
Permeation measurements on the individual gases were performed using an in-house unit.
Pure helium, carbon dioxide, methane, and propane gases were used as received from Airgas.
The schematic for the single gas permeation experiments is given in Figure 6-6. The membrane
was held in a steel module. Two different membrane modules were used for different membrane
Figure 6-4 SEM image of untreated 20 nm Anopore
alumina membrane
Page 111
97
Figure 6-5 Schematic of the synthesis procedure
Polymer + THF
solution
Dip coating
Drying at 40 C
Page 112
98
Figure 6-6 Schematic of the dead-end pure gas permeation experiment
Page 113
99
types. A shell-tube module was used for the Membralox
cylindrical membrane and a disc
module was used for Anopore
disc membrane. Each membrane module has two openings, one
for feed and the other for permeate (shell-tube module was dead-ended on one of the tube ends).
Screw caps and rubber gaskets were used for proper sealing. Feed gas from the cylinder was
supplied to the feed inlet and flowed across the membrane through the outlet. The pressure on
the feed side was measured with a digital pressure gauge. Since the outlet was at atmospheric
pressure, the gauge pressure reading was considered as the pressure drop across the membrane.
The permeate flow was measured using a bubble flow meter that was exhausted to the vent hood.
Block valves were placed on feed and permeate outlets.
A leak test was performed prior to each single gas permeation experiment. The
membrane was placed inside the module, and with the retentate valve closed, feed gas was
introduced to the module. When the pressure drop across the membrane was around 1 bar, the
feed and permeate valves were closed to isolate the membrane module. A continuous drop in the
pressure would indicate the presence of leak, in which case a soap solution was used to detect the
source of the leak. In no pressure drop was observed within a period of five minutes, the
apparatus was considered to be free of leaks.
Once the leak test was satisfactorily completed, the feed and the permeate valves were
opened. The retentate was closed for a shell-tube module so that a “dead-end” experiment could
be done. Pressure drop across the membrane was set to the desired value by adjusting the
regulator on the gas cylinder. The pressure drop was monitored until it reached the set-point
Page 114
100
value, after which permeate volumetric flow rate was measured using the bubble flow meter and
a stopwatch. At least four measurements were taken at each pressure and are averaged to
determine the permeate flow rate. Volumetric flow rate was measured for at least three different
pressure readings. After completing the set of readings for one gas, the gas flow from the
cylinder was stopped and the retentate valve was opened to quickly release the gas from inside
the module. The feed tubing was then connected to the next gas cylinder and with the retentate
valve open, gas was slowly introduced into the module. The retentate valve was kept open for
about 30 seconds after which it was closed. This procedure was done to ensure that no gas from
the previous experiment was left inside and the system had been completely flushed with the
new gas. Volumetric flow rate was again monitored at different feed pressure readings. This
procedure was then repeated until all the data needed for the different gases had been obtained.
During the permeation experiment, room temperature and barometric pressure were noted to
make the necessary connection for converting volumetric flow rate to molar flow rate using ideal
gas equation.
6.2.4 Permeance Calculation
This section describes the procedure for calculating the singe gas permeances. As noted
above, volumetric flow rate was measured for different pressure readings. The volumetric flow
rates were converted to molar flow rate assuming ideal gas behavior, as given by Equation (6-5)
below
0
0
4.22
1
1000
1
secsec)/(
p
p
T
T
l
gmol
ml
lmlQgmolN (6-5)
where
T0 = 273 K
Page 115
101
T = ambient room temperature (K)
p0 = 1.01 bar
p = ambient pressure reading (bar)
The surface area of the membrane, available for flow, was calculated using Equation (6-6)
LDmArea )( 2 for a cylindrical membrane
or 2R for a disc membrane
where
D = internal diameter of the cylindrical membrane (m)
L = length of the cylindrical membrane (m)
R = radius of the disc membrane (m)
The membrane flow area was determined to be 0.000559 m2 for Membralox
membrane and to
be 0.000346 m2 for Anopore
by using Equation (6-6).
The gas flux J through the membrane was calculated by dividing the molar flow rate with the
membrane flow area.
area
N
m
gmolJ
2sec
(6-7)
Permeance is related to flux through Equation (6-8)
p
J
barm
gmolP
2sec
(6-8)
where p is pressure drop across the membrane (bar).
Permeance was obtained directly using Equation (6-8). The intrinsic property of the
membrane is permeability which is the product of the permeance and the thickness of the
membrane. We have no direct data on the thickness of the active layer, which controls transport
(6-6)
Page 116
102
in our membranes, so therefore we report permeances instead of permeabilities. During the
course of this study the room temperature ranged from 18 to 22 C, while the ambient pressure
varied between 0.97 to 1.02 bars.
6.3 Results and Discussion
6.3.1 Dendrimer-ceramic Composite Membranes
Bare membrane single gas permeance and ideal selectivity data for nitrogen and propane
for three identical membranes (MM11, MM12, and MM24) are given in Table 6-1. Nitrogen has
an average permeance of 0.82 0.13 mol sec-1
m-2
bar-1
for untreated 5nm membranes. This
result is in good agreement with the data provided by US Filter in which nitrogen permeance for
the 5nm membranes is given as 0.87 0.248 mol sec-1
m-2
bar-1
.
Propane/nitrogen selectivities for the bare membranes are greater than theoretical
Knudsen selectivity, which is 0.8. Figure 6-7 shows nitrogen and propane single gas permeances
for MM24 untreated membrane. Nitrogen permeance is almost constant with transmembrane
pressure. Furthermore the mean free path of nitrogen (under the experimental conditions) is 47
nm, and is greater than the average pore diameter. This result strongly suggests that the Knudsen
diffusion is the dominant mechanism of transport for nitrogen. However, propane permeance
increased with transmembrane pressure until a maximum was reached at about 5 bar. This
corresponds to an absolute feed pressure of about 6 bar. The capillary condensation pressure for
propane in the 5 nm pores, as calculated from the “uncorrected” Kelvin equation is 6.4 bar [126-
128]. These results strongly suggest that surface effects, and eventually capillary condensation,
are important for propane in the membrane. Therefore, propane/nitrogen selectivity is less than
the theoretical Knudsen selectivity.
Page 117
103
Single gas permeance and selectivity data for dendrimer-modified membranes are given
in Table 6-2. For the surface-modified membranes we observed an overall drop of two to three
Table 6-1 Single gas permeance and selectivity data at 1.38 bar transmembrane pressure for
three untreated identical membranes
Membrane
Permeance,
mol sec-1
m-2
bar-1
Selectivity
Nitrogen, N2 Propane, C3H8 C3H8/ N2
MM11 0.95 1.76 1.85
MM12 0.72 1.39 1.93
MM24 0.78 1.6 2.05
Page 118
104
Figure 6-7 Nitrogen and propane permeances for MM24 untreated membrane, as a function of
transmembrane pressure
0
0.6
1.2
1.8
2.4
3
0 2 4 6 8
Per
mea
nce
(m
ol/
(sec
- m
2-b
ar)
Transmembrane pressure (bar)
Nitrogen
Propane
Page 119
105
Table 6-2 Single gas permeance and selectivity data for dendrimer-modified membranes at 1.38
bar transmembrane pressure for three identical membranes
Membrane
Permeance,
mol sec-1
m-2
bar-1
Selectivity
Nitrogen, N2 Propane, C3H8 C3H8/ N2
MM11 0.001012 0.003192762 3.15
MM12 0.001873 0.002879 1.54
MM24 0.001074 0.002243 2.07
Page 120
106
orders of magnitude in nitrogen and propane permeances accompanied by a slight or no increase
in the propane/nitrogen selectivity. While these results are not promising, previous research in
our group, using identical synthesis procedure, showed very wide range of propane/nitrogen
selectivities for the G3 membranes and it was found that the pore size variance of the untreated
mesoporous substrate and the residual solvent in the membranes appeared to be critical to the
membrane performance [116]. To confirm that hypothesis we decided to test for solvent effects
by taking existing membranes through a cycle of re-rinsing and drying. Figure 6.8 shows the
propane/nitrogen selectivity for MM11 membrane after a series of rinsing/drying treatments. In
this figure, Initial is the first measurement of permeance and the selectivity after synthesis. After
each THF soaking, the membrane was dried in ambient condition for 30 min and the permeation
measurements were taken. Finally, the membrane was dried at 40 C before taking final
readings. The first THF soaking showed a slight increased selectivity compared to initial result.
However, there was a remarkable increase in selectivity after the second THF soaking.
Furthermore the membrane performance was back to Initial when dried at 40 C. On the other
hand, nitrogen permeance is unaffected by residual THF as shown in Figure 6-8. This indicates
that there is an effect caused by residual solvent (THF) in the membrane on propane permeance.
Although the adsorbed solvent in the membranes is removed at 40 C, the adsorption was strong
enough not to cause the abrupt change of permeance and selectivity during the permeation test,
which was carried out around 20 C.
6.3.2 PDMS-ceramic Composite Membranes
Figure 6-9 shows single gas permeances of nitrogen, carbon dioxide, methane, and
propane and ideal selectivities of different gas pairs for untreated 20 nm Anopore membranes as
a function of transmembrane pressure. For this pore size, under the near-ambient conditions
Page 121
107
Figure 6-8 Effect of solvent rinsing/drying on propane and nitrogen permeances for modified
MM11 membrane. Measurements were taken at 1.38 bar
0
5
10
15
20
25
0.0001 0.001 0.01 0.1
Sel
ecti
vit
y, C
3H
8/N
2
Propane permeance (mol/sec-m2-bar)
Initial
Soaking in THF for 12
hrs
Soaking in THF for 17
hrs
Drying at 313K
0
0.005
0.01
0.015
0.02
0.025
0.0001 0.001 0.01 0.1
Pro
pan
e per
mea
nce
(m
ol/
sec-
m2-b
ar)
Nitrogen permenace (mol/sec-m2-bar)
Initial
Soaking in THF for 12
hrs
Soaking in THF for 17
hrs
Drying at 313K
Page 122
108
Figure 6-9 Plot of gas permeances and selectivities of different gas pairs for untreated 20 nm
Anodisc membrane as a function of transmembrane pressure.
Page 123
109
used in the experiments, a combination of Knudsen diffusion and Poiseuille (viscous) flow is
expected [126]. At 20 psig, a methane/nitrogen selectivity of 1.38 and a carbon dioxide/nitrogen
selectivity of 0.89 are close to what a Knudsen separation (square root of the inverse ratio of
molecular weights) would yield, which in both cases would be 1.32 and 0.8 respectively. In case
of purely Knudsen diffusion, the permeance is constant and is independent of transmembrane
pressure. However, the results for nitrogen, carbon dioxide, and methane show that the
permeances increase slightly as the transmembrane pressure is increased. This indicates the
presence of some Poiseuille flow, in addition to Knudsen diffusion. Another way of estimating
the presence of Knudsen diffusion is by comparing the pore size to the characteristic mean free
path of the gas. At 20 psig and 20 C, the mean free paths of nitrogen, carbon dioxide, and
methane are 28, 35, and 26 nm, respectively. The mean free paths are larger than the pore
diameter (20 nm) indicating the presence of Knudsen diffusion. Therefore a combination of
Knudsen diffusion and viscous flow is the mechanism of transport for nitrogen, carbon dioxide
and methane. On the other hand, a propane/nitrogen selectivity of 1.18 is quite contrary to
Knudsen separation limit (0.8). In addition, Figure 6-9 shows that propane permeance increased
more quickly with transmembrane pressure when compared to other gases. As discussed earlier
the situation for propane is more complicated. Under the conditions studied, propane is expected
to have significant contributions from surface flow and possibly capillary condensation
mechanisms in parallel with Knudsen and Poiseuille.
PDMS solutions of varying concentrations in THF (1 mg/ml, 5mg/ml, and 7.5 mg/ml)
were prepared and several PDMS- Anopore
composite membranes were synthesized using the
procedure described in the section 6.2.2. Pure gas permeation studies were done with propane
and nitrogen. Figures 6-10 and 6-11 show the effect of PDMS concentration on the separation
Page 124
110
performance. For comparison bare membrane performance data is also included. Treatment with
1 mg/ml of PDMS solution caused no significant change in the membrane structure. The propane
Page 125
111
Figure 6-10 Permeances as a function of transmembrane pressure. Effect of PDMS
concentration and on nitrogen (Top) and propane (Bottom) permeance.
Figure 6-11 Propane/nitrogen selectivity as a function of transmembrane pressure. Effect of
PDMS concentration.
Page 126
112
and nitrogen permeance and propane/nitrogen selectivity data is statistically similar to bare
membrane permeance and selectivity data. The concentration of PDMS is too low to have much
effect on transport through the mesopores and thus there is no significant change in the
membrane performance. By contrast, there is a substantial decrease in the permeances
accompanied by an increase in the selectivity when the concentration of PDMS in the solution is
increased to 5mg/ml and 7.5 mg/ml. As the PDMS concentration increases the amount of
polymer adsorbed in the mesopores of the inorganic support increases, which increases the
membrane performance was observed. So we can conclude that at this concentration, the
mesopores are completely filled with polymer and the performance of the membrane is
determined by the nature of the polymer. Single gas permeation experiments were also
performed with carbon dioxide and methane for these composite membranes. The data is
summarized in Table 6-3. After modification, the membranes exhibited solubility-selective
separation.
6.4 Conclusions
The current study reports synthesis of organic-inorganic nanocomposite membranes and
their application to relevant gas separations. One set of composite membranes was prepared by
growing a melamine-based dendrimer directly off a commercial alumina membrane with 5 nm
mesopores. Dendrimers are a promising class of organic molecules for this purpose due to wide
range of structural and chemical diversity. Although surface modification resulted in a loss of
permeance, the permselectivity of propane over nitrogen is not changed much. The effect of
residual solvent on composite membrane performance was explored.
Page 127
113
We also prepared PDMS-inorganic composite membranes using dip coating method. The
permeation data for nitrogen, methane, carbon dioxide, and propane indicates that the effective
Table 6-3 Single gas permeance and selectivity data for composite membranes (modified with
7.5 mg/ml of PDMS in THF) at 30 psi transmembrane pressure. For comparison bare membrane
data is also presented.
Permeance (mol/sec-m2-bar) Selectivity (Pgas/PN2)
Gas Bare Composite Bare Composite
Nitrogen 4.186 0.00494 1 1
Methane 5.848 0.01448 1.38 3
Carbon dioxide 3.834 0.04747 0.92 9.72
Propane 5.260 0.1286 1.26 25
Page 128
114
pore size of the membrane can be manipulated based on the PDMS concentration. The results
indicate that membranes modified with 7.5 mg/ml of PDMS concentration in toluene have
propane/nitrogen selectivity values of composite membranes were comparable to polymeric
PDMS membranes.
Page 129
115
CHAPTER 7
CONCLUSIONS AND SUMMARY
This dissertation focused on investigating the possibility of separation of carboxylic acids
from aqueous fraction of fast pyrolysis bio-oils (AFBO) using membrane technology, in
particular nanofiltration (NF) and reverse osmosis (RO) processes. A separate project studied
modification of the surfaces of mesoporous alumina membranes with a selective organic material
that is physically or chemically anchored to the porous surfaces, in order to tune the gas
separation properties.
Fast pyrolysis bio-oil, a potential source of sustainable energy, has attracted
considerable recent attention due to an increase in energy demand and potential shortages and
environmental concerns associated with fossil fuels. However, the direct use of bio-oil is limited
due to its high viscosity, corrosiveness, and high char content. AFBO is convenient to process
and contains sugars, acids and other low molecular weight organic compounds that can be
converted to fuels and/or chemicals. However, the acidity of AFBO is relatively high and the
removal of acids is essential to prevent corrosion of processing equipment and for further
upgrading. Membrane based separations, generally targeted for aqueous streams containing little
or no organic solvents, are extended to separate acids from organic-rich streams.
Commercially available polymeric NF and RO membranes were used to study the
feasibility of separating carboxylic acids from sugars in AFBO. Initial experiments were run with
single and binary solute model aqueous solutions to test the performance of the membranes. The
performance of these membranes was sensitive to cross flow operating parameters (cross flow
Page 130
116
velocity, transmembrane pressure, and concentration). Cross flow velocity had a strong effect on
glucose retention, due to the well-known concentration polarization effect. In general, increasing
the transmembrane pressure resulted in higher permeate flux and higher solute retentions. This
can be explained using solution-diffusion mechanism for solvent and solute permeation through
the membrane. According to this mechanism the solvent (water) flux increases with the
transmembrane pressure but the solute flux doesn’t and therefore solute retention increases.
Increasing the feed concentration resulted in flux reduction. Possible explanations could include
increase in concentration polarization, viscosity, and osmotic pressure, adsorption and blocking
of the membrane pores. The effect of pretreatment by pressure on membrane was explored. An
inverse correlation was observed between permeance and retention of untreated and treated
membranes, i.e. high retentions are accompanied by low permeances and vice versa.
Based on single and binary aqueous solutions data, it appeared that it was possible to
separate acetic acid and glucose using nanofiltration and/or reverse osmosis when operated at
high pressure and high cross flow velocity. However, all the membranes were permanently
damaged when exposed to model AFBO. Subsequent experiments revealed that the membranes
are strongly susceptible to damage by phenolic compounds, especially to guaiacol. Optical
microscopic images of both virgin and guaiacol treated membrane also confirmed the damage.
Experiments with guaiacol-free model AFBO showed that high retentions (> 80%) of glucose are
possible with NF membranes at higher transmembrane pressures (~ 60 bar).
The solution-diffusion model (SD) was employed to predict the flux and retention of
single solute solutions of glucose and acetic acid. Film theory was used to model concentration
polarization. Pure water permeability coefficients obtained are in consistent with the
manufacturer’s values. However, both solvent flux and solute retention predicted by SD model
Page 131
117
are not in good agreement with the experimental data. We assume that high concentrations used
in our experiments might be a cause for the mismatch.
This study shows that the separation of acids and other low molecular weight compounds
from sugars in AFBO using NF membranes appears to be feasible, with two important caveats.
First, the commercial membranes studied here were irreversibly damaged when brought in
contact with phenolics, prevalent compounds in AFBO. A practical membrane process would
require a different, resistant polymer formulation or a pretreatment to remove phenolics. Second,
relatively high transmembrane pressures ( 60 bar) are needed to achieve reasonably good
retention of glucose ( 80%).
We synthesized organic-inorganic composite membranes by growing the melamine-based
dendrimer directly off the commercial mesoporous alumina membranes. The permselectivity of
the dendrimer-alumina composite membranes for propane over nitrogen is not changed
significantly though there was a loss in permeance. PDMS-alumina composite membranes,
especially the membranes modified with 7.5 mg/ml of PDMS concentration in toluene, showed
propane/nitrogen selectivity values comparable with polymeric PDMS membranes. This study
shows that we can modify permeation properties of nanocomposite membranes by rationally
choosing selective organic materials to tailor membrane characteristics to the recovery of higher
hydrocarbons from air.
Page 132
118
BIBLIOGRAPHY
[1] G.W. Huber, S. Iborra, A. Corma, Synthesis of Transportation Fuels from Biomass:
Chemistry, Catalysts, and Engineering, Chem. Rev., 106 (2006) 4044-4098.
[2] S. Czernik, a.V. Bridgwater, Overview of Applications of Biomass Fast Pyrolysis Oil,
Energy & Fuels, 18 (2004) 590-598.
[3] A.V. Bridgwater, D. Meier, D. Radlein, An overview of fast pyrolysis of biomass, Org.
Geochem., 30 (1999) 1479-1493.
[4] D. Mohan, C.U. Pittman, P.H. Steele, Pyrolysis of Wood/Biomass for Bio-oil: A Critical
Review, Energy & Fuels, 20 (2006) 848-889.
[5] M. Mudler, Basic Principles of Membrane Technology, Kulwer Academic Publishers, 1996.
[6] W.S.W. Ho, K.K. Sirkar, Membrane Handbook, Kluwer Acedemic Publishers, 1992.
[7] T. Rachwal, S. Judd, A synopsis of membrane technologies in UK municipal potable water
treatment: histroy, status and prospects, Water and Environmental Journal, 20 (2006) 110-113.
[8] B. Van der Bruggen, C. Vandecasteele, Distillation vs. membrane filtration: overview of
process evolutions in seawater desalination, Desalination, 143 (2002) 207-218.
[9] G. Wade Miller, Integrated concepts in water reuse: managing global water needs,
Desalination, 187 (2006) 65-75.
[10] M. Into, A.-S. Jönsson, G. Lengdén, Reuse of industrial wastewater following treatment
with reverse osmosis, Journal of Membrane Science, 242 (2004) 21-25.
[11] L.R. Raman, M. Cheryan, N. Rajagopalan, Solvent recovery and partial deacidification of
vegetable oils by membrane technology, Fett/Lipid, 98 (1996) 10-14.
Page 133
119
[12] M.J. Bridge, K.W. Broadhead, V. Hlady, P.A. Tresco, Ethanol treatment alters the
ultrastructure and permeability of PAN-PVC hollow fiber cell encapsulation membranes, Journal
of Membrane Science, 195 (2002) 51-64.
[13] R. Subramanian, M. Nakajima, T. Kawakatsu, Processing of vegetable oils using polymeric
composite membranes, Journal of Food Engineering, 38 (1998) 41-56.
[14] L.S. White, I.-F. Wang, B.S. Minhas, Polyimide membranes for separation of solvents from
lube oil, in, US Patent 5, 264, 166, 1993.
[15] L.S. White, A.R. Nitsch, Solvent recovery from lube oil filtrates with a polyamide
membrane, Journal of Membrane Science, 179 (2000) 267-274.
[16] A.V. Bridgwater, G.V.C. Peacocke, Fast pyrolysis processes for biomass, Renewable
Sustainable Energy Rev., 4 (2000) 1-73.
[17] A.V. Bridgwater, Fast Pyrolysis of Biomass: A Handbook, in, CPL Press, 2002.
[18] T.P. Vispute, H. Zhang, A. Sanna, R. Xiao, G.W. Huber, Renewable chemical commodity
feedstocks from integrated catalytic processing of pyrolysis oils, Science, 330 (2010) 1222-1227.
[19] Q. Lu, W.Z. Li, X.F. Zhu, Overview of fuel properties of biomass fast pyrolysis oils, Energy
Convers. Manage., 50 (2009) 1376-1383.
[20] P. Badger, S. Badger, M. Puettmann, P. Steele, J. Cooper, Techno-Economic Analysis:
Preliminary Assessment of Pyrolysis Oil Production Costs and Material and Energy Balance
Associated with a Trasportable Fast Pyrolysis System, BioResources, 6 (2010) 34-47.
[21] M. Ringer, V. Putsche, J. Scahill, Large-Scale Pyrolysis Oil Production: A Technology
Assessment and Economic Analysis, in, 2006.
[22] S.M. Ryan, P. Alexandru, J.A. Satrio, R.C. Brown, Techno-economic analysis of biomass-
to-liquids production based on gasification, Fuel, 89 (2010) S11-S19.
Page 134
120
[23] R.P. Anex, A. Aden, F.K. Kazi, J. Fortman, R.M. Swanson, M.M. Wright, J.A. Satrio, R.C.
Brown, D.E. Daugaard, A. Platon, G. Kothandaraman, D.D. Hsu, A. Dutta, Techno-economic
comparison of biomass-to-transportation fuels via pyrolysis, gasification, and biochemical
pathways, Fuel, 89 (2010) S29-S35.
[24] T.P. Vispute, G.W. Huber, Production of hydrogen, alkanes and polyols by aqueous phase
processing of wood-derived pyrolysis oils, Green Chem., 11 (2009) 1433-1445.
[25] G.W. Huber, R.D. Cortright, J.A. Dumesic, Renewable alkanes by aqueous-phase reforming
of biomass-derived oxygenates, Angew. Chem., 116 (2004) 1575-1577.
[26] R.D. Cortright, R.R. Davda, J.A. Dumesic, Hydrogen from catalytic reforming of biomass-
derived hydrocarbons in liquid water, Nature, 418 (2002) 964-967.
[27] D.C. Elliott, T.R. Hart, G.G. Neuenschwander, L.J. Rotness, A.H. Zacher, Catalytic
hydroprocessing of biomass fast pyrolysis bio-oil to produce hydrocarbon products,
Environmental Progress & Sustainable Energy, 28 (2009) 441-449.
[28] P.J. Dauenhauer, B.J. Dreyer, N.J. Degenstein, L.D. Schmidt, Millisecond Reforming of
Solid Biomass for Sustainable Fuels, Angew. Chem. Int. Ed., 46 (2007) 5864-5867.
[29] I.M. de Manchilha, M.N. Karim, Evaluation of ion exchange resins for removal of
inhibitory compounds from corn stover hydrolyzate for xylitol fermentation, Biotechnol. Prog.,
19 (2003) 1837-1841.
[30] J.C. Parajo, H. Dominguez, J.M. Dominguez, Biotechnological production of xylitol. Part 3.
Operation in culture media made from lignocellulosic hydrolysates, Bioresour. Technol., 66
(1998) 25-40.
[31] S.I. Musssatto, I.C. Roberto, Alternatives for detoxification of diluted-acid lignocellulosic
hydrolysates for use in fermentative processes: a review, Bioresour. Technol., 93 (2004) 1-10.
Page 135
121
[32] H.J. Huang, S. Ramaswamy, U.W. Tschirner, R.B. V., A review of separation technologies
in current and future biorefineries, Sep. Purif. Technol., 62 (2008) 1-21.
[33] B. Han, W. Carvalho, L. Canilha, S.S. da Silva, J.B. Almeida e Silva, J.D. McMillan, S.R.
Wickramasinghe, Adsorptive membranes vs. resins for acetic acid removal from biomass
hydrolysates, Desalination, 193 (2006) 361-366.
[34] D.L. Grzenia, D.J. Schell, S.R. Wickramasinghe, Membrane extraction for removal of acetic
acid from biomass hydrolysates, Journal of Membrane Science, 322 (2008) 189-195.
[35] A. Fick, Über diffusion, Annalen der Physik Chemie, 94 (1855) 59-86.
[36] T. Graham, On osmotic force, Philosophical Transactions of the Royal Society of London,
144 (1854) 177-228.
[37] T. Graham, On the absorption and dialytic separation of gases colloid septa, Philosophical
Magazine, 32 (1866) 401-420.
[38] H.K. Lonsdale, The growth of membrane technology, Journal of Membrane Science, 10
(1982) 81-181.
[39] H. Bechhold, Investigations on colloids by filtration method, Biochem. Z., 6 (1907) 379-
408.
[40] R. Zsigmondy, W. Bachmann, Über neue Filter, Z. Anorg. Chem., 103 (1918) 119-128.
[41] W.J. Elford, Principles governing the preparation of membranes having graded porosities.
The properties of “gradocol” membranes as ultrafilters, Trans. Faraday. Soc., 33 (1937) 1094-
1104.
[42] J.D. Ferry, Ultrafilter membranes and ultrafiltration, Chem. Rev., 18 (1936) 373-455.
[43] S. Loeb, S. Sourirajan, Sea water demineralization by means of an osmotic membrane,
Advances in Chemistry Series, 38 (1962) 117-132.
Page 136
122
[44] J.M.S. Henis, M.K. Tripodi, A novel approach to gas separation using composite hollow
fiber membraes, Separation Science and Technology, 15 (1980) 1059-1068.
[45] E. Drioli, L. Giorno, Membrane operations: Innovative separations and transformation, in,
Wiley-VCH Verlag GmbH & Co. KGaA, Weinheim, 2009.
[46] R.W. Baker, Membrane Technology and Applications, John Wiley & Sons, Ltd, West
Sussex, England, 2004.
[47] R. Mahajan, W.J. Koros, Mixed matrix membrane materials with glassy polymers. Part 1,
Polymer Engineering & Science, 42 (2002) 1420-1431.
[48] B. Van Der Bruggen, C. Vandecasteele, T. Van Gestel, W. Doyen, R. Leysen, A review of
pressure-driven membrane processes in wastewater treatment and drinking water production,
Environmental Progress, 22 (2003) 46-56.
[49] C.E. Reid, J.R. Kuppers, Physical characteristics of osmotic membranes of organic
polymers, Journal of Applied Polymer Science, 2 (1959) 264-272.
[50] C.E. Reid, E.J. Breton, Water and ion flow across cellulosic membranes, Journal of Applied
Polymer Science, 1 (1959) 133-143.
[51] J.E. Cadotte, Evolution of Composite Reverse Osmosis Membranes, in: Materials Science
of Synthetic Membranes, American Chemical Society, 1985, pp. 273-294.
[52] T. Kawaguchi, H. Tamura, Chlorine-resistant membrane for reverse osmosis. I. Correlation
between chemical structures and chlorine resistance of polyamides, Journal of Applied Polymer
Science, 29 (1984) 3359-3367.
[53] J. Glater, S.-k. Hong, M. Elimelech, The search for a chlorine-resistant reverse osmosis
membrane, Desalination, 95 (1994) 325-345.
Page 137
123
[54] S. Avlonitis, W.T. Hanbury, T. Hodgkeiss, Chlorine degradation of aromatic polyamides,
Desalination, 85 (1992) 321-334.
[55] G.M. Geise, H.-S. Lee, D.J. Miller, B.D. Freeman, J.E. McGrath, D.R. Paul, Water
purification by membranes: The role of polymer science, Journal of Polymer Science Part B:
Polymer Physics, 48 (2010) 1685-1718.
[56] C.S. Slater, R.C. Ahlert, C.G. Uchrin, Applications of reverse osmosis to complex industrial
wastewater treatment, Desalination, 48 (1983) 171-187.
[57] A.H. Ghabris, M. Abdel-Jawad, G.S. Aly, Municipal wastewater renovation by reverse
osmosis state of the art, Desalination, 75 (1989) 213-240.
[58] A.S. Jönsson, R. Wimmerstedt, The application of membrane technology in the pulp and
paper industry, Desalination, 53 (1985) 181-196.
[59] S. Basu, V.S. Sapkal, Membrane technique in simplification of soda recovery process in
pulp and paper industry, Desalination, 67 (1987) 371-379.
[60] M.E. Williams, D. Bhattacharyya, R.J. Ray, S.B. McCray, Selected applications of reverse
osmosis, in: W.S.W. Ho, K.K. Sirkar (Eds.) Membrane Handbook, Van Nostrand reinhold, New
York, 1992, pp. 312-354.
[61] F.G. Donnan, The Theory of Membrane Equilibria, Chem. Rev., 1 (1924) 73-90.
[62] J. Schaep, B. Van der Bruggen, S. Uytterhoeven, R. Croux, C. Vandecasteele, D. Wilms, E.
Van Houtte, F. Vanlerberghe, Removal of hardness from groundwater by nanofiltration,
Desalination, 119 (1998) 295-301.
[63] B.M. Watson, C.D. Hornburg, Low-energy membrane filtration for removal of color,
organics and hardness from drinking water supplies, Desalination, 72 (1989) 11-22.
Page 138
124
[64] A. Wahab Mohammad, R. Othaman, N. Hilal, Potential use of nanofiltration membranes in
treatment of industrial wastewater from Ni-P electroless plating, Desalination, 168 (2004) 241-
252.
[65] B. Van der Bruggen, I. De Vreese, C. Vandecasteele, Water Reclamation in the Textile
Industry: Nanofiltration of Dye Baths for Wool Dyeing, Industrial & Engineering Chemistry
Research, 40 (2001) 3973-3978.
[66] J.M.K. Timmer, J. Kromkamp, T. Robbertsen, Lactic acid separation from fermentation
broths by reverse osmosis and nanofiltration, Journal of Membrane Science, 92 (1994) 185-197.
[67] M.I. González, S. Alvarez, F.A. Riera, R. Álvarez, Lactic acid recovery from whey
ultrafiltrate fermentation broths and artificial solutions by nanofiltration, Desalination, 228
(2008) 84-96.
[68] Y. Pouliot, M.C. Wijers, S.F. Gauthier, L. Nadeau, Fractionation of whey protein
hydrolysates using charged UF/NF membranes, Journal of Membrane Science, 158 (1999) 105-
114.
[69] B. Van der Bruggen, C. Vandecasteele, Removal of pollutants from surface water and
groundwater by nanofiltration: overview of possible applications in the drinking water industry,
Environmental Pollution, 122 (2003) 435-445.
[70] P. Berg, G. Hagmeyer, R. Gimbel, Removal of pesticides and other micropollutants by
nanofiltration, Desalination, 113 (1997) 205-208.
[71] K. Ebert, F.P. Cuperus, Solvent resistant nanofiltration membranes in edible oil processing,
Membrane Technology, 1999 (1999) 5-8.
Page 139
125
[72] B. Van der Bruggen, J. Geens, C. Vandecasteele, Fluxes and rejections for nanofiltration
with solvent stable polymeric membranes in water, ethanol and n-hexane, Chemical Engineering
Science, 57 (2002) 2511-2518.
[73] Y. Zhao, Q. Yuan, Effect of membrane pretreatment on performance of solvent resistant
nanofiltration membranes in methanol solutions, Journal of Membrane Science, 280 (2006) 195-
201.
[74] D.R. Machado, D. Hasson, R. Semiat, Effect of solvent properties on permeate flow through
nanofiltration membranes. Part I: investigation of parameters affecting solvent flux, Journal of
Membrane Science, 163 (1999) 93-102.
[75] D.R. Machado, D. Hasson, R. Semiat, Effect of solvent properties on permeate flow through
nanofiltration membranes: Part II. Transport model, Journal of Membrane Science, 166 (2000)
63-69.
[76] D. Bhanushali, S. Kloos, C. Kurth, D. Bhattacharyya, Performance of solvent-resistant
membranes for non-aqueous systems: solvent permeation results and modeling, Journal of
Membrane Science, 189 (2001) 1-21.
[77] R. Subramanian, M. Nakajima, K. Raghavarao, T. Kimura, Processing vegetable oils using
nonporous denser polymeric composite membranes, Journal of the American Oil Chemists'
Society, 81 (2004) 313-322.
[78] H. Zwijnenberg, A. Krosse, K. Ebert, K. Peinemann, F. Cuperus, Acetone-stable
nanofiltration membranes in deacidifying vegetable oil, Journal of the American Oil Chemists'
Society, 76 (1999) 83-87.
Page 140
126
[79] J.P. Sheth, Y. Qin, K.K. Sirkar, B.C. Baltzis, Nanofiltration-based diafiltration process for
solvent exchange in pharmaceutical manufacturing, Journal of Membrane Science, 211 (2003)
251-261.
[80] P. Vandezande, L.E.M. Gevers, I.F.J. Vankelecom, Solvent resistant nanofiltration:
separating on a molecular level, Chemical Society Reviews, 37 (2008) 365-405.
[81] I.S. Han, M. Cheryan, Nanofiltration of model acetate solutions, J. Membr. Sci., 107 (1995)
107-113.
[82] M. Sagehashi, T. Nomura, H. Shishido, A. Sakoda, Separation of phenols and furfural by
pervaporation and reverse osmosis membranes from biomass-superheated steam pyrolysis-
derived aqueous solution, Bioresour. Technol., 98 (2007) 2018-2026.
[83] Y.-H. Weng, H.-J. Wei, T.-Y. Tsai, T.-H. Lin, T.-Y. Wei, G.-L. Guo, C.-P. Huang,
Separation of furans and carboxylic acids from sugars in dilute acid rice straw hydrolyzates by
nanofiltration, Bioresour. Technol., 101 (2010) 4889-4894.
[84] E. Sjöman, M. Mänttäri, M. Nyström, H. Koivikko, H. Heikkilä, Separation of xylose from
glucose by nanofiltration from concentrated monosaccharide solutions, Journal of Membrane
Science, 292 (2007) 106-115.
[85] Y.H. Weng, H.J. Wei, T.Y. Tsai, W.H. Chen, T.Y. Wei, W.S. Hwang, C.P. Wang, C.P.
Huang, Separation of acetic acid from xylose by nanofiltration, Sep. Purif. Technol., 67 (2009)
95-102.
[86] V.G.B. Berg, I.G. Rácz, C.A. Smolders, Mass transfer coefficients in cross-flow
ultrafiltration, Journal of Membrane Science, 47 (1989) 25-51.
[87] G.B. van den Berg, I.G. Rácz, C.A. Smolders, Mass transfer coefficients in cross-flow
ultrafiltration, Journal of Membrane Science, 47 (1989) 25-51.
Page 141
127
[88] M. Mänttäri, A. Pihlajamäki, E. Kaipainen, M. Nyström, Effect of temperature and
membrane pre-treatment by pressure on the filtration properties of nanofiltration membranes,
Desalination, 145 (2002) 81-86.
[89] V.B. Bruggen, J. Schaep, D. Wilms, C. Vandecasteele, Influence of molecular size, polarity
and charge on the retention of organic molecules by nanofiltration, J. Membr. Sci., 156 (1999)
29-41.
[90] P. Pontalier, A. Ismail, M. Ghoul, Mechanisms for the selective rejection of solutes in
nanofiltration membranes, Sep. Purif. Technol., 12 (1997) 175-181.
[91] H.K. Lonsdale, U. Merten, T. Tagami, Phenol transport in cellulose acetate membranes, J.
Appl. Polym. Sci., 11 (1967) 1807-1820.
[92] G. Laufenberg, S. Hausmanns, B. Kunz, The influence of intermolecular interactions on the
selectivity of several organic acids in aqueous multicomponent systems during reverse osmosis,
J. Membr. Sci., 110 (1996) 59-68.
[93] E. Vellenga, G. Trägårdh, Nanofiltration of combined salt and sugar solutions: coupling
between retentions, Desalination, 120 (1998) 211-220.
[94] X.J. Yang, A.G. Livingston, L.F. Santos, Experimental observations of nanofiltration with
organic solvents, J. Membr. Sci., 190 (2001) 45-55.
[95] A.K. Goulas, P.G. Kapasakalidis, H.R. Sinclair, R.A. Rastall, A.S. Grandison, Purification
of oligosaccharides by nanofiltration, J. Membr. Sci., 129 (2002) 312-335.
[96] A. Katchalsky, P.F. Curran, Nonequilibrium thermodynamics in biophysics, Harvard
University Press, Cambridge, MA, 1965.
[97] O. Kedem, A. Katchalsky, Thermodynamic analysis of the permeability of biological
membranes to non-electrolytes, Biochim. Biophys. Acta, 27 (1958) 229-246.
Page 142
128
[98] R.B. Bird, W.E. Stewart, E.N. Lightfoot, Transport phenomena, J. Wiley, 2007.
[99] W.L. McCabe, J.C. Smith, P. Harriott, Unit operations of chemical engineering, McGraw-
Hill, 2005.
[100] M. Perry, C. Linder, Intermediate reverse osmosis ultrafiltration (RO UF) membranes for
concentration and desalting of low molecular weight organic solutes, Desalination, 71 (1989)
233-245.
[101] M. Soltanieh, W.N. Gill, REVIEW OF REVERSE OSMOSIS MEMBRANES AND
TRANSPORT MODELS, Chemical Engineering Communications, 12 (1981) 279 - 363.
[102] S. Rosenbaum, W.E. Skiens, Concentration and pressure dependence of rate of membrane
permeation, Journal of Applied Polymer Science, 12 (1968) 2169-2181.
[103] M.B. Rao, S. Sircar, Performance of pore characterization of nanoporous carbon
membranes for gas separation, J. Membr. Sci., 85 (1993) 253-264.
[104] B.D. Freeman, I. Pinnau, Separation of gases using solubility-selective polymers, Trends in
Polymer Science, 5 (1997) 167-173.
[105] L.M. Robeson, Polymer membranes for gas separation, Current Opinion in Solid State and
Materials Science, 4 (1999) 549-552.
[106] M. Moaddeb, W.J. Koros, Gas transport properties of thin polymeric membranes in the
presence of silicon dioxide particles, J. Membr. Sci., 125 (1997) 143-163.
[107] T.C. Merkel, B.D. Freeman, R.J. Spontak, Z. He, I. Pinnau, P. Meakin, A.J. Hill,
Ultrapermeable, reverse-selective nanocomposite membranes, Science, 296 (2002) 519-522.
[108] M. Smaihi, T. Jermoumi, J. Marignan, R.D. Noble, Organic-inorganic gas separation
membranes: Preparation and characterizzation, J. Membr. Sci., 116 (1996) 211-220.
Page 143
129
[109] I.F.J. Vankelecom, E. Merckx, M. Luts, J.B. Uytterhoeven, Incorporation of zeolites in
polyimide membranes, J. Phys. Chem., 99 (1995) 13187-13192.
[110] A. Javaid, M.P. Hughey, V. Varutbangkul, D.M. Ford, Solubility-based gas separation
with oligomer-modified inorganic membranes, Journal of Membrane Science, 187 (2001) 141-
150.
[111] J. Randon, R. Paterson, Preliminary studies on the potential for gas separation by
mesoporous ceramic oxide membranes surface modified by alkyl phosphonic acids, Journal of
Membrane Science, 134 (1997) 219-223.
[112] A. Javaid, S.O. Gonzalez, E.E. Simanek, D.M. Ford, Nanocomposite membranes of
chemisorbed and physisorbed molecules on porous alumina for environmentally important
separations, Journal of Membrane Science, 275 (2006) 255-260.
[113] K.C. McCarley, J.D. Way, Development of a model surface flow membrane by
modification of porous -alumina with octadecyltrichlorosilane, Separation and Purification
Technology, 25 (2001) 195-210.
[114] O.A. Matthews, A.N. Shipway, J.F. Stoddart, Dendrimers-branching out from curiosities
into new technologies, Progress in Polymer Science, 23 (1998) 1-56.
[115] W. Zhang, E.E. Simanek, Dendrimers based on melamine. Divergent and convergent
synthesis of a G3 dendrimer, Organic letters 2(2000) 843-845.
[116] S. Yoo, S. Yeu, R.L. Sherman, E.E. Simanek, D.F. Shantz, D.M. Ford, Reverse-selective
membranes formed by dendrimers on mesoporous ceramic supports, Journal of Membrane
Science, 334 (2009) 16-22.
[117] W.R. Baker, N. Yoshioka, M.J. Mohr, J.A. Khan, Separation of organic vapors from air,
Journal of Membrane Science, 31 (1987) 259-271.
Page 144
130
[118] I. Blume, P.J.F. Schwering, M.H.V. Mulder, C.A. Smolders, Vapour sorption and
permeation properties of poly (dimethylsiloxane) films, Journal of Membrane Science, 61 (1991)
85-97.
[119] M. Leemann, G. Eigenberger, H. Strathmann, Vapour permeation for the recovery of
organic solvents from waste air streams: separation capacities and process optimization, Journal
of Membrane Science, 113 (1996) 313-322.
[120] J. Schultz, K.V. Pienemann, Membranes for separation of higher hydrocarbons from
methane, Journal of Membrane Science, 110 (1996) 37-45.
[121] G.R. Gallaher, P.K.T. Liu, Characterization of ceramic membranes I. Thermal and
hydrothermal stabilities of commercial 40 Å membranes, Journal of Membrane Science, 92
(1994) 29-44.
[122] C.L. Lin, D.L. Flowers, P.K.T. Liu, Characterization of ceramic membranes II. Modified
commercial membranes with pore size under 40 Å, Journal of Membrane Science, 92 (1994) 45-
58.
[123] R.C. Furneaux, W.R. Rigby, A.P. Davidson, The formation of contorlled-porosity
membranes from anodically oxidized membrane, Nature, 337 (1989) 147-149.
[124] A. Hernandez, J.I. Calvo, P. Pradanos, L. Palacio, M.L. Rodriguez, J.A. de Saja, Surface
structure of microporous membranes by cmputerized SEM image analysis applied to anopore
filters, Journal of Membrane Science, 137 (1997) 89-97.
[125] M. Platt, R.A.W. Dryfe, E.P.L. Roberts, Voltammetry with liquid/liquid microarrays:
Characterization of membrane materials, Langmuir, 19 (2003) 8019-8025.
[126] J. Karger, D.M. Ruthven, Diffusion in zeolites and other microporous solids, New York,
1992.
Page 145
131
[127] K. Keizer, R.J.R. Uhlhorn, R.J. Van Vuren, A.J. Burggraaf, Gas separation mechanism in
microporous modified -Al2O3 membranes, Journal of Membrane Science, 39 (1988) 285-300.
[128] R.J.R. Uhlhorn, K. Keizer, A.J. Burggraaf, Gas transport and separation with ceramic
membranes. Part I. Multilayer diffusion and capillary condensation, Journal of Membrane
Science, 66 (1992) 259-269.