Separation of liquid-liquid emulsions using hydrophilic/hydrophobic coalescing media Prashant S. Kulkarni, Shagufta U. Patel and George G. Chase Department of Chemical and Biomolecular Engineering The University of Akron, Akron OH 44325 330.972.7943, Fax: +1 330.972.5856, [email protected]ABSTRACT Fibrous coalescing filters are commonly used to separate water-in-oil emulsions. Wettability of the fibers significantly influences the filter performance. The wettability of the filter media depends on surface properties of fiber materials and porosity of the filter medium. The wettability of the filter media is characterized using Modified Washburn’s equation and expressed in terms of the Lipophilic to Hydrophilic (L/H) ratio. In this work, layered media were prepared with varying compositions of hydrophilic microglass fibers and hydrophobic polypropylene or polyester fibers to achieve a range of L/H values. By varying the fiber composition and thickness of hydrophilic and hydrophobic layers in the media, filter media with different wetting properties can be prepared. Water and Viscor-1487 oil (a diesel fuel calibration fluid) were used as test liquids for the wettability characterization. The filter media were tested in liquid-liquid coalescence experiments in which fine emulsions of water droplets were dispersed in the Viscor-1487 liquid. The experimental results show that the layered hydrophilic/hydrophobic structures significantly reduce the pressure drop and improve the filter performance as compared to media constructed with only microglass fibers. INTRODUCTION In recent years, separation of water-in-oil emulsions has received much attention in the automotive, aviation and petrochemical industries (1-4). The water commonly enters the fuels via precipitation, humidity, and condensation of atmospheric moisture (1). Water is present in fuels as free water, emulsified water and dissolved water. The free water is generally separated by gravity settling or other mechanical operations (1, 4). The emulsified water often has drop sizes less than 100μm and is commonly separated using a coalescing filter. The dissolved water requires a process such as distillation for the separation. In fuels, water causes corrosion of sensitive engine parts, promotes microbial growth and can plug injection systems (1-4). The dissolved water does not have significant impact on fuel quality and engine performance; however it can separate out and freeze at low temperatures and can create problems at any point in the fuel system from the source tank to the engine (1, 3). Fluctuations in temperature can change the solubility of water in fuel and cause dissolved water to phase separate in the fuel. In addition, surfactants present in liquid fuels, in particular biodiesel blends, lower the interfacial tension and increase the solubility which complicates the oil-water separation (2-3). In this paper we use fibrous coalescing filters to separate emulsions of water drops in oil. As a water-in-oil emulsion enters a fibrous filter, the water droplets are captured or otherwise slowed down by the fibers. Ensuing droplets carried by the oil collide with the prior droplets and coalesce to form larger drops. The coalesced water drops migrate through the filter due to drag by the oil phase (5) and exit the filter. The enlarged drops are subsequently separated from the oil using a downstream separator such as a settling tank or centrifuge. The performances of the coalescing filter and settling tank are coupled. The combined performance is evaluated using 1
Transcript
Separation of liquid-liquid emulsions using hydrophilic/hydrophobic coalescing media Prashant S. Kulkarni, Shagufta U. Patel and George G. Chase
Department of Chemical and Biomolecular Engineering The University of Akron, Akron OH 44325
Fibrous coalescing filters are commonly used to separate water-in-oil emulsions. Wettability of the fibers significantly influences the filter performance. The wettability of the filter media depends on surface properties of fiber materials and porosity of the filter medium. The wettability of the filter media is characterized using Modified Washburn’s equation and expressed in terms of the Lipophilic to Hydrophilic (L/H) ratio. In this work, layered media were prepared with varying compositions of hydrophilic microglass fibers and hydrophobic polypropylene or polyester fibers to achieve a range of L/H values. By varying the fiber composition and thickness of hydrophilic and hydrophobic layers in the media, filter media with different wetting properties can be prepared. Water and Viscor-1487 oil (a diesel fuel calibration fluid) were used as test liquids for the wettability characterization. The filter media were tested in liquid-liquid coalescence experiments in which fine emulsions of water droplets were dispersed in the Viscor-1487 liquid. The experimental results show that the layered hydrophilic/hydrophobic structures significantly reduce the pressure drop and improve the filter performance as compared to media constructed with only microglass fibers. INTRODUCTION
In recent years, separation of water-in-oil emulsions has received much attention in the automotive, aviation and petrochemical industries (1-4). The water commonly enters the fuels via precipitation, humidity, and condensation of atmospheric moisture (1). Water is present in fuels as free water, emulsified water and dissolved water. The free water is generally separated by gravity settling or other mechanical operations (1, 4). The emulsified water often has drop sizes less than 100μm and is commonly separated using a coalescing filter. The dissolved water requires a process such as distillation for the separation. In fuels, water causes corrosion of sensitive engine parts, promotes microbial growth and can plug injection systems (1-4). The dissolved water does not have significant impact on fuel quality and engine performance; however it can separate out and freeze at low temperatures and can create problems at any point in the fuel system from the source tank to the engine (1, 3). Fluctuations in temperature can change the solubility of water in fuel and cause dissolved water to phase separate in the fuel. In addition, surfactants present in liquid fuels, in particular biodiesel blends, lower the interfacial tension and increase the solubility which complicates the oil-water separation (2-3).
In this paper we use fibrous coalescing filters to separate emulsions of water drops in oil. As a water-in-oil emulsion enters a fibrous filter, the water droplets are captured or otherwise slowed down by the fibers. Ensuing droplets carried by the oil collide with the prior droplets and coalesce to form larger drops. The coalesced water drops migrate through the filter due to drag by the oil phase (5) and exit the filter. The enlarged drops are subsequently separated from the oil using a downstream separator such as a settling tank or centrifuge. The performances of the coalescing filter and settling tank are coupled. The combined performance is evaluated using
1
separation efficiency (E) and pressure drop (∆Р) across the filter medium (6). The separation efficiency is calculated as
CCCIN
OUTINE−
= (1)
where, CIN and COUT are the inlet and outlet mass concentrations of water drops respectively. The inlet and outlet mass concentrations are calculated from the upstream and downstream particle size distribution by the formula
∑= ρπwateriii dNC 3
6 (2)
where, Ni is number of drops, di is diameter of droplet and ρwater is the density of water. We use a figure of merit, also known as quality factor, as the measure of overall performance of filter media, as defined by Brown (7), which accounts for both the separation efficiency and pressure drop. The quality factor (QF) is calculated as
ΔΡ−−
=)1ln( EQF (3)
The separation efficiency is dependent on the fluid and emulsion properties including composition, density, viscosity and drop size. It also depends on the filter properties including the fiber surface wetting properties, fiber size, fiber orientation, porosity, binder content, and filter bed length (8-13). The oil flow rate is important as it controls the mechanism of droplet capture on the fibers, inertia force available for drop-drop collision and coalescence, and the drag force on the coalesced drops to cause the drops to migrate through the filter. The fiber surface wettability has a significant effect on performance, but is given minimal attention in literature. Shin (14) showed that wettability of the solid surface has effect on drop attachment and coalescence. In his study, small cylindrical glass rods were coated with different silanes to vary their surface properties. It was observed that coalesced water drops have longer retention time on hydrophilic surfaces and limited or no coalescence was observed on hydrophobic surfaces. Moorthy (15) performed liquid-liquid coalescence experiments with glass fiber filter media in which the fibers were surface coated with different silanes and showed that intermediate wettability gives better filter performance. Magiera (16) reports that the hydrophilic glass and stainless steel fiber media have good separation efficiency but hydrophobic media made of Teflon® fibers had poor performance. Hazlett (9) proposed a mechanism of water droplet displacement of the oil film from the fiber surface to obtain the best separation performance for water-in-oil emulsions. A water droplet easily displaces oil on a hydrophilic surface. The displacement of the oil phase on a hydrophobic surface is less than that for a hydrophilic surface. Higher wetting fibers give better coalescence but also cause an increase in pressure drop (13). The addition of an optimal amount of hydrophobic submicron sized polystyrene fibers showed improvement in capture efficiency without increasing the pressure drop (6). Aside from selecting fiber materials or coatings with particular wetting properties, literature does not report how one may construct filter media with a specific wetting performance. The objectives of this work are to (i) prepare layered media using hydrophilic and hydrophobic fibers with varying compositions to achieve filter media with different wetting properties (ii) apply Washburn’s method to characterize the wettability of the fibrous filter media (iii) study the effect of wettability of layered filter media on filter performance. Chopped polypropylene fibers and polyester fibers were selected as the hydrophobic fibers and chopped micro glass fibers were selected as the hydrophilic fibers. The filter media
2
were prepared with different compositions (100%, 80%, 60%, 40% and 20%) of micro glass fibers and polypropylene or polyester fibers. These filter media were characterized by using a modified Washburn’s equation and the concept of lipophilic to hydrophilic ratio. The filter media were also characterized for their air permeability and porosity. The performance of filter media were experimentally evaluated using liquid-liquid coalescence tests. The experimental results of layered filter media are compared with the 100% glass fiber media for their effect of wettability on filter performance. MODIFIED WASHBURN EQUATION
The wettability of a solid surface is generally characterized by the static contact angle (17). However, it is difficult to observe and reproduce contact angles of a liquid drop on the porous surface of a fibrous filter medium. A more appropriate characterization method is the rate of a liquid drawn into the porous medium due to capillary forces. Known as Washburn’s method, this approach idealizes the filter media to consist of parallel uniform cylindrical capillaries and the liquid penetration is related to the contact angle of the liquid in the pores (18). The filter sample is suspended above the test liquid so that the bottom edge of the filter is in contact with the free surface of the liquid. Capillary forces pull liquid upward into the filter sample. Washburn’s equation relates the height of penetrated liquid, , at time , in the filter medium to the advancing contact angle, , of the liquid rising in the pores (18-20)
ηγθ
2cos2 tr
h eff= (4)
where, η is the viscosity of the penetrating liquid, and γ is the surface tension of the penetrating liquid. Real fibrous filters are made up of non-uniform pore structures and therefore, the pores have a distribution of radii that affect the capillary rise in a complicated way due to the interconnectivity, shapes, and sizes of the pores. In Washburn’s equation, is an effective capillary radius defined as the pore radius of a medium made of uniform capillaries that has the same performance as observed of the real medium. The effective radius is difficult to determine and leads to significant error in the penetrating rates of liquid (19), however it can be lumped with other constant values in the equation during the analysis.
effr
The height of liquid penetration into the filter medium is related to the mass of penetrating liquid given by
hAw ρε= (5) where, ε is the porosity of the filter medium, is the cross-sectional area of the filter medium, and ρ the density of the liquid.
Combining equations 4 and 5 we get,
ηθγρ tcw cos2
2 = (6)
where the lump ed constant, (7) can be determined when one of the liquids totally wets the surface (i.e., zero contact angle). From the slope of versus and knowing the liquid properties, the value of c can be computed.
2w t
3
Once the lumped constant is found for a total wetting liquid, it can be used for other
liquids from their measured slopes, dt
dwS2
= , of the curve (15). The slopes are related to the
contact angle by
ηθγρ cos2cS = (8)
In a variation of this analysis, the constant, , does not need to be calculated. The lipophilic to hydrophilic Ratio (L/H) is defined by
c
w
o
HL
θθ
coscos
= (9)
and represents how the medium performs when in contact with a non-polar liquid (oil) compared to when it is in contact with a polar liquid (water). The angles, oθ and wθ , are the contact angles of oil and water in the filter medium as determined by Washburn’s equation. Combining equations (8) and (9) we get,
oooww
wwwoo
cScS
HL
γρηγρη
2
2.
.= (10)
where, subscripts o and w represents the oil and water phase respectively. The lumped constants and are equal for the same filter medium and cancel out of Eq. (10). Thus the L/H value
reflects the wettability of the filter medium. Equation (10) is called the modified Washburn’s equation. Small values of L/H indicate the filter medium is hydrophilic and large values indicate the filter medium is lipophilic.
wc oc
EXPERIMENTAL DESCRIPTION Filter media preparation and materials
The filter samples were made with layers of B-glass microfibers (Hollingsworth and Vose) and layers of polymer fibers: polypropylene fibers or polyester (Polyethylene terphthalet - PET) fibers (Minifibers Incorporated). The fiber properties are shown in Table 1. Two separate slurries of glass fibers and polypropylene fibers with desired composition were prepared in 2.5 L of water. The glass fiber slurry was prepared with starch (ratio of 0.03 g starch per 1 g of glass fiber) and Megasol S50 binder (Wesbond Corporation) (ratio of 1 ml of Megasol per 1 gram of glass fiber). The polymer fiber slurry was prepared with polyethylene synthetic pulp fibers (Minifibers Incorporated) (ratio of 0.20 g polyethylene fibers per 1 g of polymer fiber) as a thermal binder. Approximately 250 ml of each slurry were alternately vacuum filtered through a fine mesh screen in a mold with a hole of inside diameter 2.25 cm, to build up the filter in thickness of alternating layers of hydrophobic and hydrophilic fibers.
In each filter sample, the exit or outlet layer was a layer of glass fibers and the inlet layer was a layer of polymer fibers. The filter samples were constructed of 10 equal thickness layers of glass fibers and 10 equal thickness layers of polymer fibers. By varying the thicknesses of the respective glass and polymer fiber layers the media were designed with a range of glass fiber compositions (80%, 60%, 40%, and 20%). Each filter sample contained about 0.5 g total of fibers and the filter thicknesses varied between 1.0 cm to 1.2 cm with variations in the fiber layer thickness between 0.4 mm to 0.6 mm, depending on the mass of fibers.
The wet filter samples were removed from the mold and a thin layer of binder was applied on the outside cylindrical surface of filter to hold all the fiber layers in place. This was
4
done very carefully without disturbing the disk shape of the filter media. The wet filter samples were heated at 125 0C for 3 to 4 min. to initially set the polyethylene thermal binder. The filter samples were then heated in an oven for 2 hrs at 120 0C for drying and to complete setting of the binders.
The filter samples are described in Table 2 for their nomenclature, fiber composition, binder content, height and mass. In the notation G represents glass, PP represents polypropylene, and PET represents the polyester fibers respectively. All of the filter samples were characterized for their porosity, air permeability and strength. The porosities of the filter media were measured using a special made pychnometer, permeability was measured using a Frazier Air Permeability Tester (Frazier Precision Instrument Company, Inc.), and strength was measured using a durometer (Type A, ASTM D2240, Rex Gauge Co.). Table 1. Properties of fibers
L=Layered, G=Glass, PP=Polypropylene, PET= Polyester. *Calculated by subtracting fiber mass from total mass of filter media L/H measurement technique and approach
In this experiment, a filter media is suspended using a thin wire attached to a cantilever beam fixed to a scissor stand, the height of which can be adjusted. The schematic of experimental set-up is shown in Figure 1. A transparent glass beaker with test liquid is placed on an electronic balance. The liquid temperature is maintained around 230-250C. The balance is placed on vibration free, leveled surface. The scissor stand is placed on rigid support to limit vibrations and achieve controlled motion of the stand in only vertical direction. A stop watch is
5
placed in front of the electronic balance, both of which are in view of a video camera to record time and mass.
The filter medium is lowered very slowly until it breaks the air-liquid interface. When the surface of the filter medium touches to surface of the liquid its position is fixed for the rest of the experiment. The liquid mass in the filter sample due to capillary action is determined from the reduction in liquid mass in the beaker measured by the scale over time. The weight on microbalance with its corresponding time is recorded by the video camera. The experiment is stopped when liquid reaches the top of filter medium or the balance shows a steady value.
The test liquids used in this study are Viscor oil 1487 (Rock Valley Oil & Chemical Company) and deionized water. The Viscor oil is a calibration fluid and has similar properties to that of diesel fuel. Physical properties of deionized water and the Viscor oil are presented in Table 3. Table 3. Physical properties of reference liquids at 20 0C (5, 15) Liquid Density (g/cm3) Viscosity (Ns/m2) Surface tension (dynes/cm)
The coalescence experiments were performed using a fine water-in-oil emulsion, in which deionized water was dispersed in Viscor 1487. The schematic of the experimental set-up is shown in Figure 2. The Viscor oil is pumped using a peristaltic pump (Master flex, model L/S EW-07543-60) at flow rate of 210 ml/min.
At the mixing pipe water droplets are introduced into the oil stream using a syringe pump (WPI, Model sp101i) at a flow rate of 80 μl/min. The mixing pipe is a Plexiglas tube with a 1mm inside diameter, with a hypodermic needle inserted at the middle of the 1 mm cylindrical channel through which the oil flows. The water droplets form at the tip of the needle and are stripped off by the oil flow to generate the fine emulsion. The concentration of water and size of water drops can be controlled by the flow rate of water from the syringe pump. The flow rates of oil and water were the same for all of the layered media experiments.
In Figure 2, the filter is placed in a Plexiglas filter holder designed with a cylindrical opening of 2.24 cm diameter. The emulsion flows through a filter sample and into a gravity settling tank and reservoir. The upstream sampling point is positioned between the mixing pipe and the filter. The downstream sampling point is positioned after the gravity settling tank. The size distribution of water droplets at the upstream and downstream were measured using an Accusizer (780 PALS- Particle Sizing Systems, sensor range 0.5 µm to 500 µm) at intervals of 10 to 25 minutes. The pressure drop is measured across the filter on a 10 min interval. The tests were performed for 110 min to 130 min and steady state was typically achieved between 70 min to 90 min depending upon the filter media.
6
RESULTS AND DISCUSSION Wettability characterization
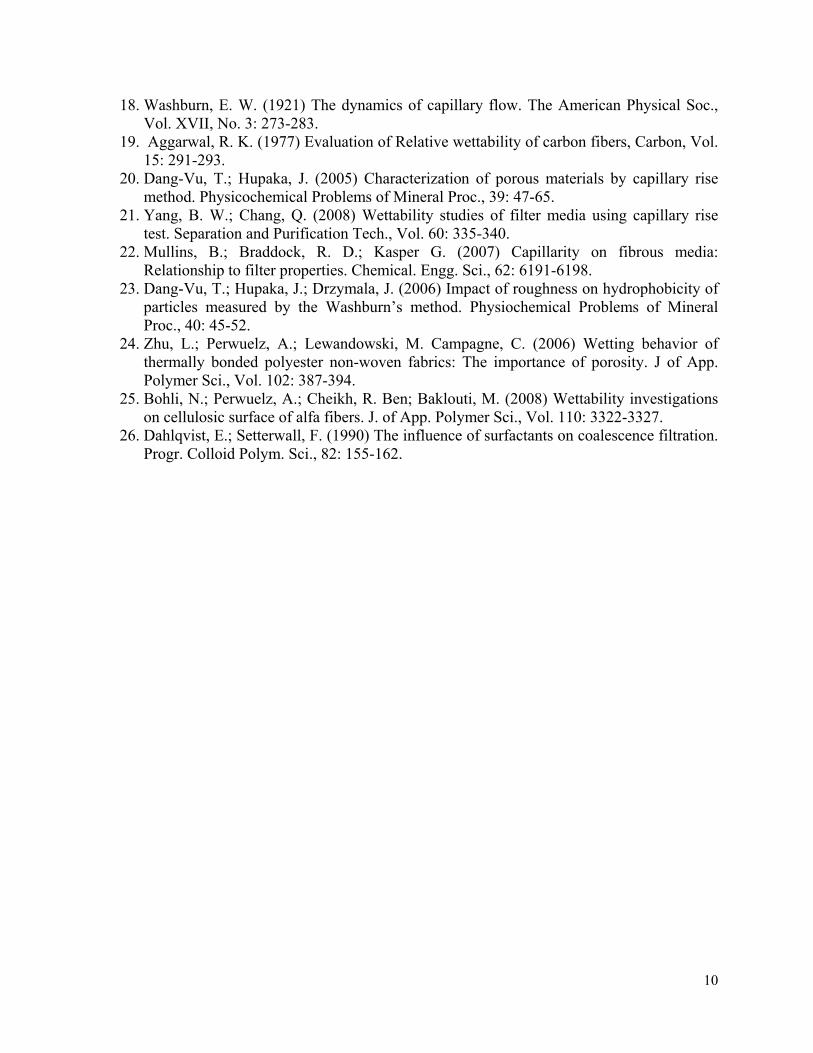
The liquid penetration experiments were performed and the mass (w) of liquid taken by the filter media with time was measured for each medium for each test liquid. The w2 is plotted against the time to obtain the overall wetting kinetics of the each media. All of the filters were characterized in triplicate and plotted as average of three filters with error bars indicating one standard deviation. The wetting kinetics for layered glass and polypropylene media were obtained with water and Viscor oil as test liquids and are shown in Figure 3 (a) and Figure 3 (b) respectively and the wetting kinetics for layered glass and polyester media obtained with water and Viscor oil as test liquids are shown in Figure 4 (a) and Figure 4 (b) respectively. The water uptake rate for microglass fiber media is highest and it decreases with increasing amounts of polymeric fibers in filter media. Oil uptake rate is lowest for glass only fiber media. and increases with the amount of polymeric fibers. The initial wetting kinetics for layered glass and polypropylene media with water and Viscor oil as reference fluids are shown in Figure 5 (a) and Figure 5 (b) respectively and the initial wetting kinetics of layered glass and polyester media with water and Viscor oil as test liquids are shown in Figure 6 (a) and Figure 6 (b). The slopes of the wetting curves (Sw and So) were obtained from initial wetting kinetics data with correlation coefficients R2 > 0.96 and the L/H values for the filter media calculated from Equation (10) are listed in Table 4.
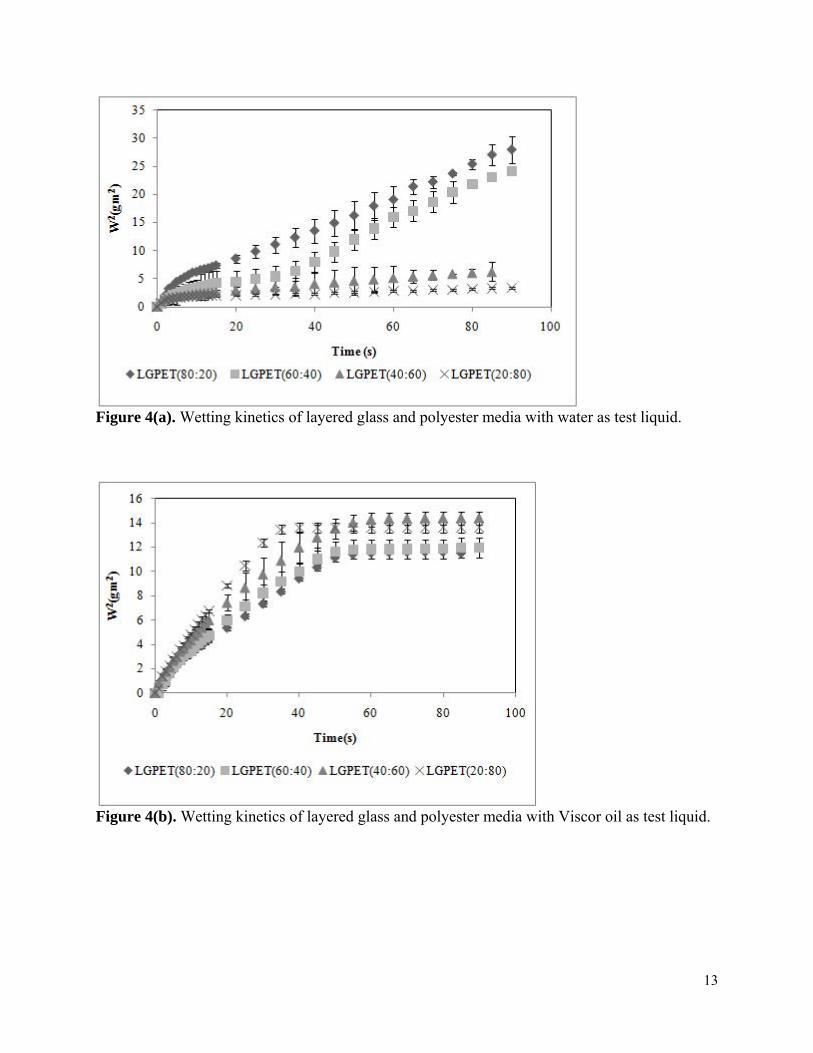
Yang and Chang (21) and Mullins (22) show that the modified Washburn’s equation is best fitted to the initial slope of the data at the beginning of the experiment.. The wettability of filter media characterized by Washburn’s method is depend on many factors including porosity of the medium, surface roughness, fiber size, fiber material and liquid properties (21-26). By definition, the L/H value is the ratio of cosines of static contact angles of the oil and water phases respectively as shown in Equation (9). A value of L/H=1, represents a medium having the same wettability for the water and oil phases. If L/H value is greater than unity, then the medium is hydrophobic and if L/H is less than unity, then the medium is hydrophilic. Therefore, from Figure 7, only the glass fiber media are hydrophilic and all other media with polymeric fibers are hydrophobic, but to different degrees. When comparing different media, those with higher L/H value are more preferentially wetted by oil than are media with lower L/H values. Media with a range of different wetting properties can b epared by varying the composition of fibers and thickness of layers of hydrophilic and hydr f the f ter media as shown in Table 4.
e prophobic ibers in il
In Figure 7 the L/H difference, LH
LH G
, is plotted as a function of composition of glass fibers in the layered filter media. The least square regression for both type of layered media showed very good fit in Figure 7. Equation (11) represents the fit for layered glass an lypropylene medi i 2 .9 8 . (12) represents the fit for layered glass and polyester me R2 = 8
d po a w th R = 0 7 2 and Eqdia with 0.9 57.
(11) 21.212x 2.2906x
29.067x 3.4338x (12) where is the mass fraction of polymer fibers in the medium. . These fitted equations can be used to calculate the composition of fibers needed to make a filter with a particular L/H value.
7
Table 4. Wettability characterization of layered filter media
The liquid-liquid coalescence experiments were conducted to evaluate the performance of layered filter media. All filters were run in triplicate and plotted as the average of three filters with one standard deviation indicated by error bars.
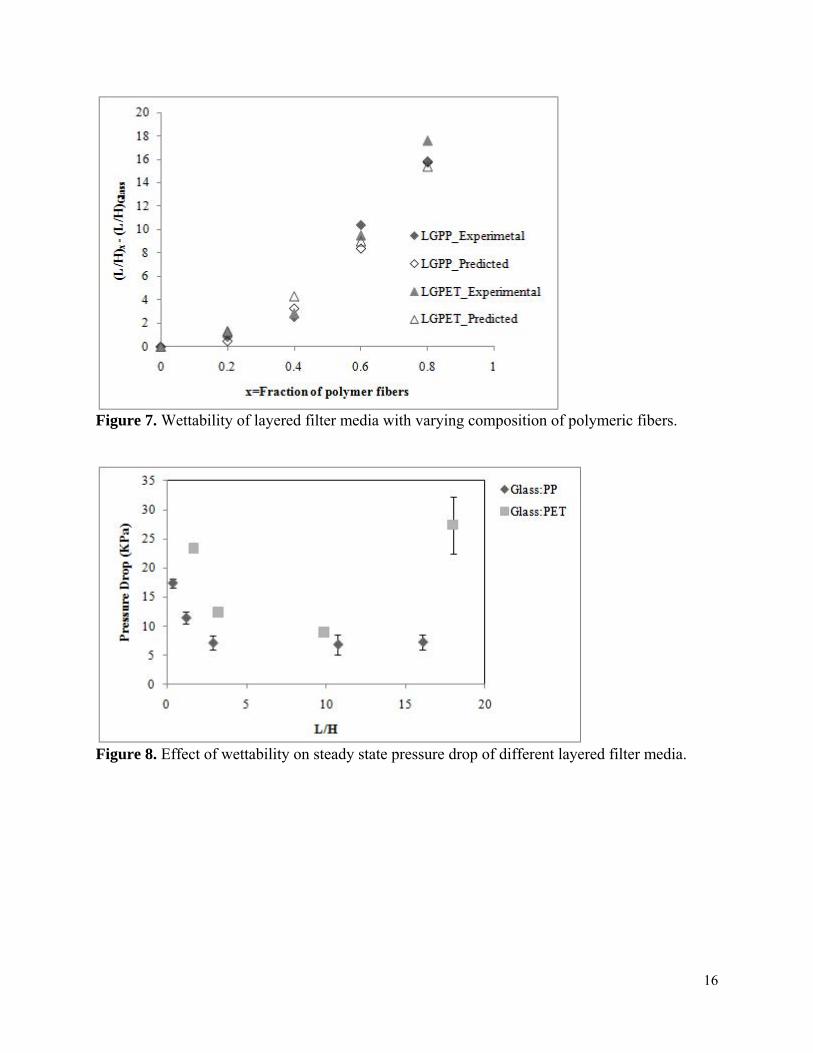
The pressure plots in Figure 8 shows a significantly reduction in pressure for media with layers of glass and polymer fibers compared with glass fiber only media. In general, the reduction in pressure drop increases with the amount of polymer fiber. The exception to this trend occurs at L/H=18 that gives a significantly higher pressure drop. The reason for this higher pressure drop requires further investigation.
The plots in Figure 9 show an initial increase in efficiency as L/H increases above that for the glass fiber only media, followed by a gradual decrease in efficiency. This suggests the best media have L/H values between 1 and 5.
The combined performance measures of pressure drop and efficiency are given by the quality factor in Eq. (3). Figure 10 shows the quality factors for the Glass-PP media are significantly higher than the Glass-PET media, mainly due to the lower pressure drops for the Glass-PP media. Consistent with the efficiency data, the quality factor data show the best performance for Glass-PP occurs with media with L/H values of about 1 to 5. For the Glass-PET media the best performance occurred with an L/H of about 10. SUMMARY AND CONCLUSION
In this work, filter media were constructed of alternating layers of glass and polymer (polypropylene or polyester) fibers with different relative amounts of each fiber type to achieve variation in the filter wettabilty. The wettability of the filter media were characterized using the modified Washburn’s method and expressed as the lipophilic to hydrophilic (L/H) ratio. In general, the pressure drop decreased as the L/H ratio increased. The efficiency and quality factor in general increased and then decreased as L/H increased. The efficiency and quality factor indicated the best media have an L/H in the range of about 1 to 5.
8
ACKNOWLEDGEMENT This work was supported by the Coalescence Filtration and Nanofibers Consortium:
Ahlstrom, Cummins Filtration, Donaldson Company, ELMARCO, Hollingsworth & Vose, Parker Hannifin, and SNS Nanofiber Technology. This work was also supported by Produced Water Seminar. We thank Hollingsworth & Vose and Minifibers Incorporated for supplying the fibers used in this work.
REFERENCES
1. May, C. H. (1963) The separation of water from oil by principle of coalescence. J. of the American Society of Lubrication Engineers, 18th ASLE Annual Meeting, August: 327-332.
2. Stanfel, C. (2009) Fuel filtration: Protecting the diesel engine. Filtration+Separation, May/June: 22-24.
3. Brown, R. L., Jr.; Wines, T. H. (1993) Improve suspended water removal from fuels: A better understanding of molecular forces enhances free water separator selection. Hydrocarbon Proc., December: 95-99.
4. Li, Y.; Schnable, J. (2000) Solving water contamination in lubrication oil. Filtration+Separation, June: 18-21.
5. Shin, C.; Chase, G. (2004) Water-in-oil coalescence in micro-nanofiber composite filters. AICHE J., Vol. 50, No 2: 343-350.
6. Shin, C. (2006) Filtration application from recycled expanded polystyrene. J. of Colloid and Interface Sci., 302: 267-271.
7. Brown, R. C. (1993) Air filtration: An Integrated Approach to the Theory and Applications of fibrous filters. 1stEd.; Pergamon Press: New York.
8. Sareen, S. S.; Rose, P. M.; Gudusen, R. C.; Kintner, R. C. (1966) Coalescence in fibrous bed. AICHE J., 12: 1045.
9. Hazlet, R. N. (1969) Fibrous bed coalescence of water - steps in coalescence process. I & EC Fundamentals, Vol. 8, No 4: 625-632.
10. Speth, H.; Pfennig, A.; Chatterjee, M.; Franken, H. (2002) Coalescence of secondary dispersions in fiber beds. Separation and Purification Tech., Vol. 29: 113-119.
11. Radmila, M.; Sokolovi´c, S.; Vuli´c, T. J.; Sokolovi´c, S. M. (2007) Effect of bed length on steady-state coalescence of oil-in-water emulsion. Separation and Purification Tech., 56: 79–84.
12. Basu, S. (1993) Study on effect of wetting on mechanism of coalescence in model coalescer. J Colloid Interface Sci., 68: 159.
13. Shin, C.; Chase, G. G.; Renekar, D. H. (2005) The effect of nanofibers on liquid-liquid coalescence filtration performance. AICHE J., Vol. 51, No. 12:3109-3113.
14. Shin, C.; Chase, G. G. (2004) The effect of wettability on drop attachment to glass rods. J. of Fluid/Particle Separation, Vol. 16, No 1: 1-7.
15. Moorthy, K. (2006) Thesis, Effect of surface energy on liquid-liquid coalescence. The University of Akron.
16. Magiera, R.; Blass, E. (1997) Separation of liquid-liquid dispersions by flow through fiber beds. Filtration & Separation, May: 369.
17. Lazghab, M.; Saleh, K.; Pezron, I.; Guigon, P.; Komunjer, L. (2005) Wettability of finely divided solids. Powder Tech., 157: 79-91.
9
18. Washburn, E. W. (1921) The dynamics of capillary flow. The American Physical Soc., Vol. XVII, No. 3: 273-283.
19. Aggarwal, R. K. (1977) Evaluation of Relative wettability of carbon fibers, Carbon, Vol. 15: 291-293.
20. Dang-Vu, T.; Hupaka, J. (2005) Characterization of porous materials by capillary rise method. Physicochemical Problems of Mineral Proc., 39: 47-65.
21. Yang, B. W.; Chang, Q. (2008) Wettability studies of filter media using capillary rise test. Separation and Purification Tech., Vol. 60: 335-340.
22. Mullins, B.; Braddock, R. D.; Kasper G. (2007) Capillarity on fibrous media: Relationship to filter properties. Chemical. Engg. Sci., 62: 6191-6198.
23. Dang-Vu, T.; Hupaka, J.; Drzymala, J. (2006) Impact of roughness on hydrophobicity of particles measured by the Washburn’s method. Physiochemical Problems of Mineral Proc., 40: 45-52.
24. Zhu, L.; Perwuelz, A.; Lewandowski, M. Campagne, C. (2006) Wetting behavior of thermally bonded polyester non-woven fabrics: The importance of porosity. J of App. Polymer Sci., Vol. 102: 387-394.
25. Bohli, N.; Perwuelz, A.; Cheikh, R. Ben; Baklouti, M. (2008) Wettability investigations on cellulosic surface of alfa fibers. J. of App. Polymer Sci., Vol. 110: 3322-3327.
26. Dahlqvist, E.; Setterwall, F. (1990) The influence of surfactants on coalescence filtration. Progr. Colloid Polym. Sci., 82: 155-162.
10
Figure 1. Schematic of wettability characterization experimental set-up.
Figure 2. Schematic of liquid-liquid coalescence experimental set-up.
11
Figure 3(a). Wetting kinetics of layered glass and polypropylene media with water as test liquid.
Figure 3(b). Wetting kinetics of layered glass and polypropylene media with Viscor oil as test liquid.
12
Figure 4(a). Wetting kinetics of layered glass and polyester media with water as test liquid.
Figure 4(b). Wetting kinetics of layered glass and polyester media with Viscor oil as test liquid.
13
Figure 5(a). Initial wetting kinetics of layered glass and polypropylene media (a) with water as test liquid.
Figure 5(b). Initial wetting kinetics of layered glass and polypropylene media (b) with Viscor oil as test liquid.
14
Figure 6(a). Initial wetting kinetics of layered glass and polyester media (a) with water as test liquid.
Figure 6(b). Initial wetting kinetics of layered glass and polyester media (b) with Viscor oil as test liquid.
15
Figure 7. Wettability of layered filter media with varying composition of polymeric fibers.
Figure 8. Effect of wettability on steady state pressure drop of different layered filter media.
16
Figure 9. Effect of wettability on steady state separation efficiency of different layered filter media.
17
Figure 10. Effect of wettability on quality factor of layered filter media.