16
Separator Business Case SOTERIA BATTERY INNOVATION GROUP
Separator Business CaseSOTERIA BATTERY INNOVATION GROUP
OutlineProcess & companies contributing
Raw material supply & costs
Production process & cost contributors
Cost model
Market prices
Cost cases with payback time◦ Gold◦ Cellulose-based◦ Discussion of other cost drivers
Cost contributions to lithium ion battery production costs
Market size & 10 year goal opportunities
Summary
Process & Companies ContributingPROCESS
Interviews & Inputs◦ Fiber suppliers
◦ Machine manufacturers
◦ Competitive material producers
◦ Avicenne Market Study
◦ Needed:
Cost Model◦ Spreadsheet modeled on equipment mfg
◦ Inputs from all interviews, highlighted in sheet
COMPANIES CONTRIBUTING
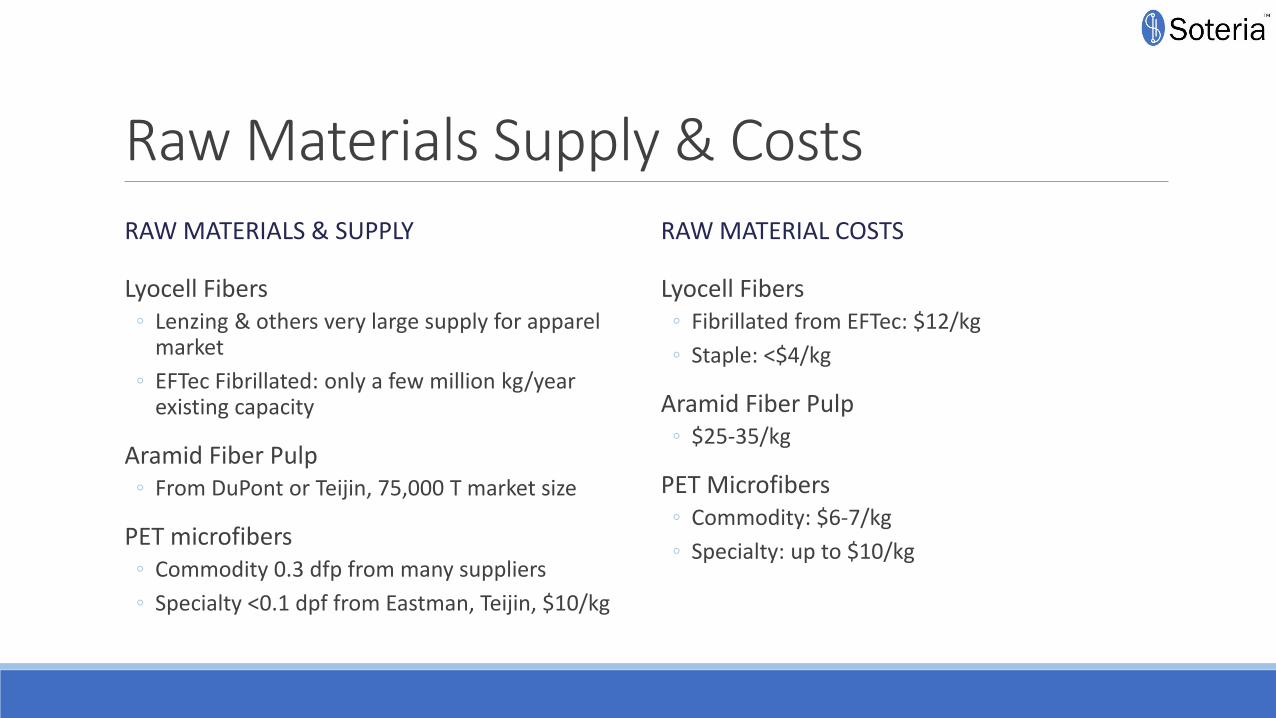
Raw Materials Supply & CostsRAW MATERIALS & SUPPLY
Lyocell Fibers◦ Lenzing & others very large supply for apparel
market
◦ EFTec Fibrillated: only a few million kg/year existing capacity
Aramid Fiber Pulp◦ From DuPont or Teijin, 75,000 T market size
PET microfibers◦ Commodity 0.3 dfp from many suppliers
◦ Specialty <0.1 dpf from Eastman, Teijin, $10/kg
RAW MATERIAL COSTS
Lyocell Fibers◦ Fibrillated from EFTec: $12/kg
◦ Staple: <$4/kg
Aramid Fiber Pulp◦ $25-35/kg
PET Microfibers◦ Commodity: $6-7/kg
◦ Specialty: up to $10/kg
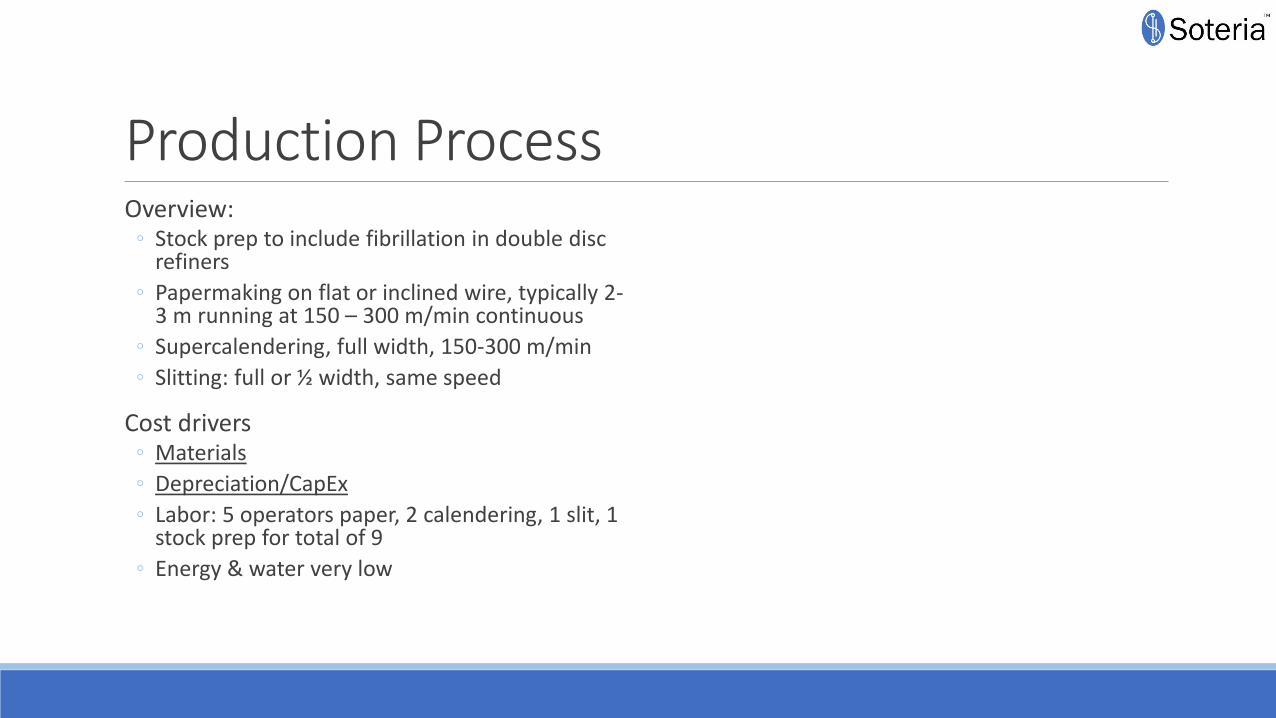
Production ProcessOverview:
◦ Stock prep to include fibrillation in double disc refiners
◦ Papermaking on flat or inclined wire, typically 2-3 m running at 150 – 300 m/min continuous
◦ Supercalendering, full width, 150-300 m/min
◦ Slitting: full or ½ width, same speed
Cost drivers◦ Materials
◦ Depreciation/CapEx
◦ Labor: 5 operators paper, 2 calendering, 1 slit, 1 stock prep for total of 9
◦ Energy & water very low
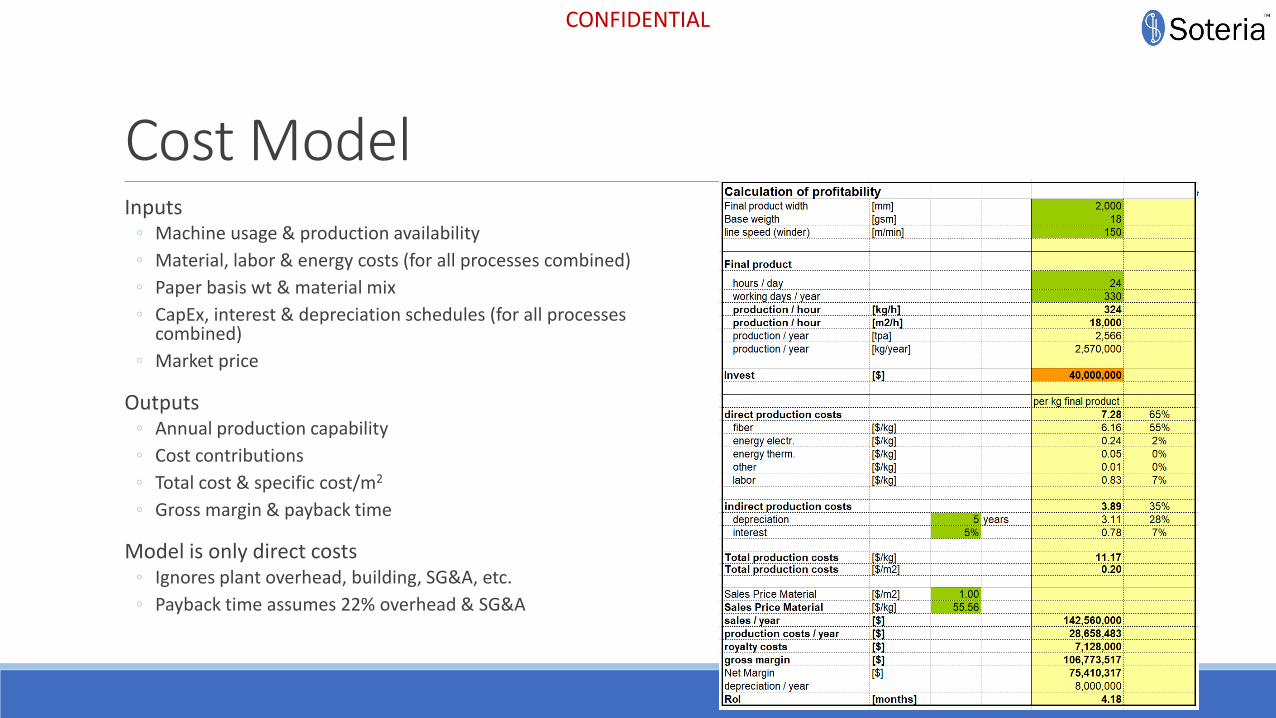
Cost ModelInputs
◦ Machine usage & production availability
◦ Material, labor & energy costs (for all processes combined)
◦ Paper basis wt & material mix
◦ CapEx, interest & depreciation schedules (for all processes combined)
◦ Market price
Outputs◦ Annual production capability
◦ Cost contributions
◦ Total cost & specific cost/m2
◦ Gross margin & payback time
Model is only direct costs◦ Ignores plant overhead, building, SG&A, etc.
◦ Payback time assumes 22% overhead & SG&A
CONFIDENTIAL
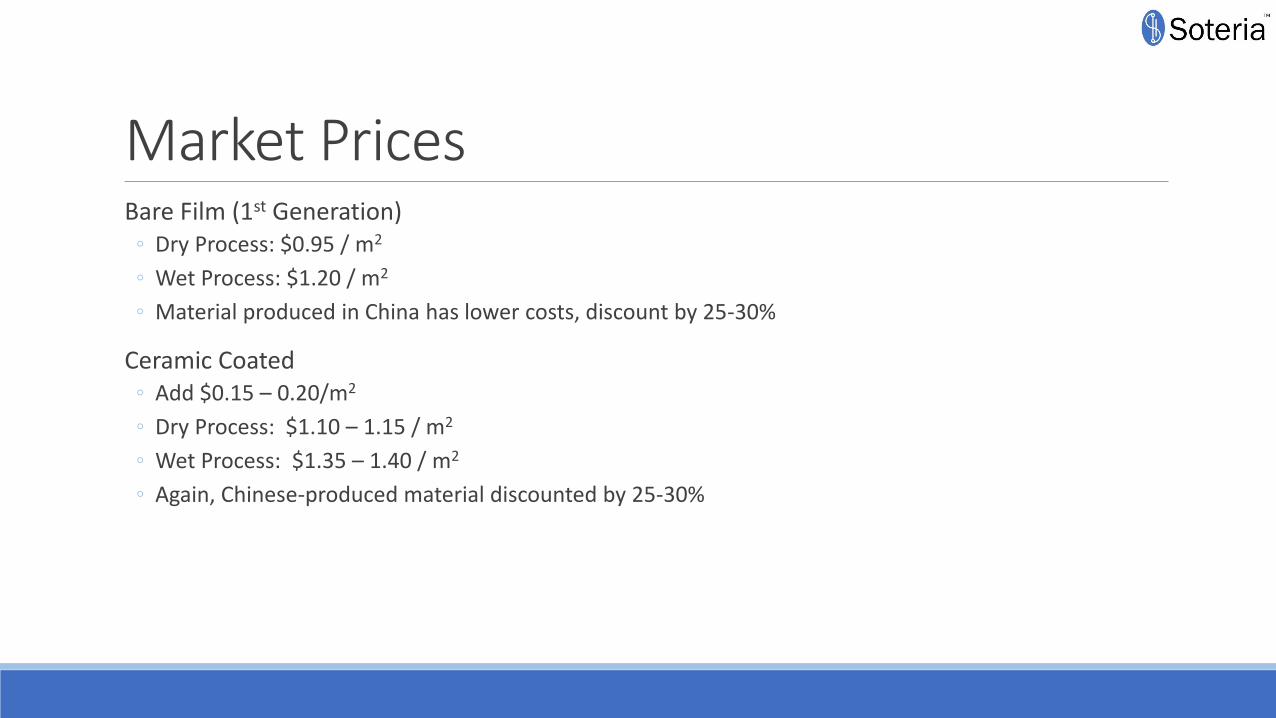
Market PricesBare Film (1st Generation)
◦ Dry Process: $0.95 / m2
◦ Wet Process: $1.20 / m2
◦ Material produced in China has lower costs, discount by 25-30%
Ceramic Coated◦ Add $0.15 – 0.20/m2
◦ Dry Process: $1.10 – 1.15 / m2
◦ Wet Process: $1.35 – 1.40 / m2
◦ Again, Chinese-produced material discounted by 25-30%
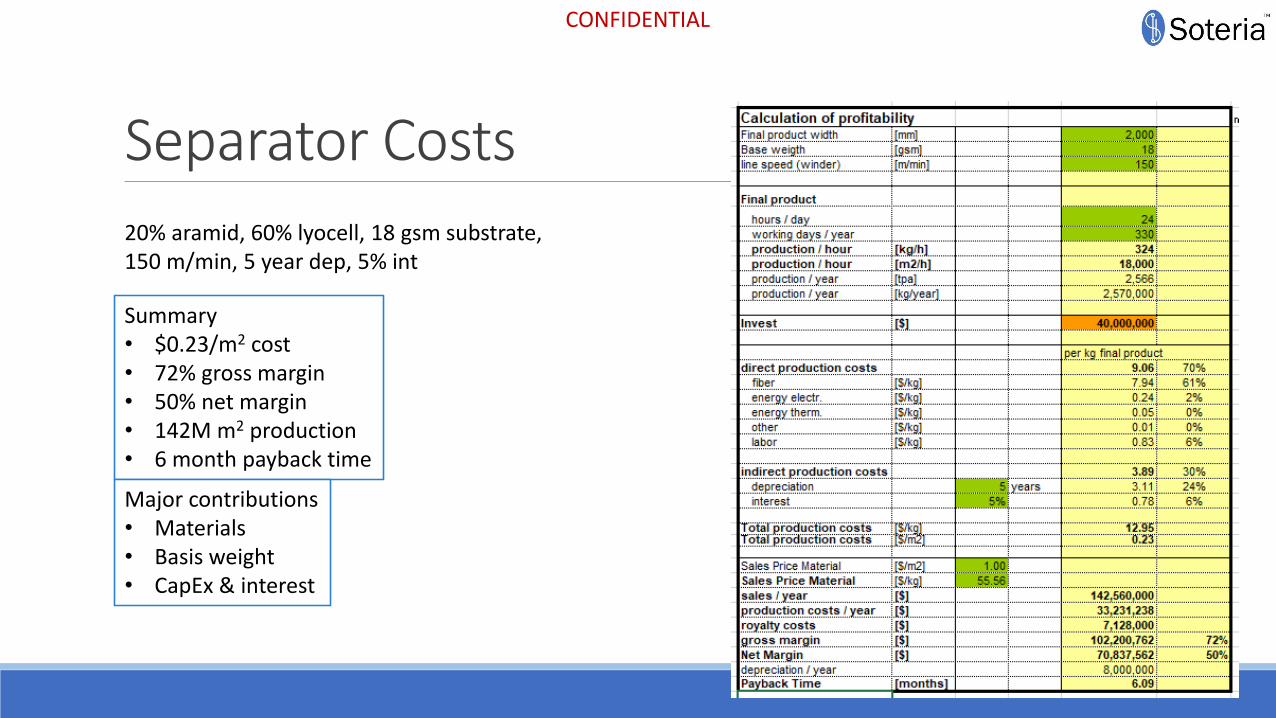
Separator Costs
20% aramid, 60% lyocell, 18 gsm substrate, 150 m/min, 5 year dep, 5% int
CONFIDENTIAL
Summary• $0.23/m2 cost• 72% gross margin• 50% net margin• 142M m2 production• 6 month payback time
Major contributions• Materials• Basis weight• CapEx & interest
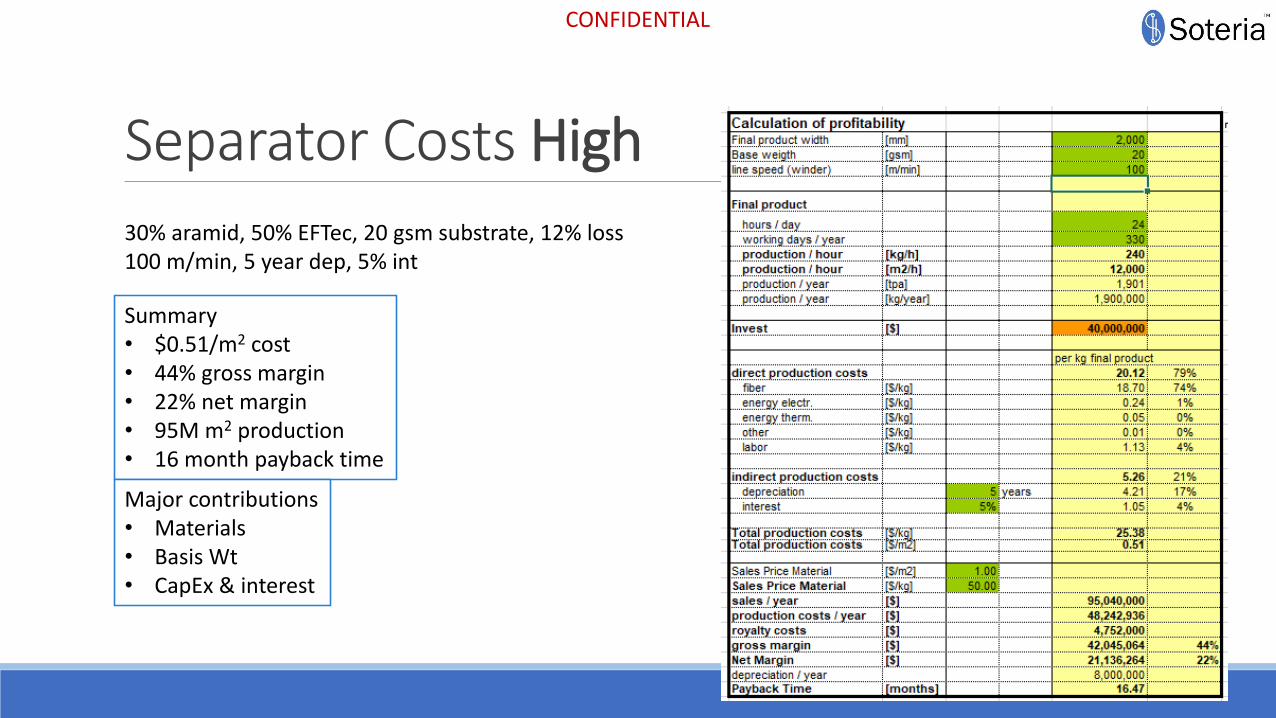
Separator Costs High
30% aramid, 50% EFTec, 20 gsm substrate, 12% loss 100 m/min, 5 year dep, 5% int
CONFIDENTIAL
Summary• $0.51/m2 cost• 44% gross margin• 22% net margin• 95M m2 production• 16 month payback time
Major contributions• Materials• Basis Wt• CapEx & interest
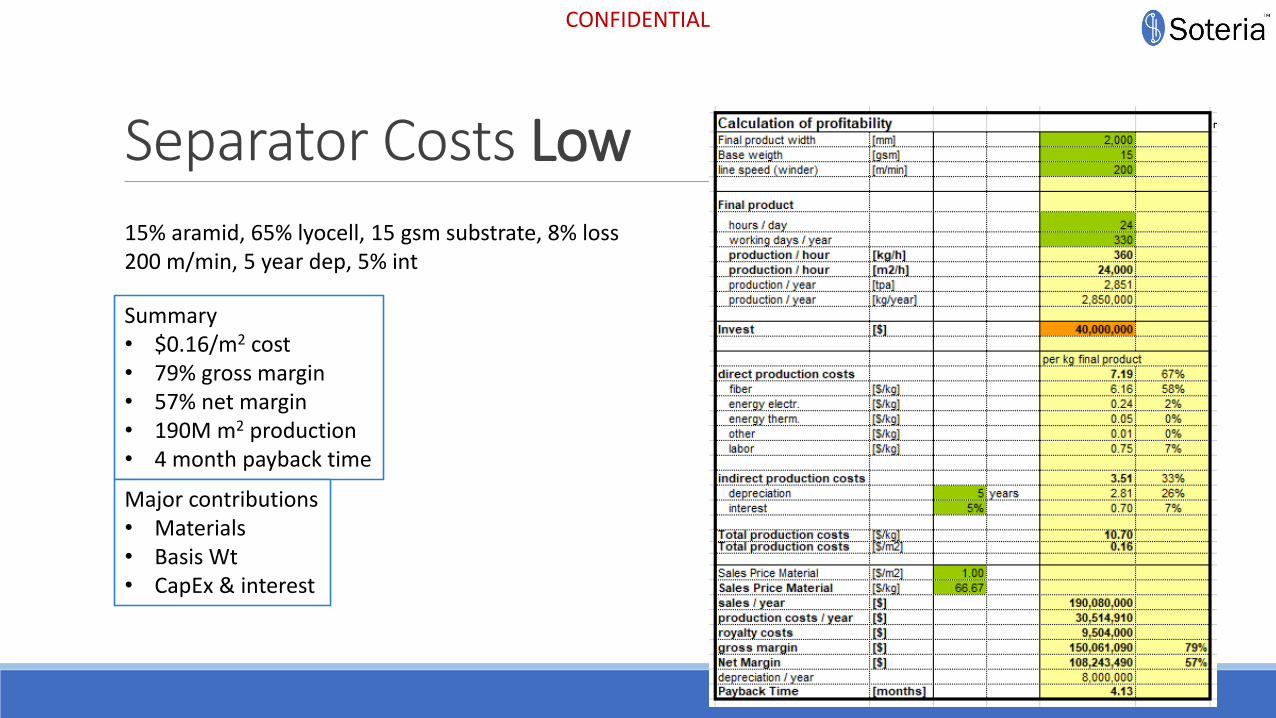
Separator Costs Low
15% aramid, 65% lyocell, 15 gsm substrate, 8% loss 200 m/min, 5 year dep, 5% int
CONFIDENTIAL
Summary• $0.16/m2 cost• 79% gross margin• 57% net margin• 190M m2 production• 4 month payback time
Major contributions• Materials• Basis Wt• CapEx & interest
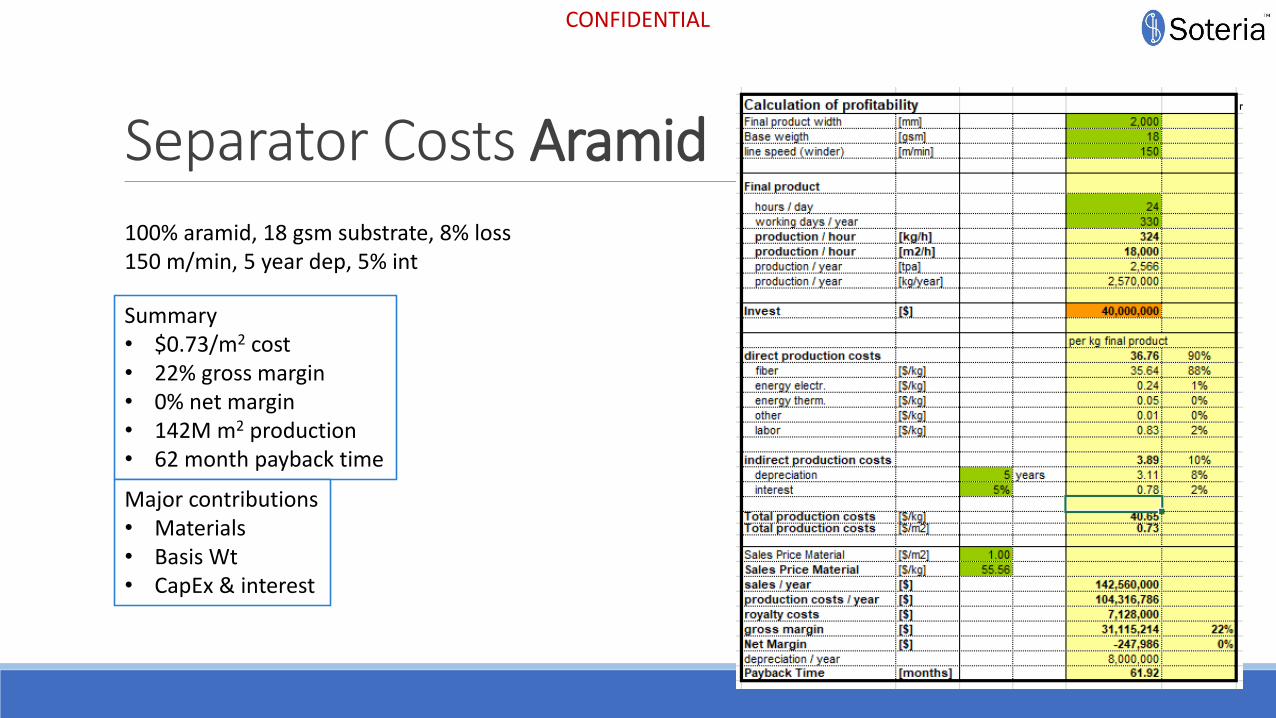
Separator Costs Aramid
100% aramid, 18 gsm substrate, 8% loss 150 m/min, 5 year dep, 5% int
CONFIDENTIAL
Summary• $0.73/m2 cost• 22% gross margin• 0% net margin• 142M m2 production• 62 month payback time
Major contributions• Materials• Basis Wt• CapEx & interest
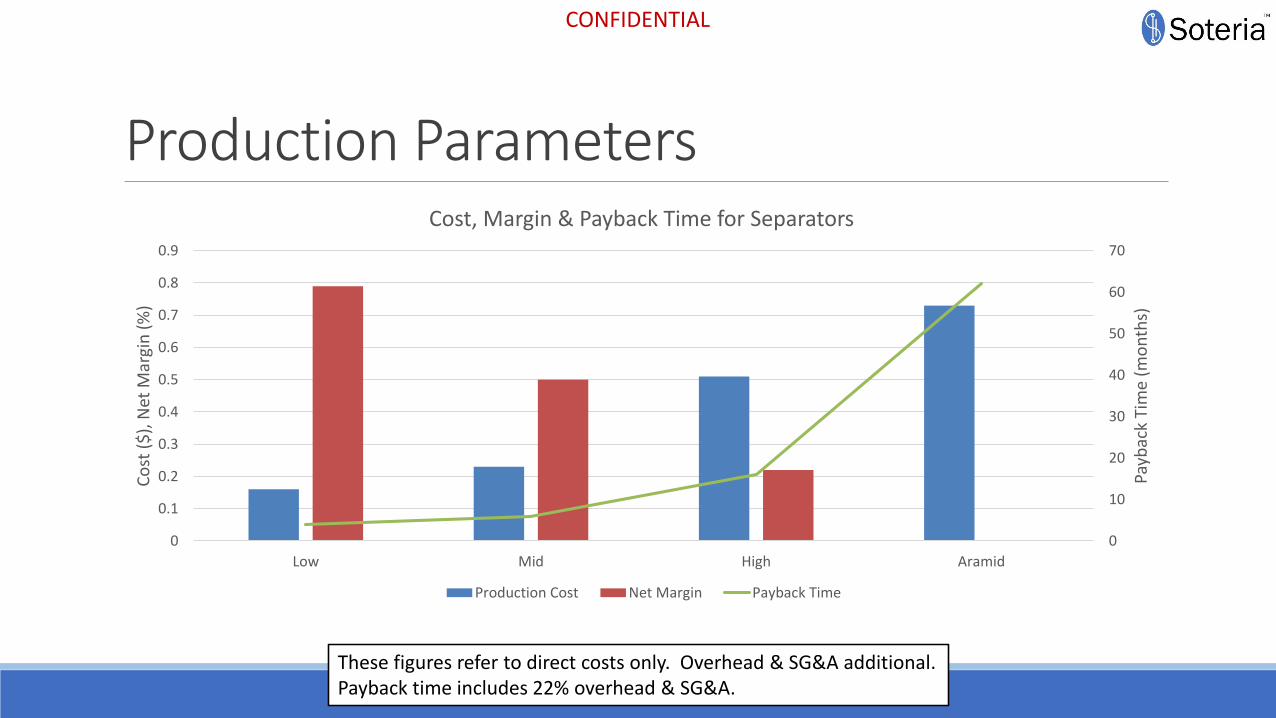
Production Parameters
These figures refer to direct costs only. Overhead & SG&A additional. Payback time includes 22% overhead & SG&A.
CONFIDENTIAL
0
10
20
30
40
50
60
70
0
0.1
0.2
0.3
0.4
0.5
0.6
0.7
0.8
0.9
Low Mid High Aramid
Payb
ack
Tim
e (m
on
ths)
Co
st (
$),
Net
Mar
gin
(%
)
Cost, Margin & Payback Time for Separators
Production Cost Net Margin Payback Time
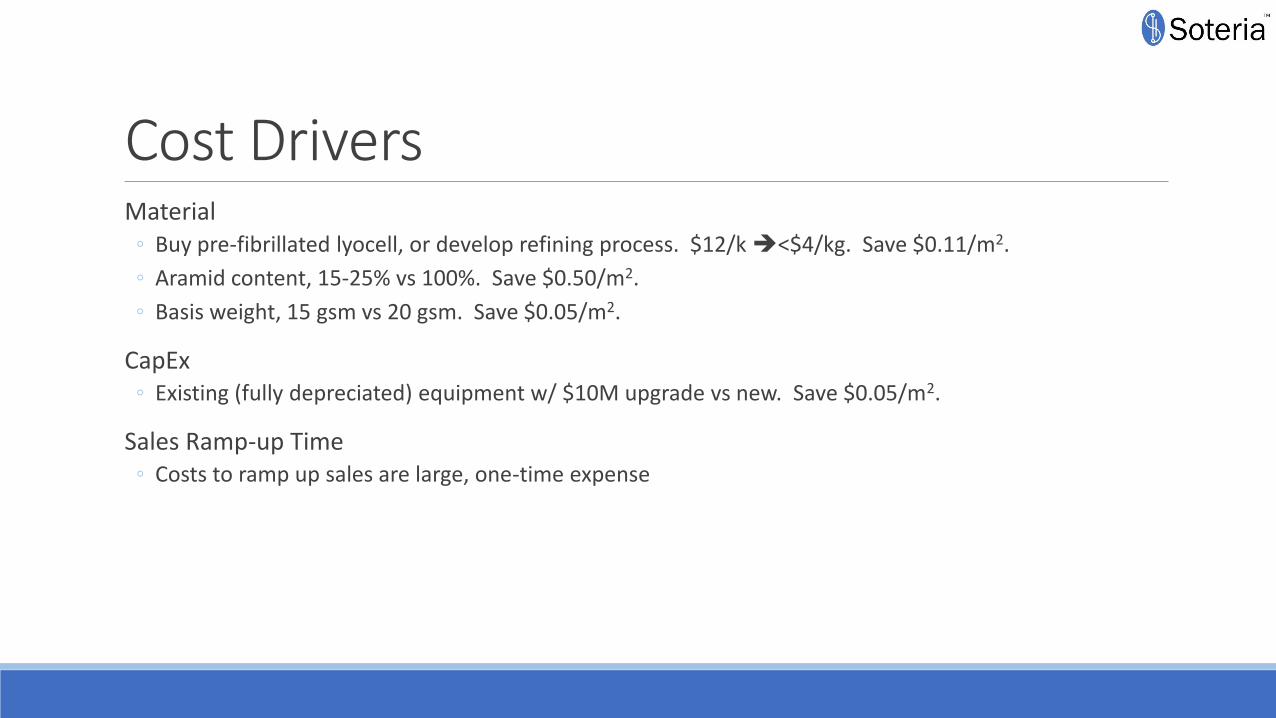
Cost DriversMaterial
◦ Buy pre-fibrillated lyocell, or develop refining process. $12/k ➔<$4/kg. Save $0.11/m2.
◦ Aramid content, 15-25% vs 100%. Save $0.50/m2.
◦ Basis weight, 15 gsm vs 20 gsm. Save $0.05/m2.
CapEx◦ Existing (fully depreciated) equipment w/ $10M upgrade vs new. Save $0.05/m2.
Sales Ramp-up Time◦ Costs to ramp up sales are large, one-time expense
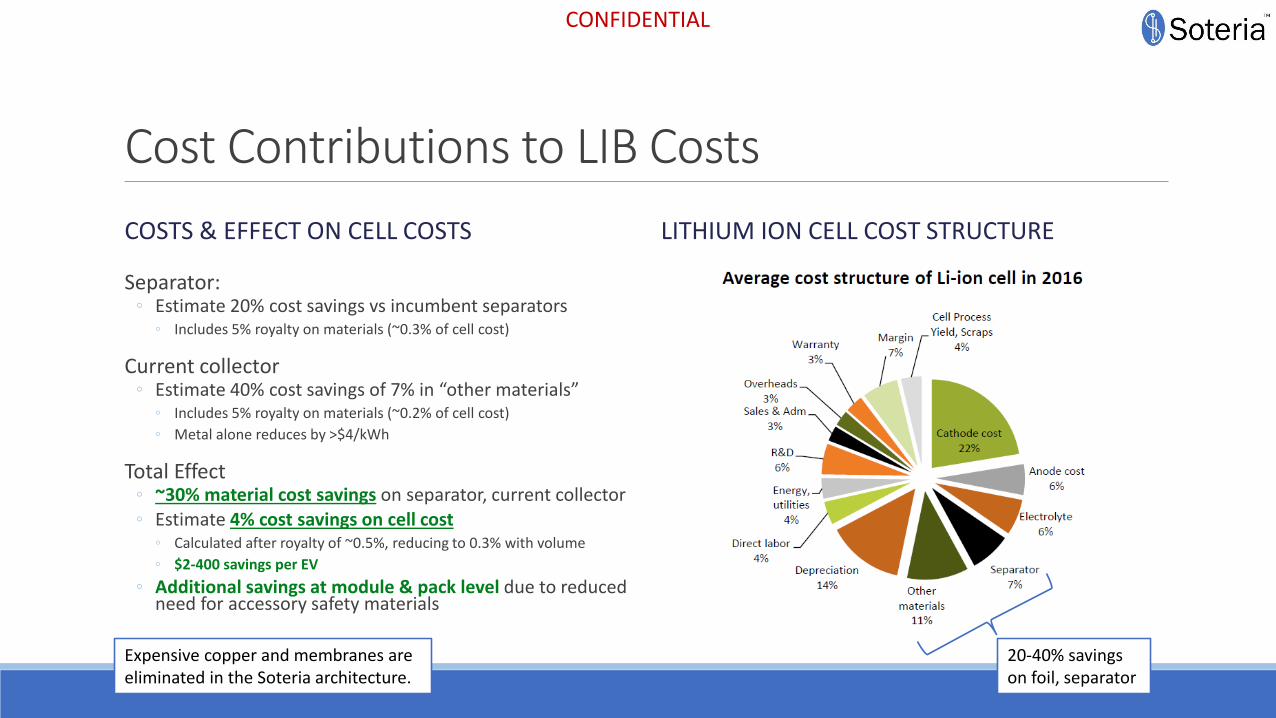
Cost Contributions to LIB Costs
COSTS & EFFECT ON CELL COSTS LITHIUM ION CELL COST STRUCTURE
Separator:◦ Estimate 20% cost savings vs incumbent separators
◦ Includes 5% royalty on materials (~0.3% of cell cost)
Current collector◦ Estimate 40% cost savings of 7% in “other materials”
◦ Includes 5% royalty on materials (~0.2% of cell cost)
◦ Metal alone reduces by >$4/kWh
Total Effect◦ ~30% material cost savings on separator, current collector◦ Estimate 4% cost savings on cell cost
◦ Calculated after royalty of ~0.5%, reducing to 0.3% with volume
◦ $2-400 savings per EV
◦ Additional savings at module & pack level due to reduced need for accessory safety materials
20-40% savings on foil, separator
Expensive copper and membranes are eliminated in the Soteria architecture.
CONFIDENTIAL
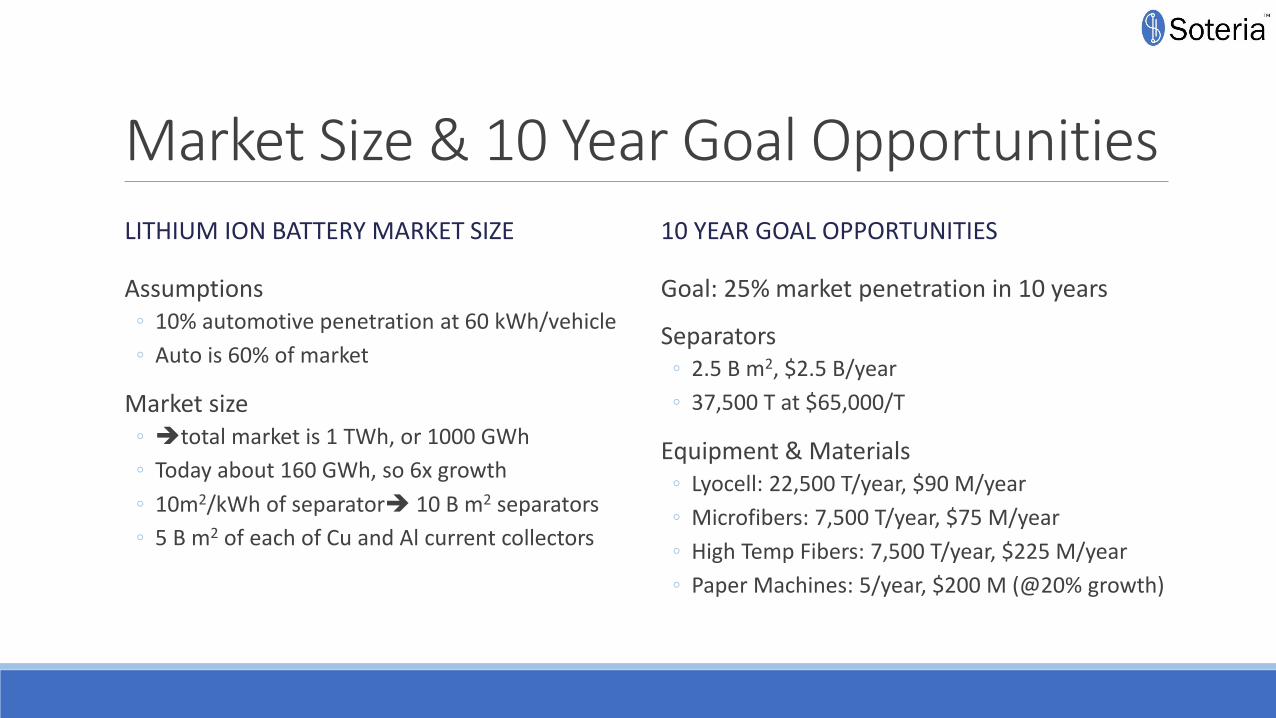
Market Size & 10 Year Goal Opportunities LITHIUM ION BATTERY MARKET SIZE
Assumptions◦ 10% automotive penetration at 60 kWh/vehicle
◦ Auto is 60% of market
Market size◦ ➔total market is 1 TWh, or 1000 GWh
◦ Today about 160 GWh, so 6x growth
◦ 10m2/kWh of separator➔ 10 B m2 separators
◦ 5 B m2 of each of Cu and Al current collectors
10 YEAR GOAL OPPORTUNITIES
Goal: 25% market penetration in 10 years
Separators◦ 2.5 B m2, $2.5 B/year
◦ 37,500 T at $65,000/T
Equipment & Materials◦ Lyocell: 22,500 T/year, $90 M/year
◦ Microfibers: 7,500 T/year, $75 M/year
◦ High Temp Fibers: 7,500 T/year, $225 M/year
◦ Paper Machines: 5/year, $200 M (@20% growth)
SummaryLarge, growing market exists: 10 year goal of $2.5 B can support multiple licensees
Cost structure allows for large 50% net margins◦ May allow for price concessions to achieve market share.
CapEx is an important cost parameter. ◦ Companies with existing equipment that needs only modest upgrades will have an advantage.
Material cost is the dominant long-term driver to profitability. ◦ Products need to be engineered with this in consideration


