June 2009 Arne Olav Fredheim, EPT Master of Science in Product Design and Manufacturing Submission date: Supervisor: Norwegian University of Science and Technology Department of Energy and Process Engineering Separation of Gas from Liquids in Viscous Systems Eirik Slungaard Slettebø
Transcript
June 2009Arne Olav Fredheim, EPT
Master of Science in Product Design and ManufacturingSubmission date:Supervisor:
Norwegian University of Science and TechnologyDepartment of Energy and Process Engineering
Separation of Gas from Liquids inViscous Systems
Eirik Slungaard Slettebø
Problem DescriptionBackground:Several of the new oil and gas fields that are developed today have a size and location whichmakes utilization of a subsea installation for separation and boosting of the well stream combinedwith single- or multiphase pipeline to existing installation for further processing the mosteconomical solution. The focus has also turned to more production from reservoirs with poorer oilquality, for instance heavier oil with higher viscosity.In connection with separation of gas from oil is the understanding of the degassing processimportant. In order to produce oil with the proper quality, the separator must be designed in sucha way that gas components have sufficient time to become separated from the oil. This includesformation of gas bubbles, coalescence to larger bubble systems and migration to surface. If thisprocess requires much time, this may lead to a separator designed for a high retention time,which again has direct consequences for weight and size of equipment.
Objective:The objective of the thesis is to establish an overview of equipment and calculation models forgas-liquid separation in viscous systems and suggestions to equipment-related improvementswhich can increase separation efficiency. The following should be considered in the thesis:1. Review of available equipment for separation of oil and gas with focus on separation in subseainstallations.2. Review of methods and calculation models for calculation of separation of gas bubbles fromliquid phase in normal oil-gas systems.3. Review of models for calculation of separation of gas bubbles from liquid phase in viscous oil-gas systems, for instance heavy oil systems and glycol systems.4. Suggestions to methods and equipment for improvement of the separation process between gasbubbles and liquids in viscous systems.
Assignment given: 20. January 2009Supervisor: Arne Olav Fredheim, EPT
v
vi
vii
PREFACE
This thesis represents the final work of my Masters degree at the Norwegian University of Science and Technology, NTNU. The thesis was carried out at the Faculty of Engineering and Science Technology - Department of Energy and Process Technology during spring 2009.
The objective of the thesis has been to establish an overview of theory and processes that forms the basis in degassing of viscous oil. This is an area where research so far has been limited in the petroleum industry. The work has therefore to a large extent focused on reviewing theory related to other similar processes and put this into the context of separation. It has been a very informative process increasing my, on beforehand limited, knowledge on the area significantly.
I would like to thank my main supervisor Arne Olav Fredheim and co-supervisors Bernt Henning Rusten and Einar Eng Johnsen at StatoilHydro for all guidance and support. Also, I would like to thank everyone who has kindly responded to my enquiries and supported me with information.
Eirik Slungaard Slettebø
ix
ABSTRACT
Increased knowledge of the degassing process in separation of gas from oil is important in connection with development of subsea separation and boosting units for heavy oil fields. The focus in the thesis is on theory and equipment design for two-phase separation of oil and gas. A review of gravitational separators and compact separation technology with a focus on subsea installations is given first. An extensive literature review related to theory governing the degassing process is further presented.
The effectiveness of the degassing process depends on the gas’ ability to migrate out of the oil. Bubble dynamics theory, especially correlations for calculation of a bubbles velocity in a liquid is therefore examined. Bubble size, fluid properties, especially liquid viscosity, and gas volume fraction in the liquid is decisive factors for the bubble velocity. A comparison of several correlations obtained in various literature is made to determine the best available for modeling degassing. Most of the correlations have a limited range of validity in terms of bubble size and Reynolds number. It is verified that they are highly inaccurate outside this range. A correlation developed to be valid for a large range of bubble sizes seems to predict bubble velocities reasonably well. Because of its large range of validity, this is chosen to be used in the development of a separator model.
Some experimental work is performed on two liquids with different viscosity. It is verified that separation of gas in viscous liquids requires significantly more retention time for the smallest bubbles reach the liquid surface. Occasional deviations from the examined theory are observed, especially for the more viscous liquid.
Based the chosen correlation for bubble velocity a simplified model for horizontal and vertical gravity separators is developed. Separator size, fluid properties, flow rate and distribution of bubbles are input parameters. The model calculates how much of the initial gas volume fraction that remains in the liquid after separation. Consequence of high liquid viscosity and distribution of bubble size and bubble distribution in the liquid are evaluated by use of the model.
When the oil becomes very viscous is it important that separator and internals are designed to optimize the conditions for degassing. This implies among others an inlet device which provides an ability to control the bubble distribution and keep the size of bubbles as large as possible. Methods are suggested for increased effectiveness in degassing of heavy oils, by reducing viscosity, increase the coalescence rate and affecting the flow pattern. Separation of other phases and undesirable components is also important and may make it difficult to optimize the design for the degassing process. However, a separator should be efficient in all respects, making knowledge of the degassing process anyhow important.
The thesis gives an overview of important parameters in the degassing process. Much work still remains to develop correlations and models which can give a more exact description of real systems. Continuous development in separator components and not at least compact separation technology is important to effectively be able to produce heavy oil, especially in terms of subsea installations.
xi
ABSTRAKT
Økt kunnskap om avgassingsprosessen i forbindelse med separasjon av gass fra olje er vikitg i forbindelse med utviklingen av undervannisntallasjoner for separasjon og trykkstøtte for bruk på tungoljefelt. Fokuset i oppgaven er på teori og beskrivelse av utstyrsdesgin for to-fase separasjon av olje og gass. En oversikt over tyngdekraftsseparatorer og kompakt separasjonsteknologi med fokus på bruk i undervannsinstallasjoner er derfor først gjennomgått. En omfattende gjennomgang av litteratur angående bakgrunnsliggende teori for avgassingsprosessen er så presentert.
Effektiviteten av avgassingsprosessen er avhengig av gassens evne til å migrere ut av oljen. Teori angående bobledynamikk, spesielt korrelasjoner for beregning av boblehastighet i en væske er defor gjennomgått. Boblestørrelse, væskeegenskaper, spesielt viskositet, og gass fraksjonen i væska er avgjørende faktorer for boblehastigheten. En sammenlikning av flere korrelasjoner funnet i diverse litteratur er gjort for å finne den best tilgjengelige for modellering av avgassing i separasjon. De fleste korrelasjoner har et begrenset gyldighetsområde med tanke på boblestørrelse og Reynoldstall. Det er verifisert at disse korrelasjonene er gir høyst ukorrekte svar utenfor deres gyldighetsområde. En korrelasjon utviklet for å være gyldig over et større område ser ut til å resultere i rimelige verdier for boble hastighet. På grunn av dens store gyldighetsområde er denne valgt for bruk i utviklingen av en separator modell.
Begrenset eksperimentelt arbeid er gjort for to væsker med svært ulik viskositet. Det er verifisert at separasjon av gass i viskøse væsker krever en mye høyere oppholdstid for at de minste boblene skal nå væskeoverflaten. En del avvik fra gjennomgått teori er observert, særlig for den mer viskøse væsken.
Basert på den valgte korrelasjonen for boblehastighet er en enkel modell for horisontale og vertikale tyngdekraftsseparatorer utviklet. Separator størrelse, væske egenskaper, volumstrøm og distribusjon av bobler er inngangsparametere. Modellen beregner hvor mye av den initielle gass volum fraksjonen som er igjen i væska etter separasjon. Konsekvenser av høy viskositet, distribusjonen av boble størrelser og hvordan de er distribuert i væska er evaluert ved bruk av modellen.
Når oljen blir veldig viskøs er det viktig at separator og komponenter har et design som optimaliserer forholdene for degassing. Det forutsetter blant annet en innløpskomponent som gir mulighet for å kontrollere bobledistribusjon og holde størrelsen på bobler så stor som mulig. Det er foreslått metoder for økt effektivitet i separering av tungolje ved å redusere viskositet, øke koalesensrater og påvirke strømningsmønsteret. Separasjon av andre faser og uønskede komponenter er også viktig og kan gjøre det vanskelig å optimalisere designet for avgassingsprosessen. Allikevel bør en separator være effektiv på alle områder, hvilket gjør kunnskap om avgassingsprosessen viktig uansett.
Oppgaven gir en oversikt over viktige parametere i avgassingsprosessen. Det gjenstår likevel mye arbeid i å utvikle korrelasjoner som kan gi mer eksakte beskrivelser av virkelige systemer. Stadig utvikling i separator komponenter og ikke minst kompakt separasjonsteknologi er viktig for å effektivt kunne produsere tungolje, spesielt med tanke på undervannsinstallasjoner.
3.1 Single bubble rising under gravity ........................................................................................................... 27 3.1.1 Governing equations .......................................................................................................................... 27 3.1.2 Bubble shape ...................................................................................................................................... 31 3.1.3 Influence of contaminants .................................................................................................................. 32 3.1.4 Correlations for drag coefficient and/or terminal velocity ................................................................. 33 3.1.5 Comparison of some the correlations ................................................................................................. 35
3.1.5.1 All correlations for all bubble sizes .......................................................................................... 36 3.1.5.2 Low Reynolds number ............................................................................................................. 37 3.1.5.3 Region independent correlations .............................................................................................. 38 3.1.5.4 Region independent correlations compared to specified region correlations ........................... 40
3.1.6 Summary and conclusion ................................................................................................................... 43
4.2 Test parameters ......................................................................................................................................... 54
4.3 Test results ................................................................................................................................................. 55 4.3.1 Measuring gas mixed into oil ............................................................................................................. 55 4.3.2 Observing bubble dynamics ............................................................................................................... 57
4.3.2.1 Terminal velocity measurement ............................................................................................... 57 4.3.2.2 General observations on bubble dynamics ............................................................................... 59 4.3.2.3 Summary and conclusion ......................................................................................................... 61
APPENDIX A – CORRELATIONS FOR DRAG COEFFECIENT AND/OR TERMINAL VELOCITY ....................................................................... 93
APPENDIX B – RELATION BETWEEN LIQUID PROPERTIES IN OILFIELDS ..... 99
APPENDIX C – DEVELOPED SEPARATOR MODEL ................................................. 101
xvii
LIST OF FIGURES
Figure 1-1: Schematic of a three-stage separation system[1] .................................................................................. 1
Figure 1-2: Classification of crude oils by density-gravity[2] ................................................................................ 2
Figure 2-1: Horizontal separator schematic showing the four major sections[1] .................................................... 7
Figure 2-2: Examples of diverter plates[1].............................................................................................................. 8
Figure 2-3: Halfpipe inlet device in a vertical separator [6].................................................................................... 8
Figure 2-4: a: Vane type installed in scrubber[7]. b: Distribution of feed across the vessel cross section[8]. ........................................................................................................................................... 9
Figure 2-5: a: Inlet distributor with a number of cyclone tubes[9] b: Inlet distributor consisting of one large cyclone tube[10] ........................................................................................................................ 9
Figure 2-9: Principle sketch of a GLCC[15] ......................................................................................................... 15
Figure 2-10: Principle sketch of the VASPS system[18] ...................................................................................... 17
Figure 2-11: General arrangement of an I-SEP[19] .............................................................................................. 17
Figure 2-14: Cross section of a Twister tube [24] ................................................................................................. 20
Figure 2-15: Proposition of a Subsea Twister system[23] .................................................................................... 21
Figure 2-16: Schematic overview of Tordis SSBI[29] .......................................................................................... 24
Figure 2-17: The SSU with vertical separator and two hybrid pumps [30] ........................................................... 25
Figure 2-18: Subsea Caisson Separator System [35] ........................................................................................... 25
Figure 3-1: Single bubble rising due to density differences under gravity ............................................................ 27
Figure 3-2: Drag coefficients of various shapes as a function of Reynolds number (Standard drag curve)[37] ......................................................................................................................................... 28
Figure 3-3: The drag curves of free falling (ABC) and rising (ABD) solid spheres [42] ...................................... 30
Figure 3-4: Categories of bubbles based on shape ................................................................................................ 31
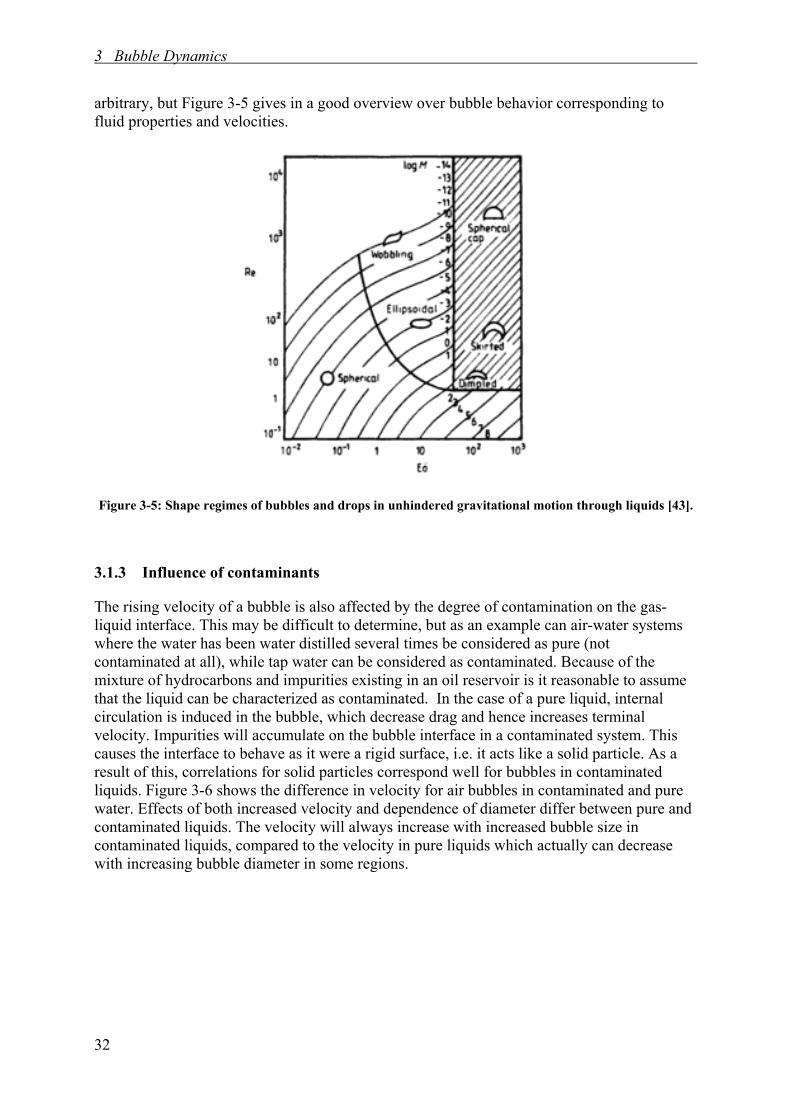
Figure 3-5: Shape regimes of bubbles and drops in unhindered gravitational motion through liquids [43]. ........ 32
Figure 3-6: Typical trends in rise velocity for air bubbles in contaminated and pure water[43]. .......................... 33
Figure 3-7: Terminal velocities with all correlations. Silicone oil AK10 ............................................................. 36
Figure 3-8: Terminal velocities with all correlations. Silicone oil AK350 ........................................................... 37
Figure 3-9: Terminal velocities with various correlations at low Reynolds numbers for various liquid viscosities. ......................................................................................................................................... 37
Figure 3-10: Silicone oil AK100 in very low Reynolds number region................................................................ 38
Figure 3-11: Terminal velocities using region independent correlations. Silicone oil AK20 ............................... 39
Figure 3-12: Terminal velocities using region independent correlations. Silicone oil AK100 ............................ 39
Figure 3-13: Terminal velocities using region independent correlations. Silicone oil AK350 ............................ 39
Figure 3-14: Oseen vs. Karamanev and Bozzano and Dente with AK20 (left) and AK350 (right) ...................... 41
Figure 3-15: Haas vs. Karamanev and Bozzano and Dente with AK10 (left) and AK20 (right) .......................... 41
Figure 3-16: Hamielec vs. Karamanev and Bozzano and Dente with AK10 (left) and AK20 (right) ................... 42
xviii
Figure 3-17: Grace vs. Karamanev and Bozzano and Dente with AK10 (left) and AK20 (right) ........................ 42
Figure 3-18: Davies & Taylor vs. Karamanev and Bozzano and Dente with AK20 (left) and AK100 (right) ................................................................................................................................................ 43
Figure 3-19: Two examples of the rise of swarms of bubbles............................................................................... 46
Figure 3-20: Liquid velocity superimposed on the two systems ........................................................................... 47
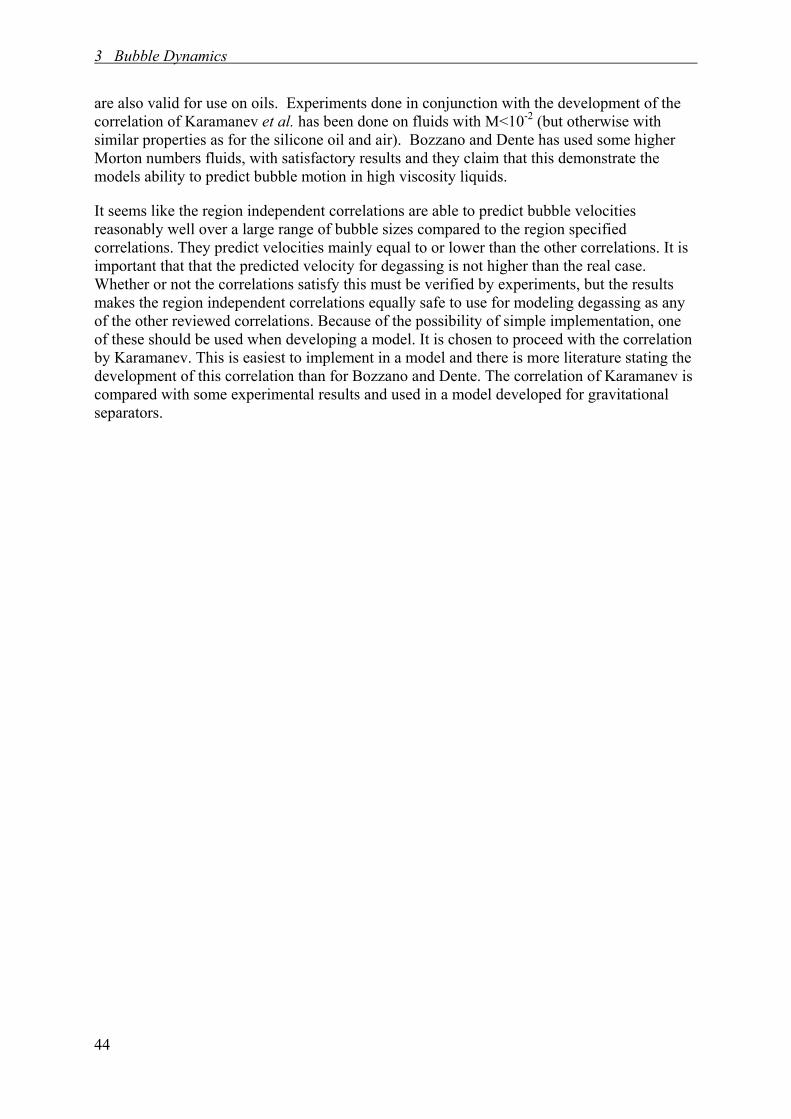
Figure 3-21: The three steps occurring in coalescence: Collision, liquid film drainage, rupture. This creates one large bubble. ................................................................................................................... 49
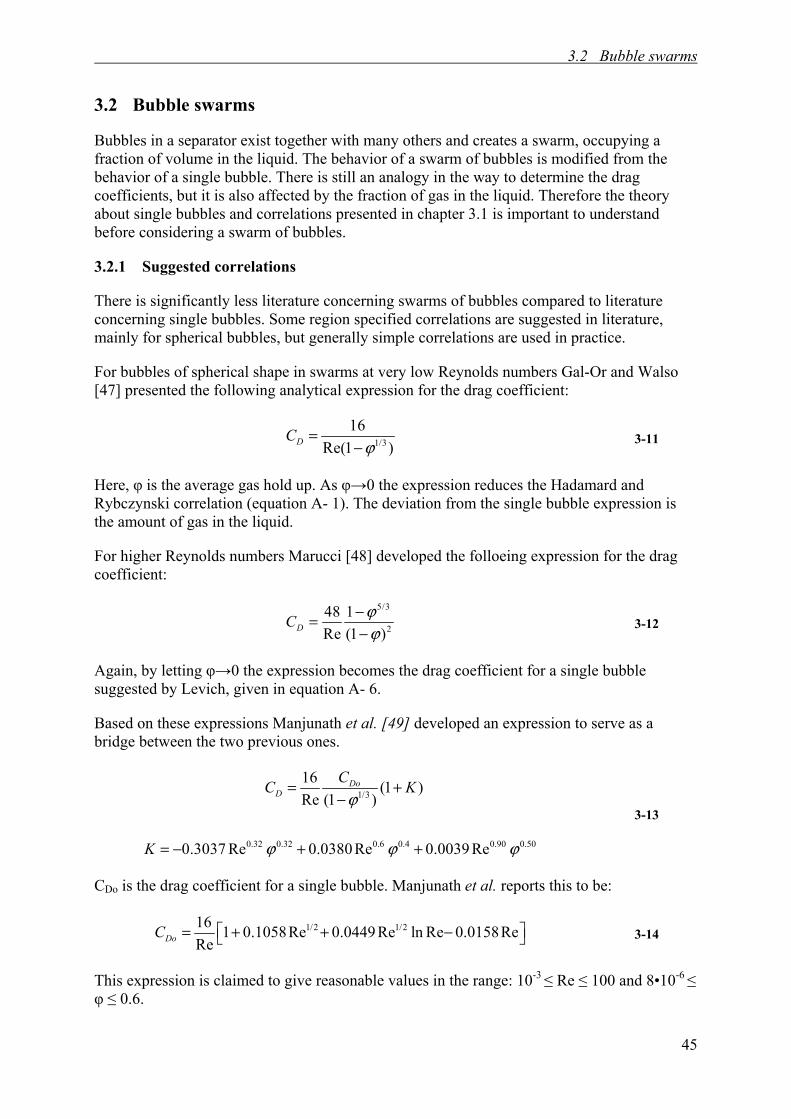
Figure 3-22: Collision and coalescence of bubbles due to turbulent eddies .......................................................... 49
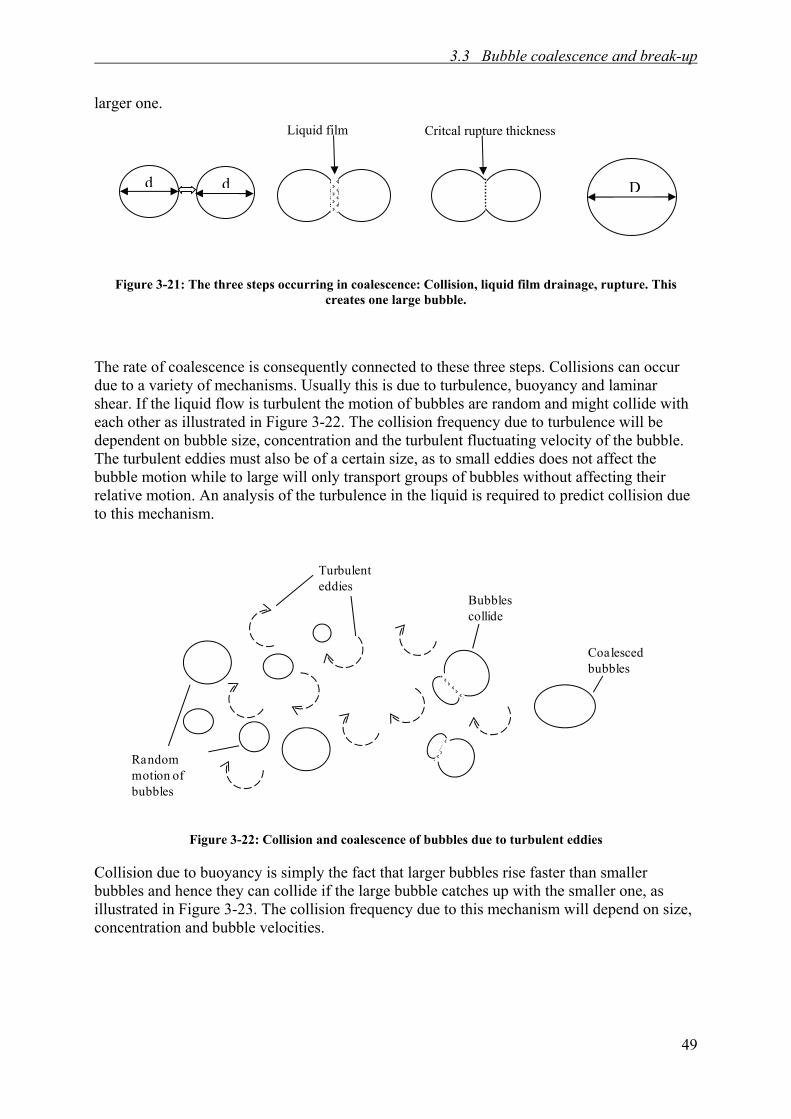
Figure 3-23: Collision and coalescence of bubbles due to buoyancy .................................................................... 50
Figure 3-24: Break-up if bubble due to collision with turbulent eddy .................................................................. 51
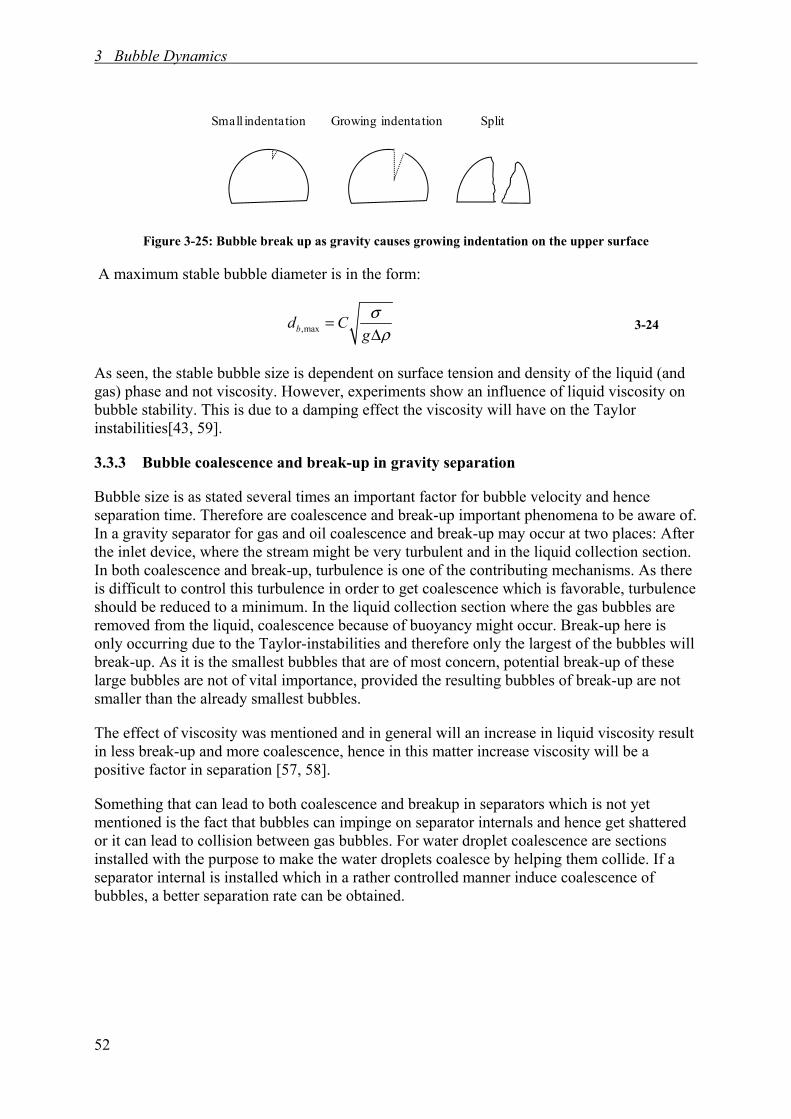
Figure 3-25: Bubble break up as gravity causes growing indentation on the upper surface ................................. 52
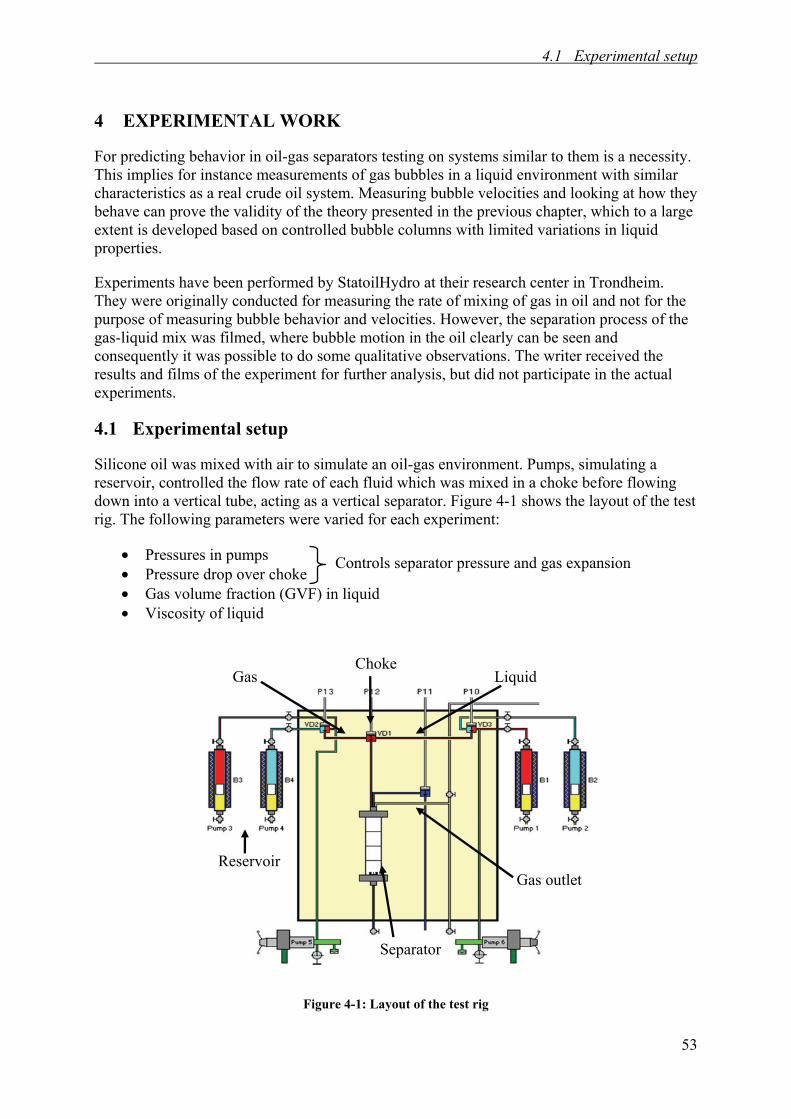
Figure 4-1: Layout of the test rig .......................................................................................................................... 53
Figure 4-2: Picture of the separator ....................................................................................................................... 54
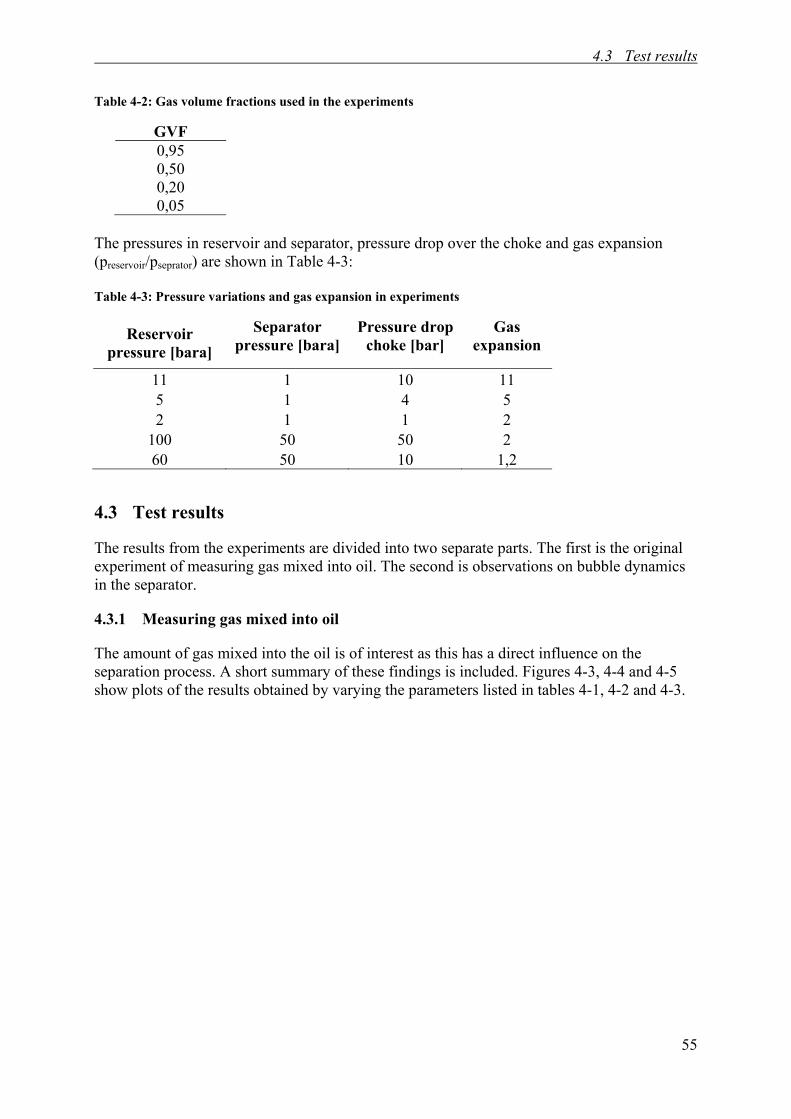
Figure 4-3: The amount of gas mixed into the oil for different viscosities, GVF and reservoir pressure ............. 56
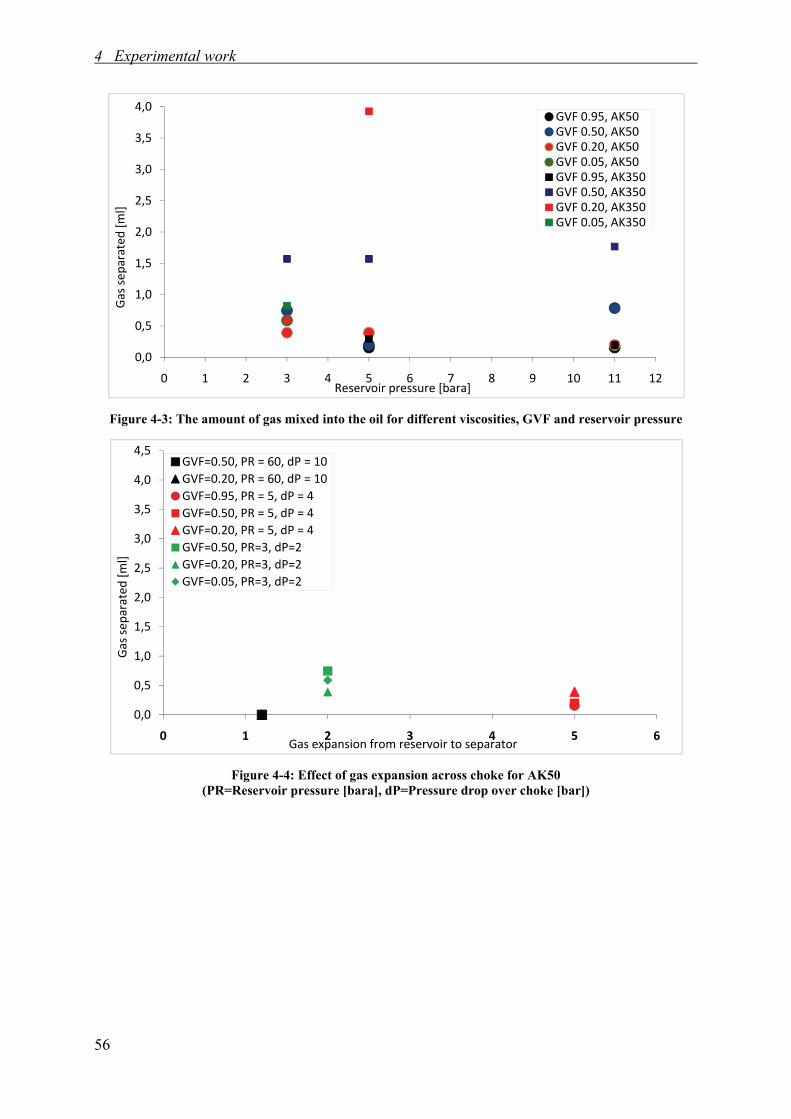
Figure 4-4: Effect of gas expansion across choke for AK50 ................................................................................. 56
Figure 4-5: Effect of gas expansion across choke for AK350 ............................................................................... 57
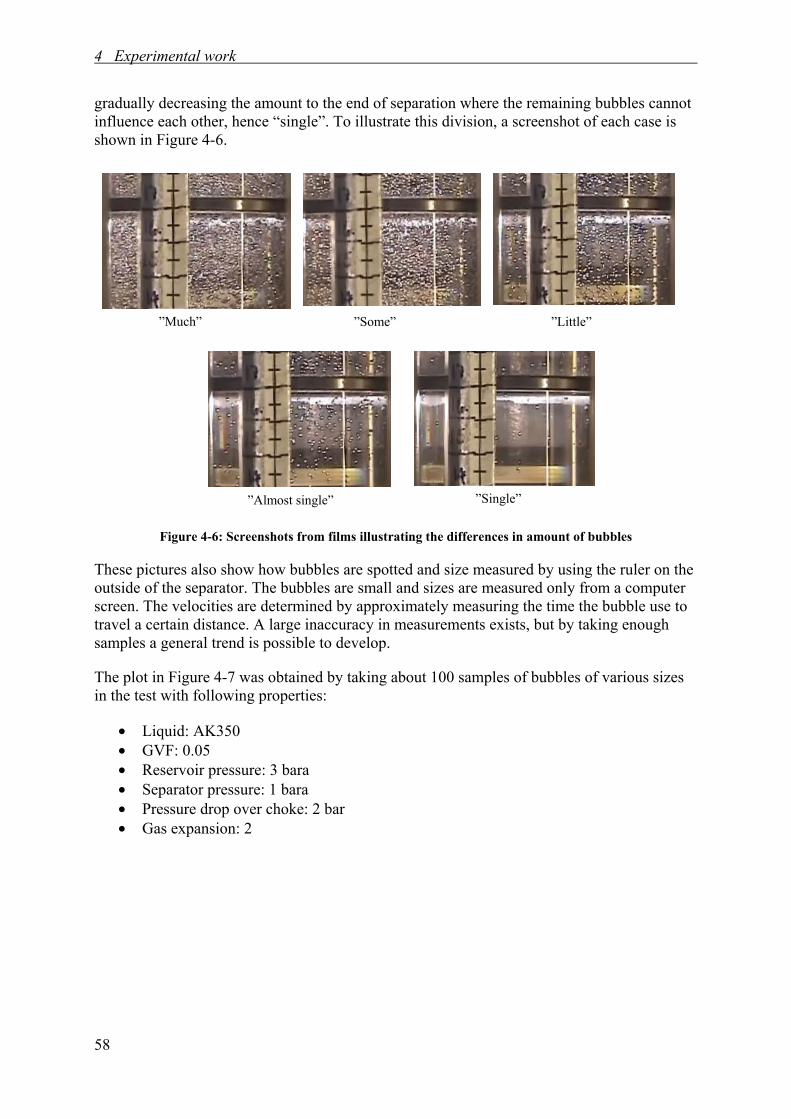
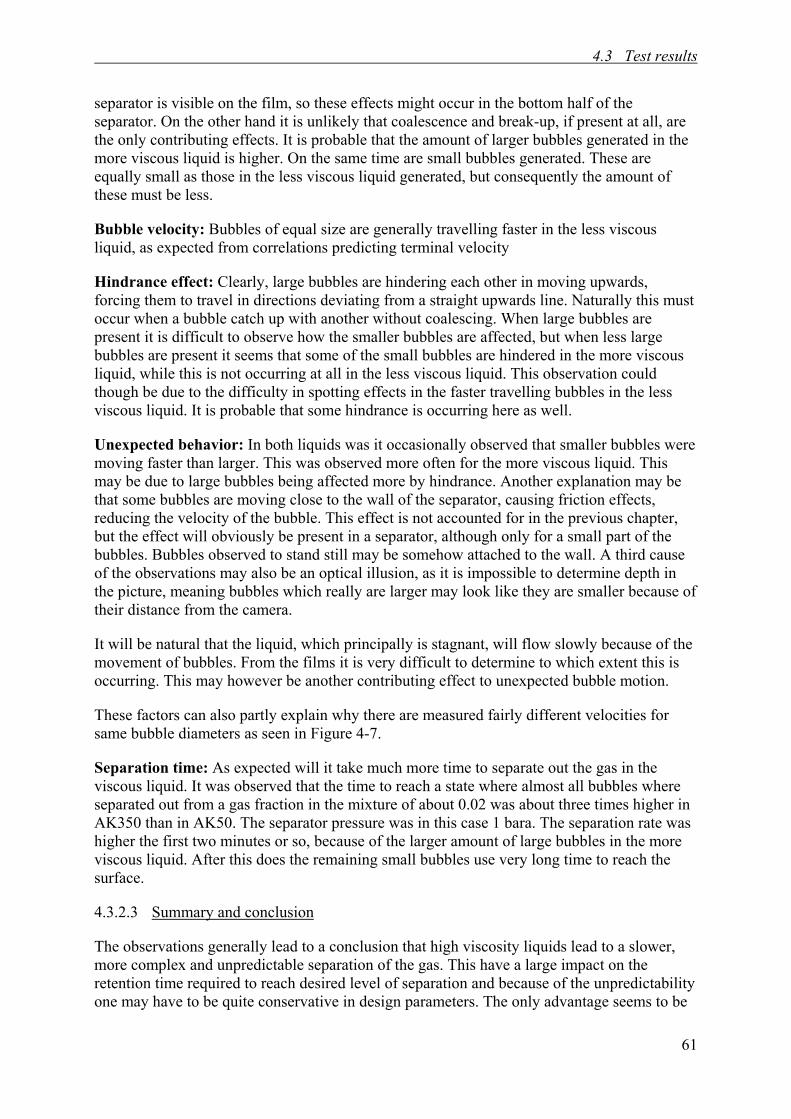
Figure 4-6: Screenshots from films illustrating the differences in amount of bubbles .......................................... 58
Figure 4-7: Measured bubble velocities in AK350 liquid ..................................................................................... 59
Figure 5-2: Horizontal separator with liquid radius R, length L, liquid height, H and cross sectional area Ac. A bubble’s horizontal and vertical velocity is shown. ................................................................ 66
Figure 5-3: Section views of separator, with longest bubble path from each segment. ........................................ 66
Figure 5-4: Illustrating differences in density of bubbles in the segments ............................................................ 67
Figure 5-5: Initial bubble distribution ................................................................................................................... 68
Figure 5-6: Effectiveness of certain horizontal separator with varying liquid viscosity ....................................... 69
Figure 5-7: Bubble size distributions generated from a Rayleigh probability distribution with different modes ................................................................................................................................................ 69
Figure 5-8: Effectiveness of certain horizontal separator with varying bubble distribution for three different liquid viscosities ................................................................................................................. 70
Figure 5-9: Effectiveness of certain horizontal separator with varying the density of bubbles in each segment ............................................................................................................................................. 71
Figure 6-1: Weight of horizontal separator as function of liquid height on radius ............................................... 75
Figure 6-2: Viscosity versus temperature for heavy oils[72] ................................................................................ 78
Figure 6-3: Matrix of inclined channels suitable for horizontal separator ............................................................ 79
Figure 6-4: Bubble collisions and coalescence in inclined channels ..................................................................... 80
Figure 6-5: Velocity profile in horizontal separator with lower velocity in bottom .............................................. 80
xix
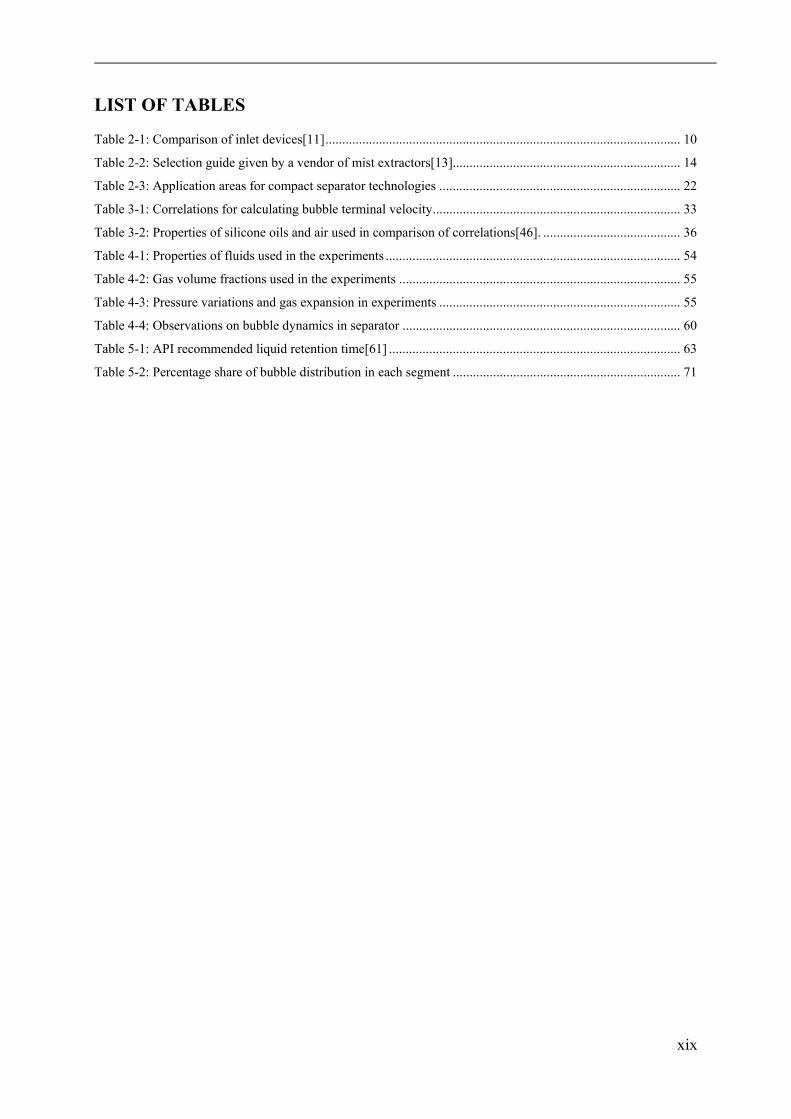
LIST OF TABLES
Table 2-1: Comparison of inlet devices[11] .......................................................................................................... 10
Table 2-2: Selection guide given by a vendor of mist extractors[13].................................................................... 14
Table 2-3: Application areas for compact separator technologies ........................................................................ 22
Table 3-1: Correlations for calculating bubble terminal velocity .......................................................................... 33
Table 3-2: Properties of silicone oils and air used in comparison of correlations[46]. ......................................... 36
Table 4-1: Properties of fluids used in the experiments ........................................................................................ 54
Table 4-2: Gas volume fractions used in the experiments .................................................................................... 55
Table 4-3: Pressure variations and gas expansion in experiments ........................................................................ 55
Table 4-4: Observations on bubble dynamics in separator ................................................................................... 60
Table 5-1: API recommended liquid retention time[61] ....................................................................................... 63
Table 5-2: Percentage share of bubble distribution in each segment .................................................................... 71
1
1 INTRODUCTION
Many of the new oil fields that are developed today have a location or have site specific conditions that make conventional methods for processing difficult. Examples of this are deepwater fields, arctic environments, distance from existing infrastructure and more heavy oil production. The most cost efficient solution for many of these fields is to do a coarse processing of the well stream subsea, before sending it up to the surface either as single- or as multiphase flow. The processing will mainly be phase separation of oil, gas, water and sand. By separating subsea, the liquid streams can be boosted by use of pumps, providing the satisfactory operational pressure. For heavy oil, additional boosting might be required to establish flowing conditions at all. Subsea separation will also help to increase the recovery rate from maturing fields.
Proper design of separators is important in order to obtain satisfactory separation efficiency, and at the same time minimize size and weight. Understanding of the degassing process is an important issue for gas-liquid separation, especially for heavy oils where degassing requires more time due to lower bubble velocities. To develop an understanding of the degassing process, knowledge about separation theory, separation design and the motion of bubbles in liquids is required.
In order to be able to transport the recovered oil, separation of the oil and gas is necessary to obtain set transport specifications. Produced water and other impurities must also be removed. Separation can be done at an offshore processing platform or on a land-based facility. The well stream is in most cases a complex mixture of different compounds, with large differences in physical properties. As the fluid flows from reservoir and through the processing facility, pressures and temperatures change. Pressure reduction causes lighter components to vaporize giving two phase flow. Accordingly, crude oil mixtures have to be processed to separate the gases in order to obtain a stable liquid for storage and transportation.
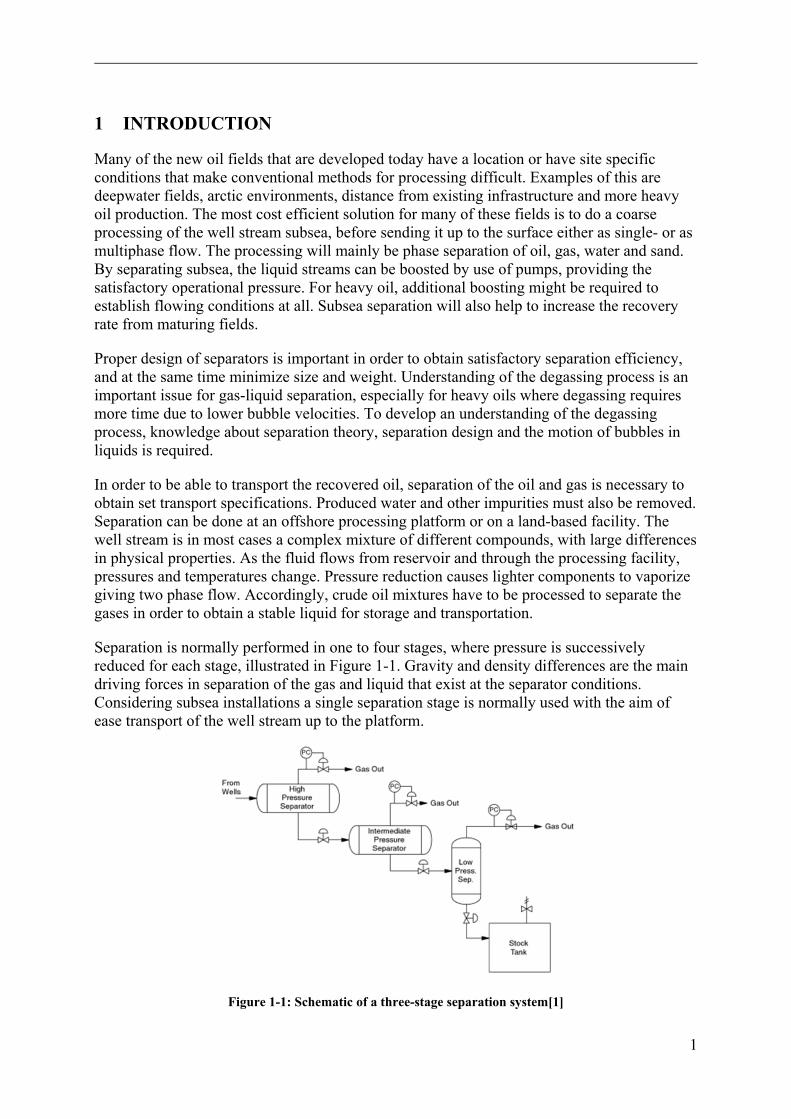
Separation is normally performed in one to four stages, where pressure is successively reduced for each stage, illustrated in Figure 1-1. Gravity and density differences are the main driving forces in separation of the gas and liquid that exist at the separator conditions. Considering subsea installations a single separation stage is normally used with the aim of ease transport of the well stream up to the platform.
Figure 1-1: Schematic of a three-stage separation system[1]
1 Introduction
2
Use of centrifugal devices to enhance separation are becoming more and more common due to the increased force compared to gravity, and thereby making it possible to make more compact equipment.
The main focus in this thesis is the part of separation which deals with degassing of the oil. Gas bubbles are carried with the liquid stream and high enough retention time must be allowed for, in order to let the gas bubbles migrate up to the gas-liquid interface. Longer retention time implies increased separator volume. Models for calculation of gas bubble velocities will therefore be of importance and are reviewed in later chapters. Heavy oil requires significantly longer retention times, which may make the degassing rate a more vital separator design factor than for light oils. Such models will therefore become very useful in heavy oil applications.
Crude oil is generally classified into light crude oils, medium heavy oil, heavy oil, extra heavy oil and bitumen. Heavy oil is becoming a more important resource as the reservoirs containing light conventional oil is in decline. API density is commonly used to classify the oil, related to the specific gravity of the oil and given by:
141.5API 131.5
SG° = − 1-1
The density is given at 60 ºF (15.6 ºC). When using the term heavy oil this is often applied to a crude oil that has less than 20 ºAPI, while bitumen has less than 10 ºAPI[2]. An API scale, also including viscosity is proposed for classifying petroleum, given in Figure 1-2.
Figure 1-2: Classification of crude oils by density-gravity[2]
From this figure one can see that heavy oil generally have a viscosity above 100 cP. The high viscosity makes it harder both to recover the oil and process it, as the oil is more resistant to flow. Ordinary recovery production methods as used for conventional light oils are not adequate for heavy oils. Typically some form of heating and/or dilution before the oil will flow into a well bore or pipeline. Alternatively can extensive pressure support be provided, something which for instance is done at the Grane field in the North Sea. This is the first heavy-oil development on the Norwegian continental shelf, with oil gravity of 19º API. Imported gas from another field is compressed and injected into the reservoir, providing a far greater recovery compared to using water as pressure support[3].
The heavy oil contains sediments, water, salt and other impurities just as lighter oil, and needs to be removed. The more viscous the oil is, the more difficult this process will be. Very much of the focus in the separation of heavy crude oil has been on removing water. As the oil is becoming denser, the density difference between oil and water is becoming smaller which makes separation more difficult. Separation of the phases is governed by gravity, density difference, viscosity and water droplet diameter and methods to affect these parameters in a
3
beneficial way is crucial to obtain satisfactory separation. These factors will also be vital to the rate of gas separation. The most common ways to improve separation is by making the water droplets coalesce by use of electrostatic fields, introduce centrifugal forces to affect the gravity or heat the mixture. Higher retention time will nevertheless still be necessary. The separation train at the Grane for example, provides a total retention time of 30 minutes which is much more than for a separator train treating light oil[4].
Subsea processing installations can contribute to overcome many of the challenges which arise in future field developments, some being:
• Deepwater fields. • Smaller fields. • Long distance from infrastructure which implies long transport distances. • Pressure drop and enhanced recovery in mature fields. • Weather conditions/arctic environment. • Heavy oil • Environmental aspects.
The processing will mainly be separation of the well stream. This can for instance be removal and disposal of water and solids which has no economical value. Removal of these substances will increase capacity of pipes and the required operating pressure can be reduced.
By also separating oil and gas, a more efficient transport in separate pipelines can be obtained. For example in fields where the well head pressure is too low to drive multiphase flow and additional boosting is required. Very viscous oil, with its high resistance to flow will enhance this problem. Subsea multiphase boosting is a well proven technology, but by separating the phases a more efficient boosting is possible. In order to obtain high pump efficiency as much of the gas as possible should be removed. Monophase pumping is characterized by less than 5 volume % gas remaining in the oil. Reaching this level requires a very good designed degassing process.
As a separator placed subsea is much less accessible, maintenance operations become more difficult and expensive. This requires a safe and reliable design. To be able to design according to these requirements a thorough understanding of the separation dynamics is obviously necessary.
2.1 Introduction
5
2 SEPARATION EQUIPMENT
2.1 Introduction
In a separator the hydrocarbon liquid and gas are mechanically separated from each other. They must be properly designed to ensure a good separation, as this strongly determines the efficiency of downstream processes and quality of the products. A separator is characterized as two-phase if they separate gas and liquid or three-phase if also the liquid phase is separated (oil and water). The focus here is on oil-gas separation and if not otherwise mentioned, separation equipment described in this chapter is two-phase. Generally has oil-water separation seen more focus than degassing and it is therefore briefly mentioned places throughout the thesis as much technology is developed for this purpose.
The more conventional method of separation of oil and gas is by gravity. Time is needed to let the phases approach equilibrium and let the liquid separate out of the gas phase and gas out of the liquid phase by gravity. A process which requires much time implies large separators. It is more and more common to use compact separation methods, mainly by introducing centrifugal forces many times the gravitational force leading to more rapid separation.
The fluid properties and conditions in the separator will greatly affect the separators design and operation. The following factors are of vital importance:
• Flow rates of gas and liquid • Operating and design pressures and temperatures • Physical properties of the fluids • Surging or slugging tendencies of the feed streams • Designed degree of separation • Foaming tendencies of the crude oil • Impurities following the well stream
This chapter will focus on technologies usable for separation of oil and gas in subsea installations. When subsea separation is to be considered special designed technologies for the specific field are most probably required. It will generally be a combination of compact separation technology and proved reliable technology as for instance gravity separation. This chapter will therefore include a description of various separation equipment used topside, and later focus on compact technologies. Examples of how these technologies are used in various subsea separation installations are given. Little is addressed in literature on the different separator and equipments degassing ability. A more extensive evaluation of some of the mentioned equipment here is therefore made in later chapters, based on the review of governing theory and modeling of gravitational separators.
Most of the basic information in this chapter, especially for the section on gravitational separators is found in the books Surface Production Operations[1] and Petroleum and gas field processing[5].
2 Separation equipment
6
2.2 Gravitational separators
Modified versions of gravitational separators in combination with other separation techniques are used subsea and therefore a brief overview of conventional gravity separators is included.
2.2.1 Basic design
Gravity separators are designed as horizontal, vertical spherical and various other special versions based on these. Operating conditions determine which design is most efficient, but other factors such as space and costs are always taken into consideration when choosing design. For a given flow rate are horizontal separators smaller vertical ones. This is due to the natural flow of the phases which oppose each other as gas flows vertically up and liquid flows vertically down in vertical vessels. Additionally is the interface area are larger in horizontal separators which makes it easier for the gas bubbles to reach the vapor space. On the other hand a vertical will occupy less plot space.
Horizontal separators are commonly used for high gas-oil ratios while for lower to intermediate ratios verticals ones are mostly used. A higher gas velocity can namely be allowed in a horizontal separator as liquid droplets in the gas travel both horizontally and downward at the same time, in other words no opposing forces. The greater gas-liquid interface in a horizontal vessel also aids in the release of gas from the liquid to the gas phase. Gas bubbles will experience less hindrance of each other in getting into the gas phase as they are spread over a larger area. The same effect also provides a reduction in foam. For three-phase streams the horizontal configuration is also best suited due to the large interface between the liquids. Vertical separators can handle large slugs of liquid, which is one of the reasons why they are used for low gas-oil rations. They are also better suited for handling streams containing sand and sediments, and are often fitted with a cone bottom to handle the sand.
A separator designed to recover liquids carried over from the gas outlets of the main separators or to catch condensed liquid from cooling or pressure drops are referred to as scrubbers. The liquid loading is much lower than in the main separators and they are typically installed upstream of mechanical equipment that can be damaged from liquids following the stream.
Spherical versions are a special case of a vertical separator, originally designed to take advantage of the best characteristics of both horizontal and vertical designs. It is however difficult to design properly and not widely used. Its greatest advantage is that the shape increases its mechanical strength. This means it can be built with thinner walls than a horizontal and vertical design, hence make it lighter. Therefore, where the separator pressure is very high, the use of a spherical design might be desirable to save a significant amount of weight.
The described separator internals are generally used both horizontal and vertical designs. They will have different purposes depending on which separator section they are installed in. There are four major sections in a gas/liquid separator regardless of shape and size:
Figure 2-1: Horizontal separator schematic showing the four major sections[1]
The inlet diverter does the bulk separation of the oil and gas as a sudden change in momentum of the high velocity fluid entering the separator is occurring due to a sudden change in flow direction and area. The density difference between the phases causes the gas and oil to separate, with oil settling in the bottom of the vessel and gas in the top.
In the liquid collection section the entrained gas in the liquid escapes to the gravity settling section. The separator needs to be designed so that it provides the required retention time to let gas evolve out of the oil and reach equilibrium state. This is where the critical part of the degassing of the oil occurs. Retention time is defined as the volume of liquid divided by the liquid flow rate and therefore directly affected by the amount of liquid the vessel can hold (or how much one wants it to hold) and the rate at which the fluids enter the vessel. The liquid collection section also provides a surge volume to handle intermittent slugs.
Smaller liquid drops entrained in the gas are separated out in the gravity settling section as the gas velocity is reduced substantially. Very fine drops of liquid following the gas stream are removed in the mist extractor. The gas flows through elements which causes it to make several changes in direction which the liquid droplets cannot follow because of their greater mass, thus they fall out.
The separators are equipped with several other internal components and control devices as well such as liquid level controller, pressure control valve, wave breaker, de-foaming plates, vortex breaker, stilling well, sand handling systems etc. They are not discussed in further detail here.
2.2.2 Inlet devices
There are a number of different inlet devices available, with different working mechanisms. The performance of these devices differs from each other, both in efficiency and complexity. The inlet device has large impact on the overall separator efficiency. Good bulk separation of the phases will decrease the separation load on the rest of the separator and hence the separator can be smaller and cheaper. Maldistribution in the inlet device leads to the need for a longer retention time in order to obtain the same degree of separation. In addition, the inlet device should be able to prevent foaming which also improves efficiency and reduce the need for chemicals.
A diverter or baffle plate can be a flat plate, dish, cone, or basically anything that induce a rapid change in flow direction and velocity, causing separation of the two phases. Because the higher-density liquid possesses more energy than the gas at the same velocity it does not change direction as rapidly. The gas will flow around the diverter while the liquid strikes the diverter and falls down in the liquid section of the vessel. The design of such devices is relatively simple, it mainly needs to withstand the forces acting on it, but the geometry can vary according to fluid conditions. It can be used for flows with little gas load and little tendency for foaming. Figure 2-2 shows two examples of diverter plates. The one to the left is for a horizontal separator and one the right in a vertical one. In addition to relatively poor bulk separation, problems of liquids droplets becoming shattered may occur. This creates small droplets which are more difficult to separate.
Figure 2-2: Examples of diverter plates[1]
2.2.2.2 Half pipe
A half pipe inlet is a horizontally oriented cylinder where the bottom half is removed lengthwise, see Figure 2-3. It has a simple design, but sends both gas and liquid downward into the separator and some gas may be entrained in to the liquid. It is mostly used in vertical separators.
Figure 2-3: Halfpipe inlet device in a vertical separator [6]
2.2 Gravitational separators
9
2.2.2.3 Inlet vane
A more complex option is the use of an inlet vane distributor, shown in Figure 2-4 They are used when the gas load is high compared to liquid, therefore this is the most commonly inlet device in scrubbers. This can be used where foaming is predicted and also for streams containing solids. An inlet vane gradually releases the gas and liquid into the separator and distributes the phases at a low pressure drop. The problem with droplet shattering is minimized by use of such a device as agitation is reduced in comparison with the simpler deflectors. It is therefore giving a much more controlled distribution of the phases and stable level control compared to the other devices. They are often custom designed for the specific process they are used in.
Figure 2-4: a: Vane type installed in scrubber[7]. b: Distribution of feed across the vessel cross section[8].
2.2.2.4 Inlet cyclones
The inlet device that very often performs best is the inlet cyclone, but it is also the one with the most complex design. Two examples are shown in Figure 2-5. Centrifugal forces are used to separate- and distribute the gas/liquid stream. Solids can also be handled by an inlet cyclone. The feed stream is brought into rotation by a spin device. The resulting centrifugal forces move the liquid (and solids if present) to the wall of the cyclone where it is drained out at the bottom into the liquid compartment of the separator vessel. The gas exits from the top of the cyclone. The inlet device can consist of either one large cyclone or several smaller ones where the flow is distributed equally to each cyclone.
Figure 2-5: a: Inlet distributor with a number of cyclone tubes[9] b: Inlet distributor consisting of one large cyclone tube[10]
a b
a b
2 Separation equipment
10
Incorrect pressure balancing on the gas and liquid outlets can result in liquid carry over or gas carry under. For the cyclones shown in Figure 2-5 these effects are prevented by blocking arrangements. However, the efficiency of the separator is still affected. The design is sensitive flow rates and low velocities may cause improper operation. Inlet cyclones should therefore be used where flow rates are steady.
Inlet cyclones can provide an efficient method for bulk separation. Problems like shattering and foaming are reduced due to smoothly contoured surfaces and high centrifugal forces.
2.2.2.5 Comparison of inlet devices
Table 2-1: Comparison of inlet devices[11] Function\Device Diverter plate Half pipe Vane type Inlet Cyclone Reduce the feed stream momentum and ensure good gas and liquid distribution
Good/Poor Good/Poor Good Good
Separate bulk liquids
Poor Average Good Good
De-foam Poor Poor Average Good Prevent re-entrainment of already separated liquid and liquid shattering
Average/Poor Average Good Good
Table 2-1 shows a comparison between the different inlet devices where cyclone is ranked to have the best performance. Nowadays the two simplest devices are seldom used as access to vanes and cyclones is high. In a subsea installation the importance of high performance are vital and clearly effort should be made in designing a cyclone that can operate satisfactory in the relevant flow conditions.
The inlet device will have large influence on the separation of gas from the oil in the liquid collection section. It will to a large extent determine the gas volume fraction in the oil and the distribution of gas bubbles. A more thorough examination of the inlet devices with a view on degassing is done in chapter 6.
2.2.3 Mist extractors
The gas drag force cause small liquid particles to follow the gas stream. Mist extractors must therefore somehow intervene the natural balance between gravitational and the drag forces. This can be accomplished by reducing the gas velocity (hence reduce drag), introduce additional forces by use of cyclones or increase gravitational forces by boosting the droplet size (impingement). The selection of mist extractor is based on evaluation of:
• Droplet sizes that must be removed. • Tolerated pressure drop. • Presence of solids and the probability or risk of plugging because of this. • Liquid handling in the separator.
2.2 Gravitational separators
11
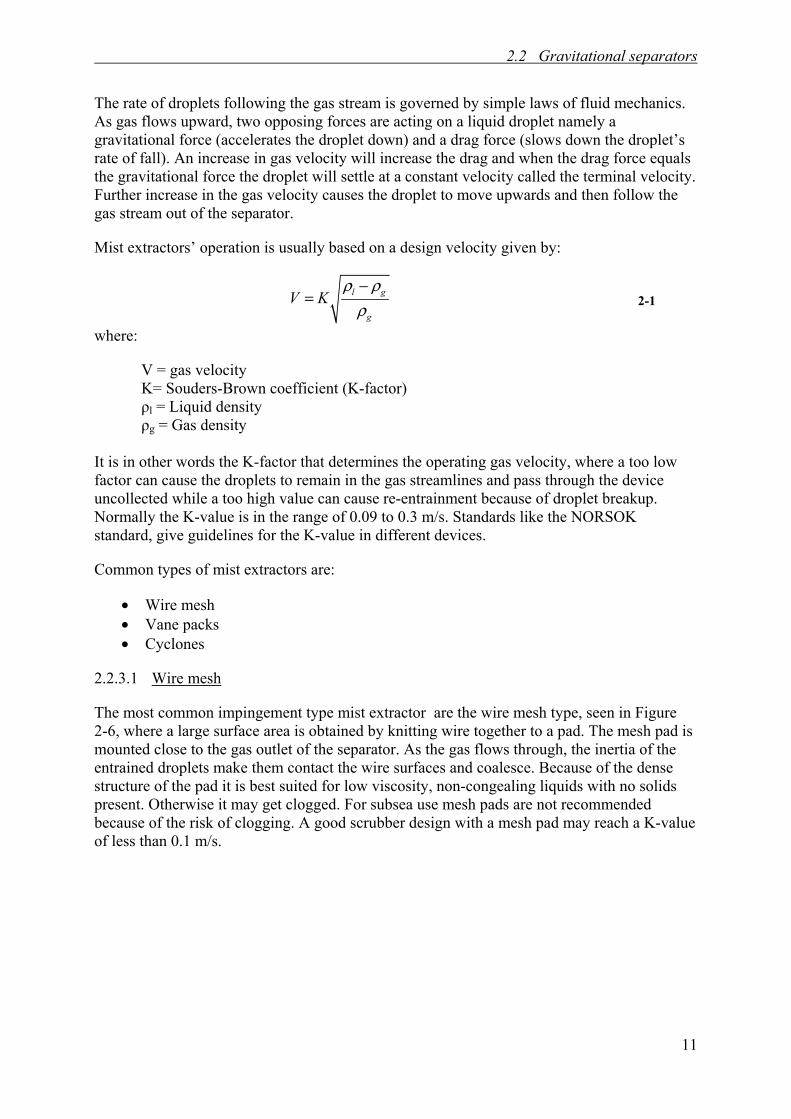
The rate of droplets following the gas stream is governed by simple laws of fluid mechanics. As gas flows upward, two opposing forces are acting on a liquid droplet namely a gravitational force (accelerates the droplet down) and a drag force (slows down the droplet’s rate of fall). An increase in gas velocity will increase the drag and when the drag force equals the gravitational force the droplet will settle at a constant velocity called the terminal velocity. Further increase in the gas velocity causes the droplet to move upwards and then follow the gas stream out of the separator.
Mist extractors’ operation is usually based on a design velocity given by:
l g
g
V Kρ ρ
ρ−
= 2-1
where:
V = gas velocity K= Souders-Brown coefficient (K-factor) ρl = Liquid density ρg = Gas density It is in other words the K-factor that determines the operating gas velocity, where a too low factor can cause the droplets to remain in the gas streamlines and pass through the device uncollected while a too high value can cause re-entrainment because of droplet breakup. Normally the K-value is in the range of 0.09 to 0.3 m/s. Standards like the NORSOK standard, give guidelines for the K-value in different devices.
Common types of mist extractors are:
• Wire mesh • Vane packs • Cyclones
2.2.3.1 Wire mesh
The most common impingement type mist extractor are the wire mesh type, seen in Figure 2-6, where a large surface area is obtained by knitting wire together to a pad. The mesh pad is mounted close to the gas outlet of the separator. As the gas flows through, the inertia of the entrained droplets make them contact the wire surfaces and coalesce. Because of the dense structure of the pad it is best suited for low viscosity, non-congealing liquids with no solids present. Otherwise it may get clogged. For subsea use mesh pads are not recommended because of the risk of clogging. A good scrubber design with a mesh pad may reach a K-value of less than 0.1 m/s.
2 Separation equipment
12
Figure 2-6: Wire mesh mist extractor for vertical separator[12]
2.2.3.2 Vane packs
The types most suitable for subsea use are vane packs and cyclones. The operating principle for a vane pack is that the feed stream passes through parallel vane plates and is forced to change direction several times. The droplets impinge and collect at the surface of the plates and create a liquid film which is drained through slits into a liquid sump and then further to the liquid compartment of the vessel. Figure 2-7 shows a vane pack design by Koch-Otto York for a horizontal gas flow. Here the collected liquid (green arrow) is guided into separate channels which move the liquid away from the gas. Because the liquid is isolated from the gas the chance for re-entrainment of liquid into the gas again is reduced. This is called a double pocket design. Simpler single pocket designs are also common, but here is the liquid drained with the gas flowing by, increasing the chance of re-entrainment of liquid. Hence, gas velocities can be much higher for double pockets.[13].
Figure 2-7: Horizontal gas flow in a vane pack [13]
Vane mist extractors normally remove liquid droplets with a diameter larger than 10 - 40 µm, but with special designs such as the one in Figure 2-7 droplets down to 8 µm can be removed.
For the double pocket design the K-value range is wider than normal; 0.04 to 0.35 m/s. This gives a broader operating area which could be beneficial for subsea if the flow is not steady. A reduced risk of clogging compared to the mesh pad is also beneficial in subsea applications.
2.2 Gravitational separators
13
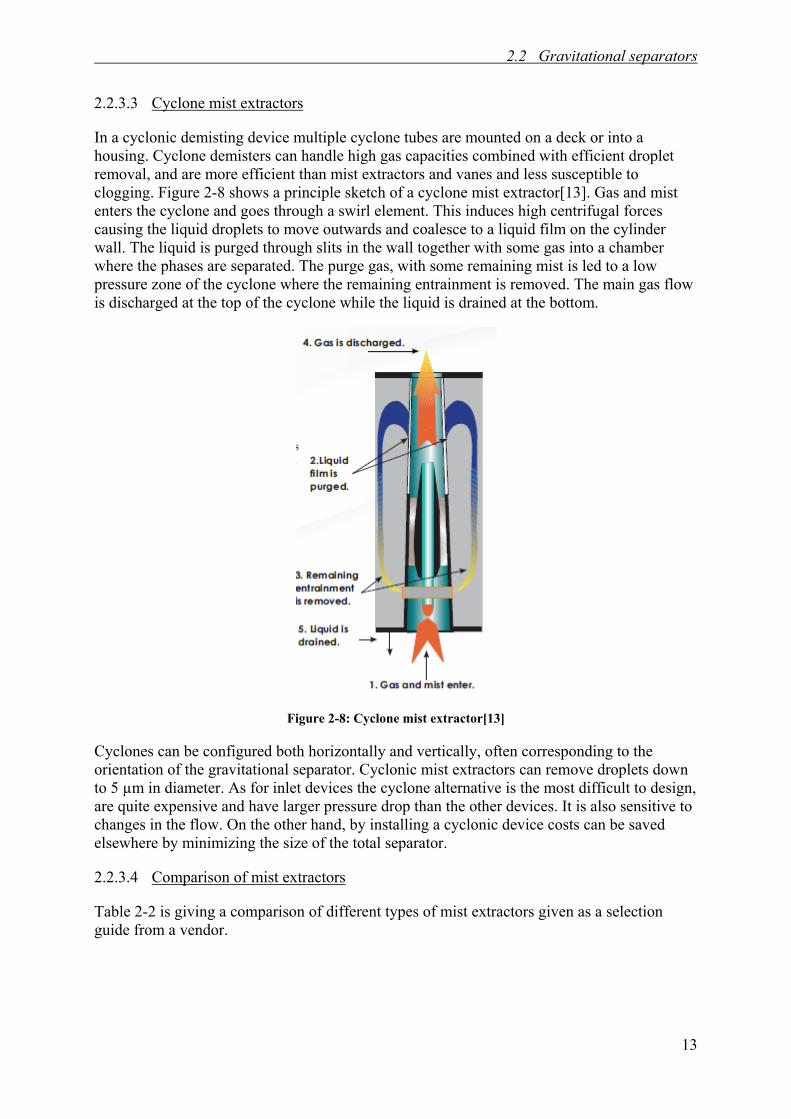
2.2.3.3 Cyclone mist extractors
In a cyclonic demisting device multiple cyclone tubes are mounted on a deck or into a housing. Cyclone demisters can handle high gas capacities combined with efficient droplet removal, and are more efficient than mist extractors and vanes and less susceptible to clogging. Figure 2-8 shows a principle sketch of a cyclone mist extractor[13]. Gas and mist enters the cyclone and goes through a swirl element. This induces high centrifugal forces causing the liquid droplets to move outwards and coalesce to a liquid film on the cylinder wall. The liquid is purged through slits in the wall together with some gas into a chamber where the phases are separated. The purge gas, with some remaining mist is led to a low pressure zone of the cyclone where the remaining entrainment is removed. The main gas flow is discharged at the top of the cyclone while the liquid is drained at the bottom.
Figure 2-8: Cyclone mist extractor[13]
Cyclones can be configured both horizontally and vertically, often corresponding to the orientation of the gravitational separator. Cyclonic mist extractors can remove droplets down to 5 µm in diameter. As for inlet devices the cyclone alternative is the most difficult to design, are quite expensive and have larger pressure drop than the other devices. It is also sensitive to changes in the flow. On the other hand, by installing a cyclonic device costs can be saved elsewhere by minimizing the size of the total separator.
2.2.3.4 Comparison of mist extractors
Table 2-2 is giving a comparison of different types of mist extractors given as a selection guide from a vendor.
2 Separation equipment
14
Table 2-2: Selection guide given by a vendor of mist extractors[13]
Solid Handling 3 1 10 8 Relative scale based on 1 as the lowest. Others are scaled. As seen, the cyclone type has the best overall scores. For subsea application only vane packs or cyclones are of interest, as they have much larger gas and liquid capacities, can handle solids well and remove droplets of satisfactory size. Because of the higher acceleration forces obtained in a cyclonic demister the efficiency of removing droplets are much higher than for vane packs. Extensive testing claims that as the pressure increase (which increases the gas density) this efficiency decrease in vane packs while maintained in cyclones. The limiting factor in terms of maximum capacity for both types is liquid re-entrainment, which limits the maximum gas velocity. In a vane pack the liquid film can be torn off due to shear forces exerted between the gas and liquid. This is reduced in the for the double pack design mentioned in chapter 2.2.3.2. In a cyclonic device this problem is less significant because of the centrifugal forces that keep the liquid film to the wall of the cyclone cylinder[14]. Because of the efficiency and thereby the ability to reduce size and weight in rest of the vessel, a cyclonic mist extractor is the best to use for subsea separation. Mist extractors do not have a direct relevance to degassing. However, if much gas is released from the oil this may influence the conditions in the gas phase. It will therefore be important to know the degassing rate to design the mist extractor properly.
2.3 Compact separators
15
2.3 Compact separators
The fact that gravitational separators are large and heavy vessels combined with the lack of space in offshore installations, has led to a significant increase in research and use of cyclonic devices. In a cyclone centrifugal forces are introduced in addition to the gravitational forces by creating a swirl in the stream. A cyclone consists of an inlet and a cylindrical body where the inlet creates a swirl producing centrifugal forces on the fluids being several times the gravitational forces. Due to density differences the liquid is pushed radially outward and down, while the gas is driven inward and up in the cylinder. Separation will occur much faster; hence the separation equipment can be smaller, reducing both footprint and weight.
The concept of cyclones are beneficial compared to other types of separators as it is simple with no moving parts, compact, low weight and can also lead to reduced costs. The compactness and simple design with few parts makes this technology a good option for subsea use. Much of the research on the field has been done with the intention of reducing weight on offshore platforms, but the focus increasingly turn to the use of such devices subsea. Present subsea separation installations have used cyclones as a part of the technology, although mainly as inlet and/or outlet devices in gravity separators.
2.3.1 Available technologies
There are several designs developed for separating gas and liquid by centrifugal forces. Some are designed for inlet separation of crude oil and others for gas processing applications and dew pointing. Although this main focus in the thesis is on degassing of heavier crudes it is worth mentioning some of the developed technologies for other applications as well, as this gives the best picture of available technology for subsea separation.
2.3.1.1 Gas-Liquid Cylindrical Cyclone (GLCC)
The GLCC is a result of a joint development by Chevron Petroleum Technology and Tulsa University. As shown in Figure 2-9 the GLCC consists of a downwards inclined tangential inlet and a vertical pipe with gas and liquid outlets. This technology has a relatively simple operational principle and is designed as a standalone unit.
Figure 2-9: Principle sketch of a GLCC[15]
2 Separation equipment
16
The tangential inlet causes a swirl which creates high centrifugal and buoyancy forces on the fluids. Combined with gravity, liquid and gas are separated due to density differences with the liquid flowing radially outward and downward and gas driven inward and up in the cylinder. The performance of the separator very much depends on the inlet design as it determines the incoming gas/liquid distribution and the initial tangential velocity. The reason for an inclined inlet versus a horizontal one is that it reduces liquid carry-over in the gas stream as it promotes stratification and hence a pre-separation in the pipe. In addition it prevents liquid from blocking the flow of gas into the upper part of the GLCC. Design of the body will also influence the separation performance. The most important factors here are the location of the inlet which should be adjusted according to the expected liquid level, the length-diameter ratio and the wall taper. Cylindrical walls have shown to better compared to converging or diverging walls in gas/liquid separation[15].
The development of the GLCC and other cyclones was small for a long time because of the inability to predict its performance adequately. Tulsa University and their cooperative partners have on the GLCC done much research in the area to develop reliable prediction tools. Today, GLCC’s are installed in several thousand locations around the world. The operational envelope of a GLCC is limited by liquid carry-over into the gas stream and gas carry-under in the liquid stream. The variety of complex flow patterns that can occur makes it difficult to predict accurate performance, but more extensive use of CFD simulations, which sees continuous improvement, more details of the complex hydrodynamic-flow behavior can be predicted, leading to a more and more widespread use[15].
The GLCC can also be used as an external pre-separation device to enhance performance of already existing gravitational separators, similar to the way cyclones are used as inlet devices. A cyclone in upstream of a gravitational separator which removes the free gas from the stream, and feeding only the liquid into the gravitational separator will reduce the size of the gravitational separator significantly. These methods of using the GLCC are highly relevant for subsea use as it does not complicate the separation process to a large extent, but definitely makes it more compact.
2.3.1.2 Vertical Annular Separation and Pumping system (VASPS)
VASPS is based on a UK patent application from 1988. The system is an integrated separator and pump installed in a constructed dummy well on the sea bottom, as shown in Figure 2-10. A multiphase stream is brought into the device and the gas/liquid mixture is separated in a helical channel and the liquid pumped by an electrical submersible pump (ESP). By installing the system the well pressure can be reduced, allowing a higher production rate[16]. Testing with prototypes on this system has been done in 2001 and 2004, in the Marimba field, offshore Brazil. These fields are at a depth of 350 meters the test results showed good results[17]. The system has operated without failure since 2004, producing 6300 bpd[18].
2.3 Compact separators
17
Figure 2-10: Principle sketch of the VASPS system[18]
2.3.1.3 I-SEP – Dual involute separator
Caltec Ltd has developed a cyclonic device named I-SEP. It consists of a inlet and outlet involute and a separation chamber between the two involutes, as shown in Figure 2-11. The first involute is generating a spin on the flow, to obtain high centrifugal forces. The liquid will gather around the wall while the gas gathers in the centre core. Both phases maintain their spin and tangential velocities through the chamber which continues the separation. The liquid is captured by the involute on the top while the gas leaves the chamber through an axial outlet at the top.
Figure 2-11: General arrangement of an I-SEP[19]
The largest difference compared to other cyclones is how the liquid and gas flows. After generation of spin at the entry in a conventional cyclone the gas moves upwards and exits via the top axial outlet while the liquid spins downwards and exits a bottom outlet maintaining most of its tangential velocity. In the I-SEP both phases spin and move upwards, called uni-
2 Separation equipment
18
axial flow. Caltec claims that this design makes it more robust against variations in operating conditions and able to separate efficiently in many applications. The I-SEP is developed with focus on operating in difficult conditions with the ability to cope with significant fluctuations in flow, something many compact separators do not handle. Performance tests of the I-SEP show that under high levels of flow fluctuations caused by various upstream flow regimes introduced relatively little carry over.
The I-SEP has been used in a number of applications, also for subsea separation. In combination with another Caltec invention, the Wellcom system which lower the wellhead pressure, can production, recovery rate and lifetime on mature fields increase considerably. The unit has a very small footprint, typically more than fifty times smaller than a conventional two-phase gravity separator and also very light. It is also claimed to withstand high pressures, over 700 bars, as it is compact and can be machined out of solid blocks of metal. This, among the other factors mentioned makes it very relevant for subsea use[19].
2.3.1.4 CDS StatoilHydro Deliquidiser and Degasser
The devices called Degasser and Deliquidser are separator systems which can be installed in-line, for instance into the inlet piping of existing separators and increase the efficiency of these by separating out the gas or liquid respectively at an earlier stage. The devices have generally the same diameter as the pipeline, which eases installation and reduce costs. In the deliquidiser the gas-dominated stream flows through a low-pressure drop mixing element which evenly distributes the liquid in the gas-dominated stream. The opposite is occurring in the degasser. The separation principle is also here centrifugal forces with the inlet stream brought into rotation by a stationary swirl causing the liquid to migrate to the wall and the gas to flow in the middle. In the deliquidiser the gas leaves through a smaller pipe within the main pipe. In the degasser it leaves via a pipe in the centre of the cyclone and an anti-swirl element is stopping the rotation of the liquid stream. This is illustrated in Figure 2-5.
The deliquidiser is used for a gas-dominated stream and the degasser for a liquid-dominated stream. CDS claim that the deliquidiser will result in a liquid free gas stream and a 90-99% gas-free liquid. For the degasser the numbers are the opposite. The pressure drop is only 0.2 to 0.7 bar for the deliquidiser and 0.5-2.5 bar for the degasser. The compact and in line design saves space and weight, there is no moving parts or power requirements and reduced need for maintenance. This makes the technology attractive for subsea solutions [20, 21].
The devices have shown successful results for reaching water dew points in gas (deliquidiser) and prevent slug flow when water is expanded by removing the gas (degasser)[20, 21]. If the deliquidiser can provide a gas free stream the volume of a gravitational separator can be reduced substantially by bypassing the gas stream. No literature was found on the possibility to implement such devices in a well stream upstream to a gravitational separator, but removal of gas in an early stage is very beneficial for design of subsequent separators.
Aker Solutions has developed a compact two phase separator which provides cyclonic gas/liquid separation and gas scrubbing in one unit. The application area is gas processing. It is designed both for topside debottlenecking and for subsea environments. Figure 2-13 shows the different parts of the device. Gas and liquid enters through an inlet chamber into the cyclone where the two phases are separated by centrifugal forces. The liquid is drained out at the bottom where a gas blockage is preventing the gas from following the liquid stream. The gas goes to the scrubber section where liquid droplets first are separated out by use of a spinning device. Liquid is drained back to the vessel, while the gas is led to the 2nd stage scrubber for further liquid removal. It is possible to increase the number of scrubber stages to obtain the desired level of separation.
Aker Solutions is listing the following examples for subsea use: Separation of a gas/condensate stream, combined with gas scrubbing for minimum liquid carry over. This will help to prevent hydrate formation and at the same time keeps the separator to minimum dimensions and weight. Gas and condensate can be routed to treatment hub and stabilization hub respectively. It can be installed at gas fields with water pockets. The CCD will separate the water and gas to give minimum water droplets and hence reduce the need for MEG-injection. In case of falling wellhead pressure can the CCD be used to separate the phases before boosting of the liquid[22].
2.3.1.6 Twister supersonic separator
The Twister Supersonic Separator is claimed to be ideal for overcoming several of the problems related to processing gas subsea. Here, condensation and separation is occurring at supersonic velocity created by flow through a Laval nozzle. The main feature of the device is hydrocarbon and water dew pointing of the gas[23].
Figure 2-14: Cross section of a Twister tube [24]
Figure 2-14 shows a cross-section of the Twister tube showing the main principals of the device. The saturated gas is fed into the tube at high pressure. Before the Laval nozzle a concentric swirling motion of up to 500,000g is generated by guide vanes. In the Laval nozzle gas is expanded to supersonic velocity, i.e. the pressure is transformed into kinetic energy and temperature and pressure consequently decreased. This results in a phase transition, a mechanism that not occurs in conventional cyclones. The fast expansion through the nozzle will induce nucleation of vapors, forming clusters which again grow by diffusion and coalescence to become liquid droplets. The high vorticity swirl force the liquid droplets to the wall followed by cyclonic removal[25]. The two streams are slowed down in separate diffusers with recovery of the remaining free pressure.
Separating at supersonic velocities ensures a compact and low weight design and a short retention time. A Twister tube designed for 1 million Sm3/day at 100 bar inlet pressure is approximately 2 meters long. The short retention time implies no time for hydrate formation, which eliminates the need for hydrate inhibition chemicals. It is also a static device with no
2.3 Compact separators
21
rotating parts and all together this means a simple facility with high availability, suitable for unmanned operations[23].
Studies have been performed to investigate the feasibility of the Twister technology for subsea applications. Petrobras is involved in the technology developments to design and test a Twister system for this purpose. Testing of the technology onshore will started up in 2008 and subsea testing will start in 2010. Here the Twister will dehydrate and dewpoint a gas to sales gas specifications. It is expected that a commercial subsea Twister unit will be available in 2014/15[24].
Figure 2-15: Proposition of a Subsea Twister system[23]
Figure 2-15 shows the layout for a subsea separation system using the Twister technology. 6 Twister tubes are installed around an electric heater (hydrate separator). The rest is inlet cooler and separator, seawater cooling pump, control system and piping. The technology is in general exactly the same as for a topside/onshore application.
The main drawback with the Twister technology is the large pressure drop through the tube. In a subsea installation maintaining as high pressure as possible is of significant importance as extra boosting after separation will complicate the whole facility and also make it much more expensive. Another issue with the Twister technology is that the whole production facility should be designed around this system to make it efficient. This may make it difficult to implement it in already existing facilities. A Twister tube also has only ±10% turndown flexibility, it is a fixed flow device with throughout put restricted by the size of the Laval nozzle, making the system difficult to control and adapt to sudden flow fluctuations.
A similar concept is the 3-S separator, developed by a group of Russian specialists participating with TransLang Technologies Ltd. The difference of the two is when the swirl in the stream is induced[26].
Six Twister tubes
2 Separation equipment
22
2.3.1.7 Summary of utilization areas for the technologies
The technologies described in this chapter have differences in application areas and therefore an overview of the main utilization areas for the different compact separation technologies is presented in Table 2-3.
Table 2-3: Application areas for compact separator technologies
Technology Utilization area
GLCC
- Bulk gas-liquid cyclonic separation. - Preferably a feed with liquid-to-gas-ratio greater than 2800 m3 of liquid per
MMscm of gas. - Applications:
• Inlet or wellhead test separators • Two-phase production separators • Flash separators before oil or water treating equipment. • Vessel debottlenecking by removing excess gas from the flow
stream in advance of the problem vessel
VASPS
- Gas-liquid separation/Subsea multiphase boosting system - Subsea phase separation to reduce the bottom-hole pressure required for a given
production rate - Integrated with an ESP for pressure boosting - Attractive for installation in deep waters
I-SEP
- Ultra-compact cyclonic two phase separation - Can withstand pressures exceeding 700 bars. - Applications:
• Primary gas/liquid or gas/oil separation • Knock out of liquids from wet gases • Retrofitting on gas outlets of conventional separators for the
removal of excessive liquid carryover • Upstream of gravity separator to bypass gas, improving the
gravity separators performance • Partial oil-water separation • Sand or solid removal from gas or liquid phase
Deliquidiser and degasser
- Inline separation of continuous stream, requiring minimum of space - Can be tailored for any application - Suitable for both subsea and topside installations
G-SEP CCD
- Compact gas processing suitable for subsea installation - Gas-liquid separation and scrubbing in one unit - Feed stream is a gas-condensate mixture
Twister
-Gas conditioning system -Developed for topside processing. A subsea solution is under testing. -Applications:
• Water dewpointing (dehydration) • Hydrocarbon dewpointing • Natural gas liquids extraction (NGL/LPG) • Bulk H2S removal
2.4 Examples of fields utilizing subsea separation
23
2.4 Examples of fields utilizing subsea separation
There are still not many subsea separation units installed, as the technology is not yet fully developed. Companies tend to go for the more conventional and safe solutions if they can as they do not want to take the economical risk by being the first ones using a certain technology. Tordis was the first commercial full scale subsea separation unit, installed for enhanced recovery. For the Pazflor project offshore of Angola recovery of heavy oil was not possible without a separation and boosting unit. This will become a future trend; subsea separation may only be the feasible solution to be able to transport the oil from reservoir to a topside facility.
2.4.1 Tordis SSBI
At the StatoilHydro operated Tordis field in the North Sea the world’s first commercial full scale subsea separation unit has been installed on a depth of 200 meters. This is mainly a water-oil separation system.
The unit was installed to increase the oil recovery from the Tordis field from 49% to 55%. The field has been in operation since 1994, originally with 9 production wells. Water has been injected to maintain pressure in the reservoir. As the field has matured the water cut has increased and the wellhead pressure decreased, leading to reduced oil production. Increased recovery is obtained by lowering topside arrival pressure by subsea bulk water removal and disposal to a reservoir, reducing wellhead pressure and multiphase boosting of oil and gas. It expected to extend the life of the field with 17 years.
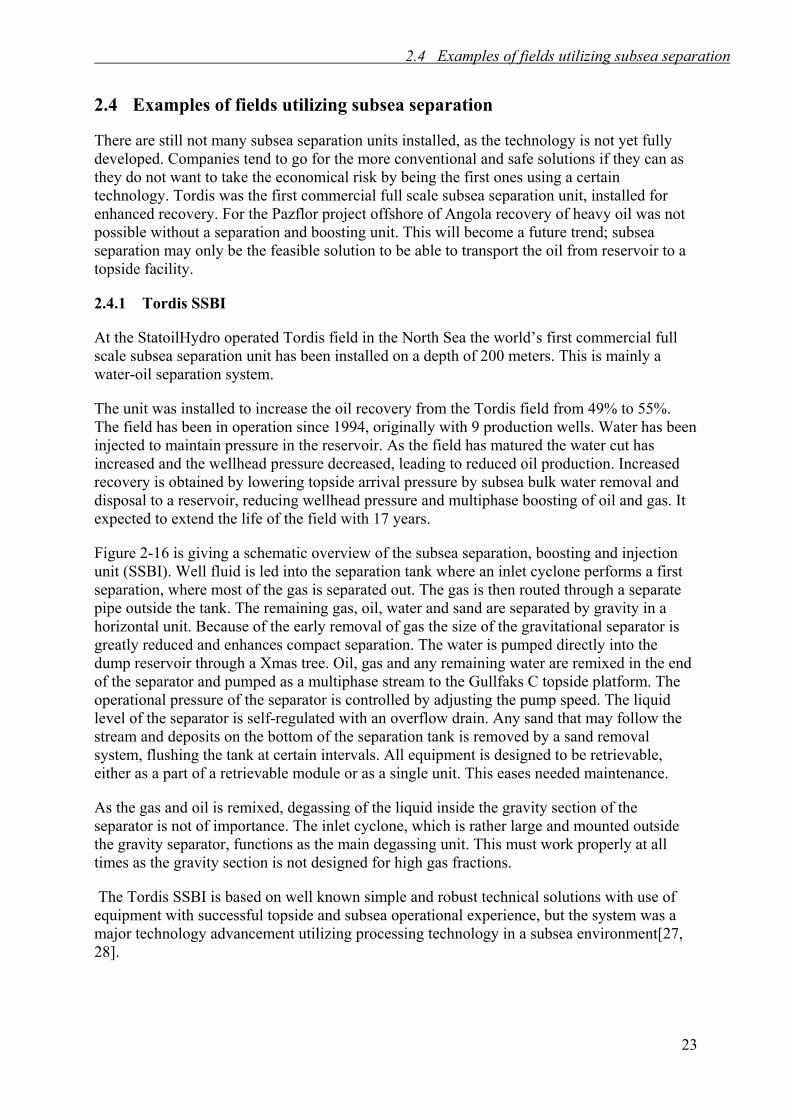
Figure 2-16 is giving a schematic overview of the subsea separation, boosting and injection unit (SSBI). Well fluid is led into the separation tank where an inlet cyclone performs a first separation, where most of the gas is separated out. The gas is then routed through a separate pipe outside the tank. The remaining gas, oil, water and sand are separated by gravity in a horizontal unit. Because of the early removal of gas the size of the gravitational separator is greatly reduced and enhances compact separation. The water is pumped directly into the dump reservoir through a Xmas tree. Oil, gas and any remaining water are remixed in the end of the separator and pumped as a multiphase stream to the Gullfaks C topside platform. The operational pressure of the separator is controlled by adjusting the pump speed. The liquid level of the separator is self-regulated with an overflow drain. Any sand that may follow the stream and deposits on the bottom of the separation tank is removed by a sand removal system, flushing the tank at certain intervals. All equipment is designed to be retrievable, either as a part of a retrievable module or as a single unit. This eases needed maintenance.
As the gas and oil is remixed, degassing of the liquid inside the gravity section of the separator is not of importance. The inlet cyclone, which is rather large and mounted outside the gravity separator, functions as the main degassing unit. This must work properly at all times as the gravity section is not designed for high gas fractions.
The Tordis SSBI is based on well known simple and robust technical solutions with use of equipment with successful topside and subsea operational experience, but the system was a major technology advancement utilizing processing technology in a subsea environment[27, 28].
2 Separation equipment
24
Figure 2-16: Schematic overview of Tordis SSBI[29]
2.4.2 Pazflor
Pazflor is located about 150 km offshore Angola at depths of 600m to 1200 m. It is due to start production in 2011, being the first field in the world where subsea gas/liquid separation is implemented as the basic design for the development scheme. At Pazflor there are two different types of reservoirs with large difference in oil properties. Approximately two thirds of the oil, produced from the Miocene reservoirs is heavy crude (17-22° API) which has a viscosity of 16-64 cp at 60°C, while the rest is lighter crude. These two oils are to be brought up and produced at the same FPSO.
The technical challenge has been how to produce the viscous and heavy oil from the Miocene reservoirs. The pressure in the heavy oil reservoirs is only at 200 bars which is low compared to the pressure in the light oil reservoir of 350 bars. In order to produce the oil from these reservoirs and assure safe fluid flow the solution became installation of three subsea separation units (SSUs) which will consist of a separator for gas/liquid separation and two hybrid pumps for boosting the liquid pressure. By separating the stream subsea, problems with hydrates, foaming and calcium naphthenate formation are eliminated. A gas volume fraction of 15% in the liquids, a threshold tolerated by the hybrid pumps, is obtained. The degassing process will hence become important as it is crucial that the 15% limit is obtained. However, by developing special designed hybrid pumps the limit of 5% for monophase pumping has been eliminated. Unfortunately are published details about the separation technology very limited.
Tests performed with viscous synthetic oil (40-2500 cp) led to the decision of using vertical separators, not because of difference in separator performance, but because of much better sand management capability. The SSUs will be configured to separate 110 000 b/d of oil and 1 MMcm/d of gas. The layout of the SSU is shown in Figure 2-17. FMC technologies was awarded the contract covering the SSUs together with the rest of the subsea production units on the whole field, with CDS engineering responsible for designing and testing of the subsea separator internals[30-32].
2.4 Examples of fields utilizing subsea separation
25
Figure 2-17: The SSU with vertical separator and two hybrid pumps [30]
2.4.3 BC-10
In the Shell operated BC-10 field offshore Brazil are six subsea separation and boosting modules going to be installed. BC-10 consists of six reservoirs with water depths of 1600 to 2000 meters and with varying oil gravity, from 16º API up to 42º API.
The subsea separation modules are separating the two-phase flow. FMC technologies is also here developing the separation units. The technology is based on the vertical annular separator (VASPS). Multiple wells are flowing into one caisson, a 100 meters deep dummy well mentioned in chapter 2.3.1.2, entering at a tangent to establish the centrifugal force which separates the two phases. FMC is calling this separator Vertical Caisson Separator (VCS), shown in Figure 2-18. The liquid (and solids) are driven outwards and falling downward to be gathered in a sump (Caisson Sump, CS). An ESP is inside the caisson pumps the liquid from the sump up to a production host facility. Gas rises naturally through the annulus between ESP tubing and wall of the caisson and also flows to the production host facility[33, 34].
Figure 2-18: Subsea Caisson Separator System [35]
3.1 Single bubble rising under gravity
27
3 BUBBLE DYNAMICS
To be able to predict the rate of separation of gas from a liquid phase, thorough understanding of the dynamics of bubbles is needed. Especially, the bubble velocity must be known in order to do simple calculations on the time it takes for the bubbles to rise to the gas-liquid surface. This chapter is giving a literature overview on bubble dynamics, with focus on correlations for calculating the bubble velocity and an evaluation of which correlation to use in an oil-gas system. The approach is to find the best possible correlations or models available in literature for use in modeling of the degassing process in a separator.
The extent of research on the dynamics of bubbles is very large. It is of vital importance in several chemical processes and very much of the theory and experimental data is developed from research on bubble columns. Most of the research is mainly done on simple systems, mostly air bubbles in water with or without additives. It does not exist any theory and/or correlations developed directly for oil gas systems. Correlations developed for simple systems are generally used on more complex systems as well because this will in most cases give satisfactory results. This is however important to verify by experimental work[36].
3.1 Single bubble rising under gravity
Although the practical application of bubbles motion in oil-gas separation is concerned with bubble swarms, it is necessary to understand the motion of a single bubble. Most of the available literature is based on the rise of single bubbles in stagnant liquid. The real case of bubble swarms and moving liquid may therefore deviate from the theory presented in this chapter.
A bubble will rise in a liquid due to density differences of the liquid and the bubble, which is illustrated in Figure 3-1. As for any particle flowing in a liquid there will be a net drag force, FD, on the bubble in opposite direction of the bubble velocity. The drag force is the sum of two effects occurring. As the bubble flows, the wake immediately downstream of the particle is unstable or in other words turbulent. Because of this the pressure on the downstream of the bubble will not completely recover to that on the upstream side and this causes a form drag. The other effect is the viscous drag which occurs because of velocity gradients that exist near the sphere.
3.1.1 Governing equations
Figure 3-1: Single bubble rising due to density differences under gravity
Upward velocity, ub Fluid, ρf
Drag force, FD
ρ
Buoyant force
3 Bubble Dynamics
28
A spherical bubble in Figure 3-1, with diameter D and density ρ, is rising under gravity in a fluid of density ρf and viscosity μf. An upward momentum balance for this bubble will be:
3 3
DragforceUpward
Momentum incrasebuoyant force
( )6 6f D b
D d Dg F u
dt
π π ρρ ρ − − =
3-1
This balance equates the upward buoyant force minus the weight of the bubble minus the downward drag force to the upward rate of increase of momentum to the bubble. From this equation the velocity of the bubble as a function of time can be calculated.
The common way to represent the relation between drag force and velocity is by using two dimensionless groups – the drag coefficient CD and the Reynolds number Re:
2
/, Re=
12
D PD
F A uDC
u
ρμρ
= 3-2
Ap = πD2/4 is the projected area of the sphere in the direction of motion and ρ and μ are density and viscosity of the surrounding fluid and will therefore affect bubble motion significantly. The momentum balance in equation 3-1 is valid for any particle (solid, drop, bubble) in a fluid. Several correlations are proposed to determine the drag coefficient which has lead to the determination of the “standard drag curve” shown in Figure 3-2. The curve presented here is for solid particles, but, as explained later, it is to a large extent valid for bubbles as well.
Figure 3-2: Drag coefficients of various shapes as a function of Reynolds number (Standard drag curve)[37]
3.1 Single bubble rising under gravity
29
Many empirical and semi-empirical equations have been proposed to approximate the standard drag curve. Turton and Levenspiel found an equation which represents the curve for a sphere quite accurately up to a Reynolds number of about 200 000[38]:
0.6571.09
24 0.413(1 0.173Re )
Re 1 16300 ReDC −= + ++
3-3
At very low Reynolds numbers, CD=24/Re for spherical particles and the drag force becomes:
3DF uDπμ= 3-4
which is known as Stokes’ law[39].
If a spherical particle is settling under gravity in a fluid the velocity will increase until the net weight of the sphere is exactly counterbalanced by the drag force, hence there is no acceleration and the so called terminal velocity is reached. The acceleration period is generally of short duration for very small particles; hence the terminal velocity is essential in calculating the time a particle or bubble use through a liquid. Since du/dt becomes zero, equation 3-1 reduces and can be rearranged to:
3
( ) .6D f
DF g
π ρ ρ= − 3-5
The corresponding drag coefficient is:
2
22
/ 44 = 1 32
4
3
Df
Dt f
f t
ft
D f
DF gD
Cuu
gDu
C
πρ ρ
ρρ
ρ ρρ
−=
−=
3-6
Considering a solid sphere the standard drag curve can be used to determine the drag coefficient for calculating the downward terminal velocity. It was long assumed that light rising solid spheres obey the same law as falling spheres, but Karamanev et al. showed that the terminal velocity and trajectory of a light sphere differ from those of free falling heavy spheres [40, 41]. According to them the standard drag curve is only valid up to a Reynolds number of 135. At Re > 135 CD is constant equal to 0.95, see Figure 3-3 where it is represented by curve ABD (ABC is for falling sphere). A spherical gas bubble will have the same characteristics as a light rising solid spherical particle. Deviations are introduced because of the unstable surface of a gas bubble, which will be explained later.
3 Bubble Dynamics
30
Figure 3-3: The drag curves of free falling (ABC) and rising (ABD) solid spheres [42]
If Stokes’ law is applied the terminal velocity can easily be calculated if fluid properties and diameter is known:
224( )
Re 18D t f
gDC u ρ ρ
μ= → = − 3-7
This can therefore be used as a first approximation if the Reynolds number is low. Calculation of the terminal velocity by implementing the drag coefficient in equation 3-3 requires an iterative procedure or use of a set of new empirical correlations. An example of a method for rapid calculation of the terminal velocity is one developed by Karamanev, based on the Archimedes number[42]:
3 32
2 2
( ) 3Ar Re ( )
4f f f
D f
D g g DC
ρ ρ ρ ρρ ρ
μ μ−
= = = − 3-8
Karamanev is approximating the correlation in equation 3-3 quite accurately by this single equation:
2/31/3
432 0.517(1 0.0470 Ar )
Ar 1 154 ArDC −= + ++
3-9
A
B D
C
0,1
1
10
100
1000
1E-1 1E+0 1E+1 1E+2 1E+3 1E+4 1E+5 1E+6
C D
Re
A
B C
D
3.1 Single bubble rising under gravity
31
3.1.2 Bubble shape
Bubbles (and drops) be deformed and change shape during motion, something which will have large impact on how fast they rise. Bubbles in free rise in infinite media by gravity are generally grouped into categories based on the shape the bubbles take, shown in Figure 3-4 and explained below[43]:
Figure 3-4: Categories of bubbles based on shape
• Spherical: Bubbles are approximated to be spherical when interfacial tension and/or
viscous forces are much more important than inertia forces. • Ellipsoidal: Refer to bubbles which are oblate with a convex interface around the
entire surface, although the actual shape may differ considerably from true ellipsoids. Ellipsoidal bubbles commonly dilate or wobble which makes it difficult to determine exact shape.
• Spherical-cap or ellipsoidal cap: Large bubbles tend to adapt flat or irregular bases with little symmetry and may look similar to cut offs from spheres and ellipsoids, hence the name.
For bubbles rising freely in infinite media a graphical correlation is developed by Grace et al. [44, 45] in terms of the Eötvös number, Eö; Morton number, M; and Reynolds number, Re:
2
4
2 3
Eö
M
Re
e
e
g d
g
d u
ρσ
μ ρρ σρ
μ
Δ=
Δ=
=
3-10
The Reynolds number represents the non-dimensional terminal velocity and the ratio of inertia to viscous drag force, the Eötvös number represents the ratio of buoyancy to surface tension and the Morton number represents the property group of the two phases. The equivalent diameter is the diameter of a spherical bubble of volume V, i.e. Ὠ 6ὠ/“ / . Grace conducted a dimensional analysis and clarified that the Reynolds number is a function of Eö and M, and could from this develop their relation graphically.
The graphical correlation is shown in Figure 3-5 and is covering a large range of fluid properties and bubble sizes, and since it is only the Reynolds number that depends on the terminal velocity, this plot can actually also be used to determine the terminal velocity, but accurate results are not possible to obtain. The boundaries between the regions are somewhat
d aba
b
Spherical EllipsoidalSphercial cap/ Ellipsoidal cap
3 Bubble Dynamics
32
arbitrary, but Figure 3-5 gives in a good overview over bubble behavior corresponding to fluid properties and velocities.
Figure 3-5: Shape regimes of bubbles and drops in unhindered gravitational motion through liquids [43].
3.1.3 Influence of contaminants
The rising velocity of a bubble is also affected by the degree of contamination on the gas-liquid interface. This may be difficult to determine, but as an example can air-water systems where the water has been water distilled several times be considered as pure (not contaminated at all), while tap water can be considered as contaminated. Because of the mixture of hydrocarbons and impurities existing in an oil reservoir is it reasonable to assume that the liquid can be characterized as contaminated. In the case of a pure liquid, internal circulation is induced in the bubble, which decrease drag and hence increases terminal velocity. Impurities will accumulate on the bubble interface in a contaminated system. This causes the interface to behave as it were a rigid surface, i.e. it acts like a solid particle. As a result of this, correlations for solid particles correspond well for bubbles in contaminated liquids. Figure 3-6 shows the difference in velocity for air bubbles in contaminated and pure water. Effects of both increased velocity and dependence of diameter differ between pure and contaminated liquids. The velocity will always increase with increased bubble size in contaminated liquids, compared to the velocity in pure liquids which actually can decrease with increasing bubble diameter in some regions.
3.1 Single bubble rising under gravity
33
Figure 3-6: Typical trends in rise velocity for air bubbles in contaminated and pure water[43].
3.1.4 Correlations for drag coefficient and/or terminal velocity
Several correlations for determining the drag coefficient and terminal velocity for a rising gas bubble are proposed in literature. In general these correlations differ significantly from each other when operating in different shape regions. Clift et al. [43] gives a detailed overview and explanation of several correlations. Most of them are reviewed in Appendix A and summarized in Table 3-1. Additionally are correlations claimed to be valid over a range of shape regions included.
The purpose is to present them for later comparisons in order to determine their capability to calculate degassing of oil. The aim is to find one single correlation or set of correlations which is valid for all shapes and sizes. This will make it possible to develop a simple model for separation.
The correlations listed in Appendix A are summarized in the below table:
Table 3-1: Correlations for calculating bubble terminal velocity
Range Shape Correlation (CD/ut): Comments/
assumptions/ limitations
Reference
Re < 0.01 Sphere 224
( ) Re 18D t f
gDC u ρ ρ
μ= → = −
Valid for “solid” bubbles
Stoke
Re < 0.01 Sphere 8 2 3
Re 1DCκ
κ+ = +
Neglected inertia term.
No surface-active
contaminants.
Hadamard and
Rybczynski
3 Bubble Dynamics
34
Re < 0.01 Sphere 24 3
1 ReRe 16DC = +
Oseen correction of
Hadamard and Rybczynski
Oseen
Re > 2,
κ → 0 Sphere 0.7814.9 ReDC −= Haas et al.
4 < Re < 100
Sphere 2
0.743.05(783 2142 1080)Re
(60 29 )(4 3 )DCκ κ
κ κ−+ +=
+ +
Hamielec et al.
M < 10-3, Eö < 40, Re > 0.1
Ellipsoidal
0.757
0.441
0.94 (2 59.3)
and
3.42 ( 59.3),
J H H
J H H
= < ≤
= >
where
0.14
0.149
0.149
4,
3
Re 0.857
w
H EoM
J M
μμ
−−
=
= +
0.149 ( 0.857)te
u M Jd
μρ
−= −
Grace et al.
Re > 150, Eö > 40
Deformed (spherical/ellipsoidal
cap)
0.711t eu gd= Davies and
Taylor
M > 102 All Re
Deformed (spherical/ellipsoidal
cap)
8 (2 3 ) 8
Re (1 ) 3DCκ
κ+= ++
Darton and Harrison
0.61mm < R < 7.62
mm All See Table A- 1(Appendix A)
Peebles and Garber
3.1 Single bubble rising under gravity
35
All All
1/31/ 6
2 /3 1/3
840.3
6e e
tD h h D
d dg Vu V
C d d Cπ= =
2/31/3
432 0.517(1 0.0470 Ar )
Ar 1 154 ArDC −= + ++
when Ar < 13000, else:
CD = 0.95
e
h
d
dis defined by equations A- 17 to A- 19
Internal bubble recirculation has no effect on the
velocity of bubble rise.
Drag coefficient of the bubble
can be calculated on the basis of its real geometric characteristics
Contaminated liquid
Karamanev et al.
All All
2
0D
aC f
R
=
1/ 3
1/3
3/ 2
1/ 6 3/ 2
48 1 12
Re 1 36
+ 0.91.4(1 30 )
Mf
M
Eo
M Eo
+=+
+ +
2 1/ 6
1/ 60
10(1 1.3 ) 3.1
10(1 1.3 )
a M EoDEF
R M Eo
+ += ≈ + +
Bozzano and Dente
As seen in the table, no correlations for the region of 0.01 < Re < 2 is listed (expect for the region independent ones), as this was not found specifically for gas bubbles in literature. On the other hand, the three first correlations are widely used for Re < 2, for instance is the suggested value for the terminal velocity of Peebles and Garber Stokes’ law for Re < 2.
3.1.5 Comparison of some the correlations
The different correlations for calculating terminal velocity at variable diameters are compared. The aim is to determine differences between them and evaluate their mutual suitability for use in a degassing model. This is done by investigating the resulting plots of terminal velocity for some of the correlations.
As air in silicone oil is used in later experiments and this is similar to a gas oil environment, properties for these fluids are used in comparison of the correlations. The silicone oil varies mainly in viscosity while the other properties are roughly constant, as seen in Table 3-2.
3 Bubble Dynamics
36
Table 3-2: Properties of silicone oils and air used in comparison of correlations[46].
The different correlations are plotted for some of the silicone oils listed in Table 3-2. In most cases iterative methods has been used to solve the correlations. The terminal velocity is plotted as a function of equivalent bubble diameter or in some cases Reynolds number. The equivalent diameter varies from 0.01 mm to 40 mm.
3.1.5.1 All correlations for all bubble sizes
The correlations are first of all compared, neglecting their valid region. The large scatter obtained illustrates that they in most cases are highly invalid outside the stated region.
Figure 3-7: Terminal velocities with all correlations. Silicone oil AK10
0
50
100
150
200
250
300
350
400
450
500
0 5 10 15 20 25 30 35 40
Term
inal
vel
ocity
[cm
/s]
Bubble diameter (equivalent) [mm]
Stokes'Hadamard and Rybc.OseenHaas et al.Hamielec et alGrace et alDavies and TaylorKaramanevBozzano and DentePeebles and Garber
3.1 Single bubble rising under gravity
37
Figure 3-8: Terminal velocities with all correlations. Silicone oil AK350
The curves illustrate the importance of knowing the region one is operating in. The common assumption that Stokes’ law is valid can therefore give highly inaccurate results. The differences between correlations are smaller for more viscous liquids mostly due to less increase in Reynolds number to increase in bubble diameter.
3.1.5.2 Low Reynolds number
The diameters of gas bubbles in oil is often very small, hence the correlations for small Reynolds number flows are of importance. The terminal velocities are here plotted as a function of Reynolds number. Comparison of Stokes’ law, Oseen and Hadamard and Rybczynski is shown in Figure 3-9 for low Reynolds number and in Figure 3-10 for very low Reynolds number.
Figure 3-9: Terminal velocities with various correlations at low Reynolds numbers for various liquid viscosities.
0
50
100
150
200
250
300
350
400
450
500
0 5 10 15 20 25 30 35 40
Term
inal
vel
ocity
[cm
/s]
Bubble diameter (equivalent) [mm]
Stokes'Hadamard and Rybc.OseenHaas et al.Hamielec et alGrace et alDavies and TaylorKaramanevBozzano and DentePeebles and Garber
0
2
4
6
8
10
12
14
0 1 2 3
Term
inal
vel
ocity
[cm
/s]
Reynolds number
Stokes - AK20
Hadamard & Rybczynski - AK20
Oseen - AK20
Stoke - AK100
Hadamard & Rybczynski - AK100
Oseen - AK 100
Stoke - AK350
Hadamard & Rybczynski - AK350
Oseen - AK350
3 Bubble Dynamics
38
Figure 3-10: Silicone oil AK100 in very low Reynolds number region
The three correlations are resulting in curves with the same shapes for all three viscosities. Hadamard and Rybcczynski always give the highest velocity and Oseen the lowest as expected from the correlations. As the viscosity increase the difference in velocity between the correlations also increase. In more viscous fluids the bubble diameter is bigger at the same Reynolds number as in less viscous fluids. As the bubble size increase the shape deviate more from spherical something these correlations not account for. In their valid region (Re < 0.01), Hadamard and Rybcczynski gives a bit higher velocity than the two others. Results from Stokes’ and Oseen are roughly the same in this region.
The reason why with Hadamard and Rybcczynski is giving the highest value is because it is valid for pure liquids, while Stokes and Oseen is for contaminated liquids. When choosing which correlation to use for modeling a gas oil separation it is reasonable to use the most conservative one in terms of the corresponding retention time necessary to degas the oil to specified level. This will be to use the Oseen correlation. This is probably also more correct than Stokes as it includes terms which Stoke neglected. From this it is already clear that one should be careful with the widespread assumption that Stokes’ correlation is valid.
3.1.5.3 Region independent correlations
The correlations by Peebles and Garber, Karamanev and Bozzano and Dente are valid over the whole range of size and shapes of the bubbles. They are useful for the modeling of separation due to the elimination of determining shape and Reynolds number before calculation of the velocity. The correlations are plotted against equivalent diameter up to 40 mm in the figures 3-11, 3-12 and 3-13 on the next page. These are later compared with several of the region specific correlations to see how well they adapt.
0,0001
0,001
0,01
0,1
1
1E-05 0,0001 0,001 0,01 0,1
Term
inal
vel
ocity
[cm
/s]
Reynolds number
Hadamard and Rybc.
Stokes'
Oseen
3.1 Single bubble rising under gravity
39
Figure 3-11: Terminal velocities using region independent correlations. Silicone oil AK20
Figure 3-12: Terminal velocities using region independent correlations. Silicone oil AK100
Figure 3-13: Terminal velocities using region independent correlations. Silicone oil AK350
0
5
10
15
20
25
30
35
40
45
50
0 5 10 15 20 25 30 35 40
Term
inal
vel
ocity
[cm
/s]
Bubble diameter (equivalent) [mm]
KaramanevBozzano and DentePeebles & Garber
0
5
10
15
20
25
30
35
40
45
50
0 5 10 15 20 25 30 35 40
Term
inal
vel
ocity
[cm
/s]
Bubble diameter (equivalent) [mm]
KaramanevBozzano and Dente
0
5
10
15
20
25
30
35
40
45
0 5 10 15 20 25 30 35 40
Term
inal
vel
ocity
[cm
/s]
Bubble diameter (equivalent) [mm]
KaramanevBozzano and Dente
3 Bubble Dynamics
40
The correlation of Peebles and Garber are omitted from the two last plots. The range of applicability listed in Table A- 1 is namely impossible to satisfy as 4.02G1
-0.214 > 3.10G1-0.25
when the viscosity is high. Looking at Figure 3-11, all three correlations are roughly consistent up to a bubble diameter of 2 mm, before they spread. The correlation of Peebles and Garber is not at all consistent with the two other correlations at larger diameters. The assumption that the velocity is independent of size above a certain Reynolds number, which Peebles and Garber do, is not consistent with any of the other correlations reviewed. The limited valid range of diameter is a third reason to exclude this from use in a separator model.
Comparing the two other correlations they give roughly the same velocities and follows a similar pattern, but a shift in which is giving the highest velocity is occurring as the viscosity increase. For less viscous oils Bozzano and Dente is giving slightly higher velocity at the smallest gas bubbles, but opposite for larger bubbles. As the viscosity increase this shift is occurring at larger bubble diameters.
Bozzano and Dente is giving a smoother curve than Karamanev as this has no specified shift in drag coefficient at Reynolds and Eötvös number as Karamanev has. The shift to the constants of CD=0.95 and de/dh=0.62 are clearly noticeable in Figure 3-11 and Figure 3-12 and the results this correlation gives around these shifts is discussable. As the viscosity increase the shift to CD=0.95 is not occurring before the bubbles are very large.
All three correlations are partly based on experiments and the validity of them for silicone oils or similar are not determined in any literature
3.1.5.4 Region independent correlations compared to specified region correlations
The region independent correlations are to a large extent built upon the correlations valid for each region, but the shift between them and how well they correspond to each other for the particular liquids dealt with here should be investigated. The large variation in fluid properties will in terms of Re, Eö and M lead to variations in when bubbles change shape. The region independent correlations may detect exactly where these changes occur.
The validity of region specified correlations are often difficult to determine in terms of shape. In literature their exact boundaries are often not given (only shape) and determining the region from Figure 3-5 will give inaccurate results.
It is possible to examine the differences between the region independent correlations and the regional correlations where they are definitely valid in terms of the bubble shape and Reynolds number they are proposed for. This is shown in figures 3-14 to 3-18.
3.1 Single bubble rising under gravity
41
Figure 3-14: Oseen vs. Karamanev and Bozzano and Dente with AK20 (left) and AK350 (right)
For low Reynolds number flows the region independent correlations are compared with the correlation of Oseen et al in Figure 3-14. Karamanev is giving basically the same results as Oseen in this region while Bozzano and Dente deviates a little. The result is in accordance with assumptions for Karamanev’s correlation of the bubble behaving as a rigid sphere in this region, the same as the Oseen correlation is based on. Very little is written on which basis Bozzano and Dente developed their correlation, but as it gives a higher velocity than Karamanev and Oseen (expect for the lowest Reynolds numbers), it may be developed to satisfy Stokes’ law in this region.
Figure 3-15: Haas vs. Karamanev and Bozzano and Dente with AK10 (left) and AK20 (right)
0
0,5
1
1,5
2
2,5
0 0,5 1
Term
inal
vel
ocity
[cm
/s]
Bubble diameter (equivalent) [mm]
0
1
2
3
4
5
6
0 2 4 6
Term
inal
vel
ocity
[cm
/s]
Bubble diameter (equivalent) [mm]
KaramanevBozzano and DenteOseen
0
1
2
3
4
5
6
7
8
9
10
0,65 0,85 1,05 1,25
Term
inal
vel
ocity
[cm
/s]
Bubble diameter (equivalent) [mm]
0
1
2
3
4
5
6
7
8
9
10
1 1,2 1,4 1,6 1,8
Term
inal
vel
ocity
[cm
/s]
Bubble diameter (equivalent) [mm]
KaramanevBozzano and DenteHaas
3 Bubble Dynamics
42
Figure 3-16: Hamielec vs. Karamanev and Bozzano and Dente with AK10 (left) and AK20 (right)
The correlations of Haas et al. and Hamielec et al., compared with the region independent correlations in Figure 3-15, are only valid for small ranges of bubble diameters when using them for silicone oil. Only the least viscous ones can fulfill the range they are valid for. However, in all cases they both predict about 2 cm/s higher velocity than the region independent correlations. A transition from Oseen to Haas would cause a rapid increase in velocity and a transition from Haas to Hamielec would be smoother. This is because they are valid for different degrees of contamination. The higher velocity is a result from the fact that the correlations of Haas and Hamielec are valid only for pure liquids. The slope of the curves are fairly similar, a little steeper for the region specified correlations which again support the contamination theory as this is in accordance with Figure 3-6 in this region. The correlations of Haas et al. and Hamielec et al. are not suitable for use in modeling of an oil/gas system due to their restriction of only pure liquids and limited validity in terms of bubble size.
Figure 3-17: Grace vs. Karamanev and Bozzano and Dente with AK10 (left) and AK20 (right)
Grace et al. are also only applicable for the less viscous silicone oils in order to be inside the stated range of Eö, M and Re, but can be used at a wider range of equivalent bubble diameters. Both region independent correlations seem to capture the sudden change in velocity predicted by Grace. They velocity are however increasing using the two region
0
1
2
3
4
5
6
7
8
9
10
0,85 1,05 1,25
Term
inal
vel
ocity
[cm
/s]
Bubble diameter (equivalent) [mm]
0
1
2
3
4
5
6
7
8
9
10
1,4 1,6 1,8 2
Term
inal
vel
ocity
[cm
/s]
Bubble diameter (equivalent) [mm]
KaramanevBozzano and DenteHamielec
0
5
10
15
20
25
1,2 3,2 5,2 7,2 9,2
Term
inal
vel
ocity
[cm
/s]
Bubble diameter (equivalent) [mm]
0
5
10
15
20
25
1,2 6,2
Term
inal
vel
ocity
[cm
/s]
Bubble diameter (equivalent) [mm]
KaramanevBozzano and DenteGrace
3.1 Single bubble rising under gravity
43
independent correlations while the results from Grace is a decrease after this point. This indicates again that the region independent correlations are for contaminated systems while Grace is not.
Figure 3-18: Davies & Taylor vs. Karamanev and Bozzano and Dente with AK20 (left) and AK100 (right)
The region independent correlations are compared with the correlation of Davies and Taylor in the spherical cap region. The correlation of Davies and Taylor states that the velocity in this region is only dependent on the equivalent bubble diameter. The same thing seems to occur for the region independent correlations in this region.
3.1.6 Summary and conclusion
The description and comparison of correlations will not lead to a final conclusion of which is most adequate for modeling the degassing process. This can only be verified by experiments under the right conditions. Factors like range of validity and applicability for contaminated liquids are nevertheless found to be important in determining their mutual usability in a separator model.
The correlations developed for specified regions are only valid inside their set limits and when used outside they can give totally wrong answers. In various literatures, simple correlations are used without concerning their validity, especially Stokes’ law. From the comparisons it is clear that the range where it is acceptable to use Stokes’ law is very limited.
Another factor which distinguishes correlations from each other is if they are valid for pure or contaminated liquids. Pure liquid correlations predict higher velocities than the correlations for contaminated fluids. None of the correlations provides the possibility of specifying the degree of contamination, which is a limiting factor. It is assumed that contaminated liquids are fully contaminated and pure liquids are not contaminated at all. However, liquids may have a degree of contamination in between these two outer limits.
There is a lack of correlations for some regions, especially for 10-3<M<102, which covers many of the silicone oils investigated here. The only ones which claim to be valid are the region independent ones, i.e. Karamanev and Bozzano and Dente. These can be used for modeling of a flow where bubble diameters vary over a wide range. Final conclusion must be based on experimental data, but they give reasonable results and correspond well for many of the region specified correlations. As these clearly are developed for contaminated liquids they
0
5
10
15
20
25
30
35
40
45
50
36 37 38 39 40
Term
inal
vel
ocity
[cm
/s]
Bubble diameter (equivalent) [mm]
0
5
10
15
20
25
30
35
40
45
50
36 37 38 39 40Te
rmin
al v
eloc
ity [c
m/s
]Bubble diameter (equivalent) [mm]
KaramanevBozzano and DenteDavies and Taylor
3 Bubble Dynamics
44
are also valid for use on oils. Experiments done in conjunction with the development of the correlation of Karamanev et al. has been done on fluids with M<10-2 (but otherwise with similar properties as for the silicone oil and air). Bozzano and Dente has used some higher Morton numbers fluids, with satisfactory results and they claim that this demonstrate the models ability to predict bubble motion in high viscosity liquids.
It seems like the region independent correlations are able to predict bubble velocities reasonably well over a large range of bubble sizes compared to the region specified correlations. They predict velocities mainly equal to or lower than the other correlations. It is important that that the predicted velocity for degassing is not higher than the real case. Whether or not the correlations satisfy this must be verified by experiments, but the results makes the region independent correlations equally safe to use for modeling degassing as any of the other reviewed correlations. Because of the possibility of simple implementation, one of these should be used when developing a model. It is chosen to proceed with the correlation by Karamanev. This is easiest to implement in a model and there is more literature stating the development of this correlation than for Bozzano and Dente. The correlation of Karamanev is compared with some experimental results and used in a model developed for gravitational separators.
3.2 Bubble swarms
45
3.2 Bubble swarms
Bubbles in a separator exist together with many others and creates a swarm, occupying a fraction of volume in the liquid. The behavior of a swarm of bubbles is modified from the behavior of a single bubble. There is still an analogy in the way to determine the drag coefficients, but it is also affected by the fraction of gas in the liquid. Therefore the theory about single bubbles and correlations presented in chapter 3.1 is important to understand before considering a swarm of bubbles.
3.2.1 Suggested correlations
There is significantly less literature concerning swarms of bubbles compared to literature concerning single bubbles. Some region specified correlations are suggested in literature, mainly for spherical bubbles, but generally simple correlations are used in practice.
For bubbles of spherical shape in swarms at very low Reynolds numbers Gal-Or and Walso [47] presented the following analytical expression for the drag coefficient:
1/3
16
Re(1 )DCϕ
=−
3-11
Here, φ is the average gas hold up. As φ→0 the expression reduces the Hadamard and Rybczynski correlation (equation A- 1). The deviation from the single bubble expression is the amount of gas in the liquid.
For higher Reynolds numbers Marucci [48] developed the folloeing expression for the drag coefficient:
5/3
2
48 1
Re (1 )DCϕϕ
−=−
3-12
Again, by letting φ→0 the expression becomes the drag coefficient for a single bubble suggested by Levich, given in equation A- 6.
Based on these expressions Manjunath et al. [49] developed an expression to serve as a bridge between the two previous ones.
1/3
0.32 0.32 0.6 0.4 0.90 0.50
16 (1 )
Re (1 )
0.3037 Re 0.0380 Re 0.0039 Re
DoD
CC K
K
ϕ
ϕ ϕ ϕ
= +−
= − + +
3-13
CDo is the drag coefficient for a single bubble. Manjunath et al. reports this to be:
1/2 1/2161 0.1058Re 0.0449 Re ln Re 0.0158Re
ReDoC = + + − 3-14
This expression is claimed to give reasonable values in the range: 10-3 ≤ Re ≤ 100 and 8•10-6 ≤ φ ≤ 0.6.
3.2 Bubble swarms
47
B
Gu
Aε= 3-16
Where G is the gas volume flow, A is the cross sectional area of the tube and ε the gas fraction (volume of gas per unit volume of tube). This will be the average velocity of the gas.
In case b, the configuration of bubbles is the same, but now rising in a finite swarm relative to a stagnant liquid above them. In this case the bubbles are travelling at a velocity u0. The differences of the two cases are:
- There will be no liquid flow across AA´ in case a - In case b there must be a net downwards flow of liquid across AA´ to cancel the
upward flow of gas
A liquid velocity superimposed on the two systems will bring the bubbles to a rest. These velocities must be uB and u0 on system a and b respectively. This is illustrated in Figure 3-20.
Figure 3-20: Liquid velocity superimposed on the two systems
Because the two configurations are identical and the bubble velocity is zero, the downwards flow of liquid must be equal in both cases, each of them being:
0
(1 )a B
b
L u A
L u A
ε= −= 3-17
As they are equal, the following equation is established:
0
00
(1 )
(1 )
B
B
u A u A
u G Gu u
A A
ε
ε ε
= −
→ = = = +−
3-18
This velocity will also naturally be equal to the relative velocity between the two phases as the liquid is stagnant. If there is a flow of liquid in addition to the bubble flow, the above theory is extended to:
A A
Bubbles at rest.Liquid velocity = uB
a b
Superimposed liquid flow = La
Superimposed liquid flow = Lb
Bubbles at rest.Liquid velocity = u0
3 Bubble Dynamics
48
0
G G Lu
A A Aε= + + 3-19
And the relative velocity of the two phases is still given by:
0
(1 )R
uu
ε=
− 3-20
The expressions states consequently that although there is no average flow of liquid in a system like the one in a, buoyancy is not the only factor contributing to the motion of the bubbles.
This approach gives the exact opposite result as the theory of hindrance effect of neighboring bubbles.
3.2.3 Bubble swarms in separators
The theoretical approaches listed in the previous pages are not directly applicable for a gravity separator, because for those cases the gas is bubbled through liquid, in contrast to separation where the gas is continuously following the liquid stream. In that respect separation may be more similar to case b in Figure 3-19. The two approaches do anyway both represent effects which may occur in a gravity separator. Which effect that hast the largest influence should be verified by experiments. It is likely to believe that this depends on the fluid properties.
3.3 Bubble coalescence and break-up
It can be seen from previous correlations that the diameter of the bubbles is of vital importance. In systems where a number of bubbles appear simultaneously the phenomena of coalescence and break-up may occur. Two or more bubbles can collide and form one single larger bubble (coalescence) or single bubble can be tore apart into two or more smaller bubbles. Coalescence is favorable in separation because this enhances the velocity and consequently leads to faster separation. Break-up must be avoided as it takes more time to separate out smaller bubbles.
There is extensive literature on this field as it is applied also for liquid droplets and is occurring in a number of chemical processes. Much of this theory is quite advanced, especially where the aim is to predict bubble size and distribution in a system. Here complex numerical systems are required. Modeling of coalescence and break-up rates is based on knowledge of breakup frequencies, bubble size distributions of broke up bubbles and probabilities of coalescence and breakup[53]. It is often difficult to establish initial and boundary conditions as well[54]. The phenomena are still not completely understood and several theories and models are suggested. There is not room for going into detail in existing models, but a simple explanation of the mechanisms is presented below.
3.3.1 Coalescence
Coalescence of two bubbles occurs in three steps as illustrated in Figure 3-21. First the bubbles collide, trapping a small amount of liquid between them. Enough contact time must be provided for the liquid film between the bubbles to be drained to a critical rupture thickness. The last step is the rupture of the film, causing the two smaller bubbles to form a
3.3 Bubble coalescence and break-up
49
larger one.
Figure 3-21: The three steps occurring in coalescence: Collision, liquid film drainage, rupture. This creates one large bubble.
The rate of coalescence is consequently connected to these three steps. Collisions can occur due to a variety of mechanisms. Usually this is due to turbulence, buoyancy and laminar shear. If the liquid flow is turbulent the motion of bubbles are random and might collide with each other as illustrated in Figure 3-22. The collision frequency due to turbulence will be dependent on bubble size, concentration and the turbulent fluctuating velocity of the bubble. The turbulent eddies must also be of a certain size, as to small eddies does not affect the bubble motion while to large will only transport groups of bubbles without affecting their relative motion. An analysis of the turbulence in the liquid is required to predict collision due to this mechanism.
Figure 3-22: Collision and coalescence of bubbles due to turbulent eddies
Collision due to buoyancy is simply the fact that larger bubbles rise faster than smaller bubbles and hence they can collide if the large bubble catches up with the smaller one, as illustrated in Figure 3-23. The collision frequency due to this mechanism will depend on size, concentration and bubble velocities.
d d D
Liquid film Critcal rupture thickness
Turbulent eddies
Random motion of bubbles
Bubbles collide
Coalesced bubbles
3 Bubble Dynamics
50
Figure 3-23: Collision and coalescence of bubbles due to buoyancy
The last mechanism is due to laminar shear in the liquid phase. This is mainly concerning bubble columns, where the gas rates may be very high. Collisions occur as a result of the development of a gross circulation pattern as at high gas flow rates the bubbles begin to rise in the center of the column giving a net upward velocity in the center of the column and down flow in the outer region[55].
For gravity separator the two first mechanisms are those of relevance. Turbulent flow of liquid might occur after the inlet device in the separator causing bubbles to collide. In the liquid settling section the buoyancy-driven collisions will be the only natural mechanism which can lead to collision as the flow is laminar.
Whether or not collisions lead to coalescence depends on the time (tC) it takes for the liquid film trapped between the bubbles to drain. The interaction time (ti) between the bubbles must exceed the drainage time. The ratio tc/ti is often used as an indication of whether coalescence will occur or not.
The two times are of order[56]:
1/23 21
,2 2liq liq
i C
R R Vt t
ρ ρσ σ
3-21
assuming ρgas/ρliq=0 and bubbles of equal size with radius R. V is the relative velocity of the colliding bubbles and σ is liquid surface tension.
The rupture of the film occurs when the film is thin enough. In thin films additional intermolecular forces arise which affects the drainage of the film. For pure fluids this is only van der Waals forces. These forces destabilize the film and eventually it ruptures. The rupture time is negligible compared to film drainage time[56].
It is found that the interaction between bubbles depends in large extent on the viscosity of the liquid. The higher the viscosity, the easier the bubbles interact, hence an increased rate of coalescence[57].
t = t0 t > t0
u2 > u1
u1
3.3 Bubble coalescence and break-up
51
The total surface area of the new bubble will be less than the total of the two it is made up from. A quick geometrical analysis shows that two equal sized bubbles of diameter d will coalesce to a bubble with diameter D with the ratio:
33 3
1 2 2 1.263 6
d D DV V D d
d
π π + = = → = → =
3-22
3.3.2 Break-up
Bubble breakup is generally assumed to be a result of a destabilizing force that acts on the bubble. This has to be larger than the surface tension force that tends to oppose bubble deformations. These forces are mainly a result of collisions between bubbles and turbulent eddies in the liquid or gravity. A collision with eddies as shown in Figure 3-24 requires eddies of a size equally or marginally smaller than the bubble. Larger eddies will only transport the bubble away while smaller ones does not contain enough energy to affect breakage. The rate of bubble break-up will depend on the rate of collisions between bubbles and eddies of the appropriate size.
Figure 3-24: Break-up if bubble due to collision with turbulent eddy
Analogous to collisions of bubbles for coalescence the collision rate is dependent on concentration, size and velocity of both bubble and eddy. Only a portion of the collisions are likely to result in breakup. The disruptive forces of eddies are balanced by surface tension forces. The balance is generally expressed in terms of the dimensionless Weber number:
2b l
e
u dW
ρσ
= 3-23
A critical Weber number will exist at the point where cohesive and disruptive forces balance each other; hence there is a maximum stable bubble size (diameter). Breakup is therefore governed by the density of the surrounding fluid. Expressions are determined to find maximum bubble size, hence critical Weber number and from this a critical eddy velocity[55]. It has been determined that bubble break up decrease when the liquid viscosity increase, but this is seems to be due to the absence of liquid turbulence not the viscosity itself[58].
The other force which can destabilize a bubble is the gravity force. This mainly concerns large bubbles (spherical cap bubbles). The influence of gravity force on the bubbles upper interface can lead to so-called Taylor instabilities which lead to an indentation here. As time advances the indentation grows deeper and splitting occurs if the disturbance grows sufficiently quickly. This is illustrated in Figure 3-25.
Turbulent eddy
3 Bubble Dynamics
52
Figure 3-25: Bubble break up as gravity causes growing indentation on the upper surface
A maximum stable bubble diameter is in the form:
,maxbd Cg
σρ
=Δ
3-24
As seen, the stable bubble size is dependent on surface tension and density of the liquid (and gas) phase and not viscosity. However, experiments show an influence of liquid viscosity on bubble stability. This is due to a damping effect the viscosity will have on the Taylor instabilities[43, 59].
3.3.3 Bubble coalescence and break-up in gravity separation
Bubble size is as stated several times an important factor for bubble velocity and hence separation time. Therefore are coalescence and break-up important phenomena to be aware of. In a gravity separator for gas and oil coalescence and break-up may occur at two places: After the inlet device, where the stream might be very turbulent and in the liquid collection section. In both coalescence and break-up, turbulence is one of the contributing mechanisms. As there is difficult to control this turbulence in order to get coalescence which is favorable, turbulence should be reduced to a minimum. In the liquid collection section where the gas bubbles are removed from the liquid, coalescence because of buoyancy might occur. Break-up here is only occurring due to the Taylor-instabilities and therefore only the largest of the bubbles will break-up. As it is the smallest bubbles that are of most concern, potential break-up of these large bubbles are not of vital importance, provided the resulting bubbles of break-up are not smaller than the already smallest bubbles.
The effect of viscosity was mentioned and in general will an increase in liquid viscosity result in less break-up and more coalescence, hence in this matter increase viscosity will be a positive factor in separation [57, 58].
Something that can lead to both coalescence and breakup in separators which is not yet mentioned is the fact that bubbles can impinge on separator internals and hence get shattered or it can lead to collision between gas bubbles. For water droplet coalescence are sections installed with the purpose to make the water droplets coalesce by helping them collide. If a separator internal is installed which in a rather controlled manner induce coalescence of bubbles, a better separation rate can be obtained.
Small indentation Growing indentation Split
4.1 Experimental setup
53
4 EXPERIMENTAL WORK
For predicting behavior in oil-gas separators testing on systems similar to them is a necessity. This implies for instance measurements of gas bubbles in a liquid environment with similar characteristics as a real crude oil system. Measuring bubble velocities and looking at how they behave can prove the validity of the theory presented in the previous chapter, which to a large extent is developed based on controlled bubble columns with limited variations in liquid properties.
Experiments have been performed by StatoilHydro at their research center in Trondheim. They were originally conducted for measuring the rate of mixing of gas in oil and not for the purpose of measuring bubble behavior and velocities. However, the separation process of the gas-liquid mix was filmed, where bubble motion in the oil clearly can be seen and consequently it was possible to do some qualitative observations. The writer received the results and films of the experiment for further analysis, but did not participate in the actual experiments.
4.1 Experimental setup
Silicone oil was mixed with air to simulate an oil-gas environment. Pumps, simulating a reservoir, controlled the flow rate of each fluid which was mixed in a choke before flowing down into a vertical tube, acting as a vertical separator. Figure 4-1 shows the layout of the test rig. The following parameters were varied for each experiment:
• Pressures in pumps • Pressure drop over choke • Gas volume fraction (GVF) in liquid • Viscosity of liquid
Figure 4-1: Layout of the test rig
Reservoir
Gas Liquid Choke
Separator
Gas outlet
Controls separator pressure and gas expansion
4 Experimental work
54
Figure 4-2: Picture of the separator
The amount of gas separated out from the oil was estimated by measuring the difference in liquid height in the separator, which naturally will decrease as the oil is degassed. This result will then be a measure on how much gas that has been entrained in the oil during expansion over the choke.
As seen in Figure 4-2, the silicone oil is transparent and the gas bubbles can be spotted in the liquid. By looking at the films of the separation process, the motions of the bubbles were observed and by use of the ruler mounted on the outside of the separator it was possible to measure the velocity of the gas bubbles for some cases.
4.2 Test parameters
In the test two silicone oils were used as liquids and air as gas, with properties shown in Table 4-1:
Table 4-1: Properties of fluids used in the experiments
Name Kinematic
viscosity, ν [cSt] Dynamic
viscosity, μ [cP]Density (at
25C) [kg/m3] Surface tension (at
25C) [N/m]
AK50 50 48 960 0.0208 AK350 350 340 968 0.0211
Air 0.015 0.018 1.2 -
The gas volume fractions in the liquid are listed in Table 4-2. This is at separator conditions (separator pressure).
4.3 Test results
55
Table 4-2: Gas volume fractions used in the experiments
GVF 0,95 0,50 0,20 0,05
The pressures in reservoir and separator, pressure drop over the choke and gas expansion (preservoir/pseprator) are shown in Table 4-3: Table 4-3: Pressure variations and gas expansion in experiments
Reservoir pressure [bara]
Separator pressure [bara]
Pressure drop choke [bar]
Gas expansion
11 1 10 11 5 1 4 5 2 1 1 2
100 50 50 2 60 50 10 1,2
4.3 Test results
The results from the experiments are divided into two separate parts. The first is the original experiment of measuring gas mixed into oil. The second is observations on bubble dynamics in the separator.
4.3.1 Measuring gas mixed into oil
The amount of gas mixed into the oil is of interest as this has a direct influence on the separation process. A short summary of these findings is included. Figures 4-3, 4-4 and 4-5 show plots of the results obtained by varying the parameters listed in tables 4-1, 4-2 and 4-3.
4 Experimental work
56
Figure 4-3: The amount of gas mixed into the oil for different viscosities, GVF and reservoir pressure
Figure 4-4: Effect of gas expansion across choke for AK50 (PR=Reservoir pressure [bara], dP=Pressure drop over choke [bar])
Figure 4-5: Effect of gas expansion across choke for AK350 (PR=Reservoir pressure [bara], dP=Pressure drop over choke [bar])
From these plots the following trends can be stated:
• Reservoir pressure does not seem to have influence on the amount of gas mixed into the oil.
• More gas is mixed into the oil when it is more viscous. • Small gas expansion (1.2) gives no or little gas mixed into the liquid for both
viscosities. • A GVF of 0.2 seems to be most affected by increased expansion in terms of increased
amount of gas mixed into the liquid. A GVF of 0.2 shows a maximum amount of gas mixed into the liquid (with AK350, reservoir pressure = 5 bara, pressure drop over choke = 4 bar).
4.3.2 Observing bubble dynamics
4.3.2.1 Terminal velocity measurement
Films from some of the tests were used to examine the bubble dynamics, in order to determine the validity of the theory presented in chapter 3. It was of interest to measure bubble velocities with all parameters varied and especially to see the difference for the two viscosities. Unfortunately, the bubbles generated in the AK50 oil were too small to be able to measure their sizes, and measurement of velocity versus bubble diameter could only be performed in cases where AK350 was used. Also, it was easiest to follow bubbles when the GVF was 0.05, as fewer bubbles were present.
As there is no continuous gas-liquid flow into the separator the amount of bubbles will be reduced as a function of time. As stated in chapter 3.2, the velocity of the bubbles is dependent on the gas hold-up. It is therefore important to know whether velocity measurements are performed when many or few bubbles are present. In the case where velocities are measured the amount of bubbles is simply divided into “Much”, “Some”, “Little”, “Almost single” and “Single”. “Much” will be about the initial fraction of gas and
gradually decreasing the amount to the end of separation where the remaining bubbles cannot influence each other, hence “single”. To illustrate this division, a screenshot of each case is shown in Figure 4-6.
Figure 4-6: Screenshots from films illustrating the differences in amount of bubbles
These pictures also show how bubbles are spotted and size measured by using the ruler on the outside of the separator. The bubbles are small and sizes are measured only from a computer screen. The velocities are determined by approximately measuring the time the bubble use to travel a certain distance. A large inaccuracy in measurements exists, but by taking enough samples a general trend is possible to develop.
The plot in Figure 4-7 was obtained by taking about 100 samples of bubbles of various sizes in the test with following properties:
• Liquid: AK350 • GVF: 0.05 • Reservoir pressure: 3 bara • Separator pressure: 1 bara • Pressure drop over choke: 2 bar • Gas expansion: 2
”Much” ”Some” ”Little”
”Almost single” ”Single”
4.3 Test results
59
Figure 4-7: Measured bubble velocities in AK350 liquid
As seen from the plot, only bubble diameters up to about 3 mm were present which limits the ability to compare correlations with experimental data over a large range. In such viscous liquids, the bubbles up to this size are almost entirely spherical, which is both stated in theory and observed in these experiments.
The correlation by Karamanev (without any adjustment for gas fraction) is plotted together with the measured velocities and they both are showing the same trend in increase with increasing diameter. For bubbles appearing almost alone, their measured velocity seems to coincide with results the Karamanev correlation is giving. No conclusions can be based on this limited amount of test results, but it may seem that the correlation is giving satisfactory results in this region, and that the degree of contamination assumed seems to be reasonable for this system.
What is surprising versus the theory of bubble swarms is that the velocity is significantly higher for the same bubble diameters when more bubbles present, up to 100% higher for those appearing when there are “much” bubbles, compared to when they are almost single. This is contrary to the theoretical statement that the bubble velocity decreases linearly with increased gas fraction because of the hindrance effect, but on the same time it cannot be fully explained by the opposite effect from superficial velocity (see chapter 3.2.2). The initial gas fraction (for the mixed liquid) in this case is only about 0.022; hence from this theory one can only expect a velocity of only a few percent higher when “much” bubbles are present.
4.3.2.2 General observations on bubble dynamics
It was of interest to see differences in bubble dynamics for the two different viscosities. Observations were performed for several cases, with parameters varied as listed in chapter 4.2. Table 4-4 lists the main differences observed for the two liquid viscosities.
0
0,2
0,4
0,6
0,8
1
1,2
1,4
1,6
1,8
2
0 0,5 1 1,5 2 2,5 3
Velo
city
[cm
/s]
Diameter [mm]
Much
Some
little
Almost single and single
Karamanev
4 Experimental work
60
Table 4-4: Observations on bubble dynamics in separator
AK50 AK350
Bubble size Very small bubbles, of diameter about 0.5 mm and smaller, except for a few larger ones initially.
A range of sizes from very small (<0.5 mm) up to 3 mm in diameter. The large ones mostly appear initially, but also sporadically during the whole separation time
Bubble velocity For bubbles of equal size, they clearly move faster than in the more viscous oil.
For bubbles of equal size, they clearly move slower than in the less viscous oil
Hindrance effect No clear visible hindrance between bubbles
For gas fraction in mixed fluid>0.04, many bubbles clearly deviate from a straight upwards line because they are hindered by other bubbles.
Coalescence Not observed Not observed
Break-up Not observed Not observed
Unexpected behavior Sporadic cases of smaller bubbles travelling faster than larger bubbles
Some bubbles (of various sizes) seem to stand still.
Cases of smaller bubbles travelling faster than larger bubbles.
Sporadic cases of large bubbles moving very slow
Separation time More or less constant rate of separation throughout the separation time. Reach complete gas free liquid much faster than in the more viscous liquid.
Fast separation initially because of the large bubbles present, but it takes very long time to separate out the last small bubbles.
Bubble size: A possible explanation to the difference of bubble size for the two liquids is that more gas is mixed into the oil for AK350; hence generally more bubbles appear, also increasing the number of large bubbles. However, by comparing cases from the point where the gas fraction for the mixed liquids are about the same for both viscosities, it still seems that there are some larger gas bubbles in AK350. With basis in the theory of coalescence and break-up this can be contributing factors to this phenomenon. As stated in chapter 3.3, coalescence is occurring more rapid in viscous liquids and the opposite for break-up. Neither coalescence nor break-up is observed in these experiments, but only the top half of the
4.3 Test results
61
separator is visible on the film, so these effects might occur in the bottom half of the separator. On the other hand it is unlikely that coalescence and break-up, if present at all, are the only contributing effects. It is probable that the amount of larger bubbles generated in the more viscous liquid is higher. On the same time are small bubbles generated. These are equally small as those in the less viscous liquid generated, but consequently the amount of these must be less.
Bubble velocity: Bubbles of equal size are generally travelling faster in the less viscous liquid, as expected from correlations predicting terminal velocity
Hindrance effect: Clearly, large bubbles are hindering each other in moving upwards, forcing them to travel in directions deviating from a straight upwards line. Naturally this must occur when a bubble catch up with another without coalescing. When large bubbles are present it is difficult to observe how the smaller bubbles are affected, but when less large bubbles are present it seems that some of the small bubbles are hindered in the more viscous liquid, while this is not occurring at all in the less viscous liquid. This observation could though be due to the difficulty in spotting effects in the faster travelling bubbles in the less viscous liquid. It is probable that some hindrance is occurring here as well.
Unexpected behavior: In both liquids was it occasionally observed that smaller bubbles were moving faster than larger. This was observed more often for the more viscous liquid. This may be due to large bubbles being affected more by hindrance. Another explanation may be that some bubbles are moving close to the wall of the separator, causing friction effects, reducing the velocity of the bubble. This effect is not accounted for in the previous chapter, but the effect will obviously be present in a separator, although only for a small part of the bubbles. Bubbles observed to stand still may be somehow attached to the wall. A third cause of the observations may also be an optical illusion, as it is impossible to determine depth in the picture, meaning bubbles which really are larger may look like they are smaller because of their distance from the camera.
It will be natural that the liquid, which principally is stagnant, will flow slowly because of the movement of bubbles. From the films it is very difficult to determine to which extent this is occurring. This may however be another contributing effect to unexpected bubble motion.
These factors can also partly explain why there are measured fairly different velocities for same bubble diameters as seen in Figure 4-7.
Separation time: As expected will it take much more time to separate out the gas in the viscous liquid. It was observed that the time to reach a state where almost all bubbles where separated out from a gas fraction in the mixture of about 0.02 was about three times higher in AK350 than in AK50. The separator pressure was in this case 1 bara. The separation rate was higher the first two minutes or so, because of the larger amount of large bubbles in the more viscous liquid. After this does the remaining small bubbles use very long time to reach the surface.
4.3.2.3 Summary and conclusion
The observations generally lead to a conclusion that high viscosity liquids lead to a slower, more complex and unpredictable separation of the gas. This have a large impact on the retention time required to reach desired level of separation and because of the unpredictability one may have to be quite conservative in design parameters. The only advantage seems to be
4 Experimental work
62
the higher amount of large bubbles present. This may however not be the case in a unit separating a well stream where the mixing of gas into liquid is not occurring in the same controlled manner. Distribution of bubble sizes must be anyway be determined for each and every system. Generally, tests should be performed on well fluids to be able to predict behavior of the particular fluid composition.
The use of Karamanev’s correlation for predicting terminal velocities seems to give reasonable results for single bubbles in the small bubble diameter region. The velocity is clearly affected by the gas fraction present in the liquid, giving significant higher velocities for higher fractions than predicted by theory. As this is occurring in a highly viscous liquid, the viscosity might also influence the effect of gas fraction. To determine whether the correlation is valid for a larger range of bubbles and further investigate the gas fraction’s influence on velocity more thorough testing is required. Of large interest is how the influence from gas fractions varies with viscosity in the liquid.
Based on the results here and in chapter 3 are Karamanev’s correlation used for a simple model of gravitational separators in chapter 5.
5.1 Existing models
63
5 CALCULATION MODELS
To be able to predict the separation rate, calculation models must be provided. Such models may be based on governing theory, experimental data and empirical correlations. As degassing has been less critical to design of a separator few detailed models exists. It has been an area of less research as other factors like oil-water separation and removing liquid droplets from gas has been more important. Sufficient time for gas to separate from the liquid has generally been satisfied anyway, at least for light oils. Degassing is however becoming more important as the efficiency of other parts in the process, for instance pumps, are dependent on the gas fraction in the oil. As exact knowledge of the gas fraction in the oil is becoming more important, better models are required. A model predicting the amount of original gas volume which still is in the oil at the liquid outlet of the separator is therefore developed. The model is based on theory described in chapter 3.
5.1 Existing models
There is little literature addressing gas separation from crude oil[60], due to less significance on the design. More effort has been put into determining oil-water separation and removal of liquid droplets from the gas phase. In many cases gas separation has been estimated by very simple assumptions. In Surface Production Operations[1], a frequently cited book, detailed procedures for sizing both two- and three phase separators are presented without any consideration of the degassing part.
In the API specification for oil and gas separators[61] the equations listed for vessel design is based on the velocity of oil droplets in the gas. Regarding gas in liquid, it is only stated that enough time and sufficient interface area should be provided, and lists the following table for recommended/typical liquid retention time:
Table 5-1: API recommended liquid retention time[61]
Oil Gravitites Mintutes Above 35º API 1
20 - 30º API 1 to 2 10 - 20º API 2 to 4
In the NORSOK standard P-100 for process design[62], the only equation given in order to size the separator is the typical maximum gas velocity for a horizontal separator, which also is based on the liquid droplets ability to separate out of the gas phase. For liquid retention time it is recommended that it should be verified by testing on actual fluid at operating conditions as it is highly dependent on the fluid properties.
For viscous systems is it difficult to calculate the exact effect of separation, even with good models, because there are so many unknown factors such as coalescence, emulsions, bubble diameters, solids (sand, asphaltenes) and flow conditions. Design of separators for these systems are often based on experience and empirical data together with thorough testing of the relevant crude[63].
Degassing of oil is in other words commonly based on very simple assumptions or experimental results for the relevant case. Some companies claim to have developed “in-
5 Calculation models
64
house” models which they use for calculations, but these are confidential and therefore not possible to examine here.
5.2 Developed models for gravitational separators
Models predicting the remaining gas in oil are developed for horizontal and vertical gravitational separators. The net velocities of the bubbles form the basis for the calculations. This is the result of the calculated terminal velocity for the bubble and the liquid velocity. By estimating which bubbles that reach the liquid surface one can, based on an assumed inlet bubble size distribution, calculate how much of the gas that does get separated.
The following assumptions have been made to simplify the case (referring to Figure 5-1):
• The separators are modeled as cylinders without any internals. • Only oil and gas are present. • Only liquid phase (liquid collection section) is modeled • The inlet and outlet are assumed to be cross sections of the cylinder • The velocity profile of the liquid is a plug flow (constant across the cross section of
the cylinder), from inlet to outlet. • No coalescence or break up of bubbles. • No wall effects • Relation between bubble size and terminal velocity is calculated from Karamanev’s
correlation without correction for gas fraction present. • Vertical terminal bubble velocity is not affected by liquid velocity
Figure 5-1: Simplified gravitational separators
This result in a very simple separator compared to what will be reality, but it will nevertheless give an impression of the effects of change in liquid properties, especially viscosity, and other design factors. Results can give an idea of which parameters that have to be changed to improve separation.
The model is implemented in Matlab, providing an easy implementation and interface for the model. The different elements of the model are presented below, while the structure of the
InletPlug flow, QL
Outlet
InletPlug flow, QL
Outlet
5.2 Developed models for gravitational separators
65
complete model is included in Appendix C, together with a more thorough description of performed calculations.
5.2.1 Bubble size distribution
In order to estimate the volume of the gas in the oil, the size of bubbles present has to be determined. The model lets the user to choose between two options:
1. Define the percentage share of bubbles in size intervals 2. Let the program generate an appropriate probability distribution
If user defined size distribution is chosen, the percent of bubbles with a diameter in the interval 0-0.5 mm, 0.5-1.0 mm and so on, has to be specified.
The probability distribution is generated as a Rayleigh distribution, which gives a reasonable representation of variations in bubble sizes. The shape of this distribution is determined by the mode, which is the size that occurs most frequently. This parameter can be adjusted to give the desired distribution.
A cumulative size and volume distribution is generated for both options. The cumulative volume distribution is plotted with bubble diameter on the abscissa axis. The distributions are shown in Figure 5-5 on page 68. The model will calculate the required diameter a bubble must have to become separated. The cumulative volume distribution is then used to determine the separated gas volume based on this diameter.
The distribution does not say anything about the total gas volume that actually is in the oil, only how the volume is distributed on the different bubble diameters. Results therefore only represent the share of the initial gas volume that gets separated.
5.2.2 Horizontal separator
A horizontal separator is here modeled as a partly filled cylinder with flowing oil containing gas bubbles of various sizes. Figure 5-2 shows the separator with the governing geometrical parameters and presents the path of a bubble which just reaches the liquid surface. This path is determined by the net velocity of the bubble. With the horizontal velocity set by the liquid flow, bubbles need to have a certain vertical velocity to reach the surface. Velocity depends on bubble size and bubbles with too small diameter will not become separated.
The geometrical relations given in Figure 5-2 are determined by:
2 20.5 sin(2 )
(1 cos( ))cA R R
H R
θ θθ
= −= −
5-1
The separator length and radius are user defined inputs. These parameters are related to the
liquid flow rate and retention time.
5 Calculation models
66
Figure 5-2: Horizontal separator with liquid radius R, length L, liquid height, H and cross sectional area Ac. A bubble’s horizontal and vertical velocity is shown.
As the bubbles are scattered over the cross sectional area, Ac, bubbles located closer to the liquid surface do not have to be of the same size as those further down to get separated. This is accounted for by dividing the liquid height into n number of segments as shown in Figure 5-3. The longest path a bubble from the bottom of each segment has to travel is then estimated. The vertical velocity and corresponding bubble diameter for this path is calculated. From the cumulative volume distribution is the share of the initial volume this diameter represents determined. The results from each segment are multiplied with their respective fraction of the liquid volume and added together. The final result will be the share of the initial gas volume fraction that gets separated.
Figure 5-3: Section views of separator, with longest bubble path from each segment.
θn
L
H
Hn
θ
vhvv
L
H
Ac
R
5 Calculation models
68
separator where the bubble size distribution is given by the Rayleigh probability distribution. The effect of varying the following properties is investigated:
• Liquid viscosity • The mode in the probability distribution • Density of bubbles in each segment
The other selected input values remained constant during the runs. These are:
- Separator length = 12 m - Separator radius = 1.5 m - Retention time = 100 s - Liquid flow rate = 0.4 m3/s
By keeping these values constant, the liquid height in the separator will also remain constant (=1.43 meters).
5.3.1 Liquid viscosity
The model was run with different silicone oils, giving a variation in viscosity from 10 cP to 970 cP. The bubble size distribution was generated with a mode of 2.3 mm (diameter) and equal density of bubbles each segment. The resulting initial bubble distribution id as show in Figure 5-5:
Figure 5-5: Initial bubble distribution
The effect of varying liquid viscosity is shown by plotting the viscosity to the percent of the initial gas volume fraction left in the liquid after separation, as shown in Figure 5-6.
5.3 Model runs
69
Figure 5-6: Effectiveness of certain horizontal separator with varying liquid viscosity
The amount of un-separated gas is increasing almost exponentially up to a viscosity of about 500 cP where it seems to become more linear. High liquid viscosity requires a different design in order to obtain the same degassing rate as for light oils. For example, in order to obtain the same separation rate for viscosity of 500 cP as 200 cP, the length and radius of the separator must be increased with 125%, keeping the L/R ratio and other properties constant.
The reason why viscosity is the only liquid property that is investigated is because this will be the decisive factor affecting the velocity of bubbles when comparing light and heavy oils. This is explained in more detail in Appendix A.
5.3.2 Bubble size distribution
By varying the mode parameter in the Rayleigh distribution is it possible to investigate the effect of the size of bubbles present in the liquid. The mode was varied from 0.2 to 5 mm (diameter) and the effect of this was checked for three viscosities. The resulting initial bubble distribution for three modes (1mm, 2mm and 3 mm) is shown in Figure 5-7.
Figure 5-7: Bubble size distributions generated from a Rayleigh probability distribution with different modes
0,00
5,00
10,00
15,00
20,00
25,00
30,00
35,00
0,00 200,00 400,00 600,00 800,00 1000,00
% o
f ini
tal G
VF a
fter
sep
arat
ion
Viscosity [cP]
Mode = 1 mm Mode = 2 mm Mode = 3 mm
5 Calculation models
70
Effect from varying the bubble distribution is shown in Figure 5-8 where the percent of the initial gas volume fraction left in the liquid after separation is plotted as a function of the mode.
Figure 5-8: Effectiveness of certain horizontal separator with varying bubble distribution for three different liquid viscosities
For a liquid containing only very small gas bubbles, a satisfactory degassing rate will be problematic to reach. But as seen in this example only a small increase in the bubble size may improve the separation significantly. A more viscous liquid must contain larger bubbles to achieve the same rate as less viscous liquids.
On basis of this can it be concluded that it is very important to somehow control the size of the bubbles. Break-up and shattering must be avoided by all means. This seems to be more important than to enhance coalescence because the benefit from increase in bubble size decreases as the bubbles become larger. Coalescence should nevertheless be enforced if possible. If the liquid is very viscous it will be almost impossible to remove the smallest bubbles. The more viscous it is, the more emphasis on effects contributing to generation of small bubbles should be made.
0,0010,0020,0030,0040,0050,0060,0070,0080,0090,00
100,00
0,00 1,00 2,00 3,00 4,00 5,00
% o
f ini
tial G
VF a
fter
sep
arat
ion
Mode [mm]
96 cP
340 cP
485 cP
5.3 Model runs
71
5.3.3 Density of bubbles
The effect of how the separation effectiveness is affected by the density of bubbles in layers of the liquid is also investigated. The separator is divided into ten segments and Table 5-2 shows the distributions used in three separate runs:
Table 5-2: Percentage share of bubble distribution in each segment
The result of the three cases for varying viscosity is shown in Figure 5-9.
Figure 5-9: Effectiveness of certain horizontal separator with varying the density of bubbles in each segment
Twice as much gas is not separated for the case with most bubbles in the lower part compared to most in the upper part, for the whole range of viscosities. This factor will also contribute very much to the effectiveness of separation. It is therefore important to have separator inlet devices that not only do a primary gas-liquid separation, but also contributes to an optimized distribution of the remaining gas bubbles.
0,00
5,0010,00
15,00
20,00
25,0030,00
35,00
40,00
45,00
0 200 400 600 800 1000
% o
f ini
tal G
VF a
fter
sep
arat
ion
Viscosity [cP]
Most in lower part
Equally distributed
Most in upper part
6.1 Gravitational separators
73
6 SEPARATION PERFORMANCE FACTORS
Effect from liquid properties and distribution of bubbles gives a basis for suggesting how methods and equipment for separating gas from liquids should be designed to provide efficient separation. The effect of poor design gets more evident as the viscosity of the liquid increase.
A separator which can provide large bubbles distributed close to the liquid surface will be the most efficient one. This is however factors which are difficult to control completely and they must be weighed against other factors in separation.
6.1 Gravitational separators
6.1.1 Inlet devices
The inlet device in a gravitational separator is decisive for the amount and distribution of gas in the liquid settling section, depending on the type of inlet device used. The performance of inlet devices is mainly measured in their ability to distribute the gas and liquid into their respective sections in the separator. However, if the remaining entrained gas consists of very small bubbles distributed far down in the liquid, the overall performance of the separator may be poor. The more viscous the liquid gets, the more crucial the distribution will be. A short evaluation of the inlet devices presented in chapter 2.2.2 regarding the ability to control distribution of gas remaining in the liquid phase is therefore given.
Diverter plate: The simple design makes it impossible to control the distribution of the gas in the liquid. Liquid shattering is mentioned as a possible problem for this device, and it is likley that the same happens with gas bubbles.
Half pipe: Also a simple design which makes it difficult to control the gas distribution. In addition, it sends both gas and liquid downward in the separator which may result in much gas entrained in the liquid. This entrained gas may be distributed in the bottom layers of the liquid giving the gas bubbles a long distance to travel out of the liquid phase.
Inlet vane: The more complex option of using an inlet vane facilitates a more controlled and stable distribution. Droplet shattering is minimized by use of this device, and bubble shattering is probably also reduced to a minimum. The possibility of custom designing the vane for a specific process increases the possibility of optimization with regard to the distribution of bubbles in the liquid.
Inlet cyclone: The enhanced gravity in a cyclone makes this the best performing inlet device as long as it is properly designed. The weakness, regarding bubble distribution in the liquid phase is that the liquid outlet on the cyclone is immersed in the liquid phase. The gas entrained in the oil will then be distributed far down in the liquid phase. This may result in an bad overall performance for the whole separator, even though the inlet cyclone works properly. If gas carry under occurs as a result of incorrect design there will be even more gas in the oil which gets poorly distributed. Problems in qualifying inlet cyclone technology for heavy oils have been encountered because of gas carry under issues. Because of the high viscosity, it is difficult for gas bubbles to reach the gas phase in the center of the cyclone[64, 65]. Since the bubble motion in a cyclone is similar to what is valid for normal gravitation, the
6 Separation performance factors
74
remaining bubbles in the liquid will be the smallest ones. This may lead to conditions where it is difficult to provide satisfactory separation.
An inlet vane seems therefore to be the best option to ensure a controlled and good distribution. However, as always, this must be seen against the present conditions with thorough analysis of the alternatives. Inlet distributors as diverter plates and half pipes are seldom used in modern separators, so practically the choice is between vanes and cyclones.
6.1.2 Other separator internals
After the inlet separation the liquid stream is likely to be turbulent and it may be necessary to have devices which calm down the stream and provides a laminar flow through the separator. If the liquid is turbulent, bubbles in higher layers of the liquid can be drawn down, disturbing the separation. A satisfactory flow distribution is generally achieved by installing perforated plates perpendicular to the flow direction. Optimum distribution is achieved by adjusting number of holes, size of holes and number of plates. A part of the bubbles will impinge on the plates. This can lead to both breakup and coalescence, with difficulties in predicting the result.
It may be possible to install a device with the only purpose of inducing bubble coalescence. The most obvious solution is to increase the collision rate. When water is present, an electrostatic field is set up and the water droplets become polarized and hence they can attract each other, i.e. they collide. This is not possible for bubbles and the solution must be to induce collisions mechanically. This must be provided without disrupting the laminar flow. Additionally all internals must be designed to prevent bubble break-up.
6.1.3 Separator dimensions
The length and diameter of the separator determines its size and weight. Thus, it is desirable to keep these low. For a given flow, the size will depend on the required retention time. If degassing is the factor which determines the retention time a low liquid height will be advantageous as this shortens the travel distance for the bubbles and increases efficiency.
A relation between weight and performance of a horizontal separator can illustrate this. With basis in Figure 5-2 and equation 5-1 the following relation can be developed:
The retention time is set to be a constant parameter. The necessary bubble velocity for a bubble located at the bottom of the liquid is: ὺ Ὄ · ὸ, where H is the liquid height and
t is the retention time. The length of the separator is: ὒ ὸ, where Q is the liquid flow
rate and Aliquid is the cross sectional area of the liquid given in equation 5-1 . The weight of the separator is proportional to the length multiplied with the radius squared. The separator has a radius R. Gathering the equations gives:
6.2 Compact separators
75
2
2 1 1
1 1
1cos 1 sin 2cos 1
2
And with and remaining constant:
1
1cos 1 sin 2cos 1
2
QWeight t R
H HR
R R
Q t
WeightH HR R
− −
− −
∝ ⋅ ⋅ − − −
∝ − − −
6-1
The proportional weight can now be plotted as a function of H/R, where the limits must be 0≤H/R≤2:
Figure 6-1: Weight of horizontal separator as function of liquid height on radius
The lower H/R is the more efficient is the separator, but very low values will result in an extremely heavy vessel. One could also alter the retention time as well to obtain the optimum design, but this shows anyway that a design that may give good separation characteristics comes at the expense of high weight and also a large footprint.
6.2 Compact separators
The focus so far has mostly been on gravitational separators because of the easier implementation of the theory and the relatively simple flow patterns. Bubble motion in cyclones is generally dependent on the same properties as in a gravitational separator, but with the addition of a centrifugal force much higher than gravity. A bubble will in that respect have a radial velocity due to the centrifugal force, and a vertical velocity due to gravity. The vertical velocity is calculated as for a gravitational separator, while the radial velocity will depend on the radius of the cyclone and liquid velocity and the drag coefficient[66]. Hence, the effect of viscosity is as important in cyclones as in gravitational separators.
As mentioned in chapter 6.1.1, gas carry under is a problem for inlet cyclones when the liquid gets very viscous, and the same effect can occur in a standalone cyclone as well. Because of the increase in drag coefficient when the viscosity increases, the bubbles will have problems in reaching the gas phase in the middle of the cyclone in due time. Adjusting the liquid retention time for a given cyclone can be done by altering the liquid velocity. If this is
0 0,5 1 1,5 2
~Weight
H/R
6 Separation performance factors
76
reduced, the retention time will increase, but at the same time the centrifugal force is reduced, leading to lower bubble velocity so the effects offset each other. A consequence of high viscosity can also be difficulties in inducing high enough centrifugal forces to drive all the liquid outwards. The result will be poor phase separation. Possible solutions to this are to force the liquid to flow in a spiral by using some kind of spiraling guiding vanes or use plates which the oil can flow on in thinner layers, providing more time for degassing[67].
The complex flow conditions make the design of a cyclone very difficult. Cyclones to be used in heavy oil applications needs adjustments compared to those used for less viscous liquids, complicating the case even more. It requires good CFD-models to control the effect of altering parameters such as size and liquid velocity and how viscosity will affect the performance. Thorough testing with the relevant fluids is also required.
6.3 Other factors influencing gas separation
The focus in this thesis has almost exclusively been on separation of gas bubbles from the liquid phase, and the modeling has been under very simplified conditions. This has lead to propositions about how a separator should be designed to obtain the best possible separation of the gas. It is however important to point out that there are a number of other important factors that are not accounted for. These will affect the separation of gas bubbles in various extents. Some of them were listed in chapter 2.1, but here is a more supplementary description:
Liquid from gas phase: In addition to liquid degassing are oil droplets existing in the gas phase settling into the liquid. Hence the separator design is based on providing separation of liquid droplets larger than what the mist extractor can handle. The gas separation efficiency may therefore be difficult to improve based on separator dimensions. However, the separator should be designed to give the overall best efficiency.
3 phase separators: Water is almost without exception present together with oil and gas in the reservoir. This water can be either free or emulsified liquid in the oil or as vapor with the gas. It will follow the stream from reservoir to processing facility where it has to be removed. The basic design aspects of three-phase separators are very similar to two-phase, but with an additional concern of liquid-liquid separation. As water is heavier than oil, the free water will settle at the bottom of the separator. Oil drops in the water phase will thus rise into the oil phase. This liquid-liquid settling is normally assumed to be governed by Stokes’ law. Separation of the emulsified water requires treatment to break the emulsions before gravity settling. This can be done by heat treatment, chemicals or electrostatic treatment and is mainly performed after the free water separation.
The concepts and theory of separation of gas from the oil pertaining to the two-phase separation are valid for three phase separation as well. Design considerations are however different as the oil phase lies the middle part of the separator and the bubble motion might be affected by the water settling downwards. It is also shown that gas bubbles can transport surface-active materials (surfactants) away from the emulsion water-oil interface. This may cause the surface of the bubbles to be less susceptible for shape deformations; hence the drag coefficient and rise velocity is affected [68, 69].
To remove the water may be just as, or more important than removing the gas and hence the design of the separator must be according to this. Again the separator should be designed to give the overall best efficiency.
6.3 Other factors influencing gas separation
77
Operating pressure: The operating pressure will determine to what extent light hydrocarbons vaporize. A high pressure will diminish the opportunity of light gases to vaporize from the bulk of liquid while a low pressure will cause vaporization of a large amount of lighter components and some of the heavier, more valuable hydrocarbons. Hence the satisfactory operating pressure must be determined.
As the pressure determines the amount of gas present in the oil this influences the bubble distribution to some extent. This has to be taken into account for accurate calculations of the degassing process. Physical properties of gas and liquid are also dependent on pressure; hence it is important to their values under the operating conditions to predict the correct bubble velocity.
There will also be pressure differences inside the separator, due to liquid flow and hydrostatic height. This may affect flow patterns and consequently the degassing process.
Foaming: When gas is evaporated foaming occasionally occurs. Foam can cause liquid to be carried over into the gas stream and if present in the separator it will occupy space that otherwise would be available for separation. To reduce problems because of foaming is it common to lower the liquid level which reduces the retention time[70]. This may decrease the degassing rate, causing inefficient separation. Foam gathered at the liquid surface may also make it difficult for gas bubbles to enter the gas phase. It is therefore very important to remove foam. This can be done by either mechanical or chemical methods. Mechanically it is done by installing internals as baffles, plates and packings in the separator, which breaks the foam, or in inlet devices where cyclones perform best. In other words, they are affecting the flow pattern in the separator which may also affect bubble motion. It is normal to add chemicals far upstream of the separator, so called antifoams which affect the surface tension in the foam films so it breaks. This may also influence the liquid properties[71].
Sand: Formation sand may be produced with the fluids and this will settle and accumulate at the bottom of the separator. This takes up separator volume and to keep the liquid level constant the liquid must flow faster; hence the retention time is reduced. This reduces the degassing rate. As previously mentioned are vertical preferred over horizontal separators when sand is expected. The fact that sand removal may overrule the importance of degassing, cause the design to not being optimized for an efficient gas-liquid separation. If a horizontal separator is used it must be equipped with sand jets and drains, which will increase the size of the separator. Produced water is normally injected through the jets to fluidize the accumulated sand, which then is removed through the drains.
6 Separation performance factors
78
6.4 Suggested methods for enhancing gas separation
The way to keep separator dimensions small is to introduce methods and equipment which enhances separation. The significance of methods to improve the degassing process will increase in line with viscosity. A normal solution for heavy oil both for transport and separation purposes is to somehow reduce the viscosity. Two mechanical methods are also suggested, regarding coalescence and altered flow pattern.
6.4.1 Reduce viscosity
High viscosity is certainly not only a problem in the separators. The process of getting the heavy oil from the reservoir and to the processing plant may be very difficult. Several methods are used to increase recovery and ease transport; most commonly somehow reduce the viscosity of the oil. This is mainly done by heating or dilution of the oil. Viscosity is very temperature dependent and therefore heating is an effective way to reduce the viscosity as seen in Figure 6-2.
Figure 6-2: Viscosity versus temperature for heavy oils[72]
Two common methods of heating oil in the reservoir are steam injection and hot water flooding. Steam injection has shown to be successful for onshore shallow heavy oil fields. Heat is released from steam condensation which increases the oil temperature and hence reduces viscosity. This is however more difficult to implement for an offshore field. If the resulting oil temperature can be maintained until separation these methods will be beneficial for both recovery and separation purposes. This will however require removal of more water. For transport pipelines can be heated and insulated to increase the temperature in the oil, but this is expensive and energy demanding[73, 74].
Heating for separation purposes is however normally done during processing, preferably with some of the heat recovered from the rest of the process. The required energy demand may however be difficult to supply to a subsea installation. Increase in temperature will also give an increase in gas liberated in the oil. If the purpose of a subsea installation is separation to increase pump efficiencies will more gas in the oil be unfavorable.
1
10
100
1 000
10 000
100 000
0 50 100 150
Visc
osity
[cSt
]
Temperature [°C]
15° API
17° API
20° API
30° API
6.4 Suggested methods for enhancing gas separation
79
Under the right circumstances, the heavy oil may be diluted with lighter oil by tie-in of oil fields with different viscosities. This can be a good solution for subsea separation, especially if one is concerned with smaller fields. Equipment which assures proper blending is however a necessity.
6.4.2 Enhanced coalescence
Coalescence is dependent on the collision rate between bubbles. Since it is desirable to have a laminar flow in the separator, these collisions must be a result of the differences in bubble velocity; larger bubbles catch up and collide with smaller bubbles during the ascent to the liquid surface. This does probably not lead to a very high collision rate.
The suggested method is to increase collisions based on letting the oil flow through a matrix of upwards inclined channels just after the inlet device. For a horizontal separator this device may look like the one shown in Figure 6-3:
Figure 6-3: Matrix of inclined channels suitable for horizontal separator
With oil flowing through these channels the bubbles will rise, but become hindered by the channel roof. This means that larger bubbles will not escape from smaller ones; they are instead gathered in top of each channel where they inevitably have to collide. This will lead to coalescence between bubbles of all sizes. Figure 6-4 shows an illustration of this effect.
The design of this device, with parameters being the inclination, length, height and number of channels, must allow small enough bubbles to reach the channel roofs and provide enough time for coalescence to occur. Simultaneously, it must be assured that the coalesced bubbles escape from the channel. Calculations, CFD-simulations and experimental work must be provided to obtain the best design. Material properties such as for example surface roughness may be an important factor as well. A channel shape other than rectangles may also be a solution.
6 Separation performance factors
80
Figure 6-4: Bubble collisions and coalescence in inclined channels
A similar device is used for water droplet coalescence with downwards inclined channels, developed by Aker Solutions[75]. It is therefore reasonable to believe that a similar effect can be achieved for gas bubbles.
6.4.3 Flow pattern
The velocity of the liquid through the separator is one of the factors determining the necessary velocity a bubble must have to become separated. In horizontal separators, the most critical ones are the small bubbles located near the bottom of the separator. Providing more time for theses bubbles to rise will therefore enhance separation. The suggested method to ensure this is to alter the flow pattern in the separator. It is desirable to obtain a lower velocity on the liquid in the bottom of the separator and correspondingly higher velocity in the upper part of the liquid. Hence the velocity profile will be as shown in Figure 6-5:
Figure 6-5: Velocity profile in horizontal separator with lower velocity in bottom
6.4 Suggested methods for enhancing gas separation
81
A similar profile is caused by wall friction, but this alone is probably not sufficient to obtain a significant effect. A device which decelerates the lower part of the flow must be installed. A possibility is to combine this with the previous suggestion. The channels which enhance coalescence may be shaped in such a way that it also affects the liquid velocity.
These suggestions are purely based on enhancing the separation of gas from liquid; hence it may be impossible to implement them due to other factors. The presence of water will especially make it difficult. The fundamental ideas can however be further developed for adaption to relevant conditions.
83
7 RECOMMENDATIONS FOR FURTHER WORK
Development of reliable methods and models for predicting separation of gas from crude oil systems will still require further research. The present models and guidelines are based on simple theory and assumptions. The attempt is to create an increased awareness of governing parameters and factors and together with effects from variations in fluid properties and separator design.
Many factors play a role in separation. All of them must be taken into consideration when estimating the process. The most important factors are believed to have been addressed in this thesis and the recommendations for further work are based on more thorough investigation of these:
Bubble dynamics: The amount of literature on the field is large, especially in relation to bubble columns, and even though the theory presented here covers the most well known correlations, better ones may exist for predicting a hydrocarbon oil-gas system. The most efficient way to determine the validity of theory is through experimental work. The test results presented here is very limited, but it was enough to determine that there were deviations from the discussed theory. Especially the effects of gas hold up and motion of liquid must be more thoroughly investigated. Most likely, it will be necessary to use existing theory and experimental results to develop correlations especially valid for oil-gas systems. These should also take into account the effect of highly viscous liquids.
The effects of bubble coalescence and break-up in separators are also an important field which requires more investigation. These phenomena are not yet completely understood in any system, but for separation is it most important to determine factors contributing to the effects and be able roughly estimate their occurrence. This also requires experimental work.
Calculation models: The simplifications made for the calculation model made here makes it only applicable for rough estimates. With the right background theory and detailed knowledge of separator conditions is it possible to develop quite reliable models, taking more factors into account. The difficulties arise in complex flow patterns due to separator internals and variations in fluid properties.
It is mainly two-phase separators that have been discussed in this thesis, but for instance a subsea separator will most likely be three-phase. It is therefore necessary to bring the theory addressed here into a three-phase environment. Three-phase separator models should be able to predict separation of all three phases equally good.
Separator conditions: To be able to predict the rate of separation it is vital to know the separator conditions. The rate of separation clearly is dependent on fluid properties and not at least on the distribution of the bubbles in the liquid phase. No methods to determine bubble sizes and their distribution in a well stream have been found during the work on this thesis. Such methods need therefore to be developed.
Separator design: The design of the separator will obviously be the determining factor for its efficiency. A design should provide satisfactory separation of all phases and at the same time be size and cost efficient. For conventional light oils separator designs are well established, but increased production of difficult heavy oils requires design improvements. This involves
7 Recommendations for further work
84
for instance development of new separator internals which for instance can enhance coalescence, provide optimal flow patterns, provide good bubble distribution etc.
Compact separation: Use of compact separation technology is becoming widespread with efficient and reliable solutions for conventional oil. It is important to also qualify compact separation technology for heavy oil applications which also can be used in subsea applications.
There is a constant development of separation technology by suppliers and petroleum companies. However degassing of liquid has seen less attention than other parts of separation. Because of its increased significance in heavy oil and subsea application is it recommended that a general increase in research on this area is initiated.
85
8 CONCLUSION
There is an increasing focus on use of subsea separation and boosting in heavy oil fields of high viscosity. High pump efficiency requires as little gas in the oil as possible. To achieve this, a thorough understanding of the degassing process in the separator is important.
The effectiveness of the degassing process depends on the gas’ ability to migrate out of the oil. Gas bubbles will rise in a liquid due to buoyancy and almost instantly achieve a terminal velocity. This velocity is strongly dependent on the size and shape of the bubble and the liquid properties. Viscosity is of particular significance. Several correlations regarding bubble dynamics exist, however few are based on hydrocarbon oil-gas systems. Existing correlations for determination of bubble velocities are frequently based on simple systems, for example air bubbles in stationary distilled water. They have generally a limited range of validity, as bubble shape and trajectories change with Reynolds-, Eötvös- and Morton number, parameters given by liquid properties. Correlations claimed to have a large range of validity, developed on the basis of the region specific correlations, do also exist. Using a correlation with a large range of validity is desirable when a calculation model for separators is to be developed.
The drag coefficient is the most important factor in determining the bubble velocity. It is reduced as the size of the bubble increases, and hence the velocity is increased. A number of correlations were compared. It was noted that most correlations are highly invalid outside their proposed limits of validity. Significant differences between those developed for contaminated and uncontaminated liquids were also determined. The bubble velocity will be lower in contaminated systems and oil-gas systems must be treated like one. Two correlations developed for a large range of validity seemed to give a good representation of bubble velocity of various sizes. One of these was therefore chosen for comparison with experiments and used in a simple separator model developed.
The velocity of bubbles will also depend on the gas fraction in the liquid. Bubbles may hinder each other in rising, but simultaneously a superficial velocity will occur in two-phase flow which contributes to higher bubble velocity. Bubbles may also coalesce to one larger or break up into several smaller bubbles. Thus, coalescence is a desirable effect in separation, while break-up should be avoided. Coalescence depends on the collision rate between the bubbles. Bubble collisions in the liquid section of the separator will occur because of different terminal velocities as a result of different bubble sizes. Coalescence rates are larger in viscous liquids.
Experiments on some silicone oils demonstrated that the chosen correlation gave fairly accurate results for single bubbles in low Reynolds number region in stagnant high viscosity liquid. Rather large deviations were on the other hand observed with high gas fraction. The velocity was then higher than any of the reviewed theory could explain. It was also verified that it takes significantly longer time for small bubbles to rise in very viscous liquids. The bubble behavior deviates more from the reviewed theory for high viscous liquids than for less viscous liquids.
A simple model for horizontal and vertical gravitational separators was developed. By running the model it was established that viscosity is very significant for separator effectiveness. A doubling in viscosity requires about a twice as large separator to maintain the same rate of separation, remaining other parameters constant. Bubble size and their
8 Conclusion
86
distribution in the liquid are also very important. Only a very small increase in bubble size may give significantly enhanced separation. Small bubbles will be very critical in high viscosity liquids because they will move very slowly. Larger bubbles are therefore necessary as the liquid gets more viscous to achieve satisfactory degassing rates. In a horizontal separator is it important to try to distribute most of the bubbles in the top layers of the liquid.
Separator inlet devices will have a large impact on the distribution of gas bubbles in gravitational separators. These should provide a satisfactory inlet separation, not cause bubbles to break up and make sure the gas is distributed mainly in upper parts of the liquid layer. Separator size dimensions will also be of significance. Low liquid height is advantageous, but this comes on the expense of larger and heavier vessel. Other separation mechanisms as for instance oil-water separation and sand removal are also important factors to be considered and may make it difficult to optimize the degassing process.
Separation by use of centrifugal forces, many times higher than the gravitational force, is beneficial as this allow for much more compact equipment. Bubble motion will be dependent on the same parameters as in gravitational separators. Problems with gas-carry under and inducement of high enough centrifugal forces make however this technology not yet fully qualified for heavy oil applications.
Methods for increased effectiveness in separation of heavy oils are suggested. A normal way is reducing the viscosity of the liquid by heating or dilution. Coalescence can be increased by increasing the collision rate between bubbles. The suggested method to obtain this in a horizontal separator is to let the oil flow through upwards inclined channels before the liquid settling section. The hindered rise of bubbles leads to more collisions between them. In a horizontal separator may it also be beneficial to let the liquid flow slower in lower layers to give the bubbles here more time to reach the gas-liquid interface.
Important factors in the degassing process have been addressed, but much work remains to develop correlations and models which can give a more exact description of real systems.
87
9 REFERENCES
1. Arnold, K. and M. Stewart, Surface production operations. 3rd ed. Vol. 1. 2008, Amsterdam: Elsevier. 768 p.
2. Speight, J.G., The chemistry and technology of petroleum. 1999, New York: Marcel Dekker. xiv, 918 p.
3. Haugan, J.A., Challenges in heavy crude oil - Grane, an overview. Journal of petroleum technology, 2006. 58(6): p. 53-54.
4. Bybee, K., Production of heavy crude oil: Topside experiences on Grane. Journal of petroleum technology, 2007. 59(4): p. 86-89.
5. Abdel-Aal, H.K., M. Aggour, and M.A. Fahim, Petroleum and gas field processing. 2003, New York: Marcel Dekker. XII, 364 p.
6. HAT_international, HAT news December 2008. Feature: Inlet distributor selection. 2008.
7. ConSepT. ConSepT IVD (Inlet vane distributor). [cited 2009 March 18]; Available from: http://www.consept.no/ivd.htm.
8. SulzerChemtech. Shell Schoepentoeter™. [cited 2009 March 18]; Available from: http://www.sulzerchemtech.com/en/DesktopDefault.aspx/tabid-234/289_read-353/.
9. ConSepT. ConSepT ICD - (Inlet cyclone distributor). [cited 2009 March 23]; Available from: http://www.consept.no/icd.htm.
10. CDS-Engineering. CDS-Gasunie Inlet Cyclone. [cited 2009 March 23]; Available from: http://www.cdsengineering.com/product_inletcyclone.html.
11. van Asperen, V., Stanbridge, D., General Considerations For The Selection Of An Inlet Device in Separators and Scrubbers. 2001, CDS-Engineering.
12. NATCO. Wire Mesh Mist Extractors. [cited 2009 April 16]; Available from: http://www.natcogroup.com/Content.asp?t=ProductPage&ProductID=61.
13. Koch-Glitsch-LP, Mist elimination. 2007, Koch-Otto york separations technology.
14. CDS_engineering. Vane Pack vs. Cyclone Systems. [cited 2009 March 23]; Available from: http://www.cdsengineering.com/case_vanevscyclone.html.
15. Shoham, O. and G.E. Kouba, State of the art of gas/liquid cylindrical-cyclone compact-separator technology. Journal of petroleum technology, 1998. 50(7): p. 58-65.
16. Baker, A.C. and J.H. Entress, The VASPS subsea separation and pumping system. Chemical engineering research & design, 1992. 70(1): p. 9-16.
9 References
88
17. Peixoto, G.A., et al., VASPS prototype in Marimba field - Workover and restart. JPT, 2006. 58(5): p. 66-67.
18. Cohen, D.M. and P.A. Fischer, Production systems hit the seafloor running. World Oil, 2008. 229(1): p. 71-8.
19. Sarshar, M.M. and N.A. Beg, The applications and performance of a novel compact separator in the oil and gas industry, in 2nd GCC - EU Advandced Oil & Gas Technology Conference. 2001: Abu Dhabi.
20. CDS_engineering_and_FMC_Technologies. CDS StatoilHydro Deliquidiser. [cited 2009 March 23]; Available from: http://www.fmctechnologies.com/upload/factsheet_cds_deliquidiser.pdf.
21. CDS_engineering_and_FMC_Technologies. CDS StatoilHydro Degasser. [cited 2009 March 23]; Available from: http://www.fmctechnologies.com/upload/factsheet_cds_degasser.pdf.
23. TwisterBV. Factsheets: Twister Supersonic Separator. 2008 [cited 2009 March 25]; Available from: http://twisterbv.com/resources/.
24. Schinkelshoek, P. and H.D. Epsom, Supersonic gas conditioning - Commercialisation of Twister technology, in GPA conference. 2008: Grapevine, Texas, USA.
25. Kalikmanov, V., et al., New developments in nucleation theory and their impact on natural gas separation. SPE Annual Technical Conference and Exhibition, 2007. 6: p. 3637-3641.
26. Alfyorov, V., et al., Supersonic nozzle efficiently separates natural gas components. Oil & Gas Journal, 2005(May): p. 53-58.
27. Pruner, A.A., Statoil to boost recovery with subsea production system. World Oil, 2006. 227(11): p. 41-42.
28. Mogseth, G. Functional Verification of the Worlds First Full Field Subsea Separation System - TIORA. in Offshore technology conference. 2008. Houston.
29. Gjerdseth, A.C., A. Faanes, and R. Ramberg. The Tordis IOR Project. in Offshore technology conference. 2007. Houston.
30. Beckman, J., Total turns to subsea separation for problematic Pazflor crude. Offshore, 2008. 68(5).
31. Parshall, J., Pazflor project pushers technology frontier. Journal of petroleum technology, 2009. 61(1): p. 40-45.
32. Total. Pazflor. 2008 [cited 2009 February 2]; Available from: http://www.total.com/brochures-exploration-production/Pazflor/en/.
34. FMC_Technologies. Shell BC-10. [cited 2009 April 16]; Available from: http://www.fmctechnologies.com/Subsea/Projects/Brazil/ShellBC10.aspx.
35. FMC_Technologies. in Depth. News for the global subsea community. 2008 [cited 2009 March 3]; Available from: http://www.fmctechnologies.com/upload/indepth3_final.pdf.
36. Jacobsen, H.A., Personal communication with professor H. A. Jacobsen at department of Chemical Engineering, NTNU. 2009.
37. Perry, R.H., J.O. Maloney, and D.W. Green, Perry's chemical engineers' handbook. 1997, New York: McGraw-Hill.
38. Turton, R., Levenspiel, O., A short note on the drag correlation for speheres. Powder technology, 1986. 47: p. 83-86.
39. Stokes, G.G., On the effect of the internal friction of fluids on the motion of pendulums. Cambridge Philosophical Transactions, 1850. IX.
40. Karamanev, D.G., Free rising spheres do not obey Newton's law for free settling. AIChE journal, 1992. 38(11): p. 1843-1846.
41. Karamanev, D.G., Rise of gas bubbles in quiescent liquids. AIChE journal, 1994. 40(8): p. 1418-1421.
42. Karamanev, D.G., Equations for calculation of the terminal velocity and drag coefficient of solid spheres and gas bubbles. Chemical engineering communications, 1996. 147: p. 75-84.
43. Clift, R., J.R. Grace, and M.E. Weber, Bubbles, drops, and particles. 1978, New York: Academic Press. xiii, 380 p.
44. Grace, J.R., Shapes and velocities of bubbles rising in infinite liquids. Transactions of the Institution of Chemical Engineers, 1973. 51(2): p. 116-20.
45. Grace, J.R., Shapes and velocities of single drops and bubbles movng freely through immiscible liquids. Transactions of the Institution of Chemical Engineers, 1976. 54(3): p. 167-173.
46. Wacker. Wacker Silicone Fluids AK. 2002 [cited 2009 March 13]; Available from: http://www.ambercomposites.com/downloads/datasheet/silicones-ak.pdf.
47. Gal-Or, B., Hydrodynamics of ensemble of drops or bubbles in presence or absence of surfactants. Chemical engineering science, 1968. 23(12): p. 1431-1446.
48. Marrucci, G., Rising velocity of a swarm of spherical bubbles. Industrial & engineering chemistry fundamentals, 1965. 4(2): p. 224.
49. Manjunath, M., et al., Numerical simulation of the drag on a swarm of bubbles. International journal of engineering science, 1994. 32(6): p. 927-933.
9 References
90
50. Wild, G., et al., Some aspects of the Hydrodynamics of Bubble Columns. International journal of Chemical reactor engineering, 2003. 1(Review R7).
51. Griffith, P. and G.B. Wallis, Two-phase slug flow. ASME -Transactions - Journal of Heat Transfer, 1961. 83(3): p. 307-320.
52. Nicklin, D.D.J., Two-phase bubble flow. Chemical engineering science, 1962. 17: p. 693-702.
53. Luo, H., PhD: Coalescence, breakup and liquid circulation in bubble column reactors. 1993, Department of Chemical Engineering - University of Trondheim: Trondheim. p. xiv, 197 p.
54. Marrucci, G., Theory of coalescence. Chemical engineering science, 1969. 24(6): p. 975-985.
55. Prince, M.J. and H.W. Blanch, Bubble coalescence and break-up in air-sparged bubble columns. AIChE journal, 1990. 36(10): p. 1485-99.
56. Chesters, A.K., Modelling of coalescence processes in fluid-liquid dispersions. A review of current understanding. Chemical engineering research & design, 1991. 69(4): p. 259-227.
57. Chen, L., Y. Li, and R. Manasseh, The coalescence of bubbles - a numerical study, in Third International Conference on Multiphase flow, ICMF'98. 1998: Lyon, France.
58. Bhavaraju, S.M., T.W.F. Russel, and H.W. Blanch, The design of gas sparged devices for viscous liquid systems. AIChE journal, 1978. 24(3): p. 454-66.
59. Wilkinson, P.M., A. van Schayk, and J.P.M. Spronken, Influence of gas density and liquid properties on bubble breakup. Chemical engineering science, 1993. 48(7): p. 1213-1226.
60. Erwin, D.L., Industrial chemical process design. 2002, New York: McGraw-Hill. XXII, 722 p.
61. American_Petroleum_Institute, Specification for Oil and Gas Separators, in API Specification 12J. 1999.
62. NORSOK_Standard, P-100 Process systems 2001, Pronorm.
63. Krogh-Moe, W., (CDS_engineering), Personal communication by E-mail April 14th. 2009.
64. Gramme, P.E., Mekanismer og fenomener i prosessutstyr og rør. , in Presentation in course TPG4135 - "Processing of Petroleum" at NTNU. 2004.
65. Ellingsen, F., Oljeselskapenes teknologibehov, gap, ønsker og piloteringsmuligheter 2006-2008, in Oil & Energy. 2006.
91
66. Rosa, E.S., F.A. Franca, and G.S. Ribeiro, The cylone gas-liquid separator: operation and mechanistic modelling. Journal of Petroleum Science and Engineering, 2001. 32: p. 87-101.
67. Sveberg, K., Personal communication with managing director in NATCO Norway AS February 18th. 2009.
68. Auflem, I.H., et al., Influence of pressure and solvency on the separation of water-in-crude-oil emulsions from the North Sea. Journal of Petroleum Science and Engineering, 2001. 31(1): p. 1-12.
69. Stefan, R.L. and A.J. Szeri, Surfactant Scavenging and Surface Deposition by Rising Bubbles. Journal of Colloid and Interface Science, 1999. 212(1): p. 1-13.
70. Shaban, H.I., A study of foaming and carry-over problems in oil and gas separators. Gas Separation & Purification, 1995. 9(2): p. 81-86.
71. Garrett, P.R., Defoaming: theory and industrial applications. 1993, New York: M. Dekker. viii, 329 p.
72. Finborud, A., Heavy oil production, in Floating production in challenging environments conference. 2008: Oslo, Norway.
73. Mandil, C., Environmental and technological issues associated with non-conventional oil, in IEA Conference on non-conventional oil. 2002: Calgary, Canada.
74. Jayasekera, A.J., The development of Heavy Oil Fields in the U.K. Continental Shelf: Past, Present and Future, in SPE Western Regional Meeting. 1999: Anchorage, Alaska.
75. Aker_Solutions, An introduction into the technical capabilites of Aker Solutions Process Systems. 2006.
76. Hadamard, J.S., Mouvement permanent lens d'une sphere liquide et visqueuse dans un liquide visqeux. Comptes Rendus, 1911. 152: p. 1735-1738.
77. Rybczynski, W., Bulletin of the Academy of Sciences Cracow, 1911. 1A: p. 40-46.
78. Oseen, C.W., Stoke's formula and a related theorem in hydrodynamics. Arkiv för matematik, astronomi och fysik, 1910. 6(29).
79. Haas, U., Flow round spherical bubbles with internal circulation. Chemie-Ingenieur-Technik, 1972. 44(18): p. 1060-8.
80. Hamielec, A.E., PhD thesis. 1961, University of Toronto.
81. Hamielec, A.E., Johnson, A. I. , Viscous flow around fluid spheres at intermediate Reynolds numbers. Canadian journal of chemical engineering, 1962. 40: p. 41-45.
82. Hamielec, A.E., Storey, S. H., Whitehead, J. M., Viscous flow around fluid spheres at intermediate Reynolds number. Canadian journal of chemical engineering, 1963. 41: p. 246-251.
9 References
92
83. Levich, V.G., Physicochemical Hydrodynamics, ed. Prentice-Hall. 1962, New York. xvi, 700 p.
84. Moore, D.W., Boundary layer on spherical gas bubble. Journal of fluid mechanics, 1963. 16(2): p. 161-176.
85. Davies, R.R.M., The mechanics of large bubbles rising through extended liquids and through liquids in tubes. Proceedings of the Royal Society of London. Series A, Mathematical and Physical Sciences, 1950. 200: p. 375-390.
86. Darton, R.C. and D. Harrison, The rise of single gas bubbles in liquid fluidised beds. Transactions of the Institution of Chemical Engineers, 1974. 52(4): p. 301-6.
87. Peebles, F.F.N., Studies on motion of gas bubbles in liquids. Chemical Engineering Progress, 1953. 49(2): p. 88-97.
88. Harmathy, T.Z., Velocity of large drops and bubbles in media of infinite or restricted extent. A.I.Ch.E. Journal, 1960. 6(2): p. 281-288.
89. Tadaki, T., Madea, S., On the shape and velocity of air bubble rising in various liquids. Kagaku Kogaku, 1961. 25: p. 254-264.
90. Bozzano, G., Dente, M., Shape and terminal velocity of single bubble motion: A novel approach. Computers & chemical engineering, 2001. 25(4): p. 571-576.
91. Environment_Canada. Oil properties. [cited 2009 April 14]; Available from: http://www.etc-cte.ec.gc.ca/databases/OilProperties/Default.aspx.
92. Camargo, J. StatoilHydro – Global Growth, Local Focus. in Café com Energia. 2008. Bacia de Campos.
Appendix A
93
APPENDIX A – CORRELATIONS FOR DRAG COEFFECIENT AND/OR TERMINAL VELOCITY
Several proposed correlations for calculation of drag coefficient and terminal velocities of bubbles are presented in this appendix. They are summarized and compared in chapter 3.
Spheres at low Reynolds numbers
From Figure 3-5 one can see that bubbles take spherical shape when equivalent diameter de is small or surface tension σ is high.
The motion considered here is for spherical bubbles, flowing with sufficiently low Reynolds number resulting in no wake at the rear of the particle. Hadamard [76] and Rybczynski [77] independently developed a model for the drag coefficient of a fluid sphere with constant interfacial tension, by considering it to be completely free of surface-active contaminants, i.e. a pure liquid. The overall drag coefficient is the sum of a net pressure force or “form drag”, shear stress and differential normal stress and becomes:
8 2 3
Re 1DCκ
κ+ = +
A- 1
Hence the terminal velocity becomes from equation 3-2:
21 1
6 2 3t
gdu
ρ κμ κΔ +=
+ A- 2 ‖ is the viscosity ratio. In general one assume that κ=0 for a gas bubble. Compared
to Stokes’ law in equation 3-4, the velocity of a gas bubble should be up to 50% higher than that of a rigid sphere of same size and density. It is however observed that small gas bubbles tend to follow Stokes’ law, with a sharp increase in velocity toward the Hadamard and Rybczynski equation. Briefly this is due to the surface tension and the fact that the fluid is not completely free of surface-active contaminants. In general the velocity will be something in between the Hadamard and Rybczynski result and Stokes’ law. For most purposes, Stokes’ law is assumed to be valid for small bubbles at low Reynolds numbers, and is used extensively in simple calculations of bubble velocities. The reason for its wide use is that it is very simple and in many cases gives reasonable results as long as the bubbles are small, moving slowly or when the bubble velocity is not very critical.
Oseen suggested a solution where inertia terms neglected in the Hadamard and Rybczynski equation and in Stokes’ law is approximately included [78], giving a higher drag coefficient than Stokes’ law.
24 31 Re
Re 16DC = +
A- 3
Generally these equations are valid only for Re<0.01, but are used for Re up to 2, as this gives reasonable results. No other simple correlations give more accurate results.
Appendix A
94
Spheres at higher Reynolds numbers
For higher Reynolds number where the bubble still has an approximate shape of a sphere Haas et al. [79] has presented the following equation.
0.7814.9 Re ( 0, Re>2)DC κ−= → A- 4
Hamielec et al. [80-82] proposed the following correlation for 4 < Re < 100, in which the viscosity of the bubble is not neglected:
20.74
0.74
3.05(783 2142 1080)Re
(60 29 )(4 3 )
for 0:
13.725Re
D
D
C
C
κ κκ κ
κ
−
−
+ +=+ +
→=
A- 5
For pure systems Levich proposed[83]:
48,
ReDC = A- 6
and Moore extended this equation to[84]:
5/6)1/2
48 2.211 (Re
Re ReDC O − = − + A- 7
Bubbles with ellipsoidal shapes
Grace et al. [45] presented a correlation for contaminated drops and bubbles valid for the criteria (see Figure 3-5):
310 , 40, Re 0.1,M Eo−< < > A- 8
which is: 0.757
0.441
0.94 (2 59.3)
and
3.42 ( 59.3),
J H H
J H H
= < ≤
= >
A- 9
where: 0.14
0.149
0.149
4,
3
Re 0.857
w
H EoM
J M
μμ
−−
=
= +
A- 10
Here, μw, is the viscosity of water in which was used in experiments, which may be taken as 0.9 cP. The terminal appears only in the dimensionless group J, and may be expressed as:
0.149 ( 0.857)te
u M Jd
μρ
−= − A- 11
Appendix A
95
The change in J at H=59.3 is because of the transition between non-oscillating and oscillating bubbles (or drops).
Deformed bubbles of large size
The correlations presented here are for bubbles with Eö > 40 and Re > 1.2 (see Figure 3-5). Generally the size of these bubbles are of volumes greater than about 3 cm3 (de > 1.8 cm), with an approximated shape of segment of a sphere.
Davies and Taylor[85] reported a correlation for the terminal velocity for spherical-cap bubbles, recommended for use when Re > 40:
2.
3tu ga ρ ρ= Δ A- 12
Here, a, is the radius of the spherical-cap. For Re < 40 it is recommended to use:
( ) .tu f e gb ρ ρ= Δ A- 13
The e in the function f(e) is the eccentricity of the bubble, and b is the vertical semiaxis
(Ὡ 1 ὦ/ὥ ), see Figure 3-4. All these parameters are difficult to determine, but for Re>150 (the shape is then a true spherical cap), a geometrical consideration leads to a result for equation A- 12 in terms of equivalent diameter of a bubble with volume V, instead of using a:
0.711t eu gd= A- 14
In fact, this is the correlation which is generally used the bubbles have a spherical cap shape.
For lower Reynolds number a generalized form of an equation suggested by Darton and Harrison[86] is proposed by Clift et al [43], giving an approximated drag coefficient:
28 (2 3 ) 8 ( 10 , all Re)
Re (1 ) 3DC Mκ
κ+= + >+
A- 15
Peebles and Garber
For small bubbles rising in a liquid Peebles and Garber [87] have studied their motion and developed the correlations presented in table B-1, valid for bubbles with volumes in the range of the equivalent to spheres with radii between 0.61 and 7.62 mm.
Appendix A
96
Table A- 1: Terminal velocities for bubbles, results of Peebles and Garber
Region Range of Applicability Terminal velocity, ub
1 Reb ≤ 2 2Ὑ ” ” Ὣ9‘
2 2 < Reb ≤ 4.02G1-0.214 0.33Ὣ . ”‘ . Ὑ .
3 4.02G1-0.214 < Reb ≤ 3.10G1
-0.25 1.35 „” Ὑ .
4 3.10G1-0.25 > Reb 1.53 .
*
Where: ὙὩ Ὃ
* The constant value of 1.53 is recommended by Harmathy as this correlates better with experiments than the value given by Peebles and Garber[88]
Peebles and Garber have explained the regions like this: The regions are generally corresponding to bubble size (hence the Reynolds number). In the first region the bubbles behave as buoyant solid spheres, rising vertically, and the terminal velocity is the result from implementing Stoke’s law. In the second region the bubbles also rise vertically, but with a slight decrease in drag coefficient compared to a solid sphere of the same volume. For the next Reynolds number range, the bubbles are flattened and rise in a zigzag pattern, with significantly increased drag coefficients. The largest bubbles rise almost vertically with significantly increased drag coefficients and the bubble has a shape of a mushroom cap. Karamanev
As mentioned in chapter 3.1.1 results of Karamanev has shown that rising solids follow the standard drag correlation for Re < 135. Karamanev has also shown by an extensive examination of literature and experiments that the drag coefficient for a rising bubble in a contaminated liquid is equal to one of a solid sphere with ρ≈0, by assuming that internal bubble recirculation has no effect on the velocity of bubble rise. Also assuming that the drag coefficient of the bubble can be calculated on the basis of its real geometric characteristics, Karamanev has shown that the terminal velocity of a bubble of any size and shape in contaminated liquid is equal to[41]:
1/62/3 1/3
8 4
6 3e e e
tD h D h
d gd dgu V
C d C dπ= = A- 16
Where: V = Volume of the bubble [cm3] = “ de = Equivalent diameter of a gas bubble [cm] dh= Diameter of the circle, projected by bubble on a horizontal plane [cm]
Appendix A
97
The terminal velocity of a rising gas bubble can therefore be calculated by use of equation 3-9 to determine the drag coefficient when Re < 135 (corresponding to Ar < 13000) and CD=0.95 when Re > 135 (Ar > 13000). In equation A- 16 the term de/dh is the factor taking in the shape of the bubble. This can be determined by using a reliable correlation for determining shape given by Tadaki and Madea[89]. The Tadaki number, Ta is introduced:
The last part of equation A- 19 is true when the bubble has a shape of a spherical cap[43]. When the bubble has this shape, usually Re > 135 and by then using CD=0.95 and substitute equation A- 17 into equation A- 16, it will transform to equation A- 14; the result from Davies and Taylor. Experimental data from various literature compared to data calculated by equation A- 16 has shown good agreement for liquid densities between 790 and 1350 kg/m3, liquid viscosities from 0.80 to 120 cP, and surface tensions of 20 to 478 mN/m [41]. Using equations A- 16 and 3-8 therefore gives a very simple method in determining the terminal velocity, compared to using different correlations for each region.
Bozzano and Dente
Bozzano and Dente are proposing the following correlation valid for the whole range of Reynolds numbers and shapes[90]:
2
0D
aC f
R
=
A- 20
Where 1/ 3 3/ 2
1/ 3 1/ 6 3/ 2
48 1 120.9
Re 1 36 1.4(1 30 )
M Eof
M M Eo
+= ++ + +
A- 21
R0 is the radius of the equivalent spherical bubble, and a is the major semi-axis of the bubble. An approximated value for the deformation factor, DEF, is given by:
2 1/ 6
1/ 60
10(1 1.3 ) 3.1
10(1 1.3 )
a M EoDEF
R M Eo
+ += ≈ + + A- 22
Appendix B
99
APPENDIX B – RELATION BETWEEN LIQUID PROPERTIES IN OILFIELDS
When the crude oil gets more viscous, parameters affecting the bubble motion is changed. As seen from correlations in chapter 3, the oil properties that determines the bubble velocity is the viscosity, density (and density difference between gas and liquid), and surface tension. The focus in previous chapters has been on variations in liquid viscosity without addressing the effect of varying any of the other properties. Data from various oilfields worldwide has therefore been gathered to see how these other properties vary with varying viscosity.
Figure B-1: Density versus viscosity. Data from several oilfields worldwide at 15ºC [91, 92]
Figure B-2: Surface tension versus viscosity. Data from several oilfields worldwide at 15ºC [91, 92]
800
820
840
860
880
900
920
940
960
980
1000
1 10 100 1000 10000
Den
sity
(kg/
m3 )
Viscosity (cP)
0
5
10
15
20
25
30
35
40
1 10 100 1000 10000
Surf
ace
tens
ion
(mN
/m)
Viscosity (cP)
Appendix B
100
From the plots can it be concluded that density increases with viscosity. However, the increase is small compared to viscosity. What is seen is that when the viscosity increase does the density approach water density (≈ 1000 kg/m3). Settling of water droplets in oil is, just as bubbles, dependent on the density difference between the phases. When the two densities become almost equal will separation be very difficult. This is can easily be seen from Stokes’ law which is commonly used for oil water separation. This is one of the main reasons why separation of water has seen more attention in heavy oil application than degassing.
The effect of increased liquid density will for gas bubbles imply an increased buoyancy effect. Thus, this will to a certain degree counteract the result of increase in viscosity. There is however a very small increase in density as the viscosity increases. Additionally is the difference in liquid and gas density so large that an increase in oil density will be much less significant for velocity of bubbles than for water droplets. It can be seen of figure A-2 that the surface tension varies very little with viscosity, although maybe a little less for very light oils. The viscosity is therefore the decisive factor affecting the velocity of bubbles when comparing light and heavy oils. This is the reason why viscosity is the only liquid property altered in the model runs in chapter 5.3.
Appendix C
101
APPENDIX C – DEVELOPED SEPARATOR MODEL
A more thorough description of the separator model presented in chapter 5.2 is presented here. By going through this description and use the model it should be possible to understand how the model works and how calculations are performed.
Overview of program structure and calculations
Despite several options of distributions and type of separator etc are the calculation procedures to a large extent similar for each case. Going through the procedure set up in Matlab for bubble size distributions and a horizontal separator case should provide an understanding overview.
Bubble size distributions
The two options of generating bubble distribution, either by own input values or as a probability distribution works as follows:
If this option of own input values is chosen the user is asked to enter the percentage share of bubbles in the diameter intervals in shown in table C-1. The values are stored to the corresponding mean diameter of each interval. A typical distribution will then look like the one in figure C-1.
Table C-1:
If the option of generating a probability distribution is chosen, this will be done by a built in function in Matlab which generates a Rayleigh distribution based on a set mode of the distribution. The mode is the size that occurs most frequently. With a diameter mode of 2.3 mm such a distribution will look like in figure C-2:
If the probability distribution is unable to give an appropriate distribution, the user should choose the option of defining the input values. It is also possible to alter the code so it generates another type of probability distribution.
Irrespective of the method generating the bubble distribution is a cumulative diameter and volume distribution made. The cumulative diameter distribution is simply made by continuously summing up the values in the bubble distribution and the one corresponding to the Rayleigh distribution above is shown in figure C-3.
Figure C-3
The cumulative volume distribution is generated the same way, by first calculating the corresponding volume to each diameter. The calculated volume and the frequency of the respective diameter determine how much of the total volume a diameter accounts for. The volume curve from the Rayleigh distribution will then look like shown in figure C-4.
Appendix C
103
Figure C-4
The distribution of bubbles after separation is also generated for horizontal separators. This is basically only an adjustment of the initial distribution, where the values are weighted based on the results from the separator model. The separator model will for example calculate how many percent of the bubbles of a certain size that gets separated. The remaining percent is then multiplied by the initial amount of bubbles of that size, determining amount left. The final distribution is plotted together with the initial distribution for comparison and may look like in figure C-5.
Figure C-5
Appendix C
104
The codes written in Matlab generating distributions based on the Rayleigh distribution and the final distribution are shown on the following pages:
Rayleigh Inlet Distribution:
%Generate a bubble distribution based on a Rayleigh distribution close maxDia=12; step=0.05; D=[0:step:maxDia]; % Diameter interval p=raylpdf(D,2.3); % Generate the Rayleigh probability density distribution % The number in the paranthesis is the mode and can be changed to get % the desired distribution %Generate cumulative diameter distribution by summing up density values: DiaDist=p/sum(p); CumDiaDist(1)=DiaDist(1); i=2; for i=2:(maxDia/step+1) CumDiaDist(i)=CumDiaDist(i-1)+DiaDist(i); i=i+1; end CumDiaDist=CumDiaDist*100; CoeffDia=polyfit(D,CumDiaDist,8); % Generate cumulative volume distribution by summing up the volumes to the % corresponding distribution values: Volume=(pi/6)*D.^3; i=1; for i=1:(maxDia/step+1) Volumepart(i)=p(i)*Volume(i); i=i+1; end sumVolumepart=sum(Volumepart); VolumeDist=Volumepart/sumVolumepart; CumVolDist(1)=VolumeDist(1); i=2; for i=2:(maxDia/step+1) CumVolDist(i)=CumVolDist(i-1)+VolumeDist(i); i=i+1; end CumVolDist=100*CumVolDist; %Generate plot of the three distributions: scnsize=get(0,'ScreenSize'); figure('Name', 'Bubble and Volume Distribution', 'NumberTitle', 'off', ... 'Position',[1 scnsize(4)/3 scnsize(3)/1.5 scnsize(4)/2]) sub1=subplot(1,3,1,'position',[0.04 0.1100 0.27 0.8]); ... plot(D,100*p,'LineWidth',1.5) axis ('tight', 'square'); title('Bubble Distribution') xlabel('Diameter [mm]') ylabel('(ni/N) %')
% Generates the bubble size distribution in liquid after separation % Adjusts the original distribution values by using the resulting % percentage share of bubbles left in each segment and weighted in % accordance with volume fraction and density of bubbles of each segment. demm2=flipud(demm); lengthdemm=length(demm); i=1; for i=1:(maxDia/step+1) if D(i)<demm2(1) p2(i)=p(i); end t=2; for t=2:(lengthdemm) if D(i)<=demm2(t)&&D(i)>demm2(t-1) p2(i)=p(i)*(1-sum(Segmentfraction(1:(t-1)))); end t=t+1; end if D(i)>=demm2(end) p2(i)=0*p(i); end i=i+1; end p2smooth=smooth(D,p2,0.1,'rloess'); % Generate new cumulative diameter distribution by summing up new % density values: a=size(p2); DiaDist2=p2/sum(p2); CumDiaDist2(1)=DiaDist2(1); i=2; for i=2:a(2) CumDiaDist2(i)=CumDiaDist2(i-1)+DiaDist2(i); i=i+1; end CumDiaDist2=CumDiaDist2*100; % Generate new cumulative volume distribution by summing up the volumes to % the corresponding new distribution values: for i=1:(maxDia/step+1) Volumepart2(i)=p2(i)*Volume(i); i=i+1; end sumVolumepart2=sum(Volumepart2); VolumeDist2=Volumepart2/sumVolumepart2; CumVolDist2(1)=VolumeDist2(1); i=2; for i=2:(maxDia/step+1) CumVolDist2(i)=CumVolDist2(i-1)+VolumeDist2(i); i=i+1; end
The script which calculates the separation efficiency of a horizontal separator consists of the following steps:
• The script of the chosen bubble size distribution is called • Separator properties are set • Necessary bubble velocity from each segment is calculated • Diameters corresponding to the bubble velocities are calculated • The amount of gas that is separated from each segment is calculated • Results are displayed • The script which generates the final distribution is called
Figure C-6
Separator properties:
The following separator properties are set by the user:
- Length, L - Radius, R - Liquid flow rate, Q - Retention time, t - Number of segments, n (n=1 represents the top segment, N represents the bottom
segment) - Density of bubbles in each segment
Based on these inputs, the rest of the properties are calculated:
- Total liquid cross sectional area: ὃ ·
- Horizontal (liquid) velocity: ὺ
- Theta corresponding to Ac, with an iterative procedure based on: — sin 2—
- Liquid height: Ὄ Ὑ 1 cos —
- Segment heights: Ὄ
θn
L
H
Hn
Appendix C
109
- Theta for each segment: — cos 1 ·
- Cross sectional area of each segment:
ὃ , — Ὑ Ὑ sin 2— — Ὑ Ὑ sin 2—
- Volume fraction of each segment: ,
Necessary bubble velocity from bottom of each segment:
The necessary velocity a bubble must have in order to get separated is calculated for each segment. This will height the bubble must travel from the bottom of the segment divided on the time it has to travel this height, namely the retention time: ὺ , ·
Calculating corresponding diameters
The size of the bubbles corresponding to the necessary velocities is calculated by using Karamanev’s correlation, presented in chapter 3. This requires an iterative procedure. Due to converging problems when reversing the calculation procedure (finding diameter from velocity) does the script a check of bubble diameters from smaller to larger until the correct one is found.
The procedure is therefore as follows:
- vv,n is determined as explained above. - A very small diameter, Di is set as the first one to check - The Archimedes number is calculated based on this diameter:
ὃὶ Ὣ” Ὀ‘ ” ”
- If the calculated Archimedes number < 13000, the drag coefficient is calculated by: ὅ 432ὃὶ 1 0.0470ὃὶ 0.5171 154ὃὶ /
- Or if Ar > 13000, CD = 0.95 - Reynolds number and Morton number are calculated: ὙὩ ” Ὀ ὺ ,‘ ὓ Ὣ‘ ” ”” „
- The Tadaki number is calculated: Ὕὥ ὙὩ · ὓ .
- The bubble shape parameter de/dh is calculated by: ὨὨ ὥ · Ὕὥ
Coefficients a and b are determined by:
Appendix C
110
1, 0 when 2.11
1.14, 0.176 when 2.11 5.46
1.36, 0.28 when 5.46 16.53
0.62, 0 when 16.53
a b Ta
a b Ta
a b Ta
a b Ta
= = ≤= = − ≤ ≤= = − ≤ ≤= = ≤
- The velocity corresponding to Di can now be calculated by:
( ) 4
3i e
iD h
gD dv D
C d=
- The ratio between the calculated velocity and vv,n is determined. Since the diameters are checked from smaller to larger (hence calculated velocity increase for each try)
will eventually the ratio , become > 1. When this occurs is the correct diameter
found. If the ratio is < 1, the procedure starts over with a little larger diameter.
- This procedure is repeated, giving the size of bubbles which get separated for each segment.
Calculating amount of separated gas
By combining the resulting diameters with the cumulative volume distribution can the separated volume share of each segment be determined. By weighting this with respect to the volume and density of bubbles in the segment, the sum will constitute the total share of initial volume which gets separated.
The procedure is as follows:
- The separated volume percentage share in each segment (Vn(Dn)) is found in the cumulative volume distribution.
- How much of the total volume this accounts for, is found by multiplying Vn with a fraction corresponding to each segment.
- This fraction is a weighting of segment volume fraction and density of bubbles in each segment: Ὂ ·∑ · ,
where Fn=total segment fraction, VFn=segment volume fraction and BDn = density of bubbles in segment
- Hence, the percentage share of the initial gas volume which is separated from each segment is: Ὓ Ὂ · ὠ
- The total percentage share of the initial gas volume which gets separated out from the whole separator is then: ∑ Ὓ
Appendix C
111
Displaying results The results being displayed are:
- Calculated separator properties - Necessary bubble velocity and diameter in each segment - Percentage share of bubbles that gets separated from each segment - Percentage share of initial gas volume that gets separated from each segment - The total percentage share of the initial gas volume that gets separated
Additionally, the script generating the final distribution is called.
Matlab code The code written corresponding to the above explanation is presented below. Note that the calculations are not done in the exact same order as in the explanation and that a few extra calculation procedures are included for simplification due to programming technical reasons.
% Horizontal separator with bubble distribution from specified values. % Retention time as input. run BubbleDistributionInput %Calls the bubble distribution script %Set separator properties: disp(' ') disp('Specify separator properties: ') L=input('Separator length[m]: '); R=input('Separator raduis[m]: '); Q=input('Flowrate[m3/s]: '); t=input('Retention time[s]: '); n=input('number of segments: '); Actot=Q*t/L; %Total liquid cross sectional area % Check if total liquid cross sectional area is bigger than total cross % sectional area of separator: while Actot>pi*(R^2) disp('Liquid height is higher than separator height') t=input('Choose new retention time[s]: '); Actot=Q*t/L; end %Determine theta for total cross section theta=pi/2; diff=1; while diff>0.0001 theta1=(Actot/R^2)+0.5*sin(2*theta); diff=abs(theta1-theta); theta=theta1; end %Calculate the last separator properties: H=R*(1-cos(theta)); Hn=H/n; Vh=Q/Actot;
Appendix C
112
Vhcm=Vh*100; %Display calculated separator properties: disp(' ') disp(['Cross sectional liquid area: ' num2str(Actot) ' m2']) disp(['Liquid height: ' num2str(H) ' m']) disp(['Height of each segment: ' num2str(Hn) ' m']) disp(['Horizontal velocity: ' num2str(Vhcm) ' cm/s']) disp(' ') %Inputs determining the relative density of bubbles in each segment: disp('Specify percent of gas relative to each segment (density of ... bubbles in each segment)') i=1; for i=1:n SegmentPercent(i)=input(['Segment with height from '... num2str((i-1)*Hn) 'm to ' num2str(i*Hn) 'm: ']); end %Procedure for determining the required bubble terminal velocity in each %segment and the corresponding bubble diameter. The diameter is found by %using the correlation by Karamanev: i=1; Vv=[1:1:n]; for i=1:n Vv(i)=((H-Hn*(i-1))/L)*Vh; % Bubble velocity form each segment de(i)=0.0001; prop=1; iterations=1; while prop<1.0001 && n<10000 % Iteration procedure de(i)=de(i)+0.00015; Ar=g*rl*(de(i)^3)*(rl-rg)/(my^2); if Ar<13000 Cd=(432/Ar)*(1+0.0470*(Ar^(2/3)))+0.517/(1+154*(Ar^(-1/3))); else Cd = 0.95; end Re=rl*Vv(i)*de(i)/my; M=g*(my^4)*(rl-rg)/((rl^2)*(sig^3)); Ta=Re*M^0.23; if Ta<=2.11; dedh=1; elseif Ta<=5.46 dedh=1.14*Ta^-0.176; elseif Ta<=16.53 dedh=1.36*Ta^-0.28; else dedh=0.62; end ut1=(((4/3)*g*de(i)/Cd)^0.5)*dedh;
Appendix C
113
prop=ut1/Vv(i); iterations=iterations+1; end i=1+1; end % Adjustments for easier display of results Vv=Vv'; de=de'; Vvcm=Vv*100; demm=de*1000; % Displaying results: % Velocity and corresponding minimum bubble diameter which will % get separated from the bottom of each segment. list=[0:1:n-1]'; Height=list*Hn; result1=horzcat(flipud(Height),flipud(Vvcm),flipud(demm)); disp(' ') disp(['Minimum terminal velocity with corresponding '... 'minimum bubble diameter at each height:']) disp(' ') disp(' H[m] u[cm/s] De[mm]') disp(result1) % Percentage share of bubbles from bottom of each segment that gets % separated: Diapercent=100-interp1(Dmean,CumDiaDist,demm); result2=horzcat(flipud(Height),flipud(Diapercent)); disp(' ') disp('Percentage share of bubbles from each segment that reach surface') disp(' ') disp(' H[m] %') disp(result2) % Percent share of original gas volume in each segment that gets separated: Volumepercent=(100-interp1(Dmean,CumVolDist,demm)); result3=horzcat(flipud(Height),flipud(Volumepercent)); disp(' ') disp('Percent of volume form each segment which is separated') disp(' ') disp(' H[m] %') disp(result3) % Summing up to get the total volume separated. Has to be weighted in order % to include the effect of different volumes and density of bubbles in % each segment: Height2=H-list*Hn; i=1; for i=1:n thetai(i)=acos(1-(Height2(i)/R)); Ac(i)=(R^2)*thetai(i)-0.5*(R^2)*sin(2*thetai(i)); %Total area at height end i=1; for i=1:n-1 Acpart(i)=Ac(i)-Ac(i+1); end
Appendix C
114
Acpart(i+1)=Ac(i+1); Volumepartfraction=Acpart/Actot; i=1; for i=1:n VolumepartfractiontimesSegmentpercent(i)= ... Volumepartfraction(i)*SegmentPercent(i); i=i+1; end Segmentfraction=VolumepartfractiontimesSegmentpercent/ ... sum(VolumepartfractiontimesSegmentpercent); i=1; for i=1:n Segmentseparated(i)=Segmentfraction(i)*Volumepercent(i); i=i+1; end TotVolSep=(sum(Segmentseparated)); TotVolUnsep=100-TotVolSep; % Display the final result: disp(['Amount of gas seperated out: ' num2str(TotVolSep) ' %' ]) disp(['i.e. ' num2str(TotVolUnsep) ' % of the ' ... 'inlet GVF is still in the oil' ]) run EndDistribution2 % Calls the script which generates the final
%distribution:
Appendix C
115
Short explanation of each included script
The separator program consists of 13 scripts. 8 of them are scripts for calculating different scenarios in the two separator configurations (horizontal and vertical). 4 of the scripts are for generating bubble size distributions and the last one can be called the program’s “start menu”, where type of separator and distribution is chosen and on basis of this the corrects scripts are run.
Each script has its distinct name and here is a short explanation of what each of them does.
SeparatorProgram.m
The program starts with this script with the following user inputs:
- Choose horizontal or vertical separator - Choose how to determine bubble size distribution - Choose whether retention time or liquid height in separator should be determined - Set liquid and gas properties
The script corresponding to the choices are then called and run.
BubbleDistributionRayleigh.m
1st bubble size distribution option: It generates a distribution based on a Rayleigh probability distribution. It is also generates a cumulative bubble size and volume distribution.
BubbleDistributionInput.m
2nd bubble size distribution option: It generates a distribution based on input of percentage share of bubbles in set intervals. It is also generates a cumulative bubble size and volume distribution based on these inputs.
Hsep1a.m
Modeling horizontal separator, where bubble size distribution is fetched from BubbleDistributionInput.m and retention time is an input value.
Hsep1b.m
Modeling horizontal separator, where bubble size distribution is fetched from BubbleDistributionInput.m and liquid height in separator is an input value.
Hsep2a.m
Modeling horizontal separator, where bubble size distribution is fetched from BubbleDistributionRayleigh.m and retention time is an input value.
Hsep2b.m
Modeling horizontal separator, where bubble size distribution is fetched from BubbleDistributionRayleigh.m and liquid height in separator is an input value.
Appendix C
116
Vsep1a.m
Modeling vertical separator, where bubble size distribution is fetched from BubbleDistributionInput.m and retention time is an input value.
Vsep1b.m
Modeling vertical separator, where bubble size distribution is fetched from BubbleDistributionInput.m and liquid height in separator is an input value.
Vsep2a.m
Modeling vertical separator, where bubble size distribution is fetched from BubbleDistributionRayleigh.m and retention time is an input value.
Vsep2b.m
Modeling vertical separator, where bubble size distribution is fetched from BubbleDistributionRayleigh.m and liquid height in separator is an input value.
EndDistribution.m
For horizontal separators where BubbleDistributionRayleigh.m (Hsep2a.m and Hsep2b.m) are used, this script is called to generate the bubble size distribution after separation. It is also generates the corresponding cumulative bubble size and volume distribution.
EndDistribution2.m
For horizontal separators where BubbleDistributionInput.m (Hsep1a.m and Hsep1b.m) are used, this script is called to generate the bubble size distribution after separation. It is also generates the corresponding cumulative bubble size and volume distribution.
Appendix C
117
Screenshots
The following pages shoes screenshots from using the model for a horizontal separator where the bubble distribution is generated by the Rayleigh distribution. User inputs are marked in red.
The program starts with this menu, determining case and liquid properties:
The bubble size and volume distribution plots are then displayed:
Appendix C
118
Separator properties are set:
Appendix C
119
The results from these inputs are:
Appendix C
120
The bubble size distributions after separation are then plotted together with the initial one: