74
| Date post: | 08-Jan-2017 |
| Category: |
Investor Relations |
| Upload: | irdigitalrealty |
| View: | 6,936 times |
| Download: | 1 times |


•
•
•
•
•
•
•
•
•
•
•
•
•

••••
•••
•
••
••

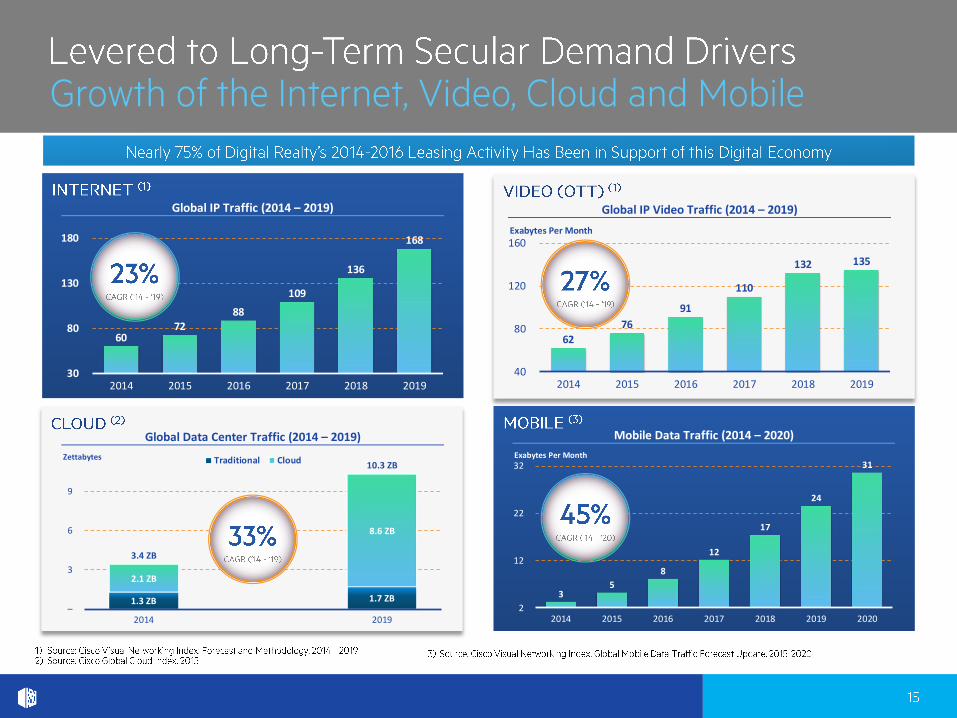
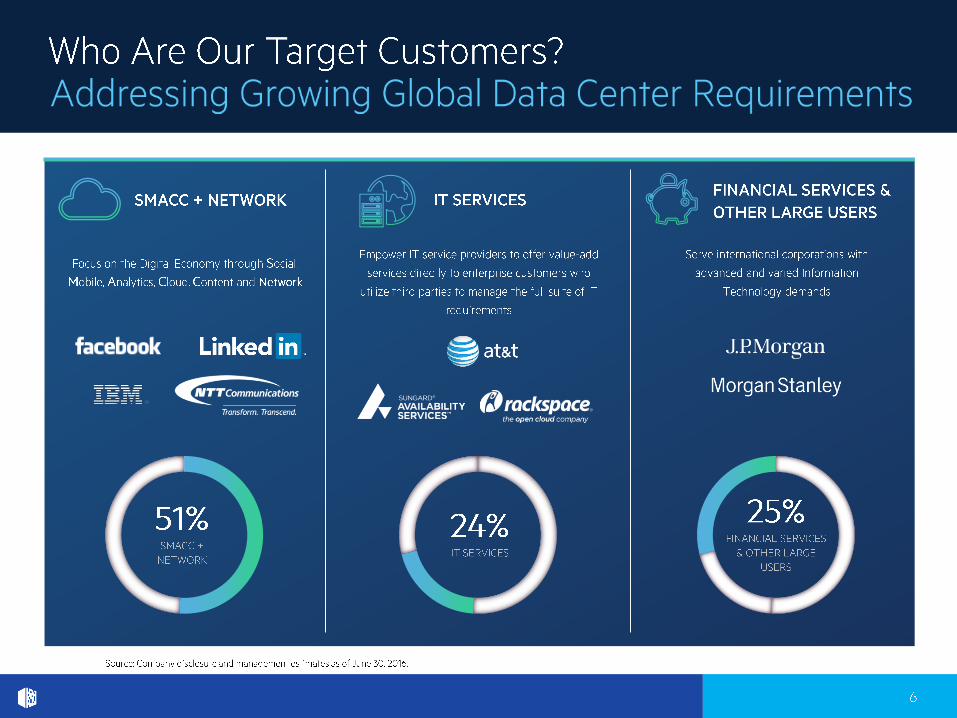
Global IP Traffic (2014 – 2019)
60 72
88
109
136
168
30
80
130
180
2014 2015 2016 2017 2018 2019
Mobile Data Traffic (2014 – 2020)
Exabytes Per Month
3 5
8
12
17
24
31
2
12
22
32
2014 2015 2016 2017 2018 2019 2020
Global IP Video Traffic (2014 – 2019)
Exabytes Per Month
62
76
91
110
132 135
40
80
120
160
2014 2015 2016 2017 2018 2019
Global Data Center Traffic (2014 – 2019)
Zettabytes
1.3 ZB 1.7 ZB
2.1 ZB
8.6 ZB
3.4 ZB
10.3 ZB
–
3
6
9
2014 2019
Traditional Cloud

(3)
(4)


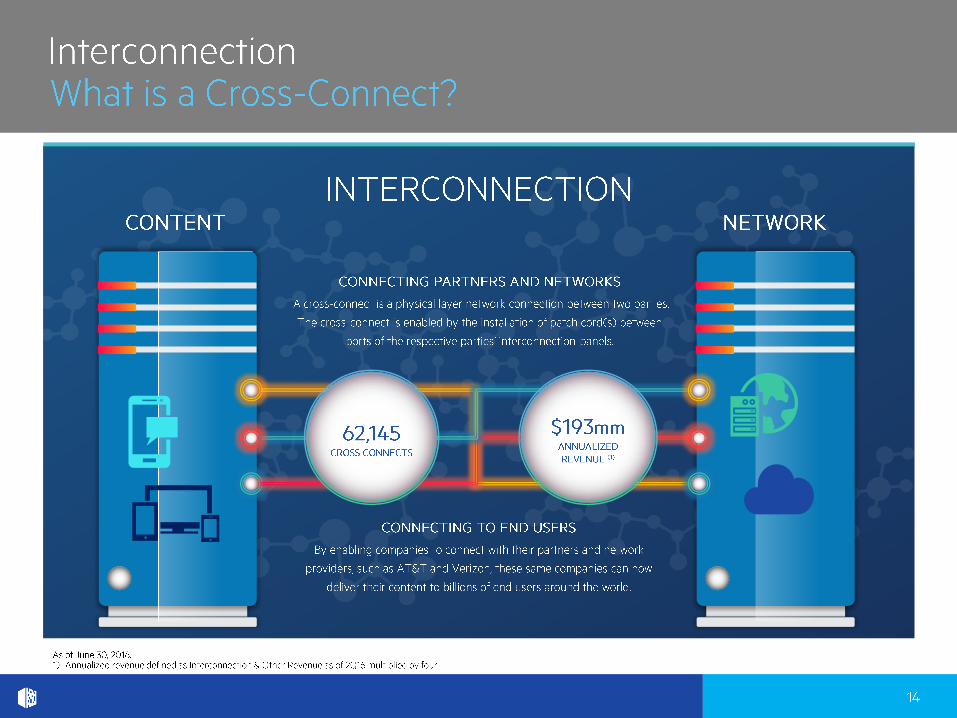
Network Enabled Colocation Services
• Complete solution with common processes for contracting & support
• Combined industry expertise
• Simplified customer experience
AT&T Colocation Services from Digital Realty
• Digital Realty colocation capacity resold by AT&T providing wider geographic coverage and increased reach to enterprise clients
AT&T Network
• Global connectivity
• Network technology leadership


•
•
•
•
•
•
•
•
•
•
•


MW

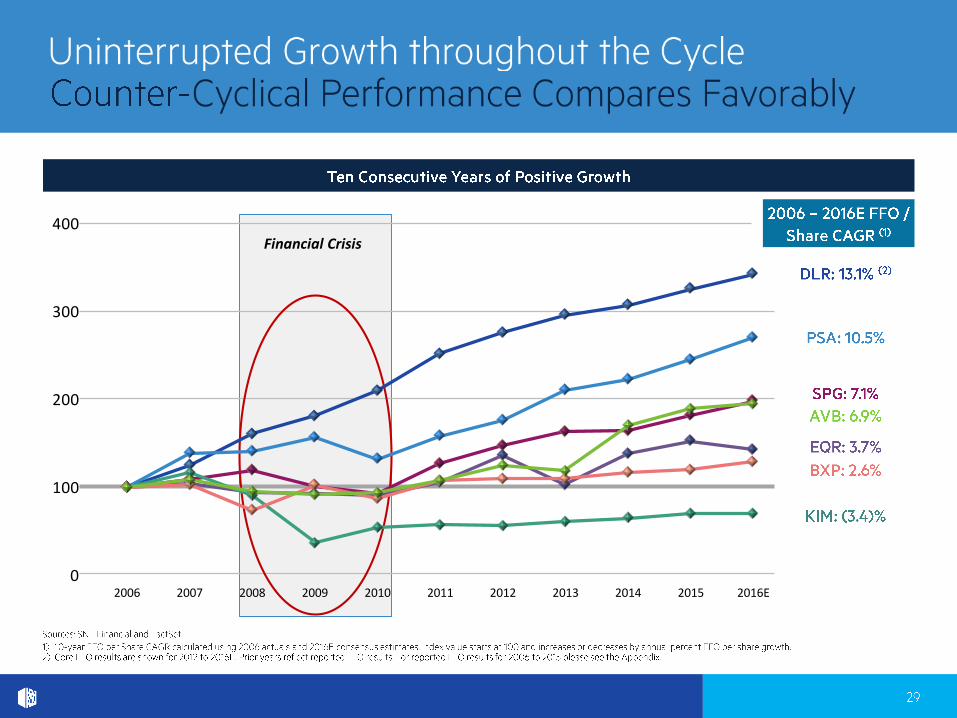
Financial Crisis
0
100
200
300
400
2006 2007 2008 2009 2010 2011 2012 2013 2014 2015 2016E
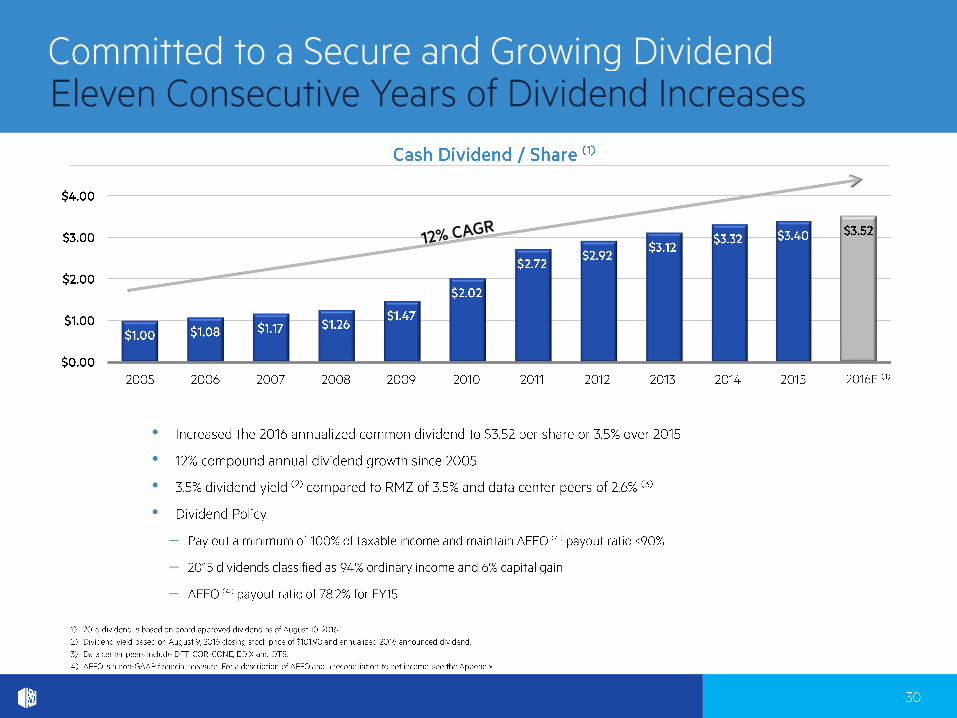
•
•
•
•

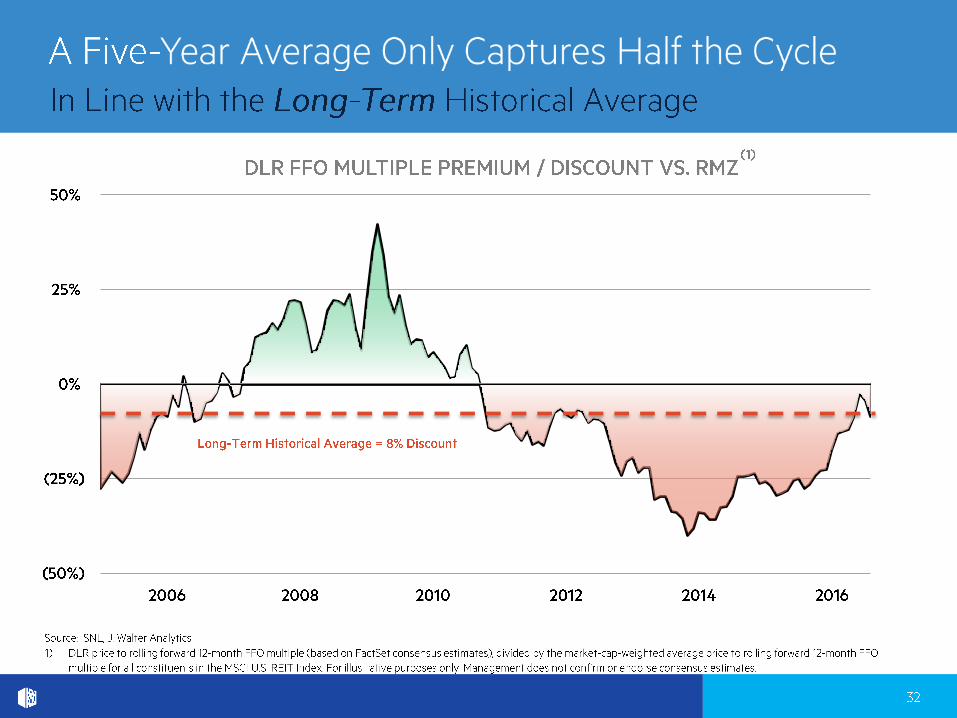


05 06 07 08 09 10 11 12 13 14 15


•
•
•
•
•
••

(1)
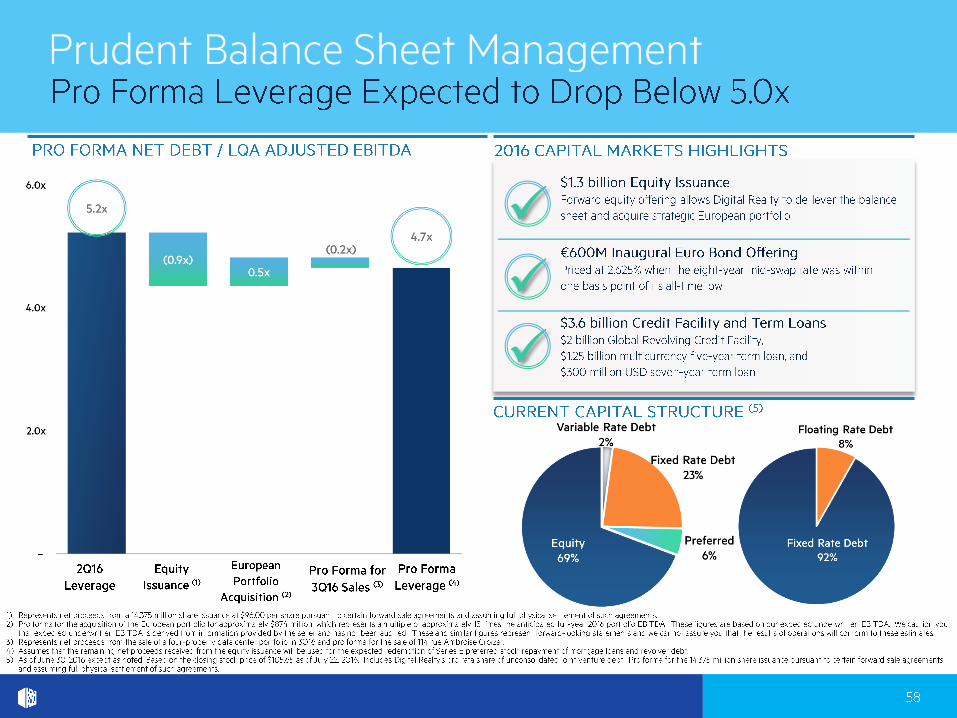
Extended Global Unsecured Revolving Credit Facility and Term Loan Maturities to 2021 and 2023
(3) (4)
(2)


q
q
q
p
p
tu
p
q
q
q
p
p
p
q
q
tu
tu


•
•
•
•
•
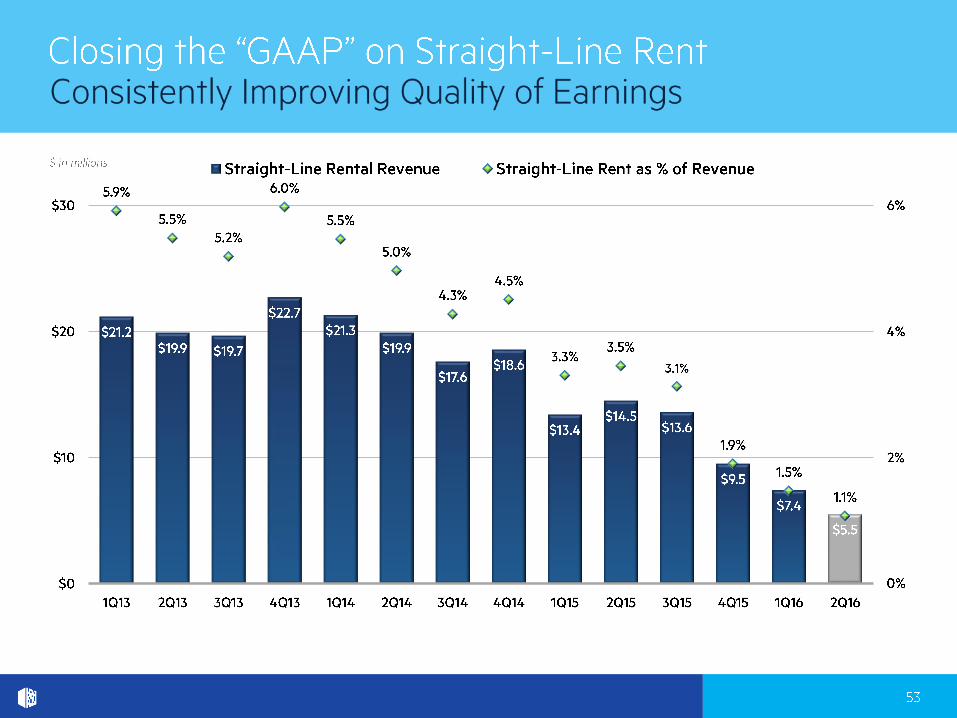
Cash RentChange

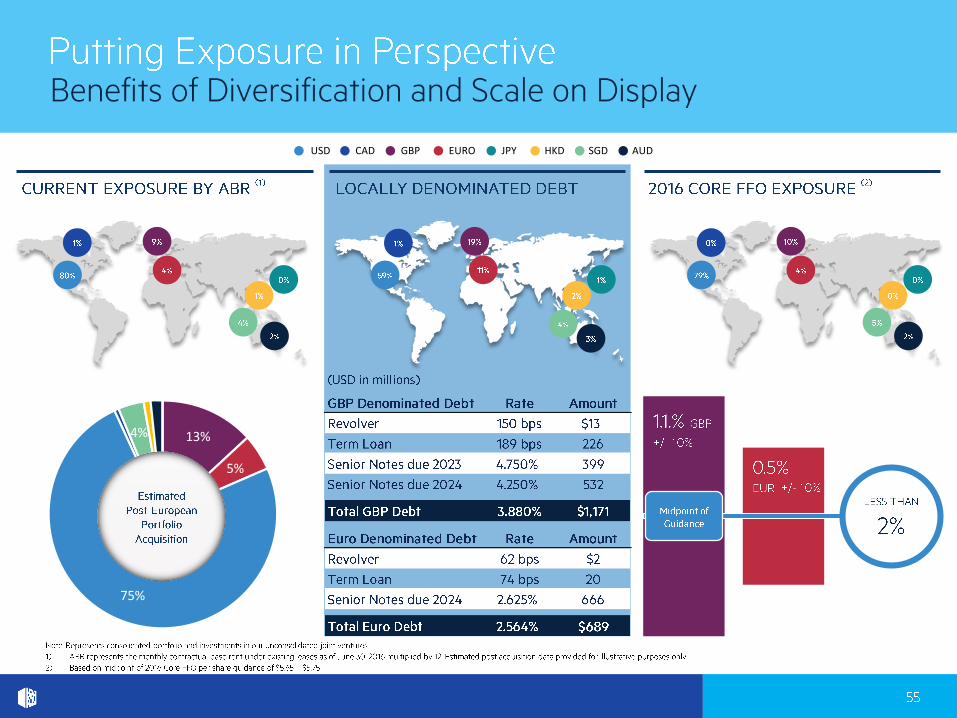
USD CAD GBP EURO JPY HKD SGD AUD
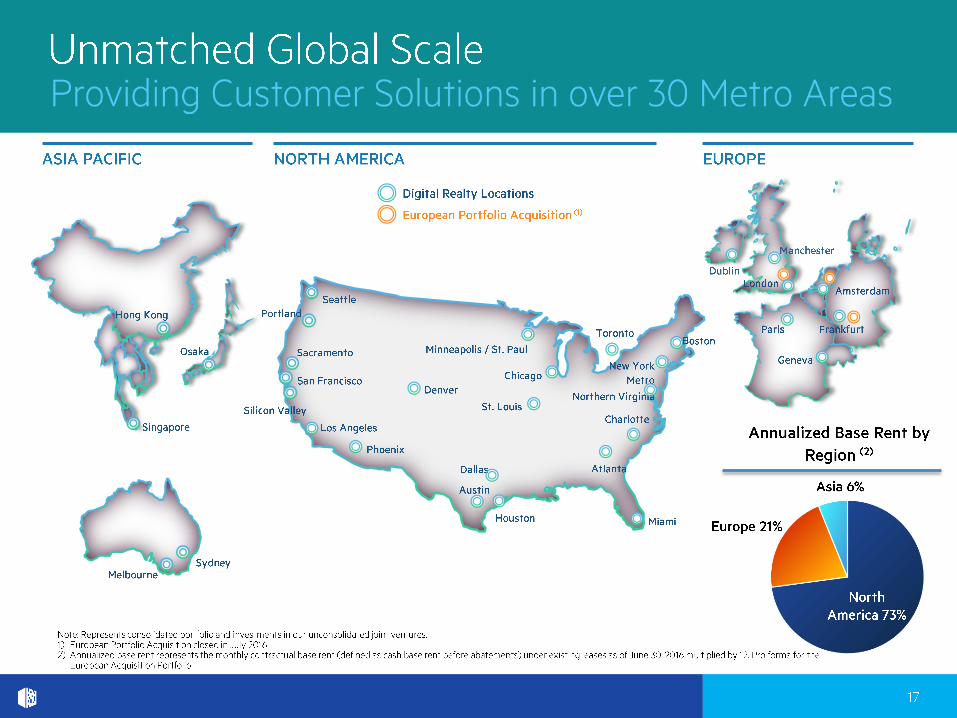
13%
5%
75%
4%
•
•••
••
•••
•
•
•


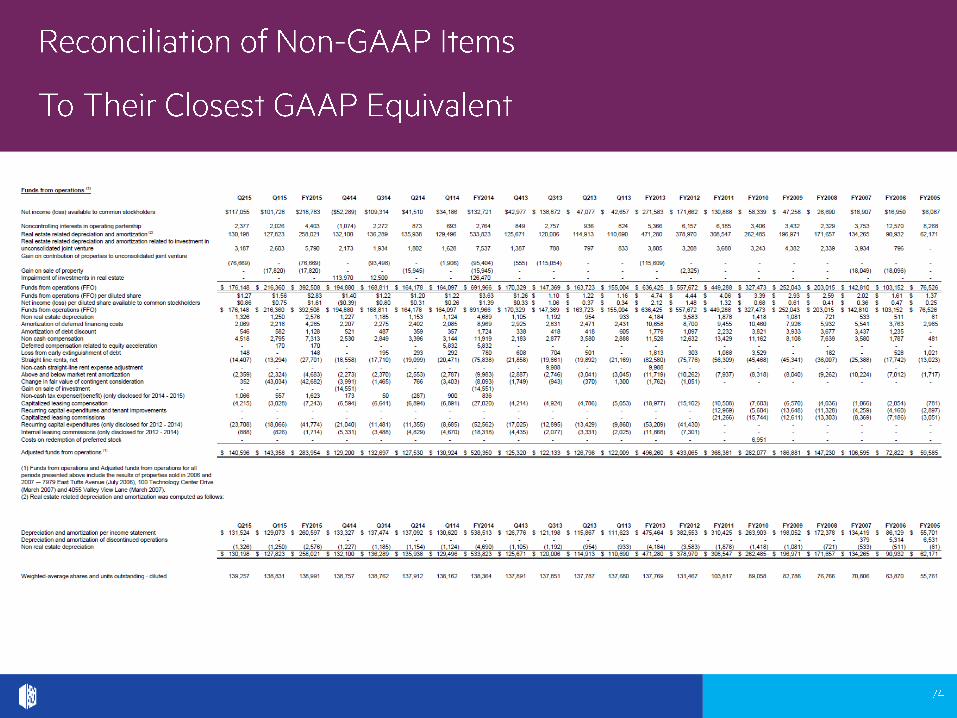
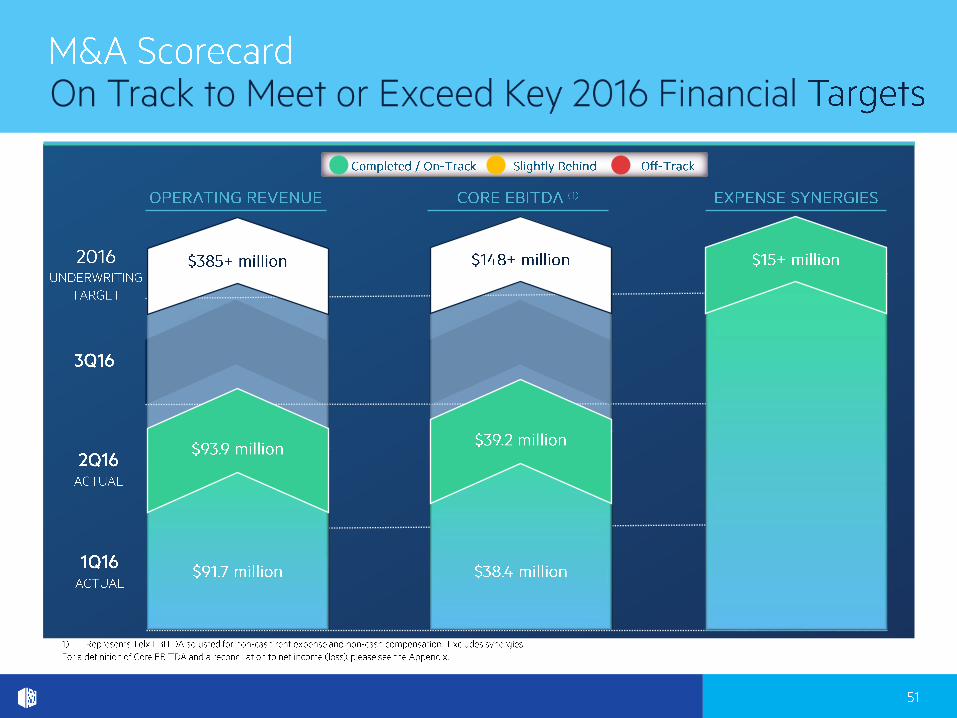
Reconciliation of Core EBITDA
(unaudited)
(in thousands)
Three Months Ended
June 30, 2016
Net Loss ($8,185)
Income Tax Expense (Benefit) 58
Interest Expense, net 857
Depreciation & Amortization 39,996
EBITDA $32,726
Plus: Non-Cash Rent 7,740
Plus: Non-Cash Compensation 429
Plus: Transaction Expenses and Other 707
Less: Synergies (2,395)
Core EBITDA $39,207


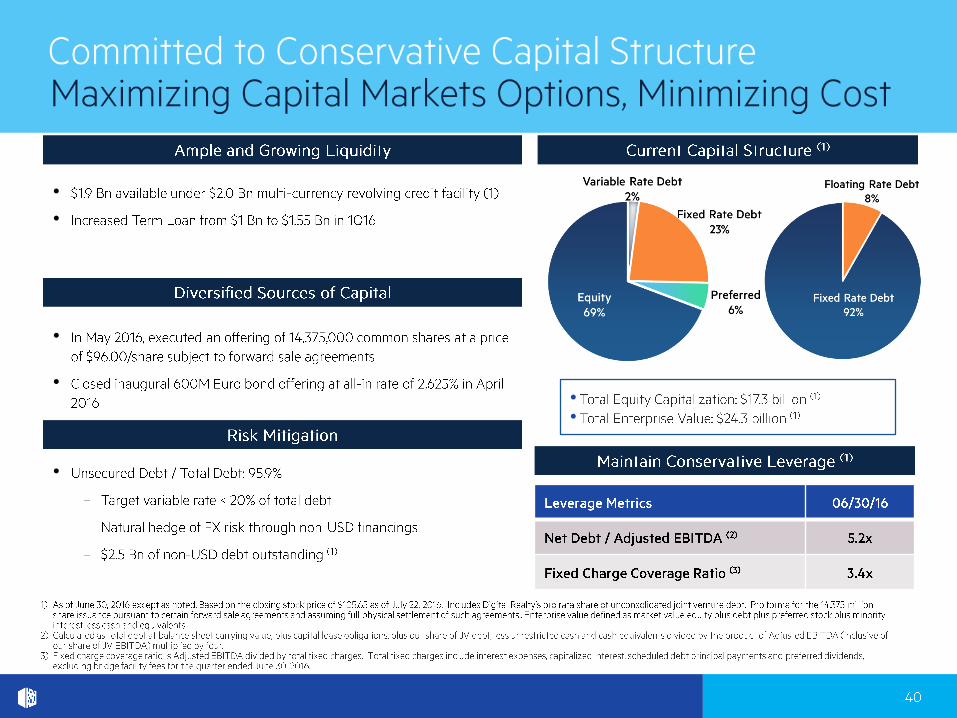
QE 6/30/2016
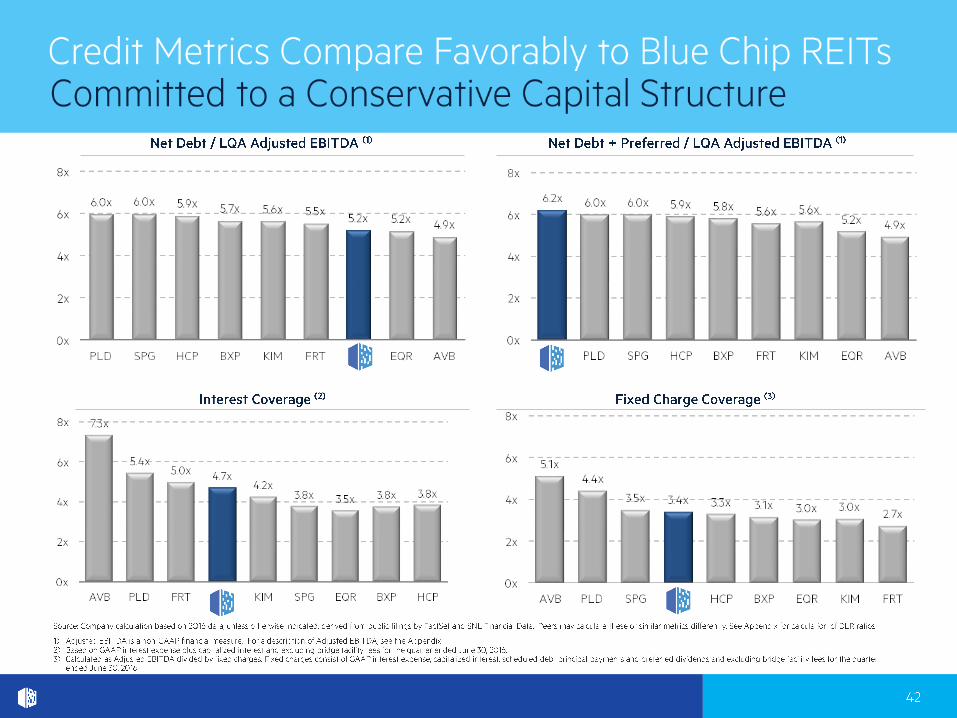
Debt Service Ratio (LQA Adjusted EBITDA/GAAP interest expense plus capitalized interest)
Total GAAP interest expense 59,909
Capitalized interest 3,883
GAAP interest expense plus capitalized interest 63,792
Debt Service Ratio 4.7x
QE 6/30/2016
Fixed Charged Ratio (LQA Adjusted EBITDA/total fixed charges)
GAAP interest expense plus capitalized interest 63,792
Scheduled debt principal payments 1,241
Preferred dividends 22,424
Total fixed charges 87,457
Fixed charge ratio 3.4x
Net Debt Plus Preferred/LQA Adjusted EBITDA QE 6/30/2016
Total debt at balance sheet carrying value 6,135,406
Less: Unrestricted cash (33,241)
Net Debt as of June 30, 2016 6,102,165
Preferred Liquidation Value(iv) 1,335,000
Net Debt plus preferred 7,437,165
Net Debt Plus Preferred/LQA Adjusted EBITDA(i i i ) 6.2x
Total Debt/Total Enterprise Value
Market value of common equity(i )
16,282,694$
Liquidation value of preferred equity(i i )
1,335,000
Total debt at balance sheet carrying value 6,135,406
Total Enterprise Value 23,753,100$
Total debt / total enterprise value 25.8%
(i) Market Value of Common Equity
Common shares outstanding 146,859
Common units outstanding 2,537
Total Shares and Partnership Units 149,396
Stock price as of June 30, 2016 108.99$
Market value of common equity 16,282,694$
(ii) Liquidation value of preferred equity ($25.00 per share)
Shares O/S
Liquidation
Value
Series E Preferred 11,500 287,500
Series F Preferred 7,300 182,500
Series G Preferred 10,000 250,000
Series H Preferred 14,600 365,000
Series I Preferred 10,000 250,000
1,335,000 (iv)

Net Debt/LQA Adjusted EBITDA
QE 6/30/2016
Total debt at balance sheet carrying value 6,135,406$
Add: DLR share of unconsolidated joint venture debt 136,609
Add: Capital lease obligations -
Less: Unrestricted cash (33,241)
Net Debt as of June 30, 2016 6,238,774$
Net Debt / LQA Adjusted EBITDA(i i i ) 5.2x
(iii) Adjusted EBITDA
Net income available to common stockholders 27,951$
Interest expense 59,909
DLR share of unconsolidated joint venture interest expense 1,467
Loss from early extinguishment of debt -
Taxes 2,252
Depreciation and amortization 175,594
DLR share of unconsolidated joint venture depreciation 2,810
EBITDA 269,983$
Severance accrual and equity acceleration and legal expenses 1,508
Transactions 3,615
Loss on currency forwards 3,082
Noncontrolling interests 569
Preferred stock dividends 22,424
Adjusted EBITDA 301,181$
LQA Adjusted EBITDA (Adjusted EBITDA x 4) 1,204,723$
Note: For quarted ended June 30, 2016