51


SEPTA
SERVICE STANDARDS
AND PROCESS
Service Planning Department
July 2014

TABLE OF CONTENTS
PAGE
Introduction 1
SECTION 1: SERVICE STANDARDS COMPONENTS
Service Coverage 2
Transit Stop and Station Spacing 3
Route Performance Guidelines 4
Station Economic Performance 8
Transfers 9
Service Frequency 11
Service Span 14
24-Hour Service 16
Vehicle Loading 18
On-Time Performance 20
Duplicative Service 21
Transit and Regional Rail Passenger Amenities 23
Bus Fleet Assignment 24
Major Service Changes 25
SECTION 2: SERVICE STANDARDS PROCESS
Service Monitoring Procedure 26
Service Request Procedure 28
Implementation of Service Changes 30
Comparative Evaluation Process for Budget-Related Changes 31
Annual Service Plan Process 38
Annual Service Plan Timeline 41
SECTION 3: APPENDICES
Comparative Evaluation Example 42
Unit Cost Assignment of Expenses 45

1
INTRODUCTION
Transit Service Standards are public rules that are used to make decisions about where transit vehicles should run and how often. They form the basis of professional recommendations regarding routing and service proposals. The process of applying Service Standards will be a full and open one, with input and review from the general public, elected officials and planning professionals. Final decisions regarding routing changes would still be made by the SEPTA Board based on all of the facts before them. The application of Service Standards has two major advantages:
1. Identifies the best uses of limited resources by comparing different choices for
these resources. 2. Leads to a fair, equitable, open and objective comparison of all requests and
proposals from the general public, elected officials and SEPTA staff. This document outlines a set of standards and guidelines for their application, for
services operated by SEPTA‟s City Transit, Suburban Transit, Contract Operation services and Regional Rail, along with the process by which these standards are used to evaluate service changes. In order to provide a high level of transit mobility that is affordable by passengers and taxpayers, tradeoffs are required between the costs of and the benefits achieved by providing the service. Service Standards will provide a formal mechanism for making these tradeoffs in an objective and equitable way. This process involves both the continuous monitoring of services and an annual review for possible changes. It provides for input from the general public and elected officials, and ensures that all service changes and proposals are treated fairly and equitably.
An important element of the Service Standards process is the Annual Service
Plan, which identifies changes that are designed to achieve specific service goals and objectives, and identify opportunities for cost-effective service expansion. The Annual Service Plan is tied into the annual SEPTA Operating Budget process and follows a defined process allowing for governmental and public input. Elements of the Annual Service Plan are analyzed through a comparative evaluation process that produces an equitable ranking of routing proposals from both within and outside of SEPTA. The SEPTA route implementation process, which includes public hearings conducted by an independent Hearing Examiner and final approval by the SEPTA Board, is incorporated into the Annual Service Plan process.
The following sections describe the SEPTA Service Standards and procedures
for applying them.
2
SECTION 1: SERVICE STANDARDS COMPONENTS
SERVICE COVERAGE
Guidelines that establish reasonable service coverage for SEPTA‟s route
structure. SEPTA Standard City Transit, Suburban Transit and Contract Operation Routes
An area is considered “well-served” if a stop is no more than ¼ mile (approximately 1,320 feet) from passenger‟s origin point; approximately five minutes walking time and a minimum service frequency of 30 minutes is provided.
An area is considered “served” if a stop is no more than ½ mile (approximately
2,640 feet) from passenger‟s origin point; approximately 10 minutes walking time and a service frequency of at least 30 minutes is provided (60 minutes for Suburban Transit Division). Regional Rail
Not applicable.

3
TRANSIT STOP AND STATION SPACING
Acceptable distance between transit stops categorized by urban and suburban operation. SEPTA Standard City Transit, Suburban Transit and Contract Operation Routes Urban Areas Established Routes: minimum spacing of 500 feet (approximately one city
block). New Routes: minimum spacing of 1,000 feet (approximately two city blocks). Exception: Closer stop spacing will be considered to serve major traffic generators and transfer points or to address specific geographic or demographic conditions.
Suburban Areas
Bus: Minimum spacing of 1,000 feet in residential areas; safe, logical stopping locations at major traffic generators to be established in less dense areas.
Rail: As a general guideline, average station spacing should be no closer than ¼ mile in urbanized areas (first generation suburbs with population densities between 1,000 and 10,000 per square mile). Beyond the first generation suburbs average station spacing should be no closer than ½ mile where population densities are less than 1,000 persons per square mile. In cases where employment densities are greater than population densities, station locations will be governed based on a number of factors such as location, municipal zoning and related comprehensive plans, surrounding land uses, highway and pedestrian access, park and ride and transfer opportunities with other SEPTA services.
Regional Rail
As a general guideline, average station spacing shall be no closer than 0.5 mile in urbanized areas (population density greater than 10,000 per square mile); 1.0 mile in suburban areas (population density between 1,000 and 10,000 per square mile); and 2.0 miles in rural areas (population density less than 1,000 per square mile). NOTE: Express service and service operating on limited-access highways will be exempt from the Stop-Spacing Standard.

4
ROUTE PERFORMANCE GUIDELINES
These guidelines will help measure a route‟s fiscal success or failure. Routes not meeting minimum economic standards are candidates for target marketing, restructuring, service adjustments or discontinuance. SEPTA Standard
Routes will be evaluated according to the following criteria:
Fully allocated cost
Passenger revenue and specific route subsidies
Operating ratio (passenger revenue fully allocated costs).
A ranking of routes will be compiled annually. Routes will be ranked on an operating ratio basis from greatest to least. The minimum operating ratio standard for a route is 60% of the average operating ratio within the operating division, which will exclude the Market-Frankford and Broad Street Lines for City Transit and the Norristown High Speed Line for Suburban Transit routes. The average operating ratio is a weighted average and includes all service operated by each operating division. Additionally, the minimum operating ratio standard for City Transit routes that have suburban route characteristics is 60% of the combined average of the City Transit and Suburban Transit operating ratios. The table following “Service Frequency” standard entitled “Routes by Mode of Operation” classifies the transit routes into urban and suburban categories.
A route performing below the minimum operating ratio standard will be evaluated
as part of an Annual Service Plan. A recommendation will be made for service adjustments, route restructuring, consolidations, special subsidies, or possible discontinuance. A targeted marketing effort will be undertaken prior to proposing the discontinuance of any route.
For each operating division, the Annual Service Plan includes a ranking of
routes, lines and stations in the Appendices under Annual Route and Station Economic Performance. The ranking is preceded by definitions for terms and a list of unit costs used in the rankings.

5
ROUTE PERFORMANCE GUIDELINES Exceptions
1. Any route or portion of a route where the deficit for that service is subsidized by
sources outside of the regular SEPTA operating budget. These routes are footnoted in the Annual Performance Review chart in the Annual Service Plan document.
2. A route which provides the only service coverage for an area of the region, the
discontinuance of which would violate the “service coverage” standards. An aggressive marketing effort, with community involvement, would be undertaken in an attempt to bring the route up to minimum standards.
3. Qualitative Review
Routes that consistently rank below their respective economic performance standard should also be subject to a qualitative analysis. This approach incorporates additional route considerations beyond purely quantitative factors. A temporary exemption from corrective strategies may be granted to a route performing below the minimum standard pending the completion of a qualitative analysis.
Qualitative factors to be considered include, but are not limited to, local geography/topography, the availability of transit alternatives, the presence of significant trip generators, and the demographic characteristics of the area population, as described in further detail under item 4.
A route that is considered to have mitigating qualitative factors associated with it is exempted from the Service Standards process for one fiscal year. However, should this route continue to fall below the minimum economic performance standard for the following fiscal year, appropriate action can be taken per the Service Standards process.
4. Qualitative Factors
Geography/Topography
Consider any obstacles impeding access to alternative transit service, such as waterways, limited access highways, railroads, significant gradient changes or an incomplete street network.
Establish the actual distance, after negotiating any potential obstacles, required to reach alternative transit service, and whether this would change the Service Coverage definition of the area.

6
ROUTE PERFORMANCE GUIDELINES
Availability of Transit Alternatives
Examine the characteristics of any alternate transit service(s)
Determine if overcrowding would become an issue should the route subject to qualitative review be reduced in service or discontinued
Consider the level of accommodation afforded to mobility-challenged individuals by alternate transit service, such as the number of stairs required to board a vehicle
Significant Trip Generators
In combination with stop / station usage data, evaluate the location and impact on ridership of any significant trip generators along the route
A diverse range of land use functions can be considered potential trip generators including, but not limited to; employment centers, shopping/ retail centers, educational facilities, medical institutions, government/community facilities, tourist attractions, and high-density residential complexes
Examine the extent to which alternate transit service can provide access to these destinations
Particular attention should be paid to facilities providing „essential functions‟, such as hospitals, social service facilities or health/wellness centers, and also those facilities for which there is no alternate location assessable to the local population
Consider the role the route may play in connecting to the larger transit network. Important transfer points and intermodal connections should be given additional review
Population Demographics
With the use of Geographic Information Systems (GIS), map the area served in order to identify which areas are “served” or “well served” under Service Coverage definitions, and how this would change should the route be discontinued
Determine if the Service Coverage for the surrounding area is an appropriate reflection of the respective population and employment densities

7
ROUTE PERFORMANCE GUIDELINES
Population Demographics (continued)
Make sure that any particular population segment, such as senior citizens, persons with disabilities, or ethnic minorities would not be disproportionately affected by any changes to the route

8
STATION ECONOMIC PERFORMANCE
Standard for measuring a station‟s economic success or failure. SEPTA Standard City Transit, Suburban Transit and Contract Operation Routes
Not applicable. Regional Rail
The minimum economic performance standard for a station is 75 daily boardings or alighting passengers. A station failing to meet this minimum standard will be targeted for evaluation as part of a future Annual Service Plan. A recommendation will be made for service adjustments, special subsidies and/or target marketing prior to proposing the discontinuance of any station. Exceptions
Adjacent Stations: Where adjacent stations fall below Standard, marketing of both stations will occur to increase awareness, and then an evaluation will be performed to determine the best course of action including retention, consolidation, service reduction or lastly, closure of one of the two adjacent facilities. Parking availability at both stations will be considered as part of the evaluation.
External Funding: If an outside source of funding can be secured to offset the costs of operating a station, the station may be exempted from the Standard as long as the outside funding source covers a reasonable (minimum 50%) portion of the cost necessary to operate the facility.
Capital Improvements: Stations may be exempted from the Standard if significant capital improvements have been made to the station or parking facilities.
Station Spacing: Stations may be exempted from the Standard if their discontinuance would result in an unreasonable distance between remaining stations. This distance will be determined on a case by case basis taking in account geographic barriers like waterways and land elevations.
Alternative Transit for Walk-Up Stations: Stations that have a predominance of walk-up riders and lack another transit alternative may be excepted unless a reasonable transit alternative is provided.

9
TRANSFERS Many passengers must transfer from one transit route to another in order to
reach their destinations. Much of SEPTA‟s City Transit services operate in a grid system of “crosstown” bus and trackless trolley routes which connect to the Market-Frankford and Broad Street Lines. In this manner, most customers are provided with a faster ride to their final destination by connecting to the faster rail lines. SEPTA City Transit also has several Transportation Centers at the outermost rail stations where connections can be easily made between routes, whether bus to rail or bus to bus. The need to make connections between routes is found in most major cities, and it enables SEPTA to efficiently provide more service to more people and with greater frequency, when compared to a system which attempts to serve all trips with a one seat ride.
Many of our Suburban services are also oriented to making connections at Transportation Centers or major activity centers such as regional shopping malls. This enables connectivity between routes which effectively multiplies the coverage area available to residents of our region seeking to make trips for work, school, medical and recreational reasons.
SEPTA Standard City Transit, Suburban Transit and Contract Operation Routes
During periods of wide headways, surface vehicle schedules on major routes are coordinated with High Speed Lines at major stations, terminals and transportation centers. Surface operators are instructed to await passengers from High Speed vehicles at stations where “blue lights” or other forms of notification indicate train arrivals.
Timed surface-to-surface transfers are scheduled on major routes during off-
peak periods as determined by established travel patterns. Surface transit and regional rail schedules are coordinated at several locations
with an ongoing effort underway to identify additional locations where these connections can be improved.
In 1988, SEPTA Service Planners developed an unconventional approach in
planning bus feeder services that departed from the traditional methods of planning radial bus routes. Major activity centers such as office, industrial parks, or commercial developments were linked in close proximity to Regional Rail stations. These routes were designated as “200 Series” routes and utilize the following methodology:
Routes are coordinated to meet reverse-commute regional rail trains from Philadelphia, with service frequencies generally matching the corresponding rail line

10
TRANSFERS
Capacity exists on reverse-peak trains from Philadelphia to accommodate riders
Schedules are designed so that the bus would be in the station when passengers disembarked from the train. Buses would wait for delayed trains
Buses transporting passengers back to the rail station would arrive at least five minutes prior to the scheduled train departure time
Discounted fare instruments such as TransPasses, TrailPasses, tokens and bus transfers are honored on any “200 Series” route
Regional Rail
Due to the unique nature of scheduling trains through the Center City Commuter Tunnel and accounting for Amtrak trains along the Northeast Corridor and the Harrisburg Line, it is operationally and fiscally not possible to create dedicated transfers between Regional Rail lines at key junction points. Occasions may arise when unintentional connections are made with Regional Rail lines. The exception being the Airport Line, which operates at a greater frequency on weekdays and weekends, providing more transfer opportunities.
SEPTA collaborates with New Jersey Transit (NJT) to coordinate schedules between the Trenton Line and Northeast Corridor Line at Trenton Transit Center.
Coincidental connections are made with intersecting City Transit, Suburban Transit and Contract Operation routes. Dedicated connections are made only with “200 Series” bus routes as described previously.

11
SERVICE FREQUENCY
Maximum acceptable frequency time period between trips categorized by mode and service type. SEPTA Standard
The charts on the following pages outline SEPTA‟s Service Frequency Standard by time of day and day of week. This standard will establish policy frequencies for SEPTA service, not demand frequencies which will be set through the Service Monitoring Process. For routes and lines not meeting the minimum standard, a program will be implemented to bring the routes up to standard. This program will phase in improvements on an incremental basis over several years in accordance with available financial resources. NOTES: 1. Some routes and lines operate limited weekday or weekend service. These routes are exempt from the Service Frequency Standard. 2. Some routes may not operate on Saturdays and/or Sundays. If a route does
operate on Saturdays and/or Sundays then minimum policy headways would govern frequency offered.
12
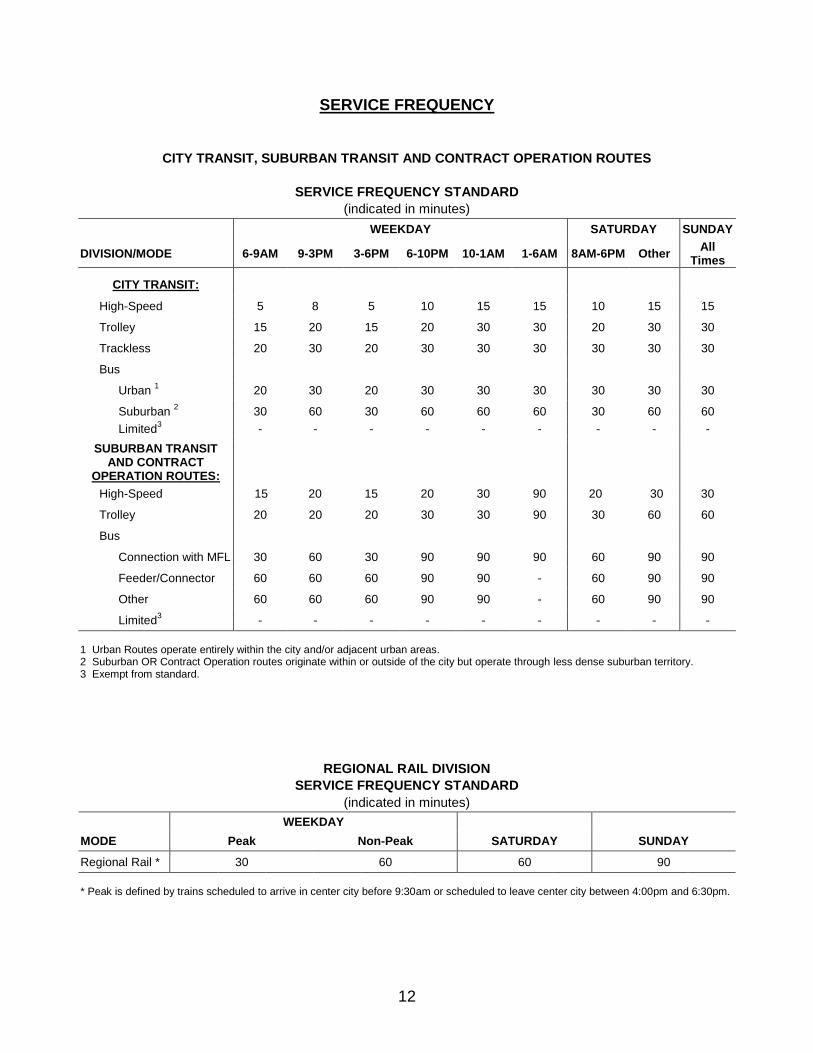
SERVICE FREQUENCY
CITY TRANSIT, SUBURBAN TRANSIT AND CONTRACT OPERATION ROUTES
SERVICE FREQUENCY STANDARD
(indicated in minutes)
WEEKDAY SATURDAY SUNDAY
DIVISION/MODE 6-9AM 9-3PM 3-6PM 6-10PM 10-1AM 1-6AM 8AM-6PM Other All
Times
CITY TRANSIT:
High-Speed 5 8 5 10 15 15 10 15 15
Trolley 15 20 15 20 30 30 20 30 30
Trackless 20 30 20 30 30 30 30 30 30
Bus
Urban 1 20 30 20 30 30 30 30 30 30
Suburban 2 30 60 30 60 60 60 30 60 60
Limited3 - - - - - - - - -
SUBURBAN TRANSIT AND CONTRACT
OPERATION ROUTES:
High-Speed 15 20 15 20 30 90 20 30 30
Trolley 20 20 20 30 30 90 30 60 60
Bus
Connection with MFL 30 60 30 90 90 90 60 90 90
Feeder/Connector 60 60 60 90 90 - 60 90 90
Other 60 60 60 90 90 - 60 90 90
Limited3 - - - - - - - - -
1 Urban Routes operate entirely within the city and/or adjacent urban areas. 2 Suburban OR Contract Operation routes originate within or outside of the city but operate through less dense suburban territory. 3 Exempt from standard.
REGIONAL RAIL DIVISION
SERVICE FREQUENCY STANDARD
(indicated in minutes)
WEEKDAY
MODE Peak Non-Peak SATURDAY SUNDAY
Regional Rail * 30 60 60 90
* Peak is defined by trains scheduled to arrive in center city before 9:30am or scheduled to leave center city between 4:00pm and 6:30pm.

13
SERVICE FREQUENCY
ROUTES BY MODE OF OPERATION
Spring 2014 (subject to change)
DIVISION/MODE ROUTES
CITY TRANSIT:
High Speed Market-Frankford Line, Broad Street Line & Broad-Ridge Spur
Trolley 10, 11, 13, 15, 34, 36
Trackless 59, 66, 75
Bus
Urban 1, 2, 3, 4, 5, 6, 7, 8, 12, 16, 17, 18, 21, 23, 25, 26, 29, 30, 31, 32, 33, 38, 39, 40, 42, 43, 46, 47, 47m, 48, 52, 53, 54, 56, 57, 59, 60, 61, 62, 64, 65, 73, 79, 89, G, H, J, K, L, R, XH, LUCY
Suburban 9, 14, 19, 20, 22, 24, 27, 28, 35, 37, 44, 50, 55, 58, 67, 68, 70, 77, 84, 88
Limited 78, 80, 400, 401, 405, 406, 408, 409, 411, 415, 425, 426, 428, 433, 438, 439, 441, 442, 443, 445, 446, 447, 448, 450, 452, 454, 461, 462, 475, 476, 477, 478, 481, 482, 483, 484, 487, 490, 492, 495, 496
SUBURBAN TRANSIT AND CONTRACT OPERATION
ROUTES:
High Speed Norristown High Speed Line
Trolley 101, 102
Bus
Connection with MFL 103, 104, 105, 106, 107, 108, 109, 110, 111, 112, 113, 120, 123, 126
Feeder/Connector 201, 204, 205, 206, 310
Other 90, 92, 93, 94, 95, 96, 97, 98, 99, 114, 115, 117, 118, 119, 124, 125, 127, 128, 129, 130, 131, 132, 139
Limited 91, 116, 133, 150, Cornwells Heights Parking Shuttle
REGIONAL RAIL:
Regional Rail
Airport Line, Wilmington/Newark Line, Warminster Line, Media/Elwyn Line, West Trenton Line, Paoli/Thorndale Line, Lansdale/Doylestown Line, Cynwyd Line, Manayunk/Norristown Line, Trenton Line, Chestnut Hill East Line, Chestnut Hill West Line, Fox Chase Line
14
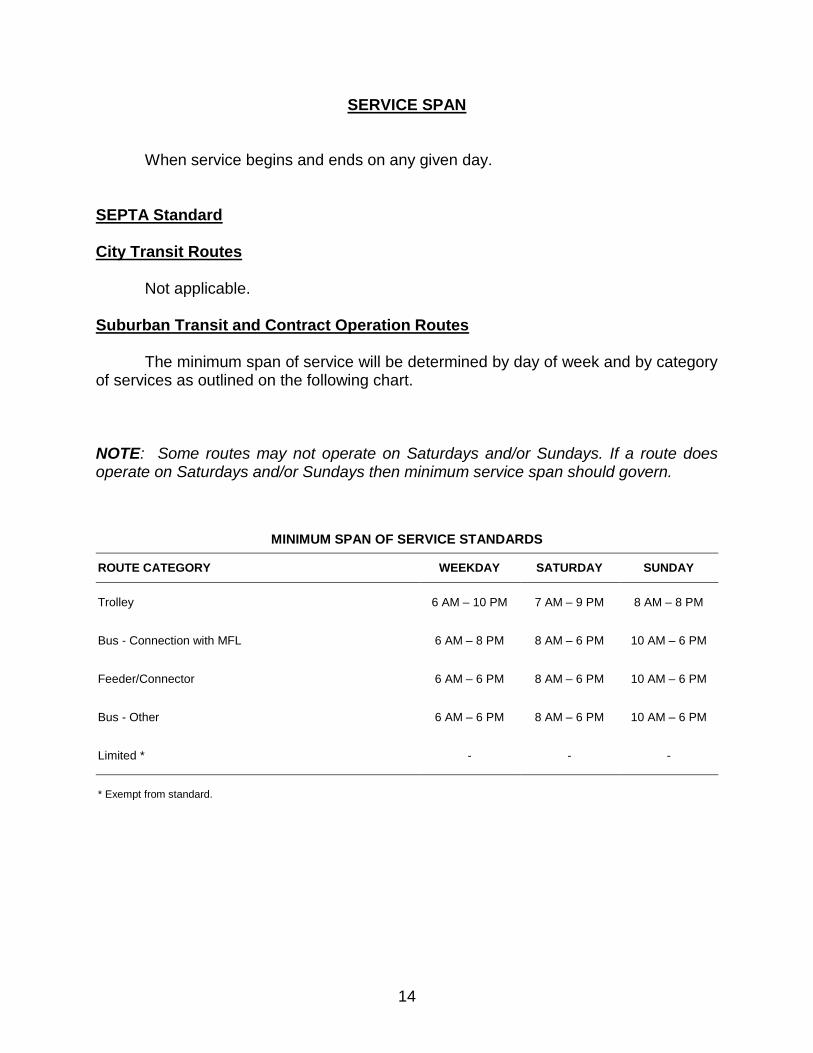
SERVICE SPAN
When service begins and ends on any given day. SEPTA Standard City Transit Routes
Not applicable. Suburban Transit and Contract Operation Routes
The minimum span of service will be determined by day of week and by category of services as outlined on the following chart. NOTE: Some routes may not operate on Saturdays and/or Sundays. If a route does operate on Saturdays and/or Sundays then minimum service span should govern.
MINIMUM SPAN OF SERVICE STANDARDS
ROUTE CATEGORY WEEKDAY SATURDAY SUNDAY
Trolley 6 AM – 10 PM 7 AM – 9 PM 8 AM – 8 PM
Bus - Connection with MFL 6 AM – 8 PM 8 AM – 6 PM 10 AM – 6 PM
Feeder/Connector 6 AM – 6 PM 8 AM – 6 PM 10 AM – 6 PM
Bus - Other 6 AM – 6 PM 8 AM – 6 PM 10 AM – 6 PM
Limited * - - -
* Exempt from standard.

15
SERVICE SPAN Regional Rail
Service will begin no later than and end no earlier than the time indicated in the table below. Service span violations are listed below. NOTE: All routes may not be scheduled to operate seven days a week. If a route is scheduled to operate on Saturday and/or Sunday, then the span of service should meet the minimum standard set in above table.
SERVICE SPAN BY DAY OF WEEK
SUBURBAN STATION WEEKDAYS SATURDAYS SUNDAYS
First Arrival 7:00 AM 8:00 AM 9:00 AM
Last Departure 11:00 PM 10:00 PM 9:00 PM
First Departure 7:00 AM 8:00 AM 9:00 AM
Last Arrival 11:00 PM 10:00 PM 9:00 PM
LINE VIOLATION
Airport no violations
Wilmington/Newark Sundays, last departure before 9:00 PM (8:34 PM)
Sundays, first arrival after 9:00 AM (9:31 AM)
Warminster no violations
Media/Elwyn Sundays, first departure after 9:00 AM (9:10 AM)
West Trenton no violations
Paoli/Thorndale no violations
Lansdale/Doylestown no violations
Cynwyd Weekdays, last departure before 11:00 PM (7:59 PM)
Weekdays, Last arrival before 11:00 PM (7:24 PM)
Manayunk/Norristown no violations
Trenton no violations
Chestnut Hill East no violations
Chestnut Hill West no violations
Fox Chase no violations
NOTE: Information based on schedules effective February 10, 2013. Times noted are from Suburban Station.

16
24-HOUR SERVICE Standard for frequency of the route network providing 24-hour service. This route
network is commonly referred to as “Owl” service. Transit routes in the “Owl” network are listed on the following page. SEPTA STANDARD City Transit, Suburban Transit and Contract Operation Routes
The minimum acceptable frequency interval between trips on 24-hour “Owl” routes is 30 minutes for City Transit routes and 90 minutes for Suburban Transit and Contract Operation Routes.
The City Transit network is designed to assure mobility to most parts of the City at all times. Suburban Transit “Owl” routes (or future establishment of “Owl” service for Contract Operation routes) are based on the following factors:
A route links dense residential and commercial activity centers that have a high propensity of transit usage
Ridership proves to be historically strong (exceeding 3,500 weekday passenger trips per day)
Spans of scheduled service generally exceed the established minimum standards
Operating ratio (fully allocated) consistently exceeds 50% over several fiscal years
Service is established through either resource reallocation or through external funding sources (such as Job Access and Reverse Commuting Grants from the Federal Transit Administration)
Regional Rail
Not Applicable.

17
24-HOUR SERVICE
24-HOUR SERVICE - OWL NETWORK *
(subject to change)
AVERAGE
FREQUENCY
ROUTE ENTITY SERVICE (minutes)
BSL City Transit AT & T Station to Fern Rock Transportation Center
(operated by bus) 15
MFL City Transit Frankford Transportation Center to 69th Street Transportation Center
(operated by bus) 15
G City Transit Food Center to 59th
-Columbia 35
R City Transit Wissahickon Transportation Center to Frankford Transportation
Center 30
6 City Transit Cheltenham-Ogontz to Olney Transportation Center 60
10 City Transit 15th-Market to 63rd
-Malvern 30
13 City Transit 15th
-Market to Yeadon 35
14 City Transit Neshaminy Mall to Frankford Transportation Center 60
15 City Transit 63rd
-Girard to Richmond-Westmoreland 30
17 City Transit Front-Market to 20th & Johnston 30
20 City Transit Parx Casino or Knights-Mechanicsville to Frankford Transportation
Center 60
23 City Transit Germantown-Ontario to Chestnut Hill 30
33 City Transit Front-Market to 23rd
-Venango 35
36 City Transit 15th-Market to 73rd & Elmwood 30
42 City Transit 5th-
Walnut or 10th
-Walnut to Wycombe or 61st-Pine 35
47 City Transit Whitman Plaza to 5th
-Godfrey 45
52 City Transit 49th
-Woodland to 54th
-City 30
56 City Transit 23rd
-Venango to Torresdale-Cottman 60
60 City Transit 35th
-Allegheny to Richmond-Westmoreland 30
66 City Transit Frankford-Knights to Frankford Transportation Center 30
73 City Transit Richmond-Westmoreland to Frankford Transportation Center 60
79 City Transit Columbus Commons to 29th
-Snyder 60
108 Suburban Transit
UPS to 69th Street Transportation Center 60
109 Suburban Transit
Chester Transportation Center to 69th Street Transportation Center 70
* -- Some origins and destinations reflect the “Owl” service coverage and not the full route name shown on the public timetables
18
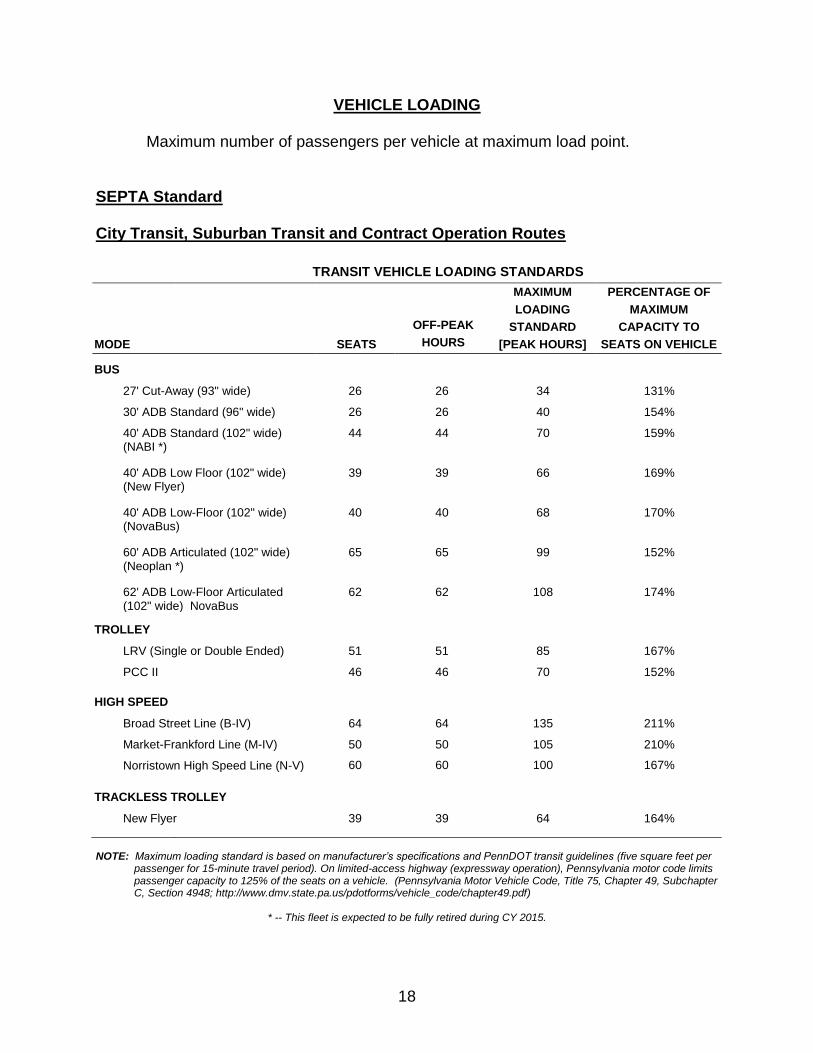
VEHICLE LOADING
Maximum number of passengers per vehicle at maximum load point. SEPTA Standard City Transit, Suburban Transit and Contract Operation Routes
TRANSIT VEHICLE LOADING STANDARDS
MAXIMUM PERCENTAGE OF
LOADING MAXIMUM
OFF-PEAK STANDARD CAPACITY TO
MODE SEATS HOURS [PEAK HOURS] SEATS ON VEHICLE
BUS
27' Cut-Away (93" wide) 26 26 34 131%
30' ADB Standard (96" wide) 26 26 40 154%
40' ADB Standard (102" wide) (NABI *)
44 44 70 159%
40' ADB Low Floor (102" wide) (New Flyer)
39 39 66 169%
40' ADB Low-Floor (102" wide) (NovaBus)
40 40 68 170%
60' ADB Articulated (102" wide) (Neoplan *)
65 65 99 152%
62' ADB Low-Floor Articulated (102" wide) NovaBus
62 62 108 174%
TROLLEY
LRV (Single or Double Ended) 51 51 85 167%
PCC II 46 46 70 152%
HIGH SPEED
Broad Street Line (B-IV) 64 64 135 211%
Market-Frankford Line (M-IV) 50 50 105 210%
Norristown High Speed Line (N-V) 60 60 100 167%
TRACKLESS TROLLEY
New Flyer 39 39 64 164%
NOTE: Maximum loading standard is based on manufacturer’s specifications and PennDOT transit guidelines (five square feet per
passenger for 15-minute travel period). On limited-access highway (expressway operation), Pennsylvania motor code limits passenger capacity to 125% of the seats on a vehicle. (Pennsylvania Motor Vehicle Code, Title 75, Chapter 49, Subchapter C, Section 4948; http://www.dmv.state.pa.us/pdotforms/vehicle_code/chapter49.pdf)
* -- This fleet is expected to be fully retired during CY 2015.
19
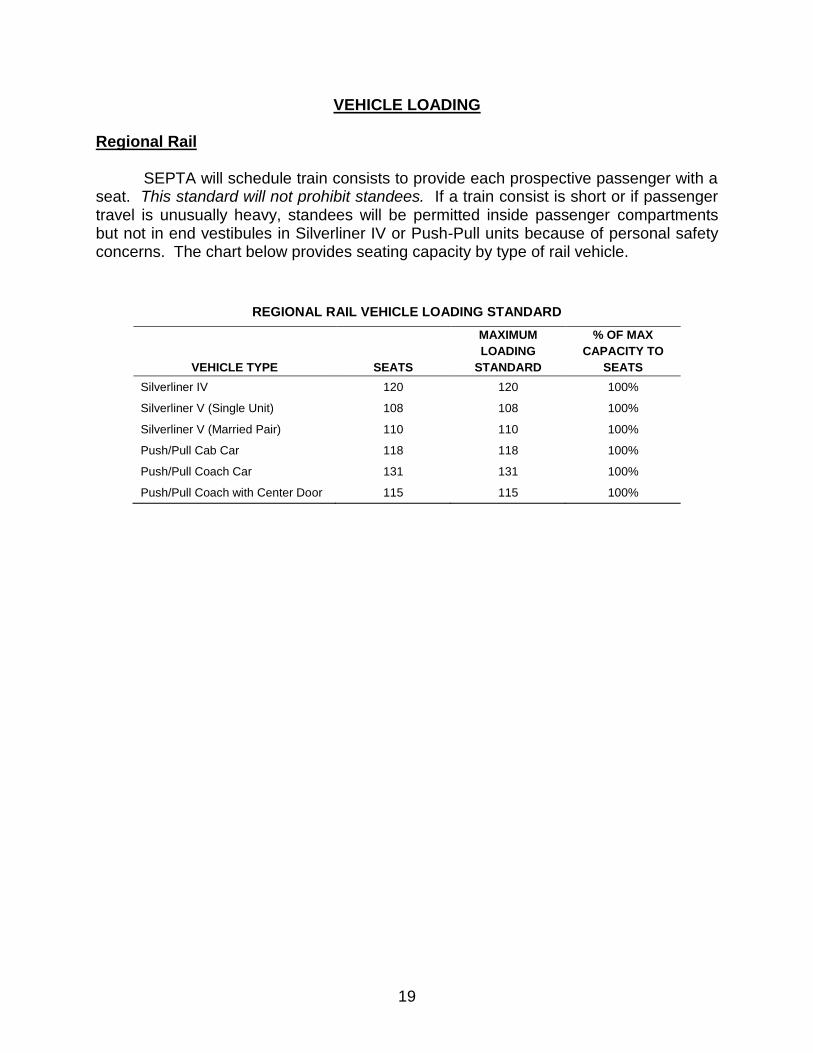
VEHICLE LOADING Regional Rail SEPTA will schedule train consists to provide each prospective passenger with a seat. This standard will not prohibit standees. If a train consist is short or if passenger travel is unusually heavy, standees will be permitted inside passenger compartments but not in end vestibules in Silverliner IV or Push-Pull units because of personal safety concerns. The chart below provides seating capacity by type of rail vehicle.
REGIONAL RAIL VEHICLE LOADING STANDARD
MAXIMUM % OF MAX
LOADING CAPACITY TO
VEHICLE TYPE SEATS STANDARD SEATS
Silverliner IV 120 120 100%
Silverliner V (Single Unit) 108 108 100%
Silverliner V (Married Pair) 110 110 100%
Push/Pull Cab Car 118 118 100%
Push/Pull Coach Car 131 131 100%
Push/Pull Coach with Center Door 115 115 100%

20
ON-TIME PERFORMANCE
For all transit modes, on-time performance measures schedule adherence. “On-time” is defined as 0-5:59 minutes late. Scheduled trips operating late are defined as six minutes, or more, after the published time. Running ahead of schedule is NOT considered acceptable schedule adherence. SEPTA Standard
SEPTA staff measures on-time performance through automated vehicle locators (AVL‟s) and with selected vehicles that are equipped with automated passenger counters (APC‟s). Manual methods such as traffic checking and supervisory reports compliment the automated methods.
On-Time Performance Goals
Surface Transit – 80% (Bus, Trolley, Trackless Trolley)
Regional Rail – 90%
High Speed Lines – 95% (Market-Frankford, Broad Street/Broad-Ridge Spur and Norristown)
Exceptions:
Regional Rail trains marked with the letter “D” at a particular station stop in the public timetable may depart the station ahead of schedule.
Express transit trips or routes with limited stops may arrive ahead of schedule at the final destination.

21
DUPLICATIVE SERVICE
Requests for changes to SEPTA‟s route structure will not be considered if they replicate existing service as outlined in the following guidelines. SEPTA Standard City Transit, Suburban Transit and Contract Operation Routes
When examining the potential for new services, SEPTA policy asserts that new service cannot compete with existing services, especially the High-Speed and Regional Rail Lines. For example, a request for an express bus service from Northeast Philadelphia to Center City would not be considered, since the trip can be made by utilizing line-haul feeder routes which connect with the Market-Frankford Line and/or West Trenton, Trenton or Fox Chase Regional Rail Lines. A high percentage of SEPTA passengers transfer at least once to complete their journey, mostly to the rail system, which more efficiently transports many more passengers per hour.
Certain surface routings exist which seem to replicate heavy rail service but,
upon closer examination, would not be considered duplicative. A route‟s function and passenger market are the determinants for the differences between simple service resemblance and overt service duplication.
The following are four specific examples:
1) A segment of Route 3, although operating directly under the Market-Frankford Line, functions as a short-distance connection for residents of Frankford and Kensington.
2) Portions of Routes 4 and 16 travel directly over the Broad Street Line. The distance between station stops on the line justifies this alignment, typically four to five blocks. Interim destinations can only be “well-served” (according to guidelines) by the surface bus route.
3) Bus Routes 105 and 106, operating along Lancaster Avenue parallels Paoli/Thorndale Regional Rail service. The bus service and railroad service serve different passenger markets. The bus service addresses the market for reverse-commute and intra-suburban travel between neighborhoods where using the railroad would be impractical. The Regional Rail service provides peak direction commuter service primarily from suburban neighborhoods to central Philadelphia, as well as reverse commute travel from Philadelphia to suburban employment destinations within a reasonable walking distance from a train station, or connecting with a feeder bus or van service.

22
DUPLICATIVE SERVICE
4) Bus Route 78 was created to address the relocation of the Internal Revenue Service operations from Northeast Philadelphia to 30th Street Station. Scheduled service on this bus route operates at times when Regional Rail service is nonexistent. While the service appears duplicative, the Authority did not have the financial resources to operate additional railroad service to accommodate these riders. Other similar opportunities could be established based on similar employment relocation needs and available funding.
Regional Rail
Not Applicable.
23
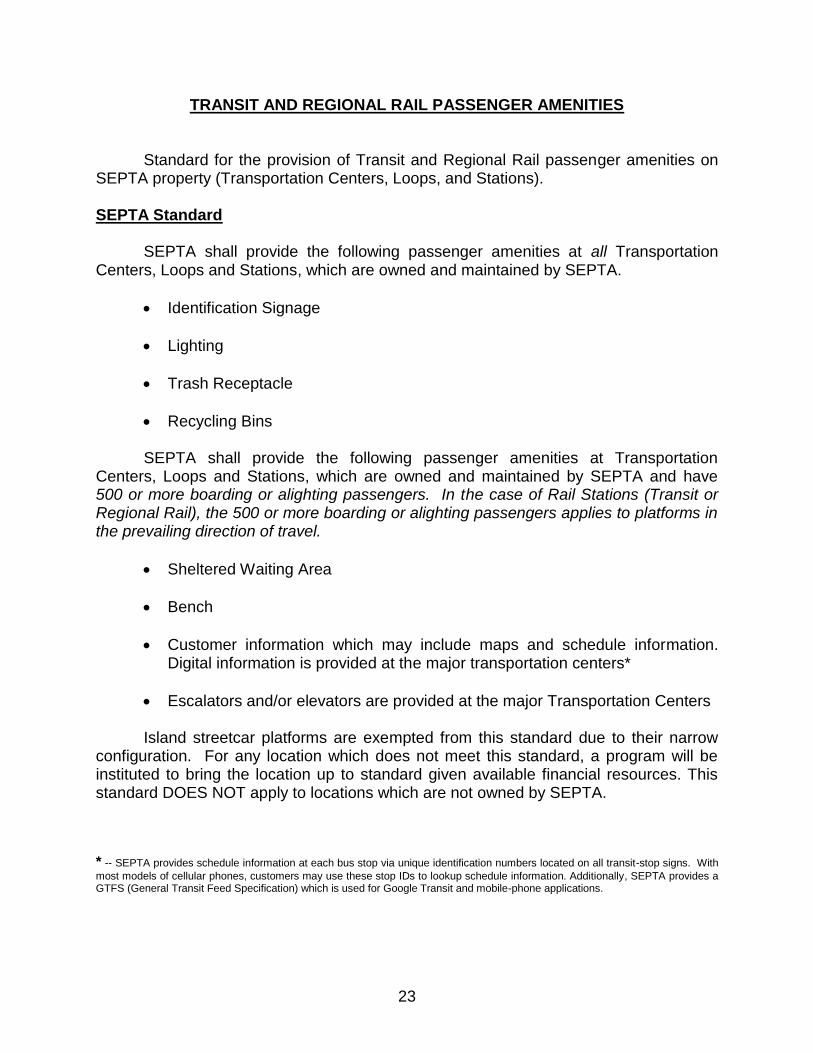
TRANSIT AND REGIONAL RAIL PASSENGER AMENITIES
Standard for the provision of Transit and Regional Rail passenger amenities on SEPTA property (Transportation Centers, Loops, and Stations). SEPTA Standard
SEPTA shall provide the following passenger amenities at all Transportation Centers, Loops and Stations, which are owned and maintained by SEPTA.
Identification Signage
Lighting
Trash Receptacle
Recycling Bins
SEPTA shall provide the following passenger amenities at Transportation Centers, Loops and Stations, which are owned and maintained by SEPTA and have 500 or more boarding or alighting passengers. In the case of Rail Stations (Transit or Regional Rail), the 500 or more boarding or alighting passengers applies to platforms in the prevailing direction of travel.
Sheltered Waiting Area
Bench
Customer information which may include maps and schedule information. Digital information is provided at the major transportation centers*
Escalators and/or elevators are provided at the major Transportation Centers
Island streetcar platforms are exempted from this standard due to their narrow configuration. For any location which does not meet this standard, a program will be instituted to bring the location up to standard given available financial resources. This standard DOES NOT apply to locations which are not owned by SEPTA.
* -- SEPTA provides schedule information at each bus stop via unique identification numbers located on all transit-stop signs. With
most models of cellular phones, customers may use these stop IDs to lookup schedule information. Additionally, SEPTA provides a GTFS (General Transit Feed Specification) which is used for Google Transit and mobile-phone applications.

24
BUS FLEET ASSIGNMENT
Standard for the assignment of SEPTA‟s bus fleet. SEPTA Standard
SEPTA shall assign buses with the goal of maintaining an approximately equivalent fleet age at each operating District.
Exceptions
Low density routes are assigned 27‟ and 30‟ buses. These buses are assigned to Contract Operation locations, or contracted to a private vendor
60‟ buses used for heavy density routes are assigned to District locations which have special maintenance capabilities for these vehicles

25
MAJOR SERVICE CHANGES
Standard for considering what constitutes a major service change(s). SEPTA Standard All Divisions
The following circumstances are considered major changes in service provided or fares charged and would require the SEPTA Tariff and Public Hearing Procedure and a Title VI impact analysis for transit routes.
Discontinuance of all service on a route on an entire day of the week. (Example: a proposal to discontinue all service on a Sunday).
Decreasing the span of service on a route by one and one-half hours at the beginning or end of a route's service day. (Example: A proposal to end service at 9:00 PM on a route which now operates until 11:00 PM).
Discontinuance of more than 15% of the trips over a two-year period on a route's base routing as defined in the route's operating tariff, on any day of the week. If it is proposed to discontinue more than 15% of the trips operating between these two points, the SEPTA tariff and public hearing process would be initiated*.
The discontinuance of more than 15% of rail service over a two-year period to a rail station as listed in the route‟s operating tariff (Regional Rail, High-Speed, Trolley). Exception: portions of trolley lines operating on public thoroughfares*.
The addition of a new rail station.
Any permanent change in the rates of fare charged.
It should be noted that any permanent change to a route‟s alignment as defined in the route‟s operating tariff requires the SEPTA tariff process be initiated, although many of these changes would not be considered “major.” Exceptions to this are explained in the Service Change Procedure section of the Service Standards Process section.
A Title VI analysis would be conducted for major service changes on transit routes as defined in the above criteria. Additionally, a disparate-impact analysis would be conducted when there is a difference in adverse impacts between minority and nonminority populations of 10 percent, as measured by the amount of service on routes defined as either Minority or Non-Minority and low-income and non-low-income populations (FTA C 4702.1B page 13).
* -- A public hearing is not required for “Limited Service Routes” or for the discontinuance of service in the event that a person,
entity or government that entered into a reimbursement agreement with SEPTA for service, ceases to fund the service.

26
SECTION 2: SERVICE STANDARDS PROCESS
SERVICE MONITORING PROCEDURE
The process by which the following service standards are applied on an ongoing basis:
Stop Spacing
Transfers
Service Frequency
Vehicle Loading
Route Performance Review SEPTA Process
Stop Spacing Greater stop spacing allows transit vehicles to achieve higher average speeds,
thereby improving operational efficiency. Closer stop spacing provides greater accessibility to passengers, increasing convenience. A review of transit stops to assure that stops comply with the Transit Stop Spacing Standard is an ongoing process that attempts to balance these two objectives.
Transfers Since a high percentage of passengers use more than one vehicle to complete
their journeys, it is important to consider the timing of vehicles and locations at which services intersect. The transit network is designed to align routings so that logical travel patterns can be facilitated at convenient transfer locations. Additionally, during off-peak periods, when service is less frequent, attempts will be made to have vehicles arrive at major transfer locations at the same time.
Service Frequency Service Frequency is monitored to ensure adequate service levels for passenger
demand and to identify underutilized service where resources may be reallocated. There are two types of frequency: demand and policy. Demand frequency is determined by the number of vehicles required to accommodate a given number of passengers during a fixed period of time. Demand frequency is established by using passenger traffic check data gathered periodically. Five types of passenger traffic checks or passenger gathering information are used. Corner Checks are counts of passengers on board a transit vehicle passing a specific time point along a route. Ride Checks are counts of passenger boards
27
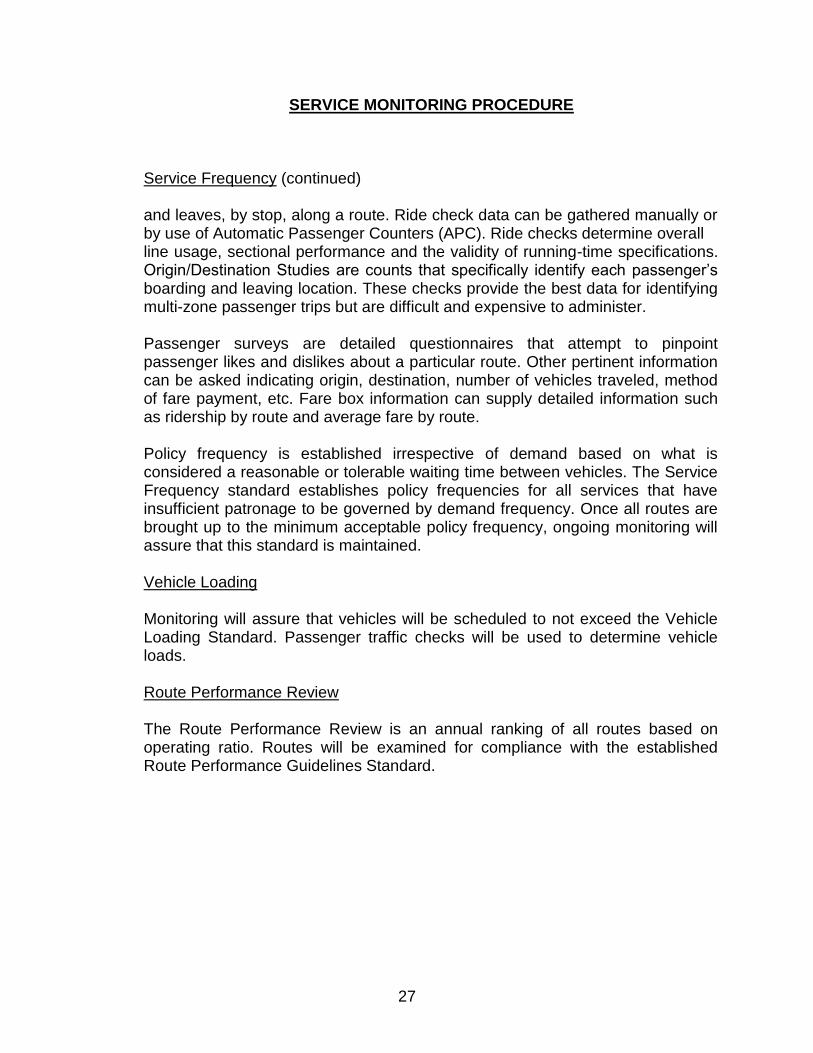
SERVICE MONITORING PROCEDURE Service Frequency (continued) and leaves, by stop, along a route. Ride check data can be gathered manually or
by use of Automatic Passenger Counters (APC). Ride checks determine overall line usage, sectional performance and the validity of running-time specifications.
Origin/Destination Studies are counts that specifically identify each passenger‟s boarding and leaving location. These checks provide the best data for identifying multi-zone passenger trips but are difficult and expensive to administer.
Passenger surveys are detailed questionnaires that attempt to pinpoint
passenger likes and dislikes about a particular route. Other pertinent information can be asked indicating origin, destination, number of vehicles traveled, method of fare payment, etc. Fare box information can supply detailed information such as ridership by route and average fare by route. Policy frequency is established irrespective of demand based on what is considered a reasonable or tolerable waiting time between vehicles. The Service Frequency standard establishes policy frequencies for all services that have insufficient patronage to be governed by demand frequency. Once all routes are brought up to the minimum acceptable policy frequency, ongoing monitoring will assure that this standard is maintained.
Vehicle Loading Monitoring will assure that vehicles will be scheduled to not exceed the Vehicle
Loading Standard. Passenger traffic checks will be used to determine vehicle loads.
Route Performance Review The Route Performance Review is an annual ranking of all routes based on
operating ratio. Routes will be examined for compliance with the established Route Performance Guidelines Standard.

28
SERVICE REQUEST PROCEDURE
Establishment of criteria for addressing service change requests relating to operations, schedules and routings. SEPTA Process
Service changes originate from the general public, SEPTA Citizen Advisory Committee, elected officials, City transportation officials, County Planning Commissions, Transportation Management Associations, Chambers of Commerce, and SEPTA employees.
Operations-related requests such as transit stop locations, service quality complaints and operating problems are routed to the appropriate SEPTA Operations Department for review and action. Schedule requests and complaints addressing service frequency, service hours span and service level adequacy are routed to the Schedules Section of the Service Planning Department for review and action.
Major service change proposals such as new routes, routing realignments or major changes in days or periods of operation are referred to the appropriate Service Planning Department section for evaluation.
All requests will first be analyzed for compliance with service standards. Requests that do not comply with service standards will not be processed further. The requester will be notified in writing as to the specific elements of the service standards with which the proposal did not comply, or addressed at the public meeting or public hearing.
Routing realignment requests which have no budget impact and comply with service standards, as well as requests which have deficit coverage support, may be implemented at any time during the year after proceeding through the tariff and public hearing process.
Major routing realignment, service requests and new route initiatives that meet service standards will be analyzed under a Comparative Evaluation Process for possible inclusion in the Annual Service Plan. This process includes development of operating costs, and a ridership and revenue projection based on census data, potential traffic generators and automobile ownership data. The projected effect of a proposal on passengers‟ travel time and service access will also be factored. Minor non-budget related items may proceed through the planning and implementation process outside of the Annual Service Plan and may be implemented at any time. Routings implemented through the Annual Service Plan process will be subject to a post-implementation review after one year of operation. A flow chart of the proposed Service Request Procedure follows on page 29. Detailed descriptions of items relating to this procedure begin on page 30.

29
SERVICE REQUEST PROCEDURE
Service Change Request (must be in writing) from:
- General Public - SEPTA Citizen Advisory Committee - Elected Officials - City Transportation Officials - County Planning Commissions - Transportation Management Associations - Chambers of Commerce - Transit Advocates - SEPTA Employees
-Transit Stops -Service Quality
complaints
-Operating Problems
-Service Frequency -Service Hours Span
-Service Level
Adequacy
Routed to appropriate Operations
Department for
review/action
Routed to Schedules Section for
review/action
Decision
Requester notified
in writing
Decision (based on Service
Standards guidelines) -Requester notified
in writing
Routing Realignment Proposals
Routed to Service Planning (City or
Suburban) for
evaluation
Non-budget related Proposals
-Evaluated for
compliance to Service Standards
Budget related Proposals
-Comp. Eval. Proc. for
possible inclusion in Annual Service Plan
Decision
Requester notified in writing
Decision
Requester notified in writing
Accepted Proposals -Submitted for hearing
and Board approval -May be implemented
at any time
Accepted Proposals -Included in Annual
Service Plan for hearing and Board
approval May be implemented
at any time

30
IMPLEMENTATION OF SERVICE CHANGES
There are two types of service changes: scheduling and routing. Although schedules generally change three times per year, relatively minor changes may be implemented throughout the year. Schedule changes are usually not subject to SEPTA‟s tariff and public hearing process. Exceptions would be major changes such as a proposal to discontinue all service on a route on a particular day of the week, the removal of more than 15% of the total weekly service on the base route, or to eliminate the first or last one and one-half (1 ½) hours, or more, of service on a route.
All routing changes must be initiated through SEPTA‟s Board-approved tariff implementation process. Minor non-budget related routing changes may proceed through this process and, upon approval, may be implemented throughout the year. All major changes that are included in the Annual Service Plan will undergo this process.
For each routing change, a tariff document which lists a street-by-street description (including a map) of the change is filed and circulated. A public hearing is held after adequate public notice (30 days). Hearings are conducted by an independent Hearing Examiner who listens to testimony from staff and the general public and makes a non-binding recommendation to the SEPTA Board. Staff may submit changes to the proposal based on input at the hearing(s). The Board makes the final determination regarding all routing changes. The entire process may take between four and six months from filing of tariff to implementation of service.
There are two exceptions to this process: 1. For temporary emergency changes, a General Manager‟s Temporary Order
may be filed to expedite implementation. An emergency change can be made with the approval of the General Manager and the SEPTA Board Chairman. A tariff would be filed if staff determines that the change should become permanent.
2. Under experimental tariff guidelines, an Experimental Order may be filed which allows experimental or promotional changes to be implemented with the approval of the General Manager and the SEPTA Board Chairman for a period not exceeding one year, and if the change is to become permanent the regular tariff process, including a public hearing, is initiated.

31
COMPARATIVE EVALUATION PROCESS FOR BUDGET-RELATED CHANGES
All service proposals that meet minimum service standards and impact SEPTA‟s Operating Budget will be subject to the Comparative Evaluation Process. This process provides an objective and systematic procedure to compare these service proposals with respect to their passenger and community benefits, relative to the cost of providing the services. This comparison will indicate which proposals return the greatest overall benefit for each dollar spent.
The process will work as follows: proposals, both from within and outside of SEPTA, are to be submitted to SEPTA‟s Service Planning Department in writing. Once received, all proposals meeting basic service standards and impacting the Operating Budget will be evaluated. This evaluation will consist of three parts: 1) cost analysis, 2) passenger revenue forecast, and 3) community benefit analysis. Following is a description of the evaluation components. Cost Analysis The operating cost of each proposal will be computed utilizing unit costs for
operating miles, hours and peak vehicles. The number of hours and miles are computed after conducting a field examination of the proposal‟s service area. Mileage is calculated using odometer readings or mapping software, running time is computed by simulating transit operating speeds and comparing the times to similar route segments. Required service levels are determined and draft schedules are prepared. Peak vehicle requirement is determined by the schedule cycle from the draft schedule. Unit costs (actual cost to operate service by mile and service hour and for peak vehicles) are applied to both components to calculate the total cost of the proposed change. Unit costs are updated at the close of each fiscal year. The operator labor rate is used to compute service hours. This rate comprises all payments to operators including fringe benefits. The mileage unit cost is used to compute mileage related costs. The variable (incremental) peak vehicle unit cost is used to compute cost not included in the above service hour and mileage unit costs.
NOTE: When comparing all routes as part of the Route Performance Guidelines
standard on an annual basis and for the purpose of determining the cost of SEPTA services to be competitively contracted, fully allocated peak vehicle unit costs will be used as opposed to the incremental peak vehicle unit costs.
Passenger Revenue Forecast Ridership on new or realigned services or for services that are proposed for
substantive changes in frequency or span of operation will be estimated before changes are implemented. The projected change in ridership for existing services or the number of new riders to the SEPTA system associated with a proposed new service will be used as a basis upon which to project changes in passenger revenue.

32
COMPARATIVE EVALUATION PROCESS FOR BUDGET-RELATED CHANGES
Passenger Revenue Forecast (continued) Generally, an average fare will be assigned to each new passenger trip, except
where special circumstances that would render a different revenue impact (such as a predominance of senior citizens or school students patronizing a particular service) are observable or anticipated. In absolute terms, projected changes in ridership will be one criterion against which new service proposals and poorly performing existing routes, or periods of operation, will be ranked. Annual passenger revenue will be divided by the annual cost to provide a particular service to determine a route‟s operating ratio. Proposals must meet the minimum acceptable operating ratio as outlined in the Route Performance Guidelines standard, presently 60% of an operating division‟s operating ratio, excluding the Market-Frankford and Broad Street Lines for City Transit and the Norristown High Speed Line for Suburban Transit routes.
Several determinants will be analyzed to forecast ridership including, but not limited to, the most recent available census data, levels of employment along segments under consideration, DVRPC population and employment forecasts, and observed patronage and travel patterns on groups of similar services serving comparable markets. Census statistics provide population density by individual census tracts. Census data also includes average income and employment levels, average persons per household, and journey-to-work data including modal split. DVRPC forecasts of travel demand, developed only for counties and municipalities, indicate demographic and employment trends according to planned development and revitalization of specific areas and major corridors. SEPTA ridership and revenue data for similar routes that are collected periodically will be used as a baseline to refine assumptions drawn from the other data used. Revenue is calculated by multiplying ridership by the average fare of the Division.
Community Benefit Analysis Recognizing that the annual net change in cost, revenue, ridership and operating
ratio are not the only measures of a service‟s value, additional criteria will be used to determine the net benefit of particular services to the community at large. By measuring only economic changes to assess the utility of service, certain qualitative elements would be overlooked. Along with the projected number of new riders, also considered will be the effect of changes in transit proximity for existing riders, changes in total travel time, impact of proposed schedule revisions and the need (or elimination of the need) to transfer to connecting services.
Transit dependency for a particular area being served can be estimated using demographic characteristics information taken from census data. These include income and employment information, and levels of auto availability to each member of a household who must make trips on a daily basis.

33
COMPARATIVE EVALUATION PROCESS FOR BUDGET-RELATED CHANGES
Community Benefit Analysis (continued)
Changes in transit service proximity will impact both current and potential passengers whose trips originate in a route‟s service area and whose walking distance to access transit would be either increased or decreased through implementation of a proposed service change. Such passengers would be either inconvenienced by the implementation of a proposal or would receive a substantial benefit. The analysis determining accessibility for rider groups will also capture new or eliminated needs to transfer and compute average changes in total travel time.
Proposal Scoring
The aforementioned elements will be assigned benefit points according to their relative overall importance to the community. Late-night and “Owl” period work-related trips will be given slightly higher weight than trips taken during other periods, as these are patronized predominantly by transit dependent riders during periods when service is skeletal and alternatives are few. All other passengers will be considered equally.
Very few peak-period trips are discretionary in nature, i.e., could be taken at another time, or not at all. Most peak-period transit trips facilitate travel to employment centers and to schools. Using the rationale underlying the stated importance of late-night and “Owl” trips, it could be argued that more mainstream travel, which is also necessary, should precede non-essential “trip taking” in an ordinal ranking. However, we must also consider the cost to SEPTA to carry passengers. Peak periods see maximum utilization of available transit vehicles. Therefore, the attraction of additional passengers during these periods will, at some point, warrant the expenditure of additional hours and miles to accommodate them. Conversely, during off-peak periods, there is ample capacity to carry additional passengers without increasing the allocation of resources, so the marginal cost to carry these passengers is always less than during peak periods although the revenue associated with each new passenger is constant. In the interest of satisfying the more fundamental objective of maximizing the overall utility of each hour and mile spent, these two considerations, trip importance and the cost of providing a seat, are considered to be equal.
The elimination of transfers will be considered third in importance. Next and weighted equally, will be improvements in travel time (of at least five minutes) and decreases in walking distance (of at least one block). A proposal will gain benefit points for each of these and will lose benefit points if it causes additional transfers, longer travel times (five minutes or more) or an increase in walking distance (one block or more). Transfers rank ahead of the other two convenience factors because the need to transfer sometimes adds to the cost of transit travel and because linking trips adds an element of uncertainty when completing travel. Where it is determined that a need to transfer will also increase travel time (or vice versa), benefit points will be lost or added accordingly.

34
COMPARATIVE EVALUATION PROCESS FOR BUDGET-RELATED CHANGES
Proposal Scoring (continued) Benefit points will be assigned per passenger as follows:
BENEFIT POINTS
CATEGORY POINTS
Each "Owl" passenger gained (see note) 1.25
Each other passenger gained 1
Each other passenger lost -1
Eliminated transfer 0.6
Additional transfer -0.6
Improved travel time 0.4
Added travel time -0.4
Decreased walking distance 0.4
Increased walking distance -0.4
NOTE: The “Owl” period refers to the hours of operation between
1:00 AM and 6:00 AM. Ridership levels after 11:00 PM will be evaluated and the definition of the “owl” period for the purpose of the benefit point analysis may be subject to change.
When benefit points are totaled, they are divided by the proposal‟s cost to determine a Final Benefit Score. This score of “passenger benefit by dollar expended” for each proposal provides a comparison of services indicating the community benefit received for the expenditure of SEPTA resources.
For the purpose of comparing a proposed change on an existing route, a Final Benefit Score is computed for the existing route as it is presently operated. A Final Benefit Score is then prepared for the route including the proposed change.
If the proposal results in a score higher than the existing route, the proposal would be considered. If the proposal results in a lower score, it would not be recommended for approval as part of the Annual Service Plan. All requesters of a rejected proposal are notified of the reasons for the rejection.
For a completely new route, a Final Benefit Score would be computed for the purpose of comparison to other proposals.
35
COMPARATIVE EVALUATION PROCESS FOR BUDGET-RELATED CHANGES
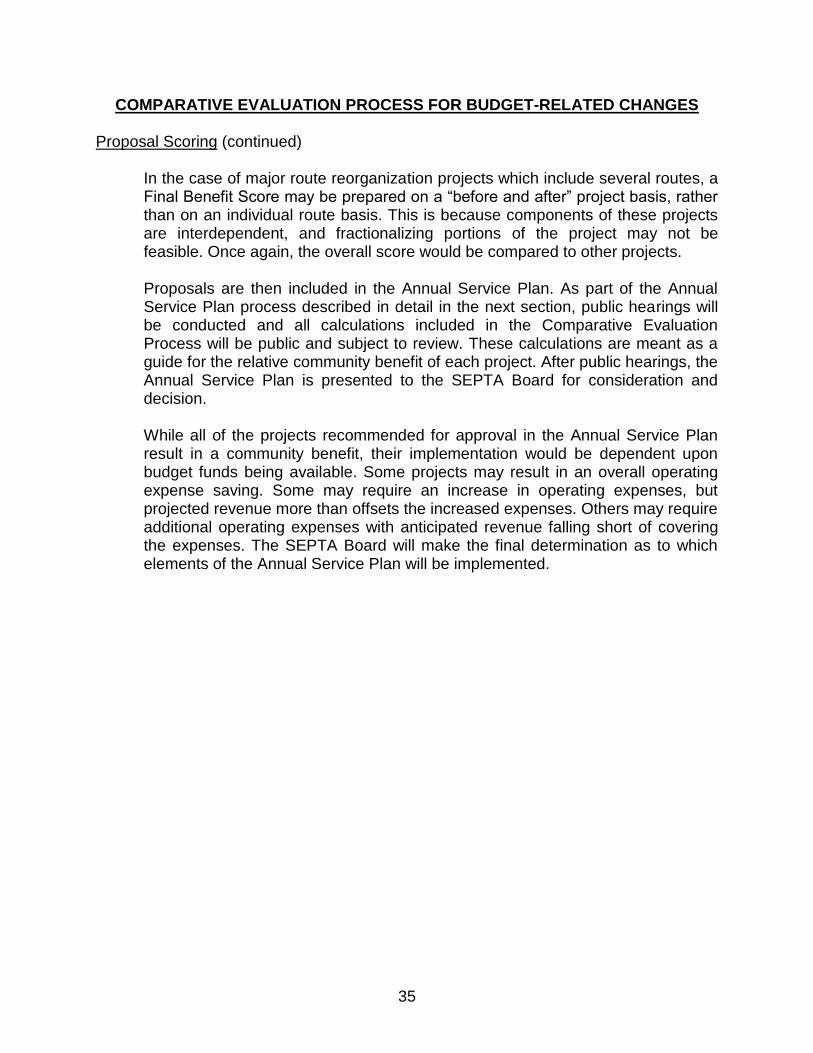
Proposal Scoring (continued)
In the case of major route reorganization projects which include several routes, a Final Benefit Score may be prepared on a “before and after” project basis, rather than on an individual route basis. This is because components of these projects are interdependent, and fractionalizing portions of the project may not be feasible. Once again, the overall score would be compared to other projects.
Proposals are then included in the Annual Service Plan. As part of the Annual
Service Plan process described in detail in the next section, public hearings will be conducted and all calculations included in the Comparative Evaluation Process will be public and subject to review. These calculations are meant as a guide for the relative community benefit of each project. After public hearings, the Annual Service Plan is presented to the SEPTA Board for consideration and decision.
While all of the projects recommended for approval in the Annual Service Plan result in a community benefit, their implementation would be dependent upon budget funds being available. Some projects may result in an overall operating expense saving. Some may require an increase in operating expenses, but projected revenue more than offsets the increased expenses. Others may require additional operating expenses with anticipated revenue falling short of covering the expenses. The SEPTA Board will make the final determination as to which elements of the Annual Service Plan will be implemented.
36
COMPARATIVE EVALUATION PROCESS FOR BUDGET-RELATED CHANGES
Conclusion The external data sources which will contribute to the basis of ridership forecasts
and the determination of benefit points are, as yet, less comprehensive and complete than is desirable. In cases where reliable data is insufficient for confident decision making, staff will work with City and County Planning Commissions and DVRPC to further develop and refine the information to enhance its applicability to transit. In the interim (and to some extent afterward), there will be a number of gray areas where precise measurements cannot be made. In these cases it will be necessary for staff to exercise professional judgment, based on experience, with input from community organizations and political representatives to properly evaluate specific service proposals.
There may be a need to vary the formula by which benefit points (the basis for comparative evaluation) are assigned. The perceived degree of accuracy of the process used in comparing proposals will be evaluated each year subsequent to the implementation of the Annual Service Plan. Based on that evaluation, staff may propose changes in the hierarchical order of passenger groups or in the number of points assigned for a particular community benefit. Any substantial change in this proposed process should be subject to review by interested parties at a public meeting as part of the Annual Service Plan process. If approved, the changed process would then be used in the development of the following year‟s Annual Service Plan. However, although a particular proposal could be evaluated according to different criteria in different years, the criteria used will be consistent for every proposal evaluated in that particular year.

37
COMPARATIVE EVALUATION PROCESS FOR BUDGET-RELATED CHANGES
Budget Related Proposals
Routing realignment proposals submitted to Service Planning Department
- Proposed changes to existing route structure - New service proposals
Routing realignment proposals originated in Service Planning Department
- Proposed changes to existing route structure - New service proposals - Remedial measures to improve Route‟s economic performance
Requests which do not meet Service Standard Guidelines
Requester notified of decision in writing
Requests which meet Service Standard Guidelines
Evaluation Process
-Cost of Analysis -Ridership and Forecasting -Community Benefit Analysis
Final Benefit Score: calculated by dividing benefit points by proposal‟s operating
cost
Overall Ranking
Recommendation
Accepted Requests
-Include in Annual Service Plan -Subject to public hearings, SEPTA Board Approval, and available funding
Rejected Requests
Requester notified in writing
38
ANNUAL SERVICE PLAN PROCESS
The Annual Service Plan is a one-year plan that identifies new transit services or significant changes to existing services for the following fiscal year. The plan identifies incremental changes that are designed to achieve specific service goals and objectives, and opportunities for cost-effective service expansion. It is prepared at the same time each year and follows a defined process allowing for municipal and public input. Aside from the above, the Annual Service Plan provides a process with which to measure and evaluate system performance on a year-to-year basis.
All major route and service adjustments which impact SEPTA‟s operating budget will be planned and implemented according to the Annual Service Plan. This includes route suggestions that originate from both within and outside of SEPTA. Proposals will be considered as they relate to overall annual goals and objectives rather than on individual bases.
As part of the plan each year, routes that have failed to meet the minimum operating ratio standard will be candidates for targeted marketing, realignment, consolidation or discontinuance. Expenses saved as a result of these adjustments will be budgeted toward improvements in service on an annual basis. Proposals All route and service adjustments which impact SEPTA's Operating Budget are
planned and implemented according to the Annual Service Plan. These include suggestions that originate from general public, SEPTA Citizen Advisory Committee, elected officials, City transportation officials, County Planning Commissions, Transportation Management Associations, Chambers of Commerce, and SEPTA employees. All route and service adjustments are investigated, planned and implemented through SEPTA's Service Planning Department. Suggestions from outside sources and from other SEPTA Departments are to be submitted to Service Planning by August 31 of each year for consideration.
Planning Process/Evaluation Process Projects considered as part of an Annual Service Plan are presented to affected
groups and agencies. This work includes the following steps of the route planning process: identification of areas to be studied (for projects initiated by SEPTA staff), evaluation of input from elected officials, planning professionals and citizens, performance of field work, completion and analysis of passenger traffic checks, and preparation of schedule specifications. Projects are then evaluated as explained on pages 31 – 36.

39
ANNUAL SERVICE PLAN PROCESS Project List Presented/Discussed with Affected Groups and Agencies A meeting is held with outside groups, agencies and interested citizens affected
by, or concerned with, proposed Annual Service Plan Projects. The purpose of this meeting is to receive input from interested parties prior to initiation of the tariff and public hearing process. This permits serious concerns to be addressed before the Plan is finalized.
Budget Impact Any item having a cost impact, which is not included in SEPTA‟s Annual
Operating Budget, is required to receive external subsidy, or through resource reallocation in order for implementation to be considered.
Tariff Preparation and Circulation Tariffs for route projects are prepared, filed and circulated for in-house SEPTA
approval. During this time, public hearing dates are tentatively arranged. When concurrences are received, hearing dates are finalized and public notices are published.
Public Hearings Public hearings are held at accessible locations within a two-mile radius of the
affected route(s). Hearings are arranged, advertised and conducted according to SEPTA's Tariff Regulations and enabling legislation.
Post-Hearing Revisions Any revisions necessitated by the public hearing process are then finalized.
Where revisions to projects affect cost and/or revenue, the benefit point analyses are recalculated to assure that the overall benefit of a project has not been compromised. Hearing Examiner's Report and Recommendations are considered by the SEPTA Board at their regularly scheduled meeting usually held on the fourth Thursday of each month.
SEPTA Board Approval The SEPTA Board considers all elements of the Annual Service Plan. The Plan
may be adopted in whole or in part.
40
ANNUAL SERVICE PLAN PROCESS Implementation Final implementation dates are set, pending SEPTA Board approval and
available funding. Post-Implementation Review After a period of one year, all major service changes (including area
restructurings), new routes, and service extensions are subject to review. The collection of APC data and passenger traffic checks are conducted at least four times during this period.
As a result of this review, a decision is made to retain the service change as is, modify it in some way, or possibly discontinue it. A determination may be made at this time to extend the review period for further evaluation prior to making a final decision.
41
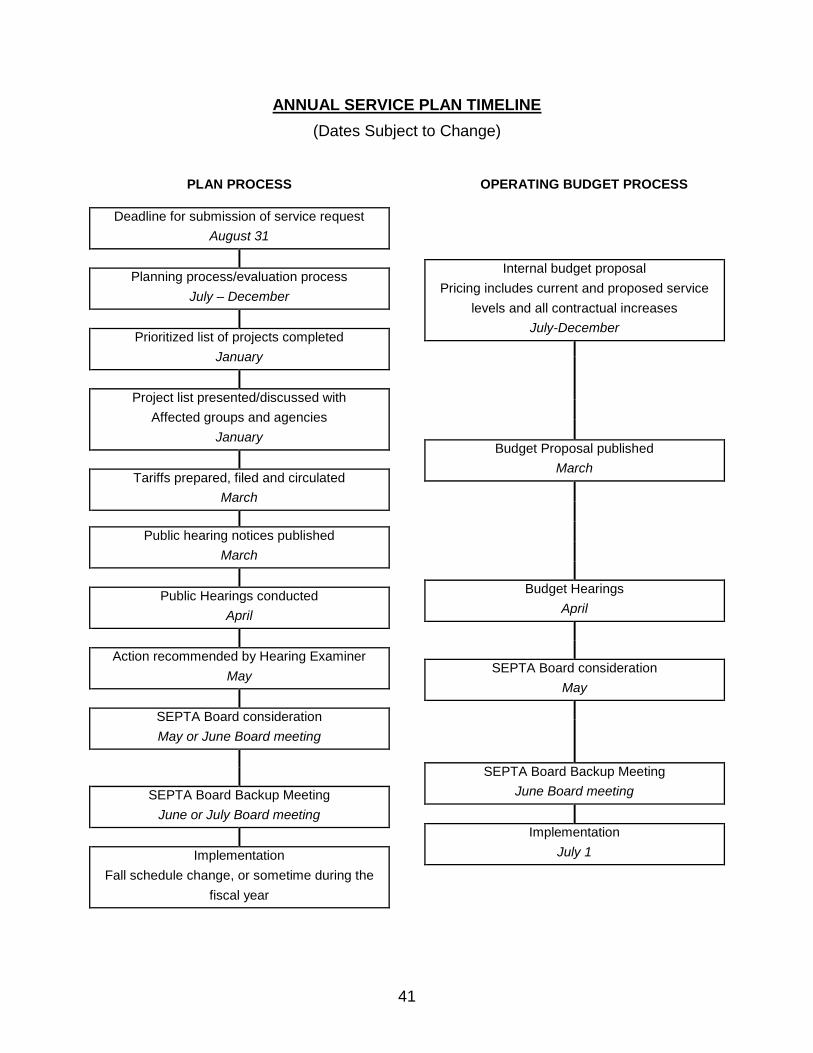
ANNUAL SERVICE PLAN TIMELINE
(Dates Subject to Change)
PLAN PROCESS
Deadline for submission of service request
August 31
Planning process/evaluation process
July – December
Prioritized list of projects completed
January
Project list presented/discussed with
Affected groups and agencies
January
Tariffs prepared, filed and circulated
March
Public hearing notices published
March
Public Hearings conducted
April
Action recommended by Hearing Examiner
May
SEPTA Board consideration
May or June Board meeting
SEPTA Board Backup Meeting
June or July Board meeting
Implementation
Fall schedule change, or sometime during the
fiscal year
OPERATING BUDGET PROCESS
Internal budget proposal
Pricing includes current and proposed service
levels and all contractual increases
July-December
Budget Proposal published
March
Budget Hearings
April
SEPTA Board consideration
May
SEPTA Board Backup Meeting
June Board meeting
Implementation
July 1

42
SECTION 3: APPENDICES
COMPARATIVE EVALUATION EXAMPLE
Following is an example of how benefit points and cost would be computed for a proposed change to an existing route. In this case, Route “A” is proposed to be realigned to serve a new shopping center. In order to do this, it is necessary to discontinue a small portion of the existing route. Route “A” operates weekdays only and does not operate during the “Owl” period. Route “A” carries 2,000 daily passengers.
The proposed realignment adds 35,000 annual miles and 1,500 annual hours to the route. The proposed discontinuance saves 10,000 annual miles and 500 annual hours. There is no effect on peak vehicle requirement. The net difference is an increase of 25,000 annual miles and 1,000 annual hours which is reflected in the proposed Route “A” cost computation. FY 2010 City Transit unit costs as shown below are used in the calculation.
ROUTE "A" COMPARATIVE EVALUATION
ANNUAL EXISTING PROPOSED CHANGE
Miles 330,000 355,000 25,000
Hours 25,000 26,000 1,000
Peak Vehicles 6 6 0
Passengers 510,000 624,750 114,750
Revenue $474,300 $581,018 $106,718
Expenses - Fully Allocated (peak vehicle rate) $3,608,650 $3,756,600 $147,950
Net Cost - Fully Allocated (peak vehicle rate) $3,134,350 $3,175,582 $41,232
Operating Ratio - Fully Allocated 13% 15% 2%
Incremental Expenses $2,795,590 $2,943,540 $147,950
Operating Costs and Average Fares
per hour = $52.45 per mile = $3.82 per peak vehicle incremental cost = $37,290 peak vehicle full cost = $172,800 average fare = $0.93

43
COMPARATIVE EVALUATION EXAMPLE
It is projected that the new shopping center service will attract 500 new daily passenger trips. Passenger traffic checks indicate that 50 existing riders who boarded along the portion of route proposed for discontinuance will be beyond reasonable walking distance to transit and will, therefore, be lost to the system, resulting in a net increase in daily ridership of 450 passenger trips. For the purpose of this example, the average fare $0.93 will be used to calculate revenue.
ROUTE "A" COMMUNITY BENEFIT ANALYSIS
BENEFIT EXISTING PROPOSED
SERVICE POINTS Psgrs Points Psgrs Points
Weekday
Ridership 1 2,000 2,000 2,450 2,450
Owl Ridership 1.25
Eliminated Transfer 0.6
Additional Transfer -0.6
Improved Travel Time 0.4
Added Travel Time -0.4 100 -40
Decreased Walking Distance 0.4 300 120
Increased Walking Distance -0.4
Total 2,000 2,530
Total Annualized Points 510,000 645,150
Final Benefit Score Calculation
Annual Benefit Points 510,000 645,150
Annual Expenses (incremental) $2,795,590 $2,943,540
FBS 0.18 0.22
By examining passenger traffic checks, it is determined that this proposal will lengthen the travel time for 100 existing passengers who are traveling between points before and beyond the new shopping center (through riders). It is also determined that 300 existing riders are presently departing buses at the existing stop nearest the shopping center. These 300 riders will have their walking distance reduced by the new routing. This proposal has no impact on transfers.
Since the proposal‟s efficiency score is a larger number than the existing routing‟s number, (the larger the number, the better the score) this proposal would be included for recommended implementation in the Annual Service Plan.
In the above example, the proposed change to Route “A” had a Final Benefit
Score (FBS) of 0.22. This project would then be listed with other acceptable projects for inclusion in the Annual Service Plan. Below is a hypothetical list of Annual Service Plan projects listed in order from highest to lowest FBS scores. This listing provides a helpful comparison as to relative community benefit-per-dollar expended for each project.

44
COMPARATIVE EVALUATION EXAMPLE
PROJECT FBS
Route “B” 1.02
Route “E” 0.68
Route “A” 0.27
Route “D” 0.22
Route “T” 0.20
While all of these projects result in a community benefit, their implementation
would be dependent upon available budget. Some projects may result in an overall operating expense saving. Some (such as the Route “A” example) require an increase in operating expenses, but projected revenue more than offsets the increased expenses; others may require additional operating expenses with anticipated revenue falling short of covering the expenses. The SEPTA Board will make the final determination as to which elements of the Annual Service Plan will be implemented.

45
UNIT COSTS
Assignment of Expense Object Classes to Allocation Variables
Expense Vehicle Peak Vehicles
Object Class Hours Miles Fully Allocated Incremental
Labor
Operator Salaries X
Maint. Salaries X
Other Salaries X Selected Departments*
Fringe Benefits
Operator X
Maintenance X
Other X Selected Departments*
Services
Professional & Tech X
Contract Maintenance X
Security Services X
Other Services X
Materials & Supplies
Fuel & Lubricants X
Tires & Tubes X
Parts X
Other Materials X
Utilities
Utilities X
Casualty & Liability
Premiums For Damage X
Recoveries Of Losses X
Claims Paid X
Taxes
Vehicle Registration X
Fuel & Lubricant X
Other Taxes X
Miscellaneous Expenses
Dues & Subscriptions X
Travel & Meetings X
Bridges, Tunnel Tolls X
Advertising Media X
Other Misc. Expense X
Reconciling Items
Interest Expense X
Leases & Rentals X
Depreciation
Vehicles X
Other X
* Labor Relations, Claims Dept, Human Resources & Benefits, Revenue Collections, Fare Box Maintenance, Procurement, Transportation Managers.


