NASA NASa-TP-25S9 19S60021249 Technical Paper 2589 September 1986 Impact Data From: a Transport-Aircraft During a Controlled Impact ,Demonstration Edwin L. Fasanella, Emilio. Alfaro-Bou, and Robert J. Hayduk https://ntrs.nasa.gov/search.jsp?R=19860021249 2018-07-09T12:17:52+00:00Z
Transcript
NASA NASa-TP-25S919S60021249TechnicalPaper2589
September 1986
Impact Data From: aTransport-AircraftDuring a ControlledImpact ,Demonstration
Edwin L. Fasanella,Emilio. Alfaro-Bou,and Robert J. Hayduk
Impact Data From aTransport AircraftDuring a ControlledImpact Demonstration
Edwin L. FasanellaPRC Kentron, Inc.Hampton, Virginia
Emilio Alfaro-Bou
and Robert J. HaydukLangley Research CenterHampton, Virginia
NI SANational Aeronauticsand Space Administration
Scientific and TechnicalInformation Branch
The use of trademarks or names of manufacturers in this report is for accurate reporting and does notconstitute an official endorsement, either expressed or implied, by the National Aeronautics and SpaceAdministration.
Contents
Summary ................................. 1
Introduction ................................ 1
Symbols and Abbreviations ......................... 2
CID Crash Scenario ............................ 2
CID Test Aircraft ............................. 3
CID Instrumentation and Data Acquisition System .............. 4
Data Reduction and Filtering ........................ 4
CID Flight and Crash Impact Parameters ................... 5
Results From CID Initial Impact ....................... 6
Concluding Remarks ........................... 7
Tables and Figures ........................... 8
Appendix A--Fuselage Accelerations, Loads, and Bending-Bridge Data ...... 25
Appendix B--Wing Accelerations and Vertical Bending Data .......... 53
Appendix C--Seat and Anthropomorphic-Dummy Accelerations and Loads .... 60
References .................. - ............ 84
°..in
Summary the invitation to conduct experiments on structuralbehavior because of the NASA Langley Research
On December 1, 1984, the Federal Aviation Ad- Center's extensive experience in general aviation full-ministration (FAA) and the National Aeronautics scale crash testing, crash data acquisition and analy-and Space Administration (NASA) conducted the sis, crash photography, energy-absorbing-seat devel-first remotely piloted air-to-ground crash test of a opment, and finite-element structural analysis (refs. 1transport aircraft. NASA and the FAA had many ob-jectives during the joint planning and conducting of to 3). In addition, NASA Ames Research CenterDryden Flight Research Facility, at Edwards Airthe controlled impact demonstration (CID). NASA's Force Base, California, assumed the responsibility forinterest was primarily the structural behavior asso- the developmental flight program and remote pilot-ciated with impact. The FAA's primary objective ing of the unmanned vehicle to the impact site.was the demonstration of an antimisting kerosene(AMK). Improved design for damage minimization NASA's interest was primarily to make airframeand improved seats were secondary test considera- structural loads measurements and to acquire andassess baseline structural crash dynamics data. Thetions for the FAA. FAA's primary interest was to demonstrate that
This paper reports the structural crash impactdata collected by NASA Langley Research Center antimisting kerosene (AMK) could be used to flythe airplane and to prevent the characteristic fireballduring the CID for the 1-sec period after initial im- when spilled at impact. Demonstration of improvedpact, and contains appendixes with over 330 timehistories of accelerations and loads. Acceleration and design features, such as fire-blocking materials and
seats improved for crash conditions, was a secondaryload levels measured in the CID were substantially objective for the FAA.lower overall than anticipated because the left-wingimpact reduced the center-of-gravity sink rate from Langley was responsible for the selection, testing,approximately 17 ft/sec to 12 ft/sec. A pitch rate and installation of instrumentation for measuring im-was induced by the wing impact, causing the air- pact loads throughout the aircraft structure and forcraft to impact 2.5° nose-down. Consequently, the measuring transmission of loads into the anthropo-peak normal (i.e, approximately vertical) accelera- morphic dummies (i.e., seat performance), a galley,tions along the floor were highest in the cockpit and and the overhead bins. Langley developed, tested,the forward cabin near the nose wheel well and were and qualified 2 independent 176-channel data acqui-
approximately 14G. The remaining cabin floor re- sition systems (DAS's), including hardware and soft-ceived peak normal accelerations typically about 7G ware, for recording and.transmitting aircraft impactor less. The peak longitudinal accelerations showed loads. In addition, L_tngley developed a 10-cameraa similar distribution, with the highest acceleration photographic system to provide onboard high-speed.being 7G in the cockpit and the forward cabin. The film coverage during the controlled impact. Lang-accelerations were generally less than 4G over the ley was also responsible for acquisition of the air-rest of the floor. The peak transverse accelerations frame structural response data, subsequent analysison the floor ranged from about 5G in the cockpit to of the airframe data, and development and validation
of an aircraR structural mathematical model using1G in the aft fuselage.This paper does not address loads experienced the finite-element code DYCAST (DYnamic Crash
when the aircraft impacted wing-opening obstacles, Analysis of STructures, ref. 4).Dryden developed the remotely piloted vehicle
effectiveness of AMK, or analysis of the post-crash (RPV) control system and supporting simulator forfire. unmanned remote piloting of the Boeing 720 aircraft
Introduction to the impact site. Dryden also developed a teleme-try system for ground-based control of the aircraft
On December 1, 1984, the Federal Aviation Ad- and for activation of the DAS recorders, lights, andministration (FAA) and the National Aeronautics cameras. Dryden was also systems integrator for theand Space Administration (NASA) conducted the FAA's AMK, fireworthiness, and crashworthiness de-first remotely piloted air-to-ground crash test of a sign features experiments, as well as Langley's struc-transport aircraft. The Full-Scale Transport Con- rural measurements experiment, associated electron-trolled Impact Demonstration (CID) was the culmi- ics, onboard photographic system, and experimentalnation of 4 years of effort by the two agencies, seats.
The FAA initiated the program, provided the A preliminary report on the structural loadsBoeing 720 airplane, and directed the project for the data (for selected channels) plus detailed informationprimary purpose of testing an antimisting fuel addi- about the design of the DAS, data reduction, fire-rive, a product of extensive research. NASA accepted proofing of cameras and equipment, and background
information leading up to the CID was released to CPR cardiopulmonary resuscitationthe public at a government-industry CID workshopheld April 10, 1985, at NASA Langley Research PCM pulse code modulationCenter, Hampton, Virginia (ref. 5). Other informa- XMTR transmittertion describing results from the CID is contained in
references 6 and 7. CID CrashScenarioThis paper presents the rationale behind the se-
lection of the planned CID crash scenario, a descrip- In 1980, in preparation for the CID, NASA andtion of the test article, the data gathering system FAA initiated study contracts with the three majorused, the test, the results from the NASA seat exper- U.S. transport airframe manufacturers: The Boeingiments, a survey of the fuselage accelerations for loca- Co., Lockheed-California Co., and McDonnell Dou-tions from nose to tail, and the data from 331 of the glas'Corp. The objectives of these study contracts350 data channels for the 1-sec time interval after the were to review and evaluate all company and govern-initial left-wing (outboard engine) impact with the ment transport accident data, to define a range ofground. In the appendixes, the data are divided into survivable crash scenarios that could form the basisfuselage (appendix A), wing (appendix B), and seat for improving design technology, and to identify testand dummy (appendix C) accelerations and loads, techniques and analytical methods needed to evalu-Accelerations from the impact with the wing-opening ate impact dynamic response of transport aircraft.obstacles, which occurred approximately 1.8 sec af- Between the years 1958 and 1979, 993 jet trans-ter initial wing contact with the ground, are not ad- port accidents occurred worldwide. From this total,dressed in this report. 176 well-documented survivable accidents were se-
lected for detailed evaluation. Generally, the threeSymbols and Abbreviations manufacturers examined accidents associated with
their own aircraft, with the diagram of figure 1Accelerations are expressed in dimensionless formas a multiple of the acceleration of gravity g. In this illustrating the degree of multiple review. Thispaper G (or G units) is used to denote that only study effort provided definition of accident scenariosmagnitudes are being compared; that is, the direction throughout the transport aircraft operational regime.of acceleration being measured is generally not in the The actual CID air-to-ground crash scenario evolved
from these data (ref. 8). The data show that approx-direction of gravity, imately 28 percent of the transport accidents occurL longitudinal (X) direction with during take-off and climb and 54.5 percent during
respect to floor, positive forward approach and landing. Consequently, the most fre-quent air-to-ground crash scenario was selected for
N normal (Z) direction with respect CID.
to floor (approximately vertical), The planned CID crash scenario resulting frompositive downward these detailed studies is depicted in figure 2. This
T transverse (Y) direction with scenario is representative of an "impact-survivable"respect to floor, positive out right accident, that is, an accident in which the livablewing; time, sec volume is maintained (i.e., the airframe does not
break up)and in which crash impact forces areV velocity, ft/sec survivable for many of the passengers. The transport
X, Y, Z longitudinal, transverse, and normal aircraft in the planned scenario had the landing gearsaxis of aircraft stowed to prevent fuselage fracture aft of the main
landing gear and followed a 3.3° to 4.0 ° glide slope inXd, Yd, Zd longitudinal, transverse, and normal a 1.0° nose-up attitude. The aircraft had a nominal
axis of dummies 17 ft/sec sink rate, with no roll or yaw attitude or
x, y, z coordinate along X-, Y-, and Z-axis velocity and a longitudinal velocity of approximately150 knots.
Abbreviations: Planned impact conditions called for symmetric
AMK antimisting kerosene impact prior to encountering obstructions. It wasplanned for the fuselage to slide through a corridor
BS body station between two rows of heavy steel wing-opening struc-
c.g. center of gravity tures. These wing openers were designed to guaran-tee fuel spillage of 20 to 100 gallons per second. Pow-
CID controlled impact demonstration ered frangible landing lights and a packed stone bed
2
beyond the wing openers provided additional ignition quality (with 13 instrumented). The remaining dum-sources for the fuel. Two jet-fueled flame generators mies were noninstrumented cardiopulmonary resus-were mounted in the tail cone to provide an onboard citation (CPR) type. The 13 instrumented anthropo-positive ignition source. The planned take-off gross morphic dummies were located strategically to max-weight of the aircraft was 175 000 to 195 000 lb. imize coverage of the experimental seats. Instrumen-
tation of the dummies consisted of accelerometers,CID Test Aircraft located in the pelvis, chest, and head cavities, and
of restraint load cells. The minimum dummy instru-The aircraft used in this demonstration was a mentation was three accelerometers located in the
four-engine, intermediate range Boeing 720 jet trans- pelvis and two lap-belt load cells. All dummies wereport that had entered FAA service in the mid-1960's in a seated, upright position except for the dummiesand was ready for retirement. Even though the Boe- in the NASA triple seats, which were bent over anding 720 is now considered obsolete, its structural tied in a crash position.design and construction are still representative of A total of 350 instruments were distributednarrow-body transport aircraft used by domestic and throughout the fuselage structure, wings, storageforeign airlines, bins, seats, and dummies, as shown in table 2. The
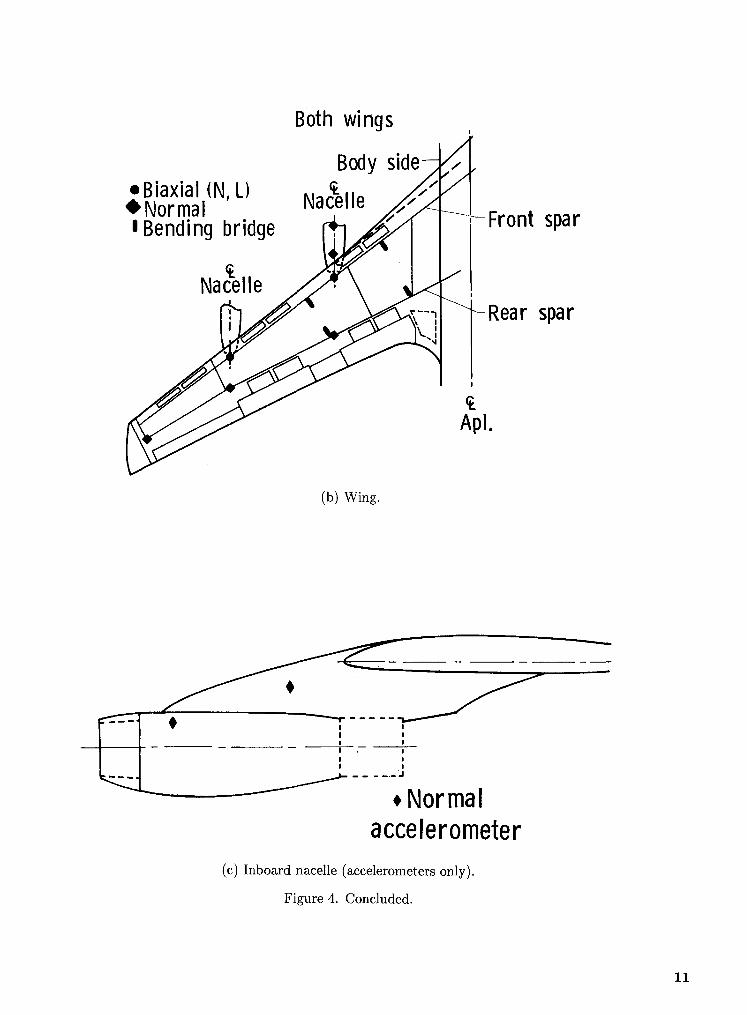
Because this paper deals with NASA's structural distribution was 45 percent on the seats and dummiesand seat experiments, the modifications to the air- and 55 percent on the structures. Most transducerscraft for the AMK experiment are not described in (305) were accelerometers; the remaining 45 chan-detail. The fuel delivery system was extensively mod- nels were strain-gage-type transducers. The instru-ified and each engine carried a turbine-driven AMK mentation layout of the aircraft is shown in figure 4.fuel degrader. This device mechanically "degraded" Seven major frames spaced along the length of thethe properties of the AMK so that the fuel character- fuselage were instrumented from belly to crown toistics were nearly those of Jet A fuel prior to entering measure load transmission during impact (fig. 4(a)).each engine. Further information on this fuel delivery The cross-sectional views show the distribution at asystem is in reference 9. particular frame. Eight bending bridges along the
The floor plan of the CID aircraft is presented fuselage near six of these major frames were installedin figure 3. Two sets of coordinates are used in the to obtain the vertical bending moments duringfigure, both running fore to aft. The usual body sta- impact.tion (BS) system is supplemented by an x-coordinate, The wing instrumentation (fig. 4(b)) was limitedwhich is the distance in inches measured from the in number and was primarily intended for measure-nose of the aircraft. (The origin of the coordinate sys- ment of vertical loads transmitted along the spars.tern used as reference for all accelerations was located Both inboard pylons had two accelerometers at theat the nose, with positive X-axis forward, positive engine connections (fig. 4(c)). These accelerometersY-axis to the right, and positive Z-axis downward, measured the load transmission from the engines toFor convenience, the x-coordinate distances shown in the wings. Each wing also had two strain-gage bend-the various figures are all positive.) Instrumentation ing bridges for measuring vertical bending moments.hardware consisted of 2 DAS pallets (1 in the forward The NASA row of seats was located in the aftcabin and 1 aft), 4 power pallets (cameras and lights), end of the aircraft in anticipation of an aft-end pri-11 cameras (10 NASA plus 1 FAA), and associated mary impact. On the right-hand side of the air-lights. Experiments onboard included seats, galley, craft at BS 1220 (see fig. 3), a standard Airest 2000overhead bins, simulated hazardous cargo, and flight triple passenger seat manufactured by Jebson-Burnsrecorders. Co. carried three dummies. A modified Airest 2000
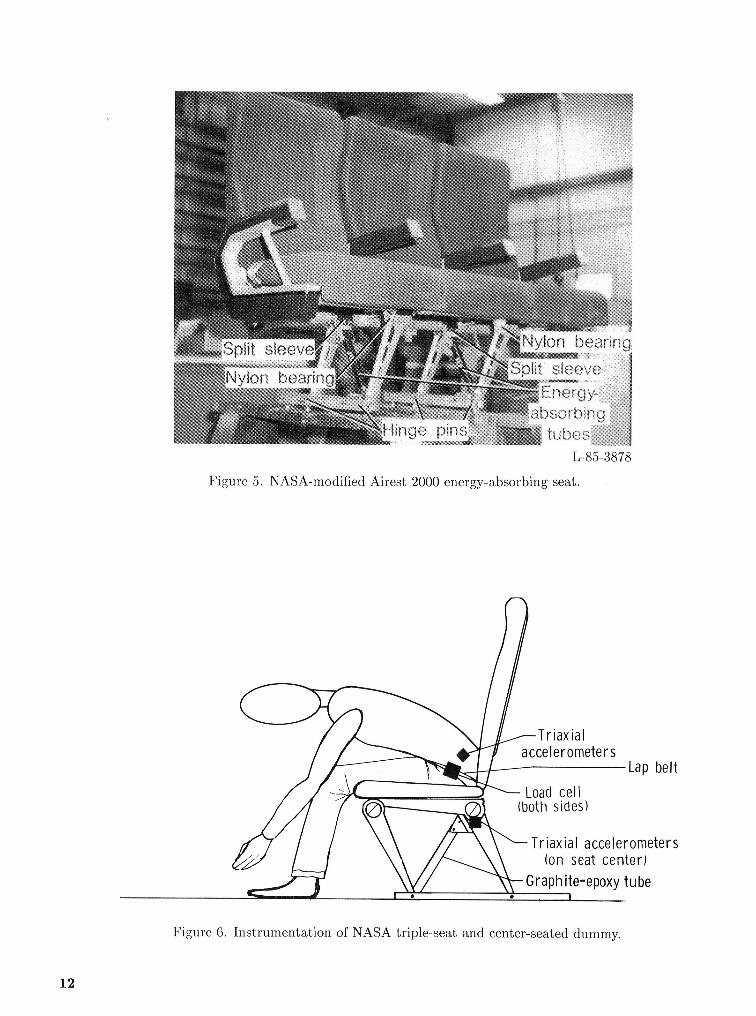
There were 27 seats aboard, with a capacity of seat was situated on the left-hand side, opposite75 occupants. (See table 1.) A variety of typi- the aisle. Langley researchers modified the Airestcal transport seats from _various manufacturers was seat into a collapsible, energy-absorbing configura-used as well as modified seats incorporating desir- tion (ref. 10). As shown in figure 5, several inno-able features for impact. The seats were arranged vative design changes converted the standard triplein widely spaced rows so that one seat experiment passenger seat frame into a forward and downwardwould not interfere with any other seat in case a collapsing four-bar linkage. Split sleeves and nylonfailure occurred. NASA had one row of experimen- bearings were installed at the connections betweental seats aboard at BS 1220. The other seats were the legs and the seat pan tubes. Conventional air-all FAA seats, with the exception of one triple seat craft bolts were used as hingepins at the leg-floor-that belonged to France. Of the 73 dummies placed rail attachment points. The four-bar linkage systemonboard, only 17 were of anthropomorphic research provided proper kinematics for seat stroking. Two
graphite-epoxy energy-absorbing tubes, installed di- (3) 60-Hz data at 8.08 samples per cycle (approxi-agonally between the forward and rear seat legs, mately 485 samples per second). Since the 100-andprovided stability during normal flight and energy- 60-Hz channels were sampled at half the rate of theabsorption capability under crash conditions. The 180-Hz (mainframe) channels, a particular 100- orgraphite-epoxy tubes progressively crushed under ax- 60-Hz (subframe) channel was sampled each alter-ial load during aircraft impact if the loads exceeded nate PCM frame. With the resources available (i.e.,design levels, a rate of 1 megabit per second), the word size was
The schematic drawing in figure 6 illustrates the limited to 8 bits to allow for the relatively high sam-crash position of the center-seated anthropomor- ple rates and the large number of channels.phic dummy and the seat-dummy-restraint-system The conversion of the sensor data in the PCM sys-instrumentation. Both the standard and energy- tem was accomplished with a master converter whichabsorbing NASA seats had similar center-seated in- processed all data sequentially from the analog mul-strumented dummies, tiplexing input cards in the PCM system. The PCM
data from each DAS were recorded redundantly onCID Instrumentation and Data Acquisition two onboard 14-track airborne tape recorders. The
System PCM data on four tracks per recorder were digitallydelayed 256 msec to ensure data acquisition in the
Langley developed the complete instrumentation event of a momentary tape speed perturbation dur-and data acquisition system (DAS) (fig. 7) for the ing the impact. The PCM data, although recordedCID. All accelerometers were piezoresistive and ca- redundantly onboard, were also being transmittedpable of measuring acceleration from 0 Hz to greater redundantly from air to ground via four telemetrythan 1000 Hz. The accelerometer maximum levels transmitting systems to the ground receiver controlwere set to approximately _150G for the normal (i.e, station and mobile recording vans.vertical) direction, _=100G for the longitudinal direc-tion, and +50G for the transverse direction. Data Reduction and Filtering
Each channel was filtered with the appropriate The data shown in this report were taken fromlow-pass four-pole Butterworth filter before sampling the onboard data tapes. Processing was for fourto prevent aliasing errors. There were 101 channels groups: DAS 1 and DAS 2 mainframe data, sampledfiltered at 180 Hz, 243 at 100 Hz, and 6 at 60 Hz. at 969 Hz; and DAS 1 and DAS 2 subframe data,All anthropomorphic-dummy acceleration channels sampled for each alternating PCM frame at 485 Hz.were 180-Hz data channels. The structure acceler- The "prefires," or zero initial conditions, were takenation channels were primarily 100-Hz channels, al- just prior to aircraft take-off. Accelerations were zerothough some 180-Hz channels also were used. The and anthropomorphic-dummy restraint (belt) forcesstrain-gage-type instruments, load cells and bend- were near zero before CID take-off. However, staticing bridges, were connected to 100- or 60-Hz data wing and fuselage bending moments were nonzero atchannels, this time. Thus, data presented in the appendixes
The DAS, as designed, included two independent for bending moments represent the incremental mo-systems each capable of collecting and processing ments above or below the moments that existed justdata from 180 sensors. The signal conditioning units before CID take-off. Some acceleration traces were(used in the DAS) had 30 channels per unit. There further adjusted in plotting when the zero was obvi-were six of these systems in each DAS for a total of ously shifted.180 channels, of which 176 were used for data and Posttest low-pass digital filtering with a computerthe balance for system monitoring. The gain in the algorithm was performed on the data. In the fre-units ranged from 1 to 1000, with a full-scale output quency domain, a cosine function was arbitrarilyof 5 V into the pulse code modulation (PCM) system, used to represent the roll-off region (ref. 11). The
The PCM format for the data was set up in digital filter was used to ",_mooth" the digital naturea frame format with 129 8-bit words per frame of the data and to remove unwanted high-frequencyat a bit rate of 1 megabit per second. Within variations that were associated with the sample ratethis format, 60 words were assigned to the 180-Hz (fig. 8). All structural accelerations were digitallychannels and 58 words were assigned to the 100- filtered with a low-pass 100-Hz digital filter, andand 60-Hz channels. The sampling rates for these the strain-gage instruments (restraint forces, bendingdata channels were as follows: (1) 180-Hz data at bridges, and load links) were filtered with a low-pass5.38 samples per cycle (approximately 969 samples 50-Hz digital filter.per second); (2) 100-Hz data at 4.85 samples per cy- The acceleration traces were all integrated tocle (approximately 485 samples per second); and obtain velocity time histories. When acceleration
4
offsets are not present, the integrated acceleration sink rate of 12 ft/sec. The wing absorbed some of thecan be used to determine the velocity change of the vertical kinetic energy and significantly reduced thestructure. If a very large velocity change is noted, severity of the fuselage impact except for the forwardthe acceleration data are suspect and may have been cabin area near the pilot. The pitch rate that devel-degraded by electrical anomalies (voltage shifts or oped after wing impact increased the sink rate of thevoltage surges), or the accelerometer may have been forward cabin to 18 ft/sec (about 6 ft/sec above thestruck (overloaded), loosened, or separated from its c.g. sink rate) and decreased the aft sink rate propor-mounting, tionally below the c.g. sink rate. Acceleration traces
were integrated for locations fore and aft of the c.g.CID Flight and Crash Impact Parameters to determine the variation of vertical velocity change
With ideal weather conditions on the morning of at impact.December 1, 1984, the CID aircraft took off from Ed- The aircraft continued to yaw during the slide fol-wards AFB under the ground-based remote control lowing impact and contacted the first wing opener atof Fitzhugh Fulton, an experienced NASA test pi- approximately 38° left yaw (fig. 9(c)). This winglot. The gross take-off weight was 200 455 lb, with opener (the third one on right-hand side of center-76 058 lb of AMK fuel onboard. During descent to line) cut through the right inboard engine (No. 3)the impact site, a modified instrument landing sys- and diagonally opened the leading edge and lowertem and a video camera mounted in the aircraft nose wing. The right wing failed, lifted upward as the air-
aided the pilot in guiding the aircraft to an extremely craft continued to slide, and separated, dumping fuelsmall impact footprint 30 ft wide and 200 ft long. during the process (fig. 9(d)). All four wing open-
At an altitude of 200 ft the aircraft was off ers on the right-hand side opened the fuselage, per-
to the right of the target centerline, but not far mitting fuel to enter the fuselage from the bottom.enough for the pilot to abort the approach and Since the right inboard engine was sliced in half, largego around for another attempt. The 150-ft alti- quantities of degraded AMK fuel were exposed to antude was the decision altitude below which the test extremely high-temperature ignition source. Thesecould not be aborted because of activation of time- conditions were beyond the design envelope for AMK
critical, limited-duration onboard photographic and and a huge "fireball" erupted.data recording systems. At the 150-ft altitude the The sequence of events during the first few sec-pilot made a fairly sharp left-aileron control input to onds after impact is shown in figure 10 by a selectbring the aircraft back to the target centerline. This set of vertical acceleration time histories. The timecontrol input initiated a lateral (rolling) oscillation origin was chosen as 09:22:11 Pacific standard timeafter commitment but prior to impact. The pilot (PST). The time from initial left-wing impact to theconcentrated his efforts on damping the oscillations, impact of the right-wing inboard engine with theachieving the best possible alignment with the target wing opener was almost 2 see. Since the fuselage im-centerline and meeting a critical project requirement pact was nose down, the nose-to-tail progression ofof impacting the ground in front of the wing openers, structural response can be seen from the pilot-floorThe structural and seat experiments were planned for and BS 960 curves in figure 10.an impact and slide prior to contacting the artificial The wing-opener impact, an unpredictable air-to-obstructions (wing openers) intended for the FAA ground flight into an obstruction type of accident,AMK experiment. Impact beyond the wing openers is not discussed in detail and loads data from thatwould have jeopardized the AMK experiment if fuel impact are not presented in this report. Majorspillage had not occurred, structural damage to the right wing and to the
Approximately 8000 lb of fuel were consumed in fuselage occurred at contact with the three right-the flight, leaving about 68 000 lb in the tanks. The wing openers. The major fuselage damage occurredgross aircraft weight at impact was approximately when the inboard right wing opener cut through the192 000 lb. Figure 9 is a sequence of photographs il- wing and entered the fuselage center wing box nearlustrating the CID impact. The left outboard engine BS 720. The wing box was cut diagonally and the(No. 1) impacted the ground first with 13° roll, 13° massive center section keel beam was cut throughyaw, and approximately 0° pitch (fig. 9(a)). The air- and separated from the airplane. The wing-openercraft forward speed was approximately 150 knots and damage, along with the fire damage (fig. 11), madethe sink rate was about 17 ft/sec. Impact occurred it difficult to correlate the initial fuselage impact285 ft short of the planned impact area. The fuselage, data with corresponding final structural damage.pitching nose down after left-wing impact, struck the Fortunately, the aircraft forward of the wings wasground 0.46 sec later at the forward cabin (fig. 9(b)), not as severely weakened by fire or impacted by thewith a pitch of -2.5 ° and a center-of-gravity (c.g.) wing openers.
Results From CID Initial Impact duced due to the wing-induced pitching momentwhich caused the nose to hit first instead of the
Results presented here and in the appendixes aft end as planned. Consequently, the peak normalare from the impact and subsequent slide prior to (i.e., approximately vertical) accelerations along thecontacting the wing openers. This initial impact of floor were highest in the cockpit and the forwardthe aircraft fuselage is the event of interest for the cabin near the nose wheel well and were approxi-structural impact experiments. This event occurred mately 14G (fig. 12(a)). The remaining cabin floorin the 1-sec period from 09:22:11 to 09:22:12 PST, received peak normal accelerations typically aboutwhich is the period that is being simulated with crash 7G or less. The aft fuselage experienced accelera-impact computer models, tions below 4G. These accelerations were disappoint-
The overall performance of the NASA DAS and ingly low for the seat experiments since the NASAthe onboard photographic system was excellent, energy-absorbing seat in the aft end of the aircraftNinety-seven percent of the transducers were active was designed to initiate stroking at approximatelyat impact and all 11 onb0ard cameras functioned 10G.
properly. The DAS and the photographic system Peak longitudinal accelerations showed a similarwere enclosed in thermal insulation to assure data distribution, with the highest acceleration being 7Gsurvival in case of fire. The insulation prevented fire in the cockpit and the forward cabin (fig. 12(b)). Thedamage to all information recorded onboard, even accelerations were generally less than 4G over thethough the fire lasted for hours and was hot enough rest of the floor. Peak transverse accelerations on
to melt large holes in the fuselage and to consume the the floor also were generally low. They ranged fromfloor beams, floor, and seats in the aft section. The about 5G in the cockpit to 1G in the aft fuselageonboard film survived the fire and provided unique (fig. 12(c)).
insight into the propagation of fire and smoke in the Generally, the peak averaging technique (triangu-aircraft interior. The aircraft slid for approximately larization) produced good correlation with the peak11 sec after initial impact. By this time the smoke data except at a few locations. Sharp spikes, produc-was so dense in the cockpit that the visibility was ing high peak points, do not correlate with the trian-very poor. After another 5 to 10 sec, visibility was gularization peaks. The triangularized peaks are be-near zero throughout the aircraft, lieved to be more significant than values taken from
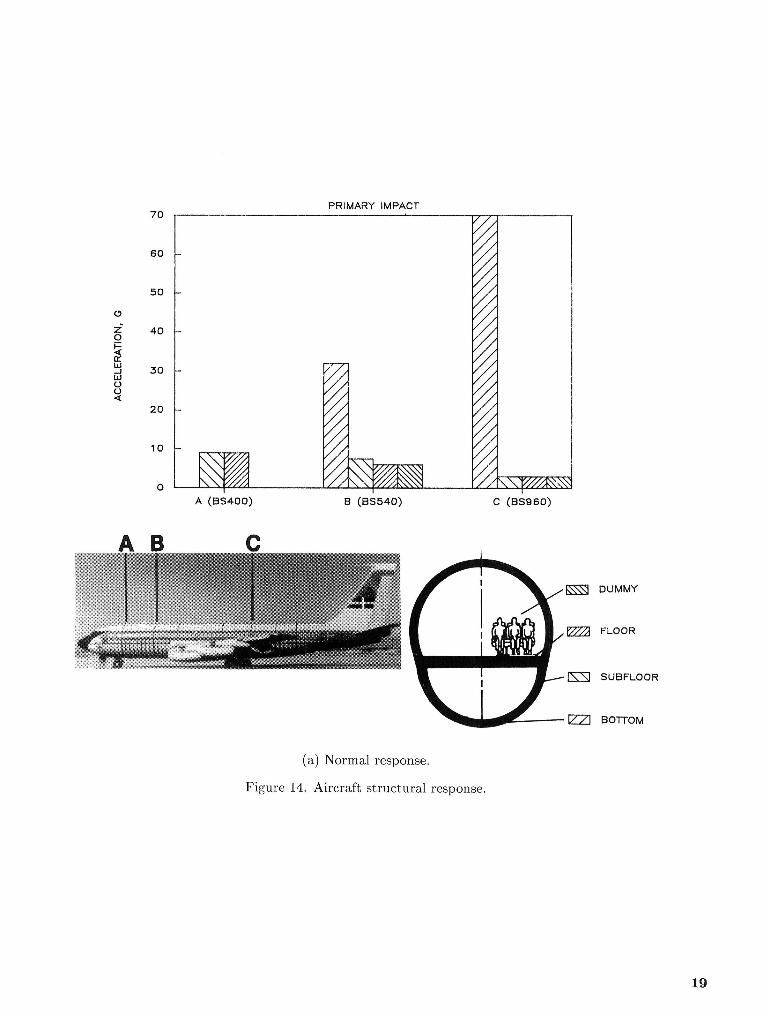
The distribution of impact-induced accelerations unrefined sharp peaks for indicating structural andalong the floor of the aircraft is presented in fig- human response (ref. 2).ure 12. The abscissa is the distance (in inches)mea- Histograms in figure 14 illustrate the struc-sured from the nose. (See fig. 3 for body station-x- tural response interaction and the load path def_coordinate equivalence.) Acceleration levels are plot- inition at various locations along the fuselage atted along the ordinate in G units. The square symbol primary impact. As discussed earlier, the loadsrepresents an acceleration peak read from the indi- were generally higher in the forward fuselage thanvidual filtered time history. The plus symbol repre- in the aft section because of the nose-down im-sents a further refinement, or "peak averaging," of pact of the fuselage, with increased sink veloc-the data which is believed to be more significant for ity at the nose caused by the wing-induced pitchstructural or human response, rate. Values at locations B and C demonstrate
The peak averaged acceleration data point corre- that the load transmission through the fuselagesponding to a particular time history is determined section to the subfloor and dummies was signifi-in this manner: The pulse duration corresponding to cantly reduced by the crushing and energy absorp-the primary impact is determined. Integration over tion of the fuselage structure. At fuselage location Bthis interval yields the change in velocity which, when (BS 540), for example, the fuselage bottom expe-divided by the duration, yields the average acceler- rienced a sharp peak normal acceleration of 32Gation. Doubling the average acceleration to obtain and 0.04 sec duration (fig. 15(a)). At the sub-the data points represented by pluses is effectively floor, the transmitted load was reduced by struc-a triangularization of the actual acceleration pulse, tural deformation to about 7G, with duration in-(See fig. 13.) creased to 0.15 sec (fig. 15(b)). The loads at floor
Overall, the fuselage impact loads, as measured level were nearly the same as at the subfioor atalong the floor, were survivable as defined by ac- this location (fig. 15(c)). The acceleration time his-cepted criteria for human tolerance (ref. 12). The tories (fig. 15(d)) from the seat and the dummy'sloads were substantially lower than anticipated be- pelvis at this location show that the higher fre-cause the left-wing impact reduced the c.g. sink ve- quencies have been filtered out by the seat cush-locity. Loads in the aft section were further re- ion, pan, and soft dummy material, but that the
6
acceleration and duration were essentially un- Concluding Remarkschanged. No seat dynamic load amplification oc- NASA and the FAA have conducted the first re-curred during load transmission to the dummy,s motely piloted transport crash test of a Boeing 720pelvis at this location, aircraft. The primary interest of NASA in the Full-
The large peak accelerations at the fuselage bot- Scale Transport Controlled Impact Demonstrationtom at BS 960 (the rear main landing gear bulkhead) (CID) was the structural behavior of the aircraft as-occurred later than the peak accelerations at BS 400 sociated with impact. The FAA was interested inand 540. The fuselage bottom at BS 960 contacted the fire-retardant behavior of antimisting kerosene.the ground at 0.86 sec after initial impact with low Acceleration and load levels measured in the CIDimpact velocity. The floor and subfloor accelerations were substantially lower overall than anticipated be-peaked at approximately 3G at BS 960 over the entire cause the left-wing impact reduced the center-of-primary impact sequence. The accelerometers on the gravity sink velocity from approximately 17 ft/sec torigid bulkhead at the fuselage bottom at BS 960 were 12 ft/sec. A pitch rate was induced by the wing im-overloaded and show very high peaks (see figs. 14(a) pact, causing the aircraft to impact with the noseand 14(b)). Consequently, the peak values from ac- down 2.5 °. Consequently, peak normal (i.e., ap-celerometers at the fuselage bottom may not be ac- proximately vertical) accelerations along the floorcurate. (See appendix A.) were highest in the cockpit and the forward cabin
The overall fuselage crush, as shown in figure 16, near the nose wheel well and were approximatelywas determined after the test by measuring the dis- 14G. (All accelerometer data were passed through atance from floor to ground on both sides of the fuse- 100-Hz low-pass digital filter.) The remaining cabinlage. The left and right fuselage measurements were floor received peak vertical accelerations typicallyaveraged and this value was subtracted from the about 7G or less. The aft fuselage experienced accel-pretest floor-to-underbelly height to obtain overall eration magnitudes below 4G. The peak longitudi-crush data. Since the aircraft was rolled and im- nal accelerations showed a similar distribution, withpacted the left side first, the left side showed more the highest accelerations being 7G in the cockpit anddeformation than the right, the forward cabin. The accelerations were generally
less than 4G over the rest of the floor. Peak trans-These data indicate 6 to 7 in. of average ver-
tical crush in the forward cabin area at the point verse accelerations on the floor were also low. Theyof contact near the nose wheel well, 9 in. of crush ranged from about 5G in the cockpit to 1G in the aftforward of the wing, and 6 in. of crush aft of the fuselage.wing. The fact that the forward cabin did not The appendixes contain over 330 data traces ofcontact the wing openers gives some credence to accelerations and loads for the first second after wingthose crush measurements, even though intense heat impact. These data offer insight into the transmis-may have contributed to the deformation. How- sion of loads through the structure and into the seatsever, the crush data aft of the wing is suspect be- and the dummies. These data are also being used tocause of the loss of structural integrity after impact corroborate nonlinear dynamic finite-element struc-with the wing openers and because of the intense tural analysis computer programs developed to sim-heat. ulate transport crashes. Since all 11 interior cameras
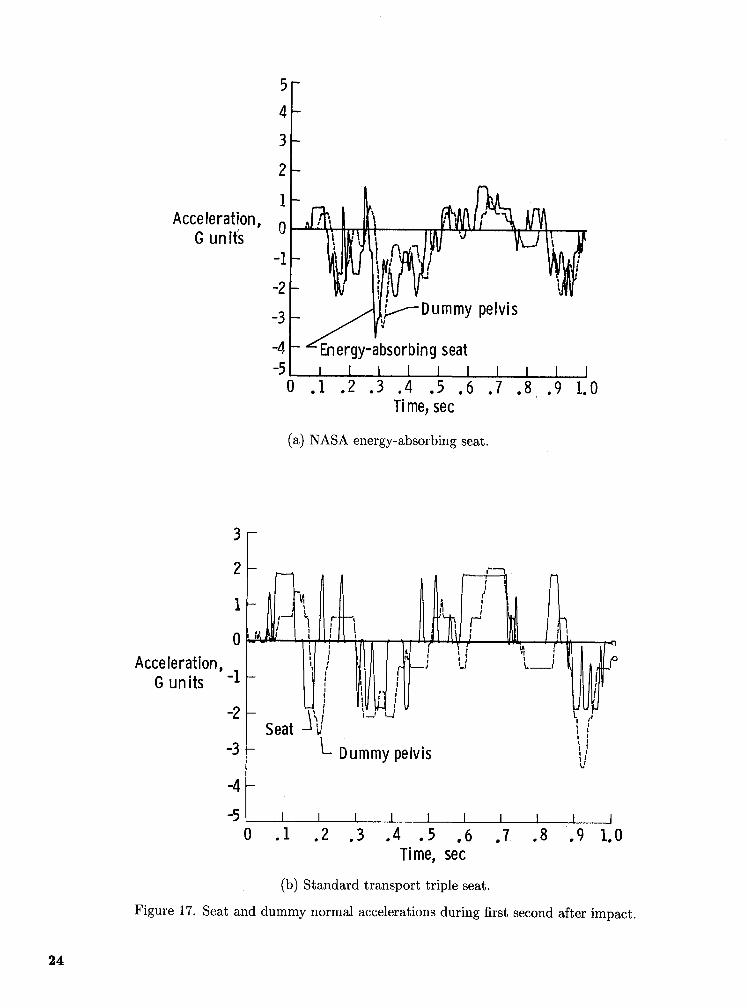
functioned properly, the crash behavior of the inte-The NASA energy-absorbing seat in the aft fuse- rior of the aircraft was graphically captured. The
lage experienced loads well below the 10G required films are unique and contain significant informationto initiate stroking, and consequently it did notstroke. Figure 17(a) contains the normal accelera- on fire propagation and smoke obscuration.From an occupant human tolerance standpoint,tion time histories of the energy-absorbing seat and the CID primary impact loads were survivable. Thethe dummy's pelvis superimposed to illustrate these pilot and crew area received the greatest impactlow accelerations and the similarity of response, with forces. The NASA energy-absorbing seat in the aftthe pelvis response (without amplification) lagging fuselage experienced low load levels, well below thethe seat response, as expected. 10G required to initiate stroking, and consequently
The corresponding normal acceleration time his- it did not stroke. Data from the impact with thetories for the standard triple seat across the aisle from wing openers and the effectiveness of the antimistingthe NASA energy-absorbing seat are presented in fig- kerosene were not assessed in this paper.ure 17(b). The performance results are comparableto the NASA energy-absorbing seat within the ac- NASA LangleyResearch Centercuracy of the measuring equipment at this low load Hampton, VA 23665-5225level. June 5, 1986
7
TABLE 1. CID AIRCRAFT SEAT AND DUMMY SUMMARY
(a) Dummies
Type Total number Number instrumentedAnthropomorphic (NASA) 6 2Anthropomorphic (FAA) 11 11CPR 55Baby 1
Total 73 13
(b) Seats
Type Number of seats Occupant placesPilot seat (single) 1 1Flight attendant (double) 2 4Aft facing 2 4Triple seats 22 66
10 IG 0 .... f -,-,-,,-v-.,--._----_ - "1,1 Fuselagebottom
-lO I I_ (BS960) 25-20 I Acceleration,I I Engineno. 0 Gunitst II II I -25
it i _ _ , i_ j , i It I i i i i I I J iF i j0 .5 1.0 1.5 2.0
Time,sec
Figure 10. CID sequence of events.
14
L-84-13,964(a) Overall view.
L-86-319
(b) Interior aft view.
Figure 11. Post-CID damage.
15
16-
14- I_ []
E] Peak
]_2 -- + Twiceaverage
10-[] []
Acceleration, 8 - :1: +Gun its + +
4- +
2-- [] _"' []"1" +
I I I I I I0 .2 .4 .6 .8 ].0 1.2x 10³
x-coordinate,in.
(a) Normal accelerations.
10--
[] Peak
8 - Jr Twiceaverage
[]E3
6 -Acceleration,
Gun its
4 - []
2- € t" {_
.
I I I I I I0 .2. .4 .6 .8 1.0 1.2x10³
x-coordinate,in.
(b) Longitudinal accelerations.
Figure 12. Floor accelerations for fuselage impact. T = 0.5 sec.
16
]0 -
_[] Peak
+ Twiceaverage
6-Acceleration,
G units []
4-[]
[]2- + []
++ + []
0 .2 .4 .6 .8 l.O 1.2x 10³
x-coordinate,in.
(c) Transverse accelerations.
Figure 12. Concluded.
17
BS 540 (Frame2) Normaldirection
2 CID floor BS540
o I Ill 1R! oAcceleration,Gun its !
i- Averageacceleration= 3.1GII-4I
I I I-6 i'._- -.-!AT= 0.14
o i-5 - I
Velocity, /
ft/sec-10_15--AV =jI o-20 , i 7 T ] T"- _-"--rv _ 7
0 ..I .2 .3 .4 .5 .6 .7 .8 .9 1.0
Time,sec
Figure 13. An example of acceleration, velocity change, and average acceleration for a typical data channel.The triangular equivalent pulse would have a peak acceleration of 6.2G (twice average).
18
PRIMARY IMPACT
70 //.,/ / /
/ /.,
60 ," / /
1/I
//x
50 _//r / •
(.9 I/ _
i 40 " / ",. / /
o o///W
-- 30 //,hi _ o0 . . ,//--0 / / ,--.----
i/// ,-/,20 ¢ _
¢ / /
// //_
10 //.. "/"
€ / ,
A (BS400) B (BS540) C (BS960)
A B C
DUMMY
FLOOR
SUBFLOOR
EZ] BOTTOM
(a) Normal response.
Figure 14. Aircraft structural response.
19
PRIMARY IMPACT60
77//
i /
50 //// //// ///'./. //
40 // /I// //I/ I/
o -°o- //
30 //// //_/"' II I/.J,,, // //o // //
20 ii i/.. //// //// //
io // //
////
A (as4oo) e (BSS40) C (BSgSO)
BOTTOM _ SUBFLOOR I_ FLOOR I_ DUMMY
(b) Longitudinal response.
(c) Transverse response.
Figure 14. Concluded.
2O
15-
I0-
5 --
ol _" '-5
Acceleration,-10 -Gunits
-15 -
-20-
-25-
-30 -
-35 _ I I l I, I I I I0 .1 .2 .3 .4 .5 .5 .7 .8 .9 1.0
Time,sec
(a) Fuselage bottom.
2r10
-2Acceleration,
Gunits -3-4
-5
-6
-7-8 I I I I I I 1 I I
0 .1 .2 .3 .4 .5 .6 .7 .8 .9 1.0Time,sec
(b) Fuselage subfloor.
Figure 15. Peak normal acceleration at BS 540 during first second after impact.
21
2
1
0
-l
-2Acceleration,Gunits -3
-4
-5
-6
-7-80 .I .2 .3 .4 .5 .6 .7 .8.91.0
Time,sec
(c) Fuselage floor.
-8 I I I I q I I I a I0 .l .2 .3 .4 .5 .6 .7 .8 .9 l.O
Time,sec
(d) Seat and dummy pelvis.
Figure 15. Concluded.
22
BS 130 380 540 600J 820 960 1220
I
H
15 I_INASACrush,10 GCrashinvestigators
in. 50
380460540 820 920Bodystation
Figure 16. Fuselage crush.
23
4-
3-
2-
1
Acceleration, 0Gunit3
-1
-2
-3 _---- Dummypelvis
-4 Energy-absorbingseat-5
0 .i .2 .3 .4 .5 .6 .7 .8. .9 1.0Time,sec.
(a) NASA energy-absorbing seat.
0i0
Acceleration,Gunits -1
Seat i i-3 - _- Dummypelvis
-4--
-5 I I I I L I I I , I I0 .1 .2 .3 .4 .5 .6 .7 .8 .9 1.0
Time,sec
(b) Standard transport triple seat.
Figure 17. Seat and dummy normal accelerations during first second after impact.
24
Appendix A Fuselage Normal Acceleration Time Histories
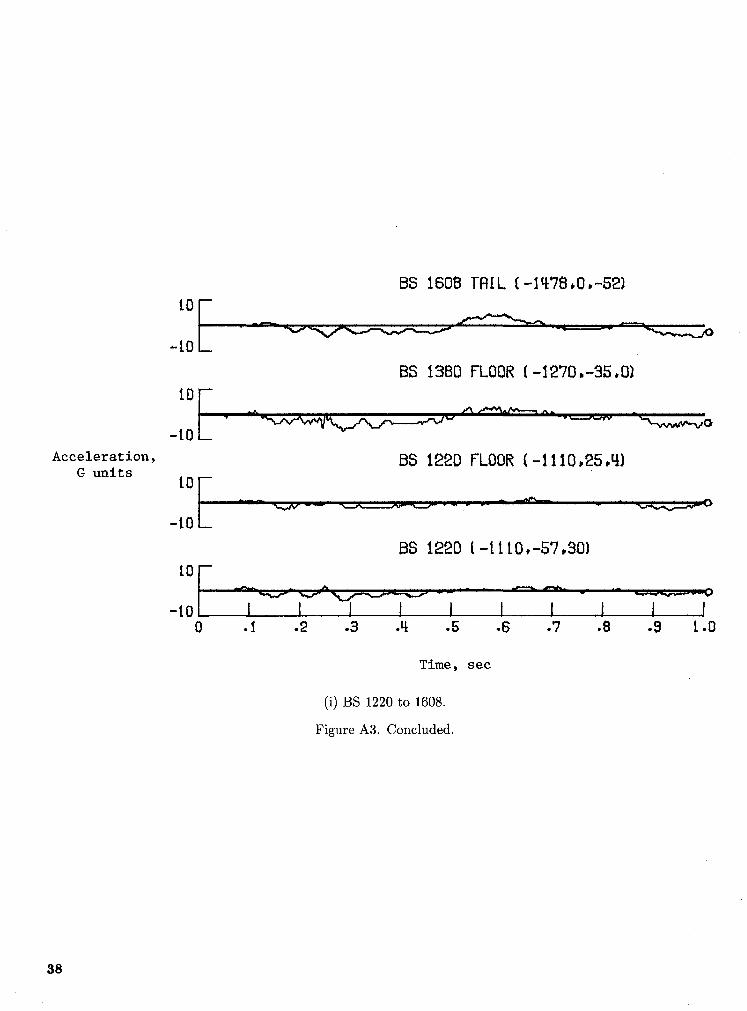
Figures A3(a) to A3(i) show the normal (Z-Fuselage Accelerations, Loads, and direction) acceleration time histories for the first sec-Bending-BridgeData ond after left-wing impact for 63 accelerometers lo-
This appendix includes fuselage accelerations, cated on fuselage structures. The accelerations in theloads measured in the links supporting an overhead interval from wing contact (0 sec) to about 0.46 secstorage bin experiment, and fuselage vertical bend- were 5G or less and were due to crushing of the lefting moments for the first second after wing impact, wing. After wing contact, the aircraft, initially level,For brevity a small number of data channels were began to pitch forward. At 0.46 sec the forward fuse-omitted if redundant or if the traces contained ob- lage impacted the ground near the nose wheel well
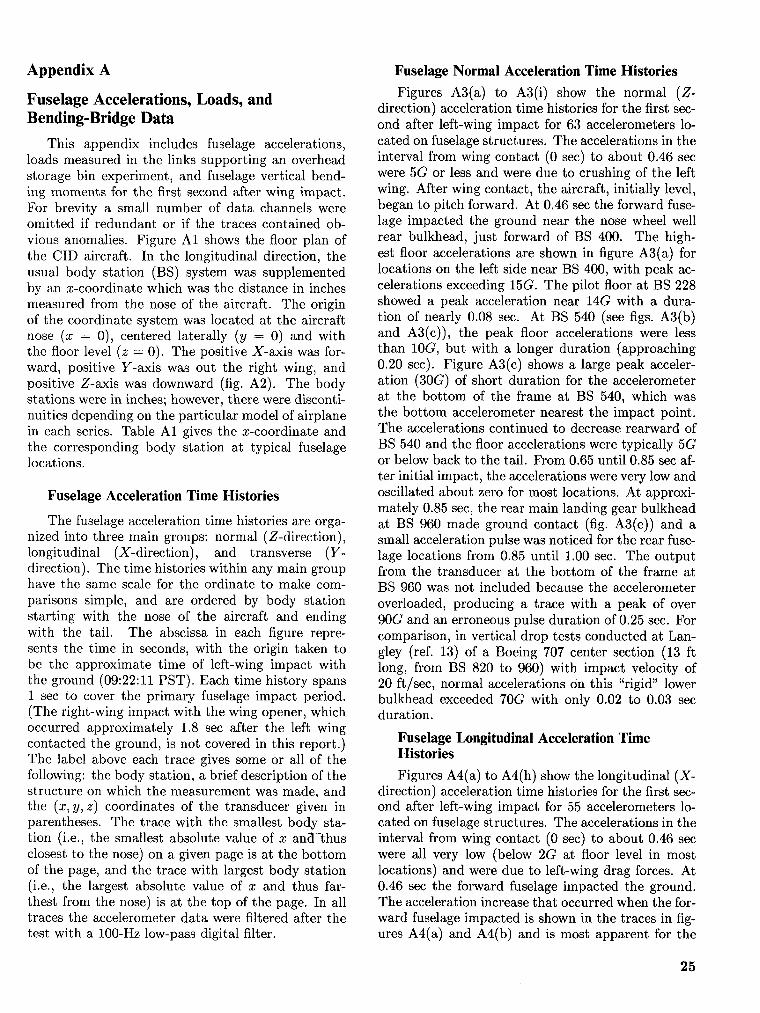
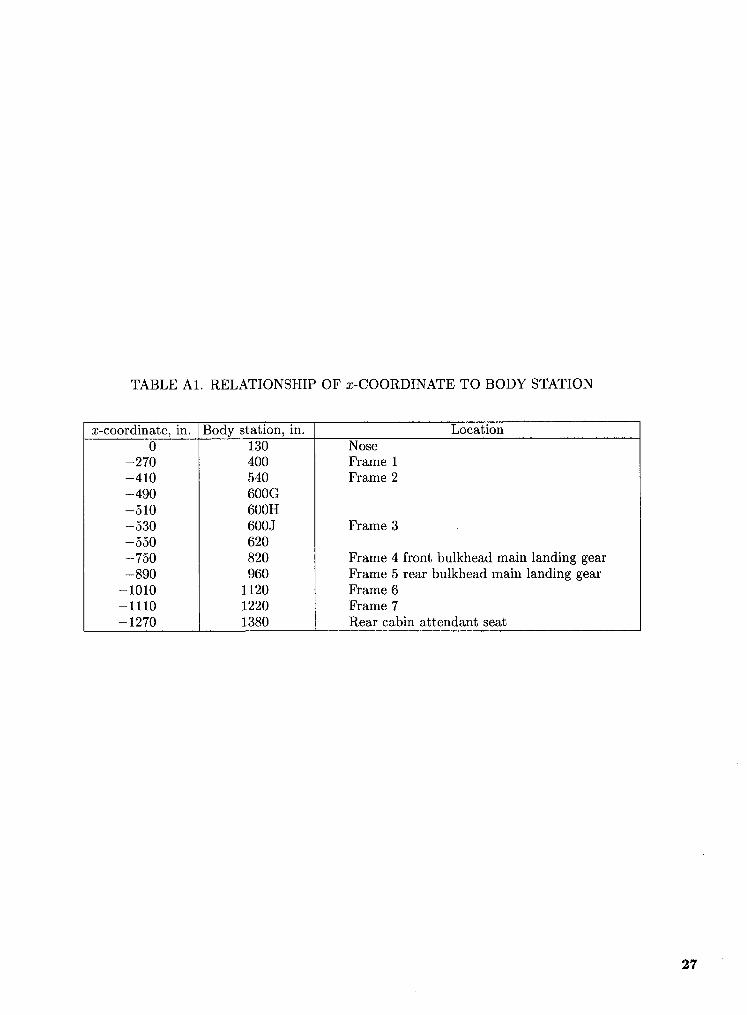
vious anomalies. Figure A1 shows the floor plan of rear bulkhead, just forward of BS 400. The high-the CID aircraft. In the longitudinal direction, the est floor accelerations are shown in figure A3(a) forusual body station (BS) system was supplemented locations on the left side near BS 400, with peak ac-by an x-coordinate which was the distance in inches celerations exceeding 15G. The pilot floor at BS 228measured from the nose of the aircraft. The origin showed a peak acceleration near 14G with a dura-of the coordinate system was located at the aircraft tion of nearly 0.08 sec. At BS 540 (see figs. A3(b)nose (x = 0), centered laterally (y = 0) and with and A3(c)), the peak floor accelerations were lessthe floor level (z = 0). The positive X-axis was for- than 10G, but with a longer duration (approachingward, positive Y-axis was out the right wing, and 0.20 sec). Figure A3(c) shows a large peak acceler-positive Z-axis was downward (fig. A2). The body ation (30G) of short duration for the accelerometerstations were in inches; however, there were disconti- at the bottom of the frame at BS 540, which wasnuities depending on the particular model of airplane the bottom accelerometer nearest the impact point.in each series. Table A1 gives the x-coordinate and The accelerations continued to decrease rearward ofthe corresponding body station at typical fuselage BS 540 and the floor accelerations were typically 5Glocations, or below back to the tail. From 0.65 until 0.85 sec af-
ter initial impact, the accelerations were very low and
Fuselage Acceleration Time Histories oscillated about zero for most locations. At approxi-mately 0.85 sec, the rear main landing gear bulkhead
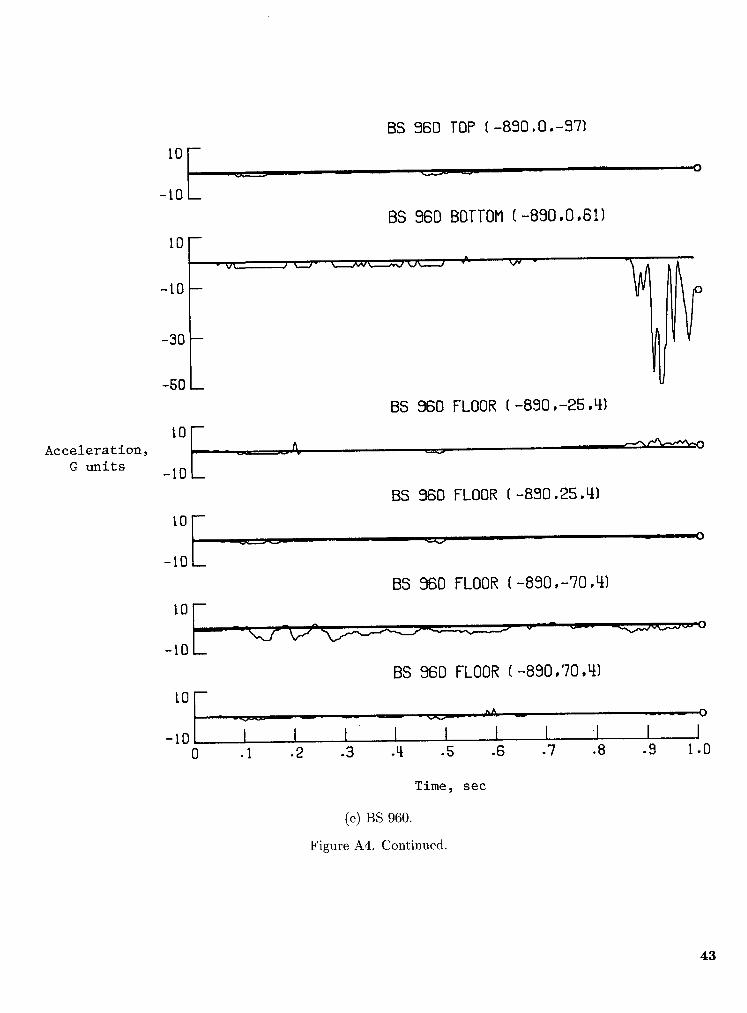
The fuselage acceleration time histories are orga- at BS 960 made ground contact (fig. A3(e)) and anized into three main groups: normal (Z-direction), small acceleration pulse was noticed for the rear fuse-longitudinal (X-direction), and transverse (Y- lage locations from 0.85 until 1.00 sec. The outputdirection). The time histories within any main group from the transducer at the bottom of the frame athave the same scale for the ordinate to make corn- BS 960 was not included because the accelerometer
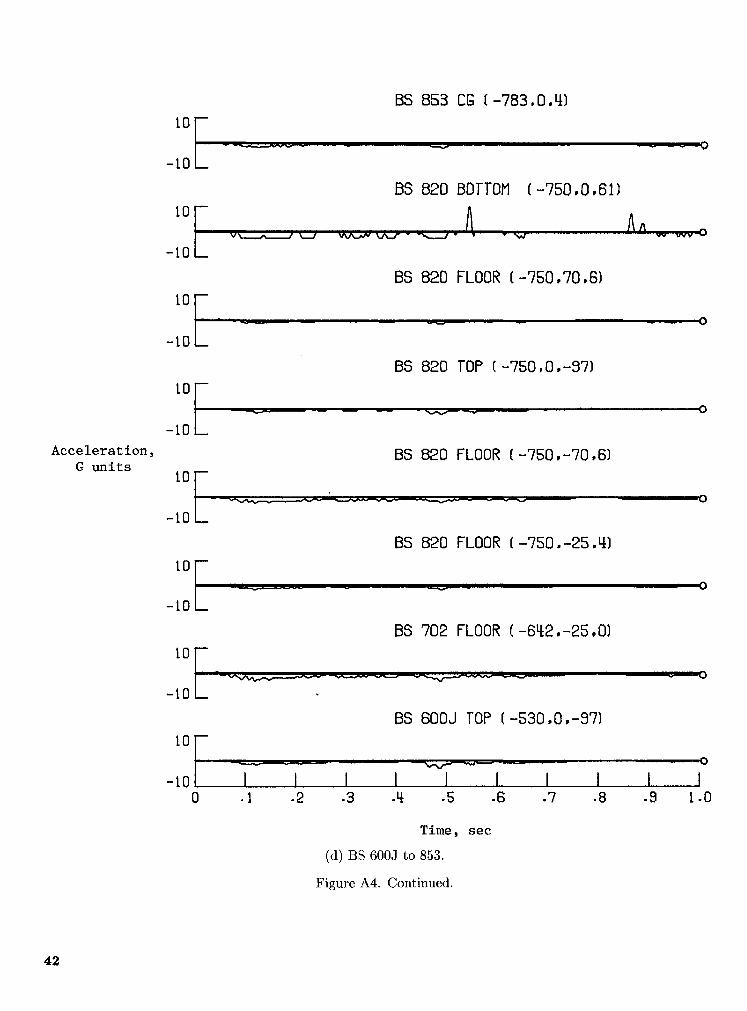
parisons simple, and are ordered by body station overloaded, producing a trace with a peak of overstarting with the nose of the aircraft and ending 90G and an erroneous pulse duration of 0.25 sec. Forwith the tail. The abscissa in each figure repre- comparison, in vertical drop tests conducted at Lan-sents the time in seconds, with the origin taken to gley (ref. 13) of a Boeing 707 center section (13 ftbe the approximate time of left-wing impact with long, from BS 820 to 960) with impact velocity ofthe ground (09:22:11 PST). Each time history spans 20 ft/sec, normal accelerations on this "rigid" lower1 sec to cover the primary fuselage impact period, bulkhead exceeded 70G with only 0.02 to 0.03 sec(The right-wing impact with the wing opener, which duration.occurred approximately 1.8 sec after the left wingcontacted the ground, is not covered in this report.) Fuselage Longitudinal Acceleration TimeThe label above each trace gives some or all of the Historiesfollowing: the body station, a brief description of the Figures A4(a) to A4(h) show the longitudinal (X-structure on which the measurement was made, and direction) acceleration time histories for the first sec-the (x, y, z) coordinates of the transducer given in ond after left-wing impact for 55 accelerometers lo-parentheses. The trace with the smallest body sta- cated on fuselage structures. The accelerations in thetion (i.e., the smallest absolute value of x and-thus interval from wing contact (0 sec) to about 0.46 secclosest to the nose) on a given page is at the bottom were all very low (below 2G at floor level in mostof the page, and the trace with largest body station locations) and were due to left-wing drag forces. At(i.e., the largest absolute value of x and thus far- 0.46 sec the forward fuselage impacted the ground.thest from the nose) is at the top of the page. In all The acceleration increase that occurred when the for-traces the accelerometer data were filtered after the ward fuselage impacted is shown in the traces in fig-test with a 100-Hz low-pass digital filter, ures A4(a) and A4(b) and is most apparent for the
25
trace labeled "BS 540 Bottom (-410, 0, 61)" in fig- strain gage on the third link was not operative. Theure A4(b). This accelerometer, located on the bot- loads were initially zeroed and the values shown aretom of the frame at BS 540, showed a very large spike above and below the static value. As shown in(50G) near 0.50 sec. This acceleration was very local- figure A6, the load is oscillatory but does not exceedized, was of short duration, and was not transmitted 100 lbf for the first second after wing impact. Ininto the surrounding structure, as can be seen by an- addition to the links, a triaxial accelerometer wasalyzing the other traces for BS 540 in figures A4(b) located on a fixed mass attached to the storage bin.and A4(c). The longitudinal accelerations measured Accelerations are shown in figures A3(b), A4(b), andon the floor were all low, with peak values below 10G A5(a).and with average accelerations over time in the 2G to
3G range. The trace for the bottom of the fuselage Fuselage Vertical Bending-Bridge Dataframe at BS 960 (the main landing gear bulkhead) infigure A4(e) is included to indicate rear-fuselage ira- Figure A7 shows the moment time histories ofpact, However, this accelerometer was mounted on the eight bending bridges located on the fuselage atthe very stiff center section designed to carry main BS 410 to BS 1250. The bridges were located at crit-landing gear loads. The velocity change obtained ical areas such as production breaks, geometric tran-from integrating this acceleration was quite large, sitional areas, and areas where maximum bendingindicating that the transducer output was probably moments were expected. Each bending bridge wasoverloaded and not a valid output, made with temperature-compensated strain gages in
a four-arm bridge configuration. To measure theFuselage Transverse Acceleration Time fuselage bending, two of the strain gages were bondedHistories to the crown of the fuselage and two were bonded ei-Figures A5(a) to A5(d) contain 29 acceleration ther in the vicinity of the floor or close to the bottom
time histories for the transverse (Y) direction. The of the fuselage at six locations.initial acceleration pulse from 0.05 to 0.20 sec was In the data reduction process, an initial staticdue to the left-wing contact. For many locations, this reading (prefire) was taken for each bending bridgepulse was the most significant when both duration shortly before CID take-off. This value was sub-and magnitude are considered. Since the airplane tracted to give each bending moment a zero initialwas yawed at impact, the transverse accelerations value with the aircraft sitting on the ground. Con-were larger than anticipated. However, the peak sequently, all bending-moment traces shown in thistransverse acceleration was no more than 5G for appendix are incremental moments above or belowmany locations. The largest peak measured (30G) the static moment that existed with the fully loadedwas at 0.86 sec (fig. A5(b)) for the bottom of the airplane on the ground prior to take-off.frame at BS 820. This is the location of the main The highest vertical bending moments werelanding gear wheel well forward bulkhead, a very recorded at BS 1030, a slightly lower value atrigid structural bulkhead. BS 600J-10 (i.e., 10 in. in front of BS 600J), and the
smallest value at BS 410 near the nose. There is sire-
Loads in Overhead-Bin Support Links ilarity in the shape of all traces (except for that fromFigure A6 shows the load in pounds for two of BS 410, which lost the signal after about 0.58 sec);
three supporting links for the overhead-storage-bin this similarity indicates the validity of the bending-experiment located at BS 540. Unfortunately, the bridge data.
26
TABLE A1. RELATIONSHIP OF x-COORDINATE TO BODY STATION
x-coordinate, in. Body station, in. Location0 130 Nose
Figure A6. Loads in two links that support the overhead storage bin located at BS 540.
51
2.5 X I07 BS i250 FUSELagEBRIDGE B
F
2.5 x 10⁷ B8 II30 FUSELRGEBRIDGEY
B8 i030 FUSELRBEBR[DgE
2,5 __10_ B8 1030 FUSELRGEBRIDGE5
Moment, B_ 800J-lO FUSELAGEBRIDGE_in-lb f _,5 __i0_
BS SO0,]-lORJSELRGEBRIDGE 3
2,5 _I0 7-_.SL- -_/'-""_-_J-_-_
2.5 x iO7 BS 510 FUSELRGEBRIDGE
2,._ x to7 BS _lO FUSE'LIqGEBRIDGE1
F _ _
-e.51 I I I I _ I I I I IO •t .2 .3 ,q .5 .6 .7 .B .9 t .0
Time, sec
Figure A7. Fuselage vertical bending moment time histories.
52
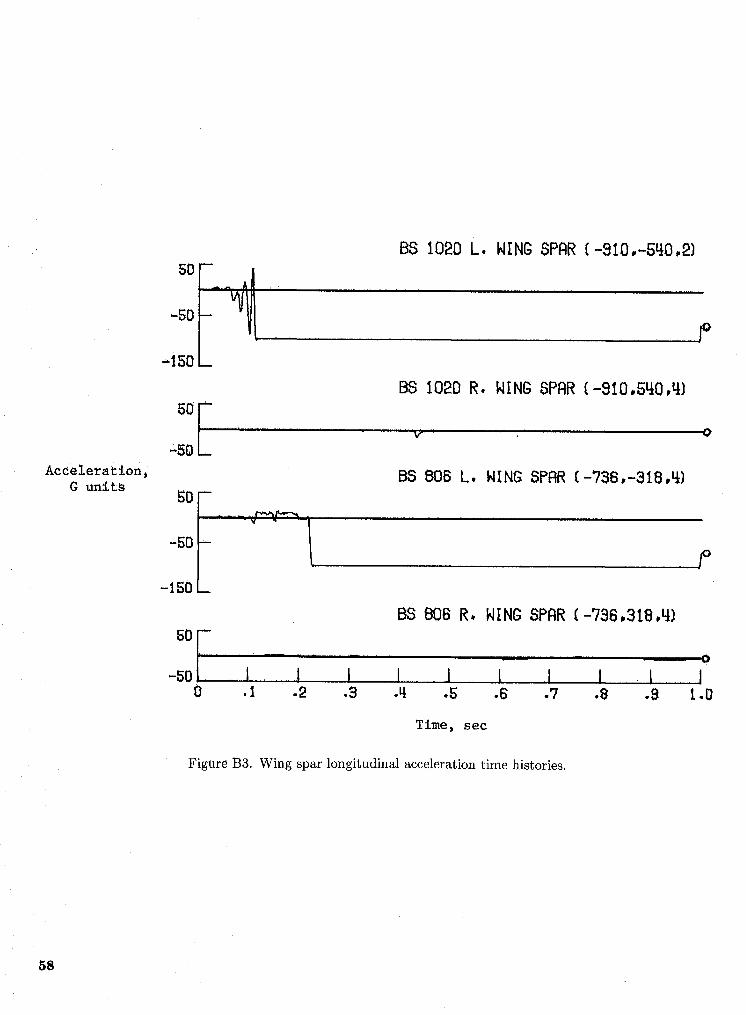
Appendix B left-wing spar. (See fig. B2(b).) This trace shows apeak acceleration that exceeded 150G at a time near
Wing Accelerations and Vertical Bending 0.08 sec. Shortly afterwards, just before 0.1 sec, theData left-wing tip registered a peak of 130G (fig. B2(c)),
and at 0.12 sec the No. 2 engine lower pylon ac-This appendix includes wing accelerations for the
normal (Z-direction) and longitudinal (X-direction) celerometer showed a peak near 150G and then wentoff the scale (fig. B2(a)). The last acceleration to goaircraft body directions and wing vertical bending off the scale was for the accelerometer located on the
moments for the 1-sec period after initial left-wing front spar behind the No. 2 engine (fig. B2(a)). Theimpact with the ground. In the longitudinal di- No. 2 engine upper pylon accelerometer registered arection, the usual body station system was supple- maximum acceleration of only 50G. The other wingmented by an x-coordinate, which was the distance accelerometers on the left wing all were well belowin inches measured from the nose of the aircraft. The
50G. All the right-wing accelerometers showed rein-origin of the coordinate system was located at the tively low levels.aircraft nose, with positive X-axis forward, positive
Y-axis out the right wing, and positive Z-axis down- Wing Longitudinal Accelerationsward. Figure B1 shows the accelerometer locationsfor the left wing. The right wing was instrumented There were only four longitudinal accelerometerssimilarly. The time histories for wing acceleration located on the wings. They were located on the frontdata and wing vertical bending data are given in fig- spar directly behind each engine. Both traces fromures B2 to B4. The abscissa in each figure repre- accelerometers on the left wing go off the scale. Thesents the time in seconds, with the origin taken to accelerations for the No. 1 engine at BS 1020 (seebe the approximate time of left-wing impact with fig. B3) peaked first at the maximum range of 100Gthe ground (09:22:11 PST). Each time history spans and went off the scale. The left-wing: accelerometer1 sec to cover the primary fuselage impact period, behind the No. 2 engine went off the _scalejust afterThe label above each trace gives some or all of the 0.2 sec. The right-wing accelerometersdn comparisonfollowing: the body station, a brief description of showed very low levels.the structure on which the measurement was made,and the (x, y, z) coordinates of the transducer given Wing Vertical Bending-Moment Datain parentheses. All accelerations and bending-bridgedata were filtered after the test with 100- and 50-Hz Figure B4 shows the wing vertical bending-bridge
traces. Two bridges were located on each wing, anlow-pass digital filters, respectively. "inner" bridge located near the wing root and an
"outer" bridge located on the wing between the twoWing Normal Accelerations engines. Each bridge consisted of four strain gages,
Figures B2(a) to B2(c) show 14 wing normal (Z- two on the front spar and two on the rear spar. Thedi.rection) acceleration time histories. Several of the bridges were calibrated in units of inch-pounds. Thewing accelerations went off the scale but are still in- values shown are incremental values above the initialcluded for completeness. The maximum acceleration zero taken with the aircraft fueled just before take-range was approximately +150G in the normal direc- off. The four traces shown in figure B4 unfortunatelytion and +100G in the longitudinal direction. The go beyond the maximum range, and all saturate atleft outboard engine (No. 1) contacted the ground approximately 0.3 sec after left-wing impact. Atfirst. No accelerometer was located on the No. 1 en- 0.1 sec, the left inner bridge showed the highest valuegine or pylon. The accelerometer nearest to the ini- (-3.5 × 10⁷ in-lbf) and the right outer bridge showedtial impact point was located at BS 1020 on the front the lowest value (-0.8 × 10⁷ in-lbf).
53
Bothwings i
BodyeBiaxial(N,L) x-coordinate,in"NormalIBendingbridge Front spar _ 624
699
NaCelle _ 736
r spar870910
, 980
Apl. --- 1104
Figure B1. Wing accelerometer and strain-gage locations.
54
BS 806 R. N_'NGSPAR(-736,3tB,L[l
'0
-50
B8 806 L. kING SPAR(-7:36,-318,U_)50--
-t50 _
R. ENGINEPYLON(-693,319,-32}
L-50
Acceleration, L- ENG[ NE PYLON( -6_9 ,-333 ,-32}G units
-tSO -]o
L. ENGINEPYLON(-62t,-32_,-2_}
50 F M ..... _ _ , _ _ . ...... :_
-,oL-vVR- ENGINEPYLON(-62u_,328,-2u_]
I I I I' I I II II I I" 'l _
-5O I I I I , I I I I ,I l0 .t .2 ._ .a .5 .s .7 .8 ._ t.a
Time, sec
(a) Engine pylon and wing spar locations.
Figure B2. Wing normal acceleration time histories.
55
56
8S 121_L. H[NG TIP {-II04,-733,2}50-
•
Acceleration, -_0 --G units
-1500 .I .2 .3 .q .5 .6 .V .8 .9 t.O
Time, sec
(c) Wingtiplocation.
Figure B2. Concluded.
5?
BS 1020 L. H[NGSPAR{ -910,-5q0,2}50"' i
-so- jo-150 _
1020R. H[NOSPAR{-910,5qOA)
'°[ - i r , i iV O
-50
Acceleration, B_ 806 k. HINGSPAR(-736,-318,½)G units
50-
-150 _
BS 806 R. WING;SPAR{-736,318,u,}
6o[r-r .... - - . o-501,,,I,, I , I I , I I I I I,,,I
0 . I .2 .3 .u, .5 .6 .7 .8 .9 t .0
Time, sec
Figure B3. Wing spar longitudinal acceleration time histories.
58
B@700/B70 R. WINg BRIDGE INNER
BS 700/_0 L, WINg BRIDGE INNER
Moment, 0 X IO7 B8 830/_0 R._WIN8 BRIDGE OUTER
in-lbf [ _ / -"'------'¢
LBS 830/980 L. _IN_ BRIDGEOUTER
O _ _07 .......
-5 I I I I I I I I I I0 ,[ .2 .3 ._ .5 .6 ,7 .B .9 t.O
Time,sec
Figure B4. Wing vertical bending moments.
59
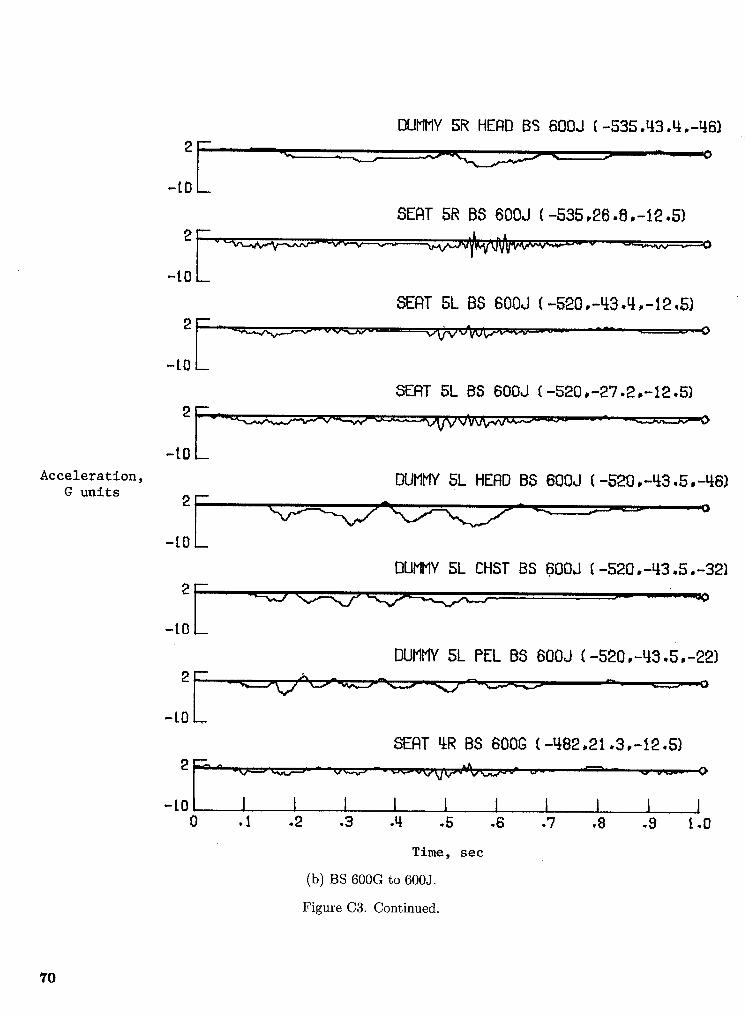
Appendix C Seat and Dummy Normal Accelerations
Seat and Anthropomorphic-Dummy The 39 normal (Z-direction) acceleration timeAccelerations and Loads histories measured on the seats (aircraft axis system)
and in the dummies (dummy axis system) are pre-Included in this appendix are seat and sented in figure C2. The pilot received the greatest
anthropomorphic-dummy accelerations and restraint normal acceleration, with a nearly triangular acceler-(i.e., lap-belt and shoulder-harness) loads for the ation pulse (fig. C2(a)). When integrated, the peakfirst second after initial left-wing impact with the pelvis acceleration of 18.3G (base duration of aboutground. In the longitudinal direction, the usual 0.075 sec) gives a velocity change over 17 ft/sec. Thisbody station system was supplemented by an x- was the largest measured dummy or seat normal ac-coordinate, which was the distance in inches mea- celeration and it occurred at the time of forward-
sured from the nose of the aircraft. The origin fuselage ground impact (0.46 sec). From humanof the coordinate system used to locate transduc- tolerance studies, a triangular pulse of 18.3G anders of seats and dummies was located at the air- 0.075 sec duration is survivable, with only a smallcraft nose, with positive X-axis (longitudinal) for- probability of any spinal injury (for a healthy, youngward, positive Y-axis (transverse) out the right wing, adult). The pilot seat normal acceleration is alsoand positive Z-axis (normal) downward. For the shown in figure C2(a) and was less than 14G. Nor-dummy accelerations, the accelerometer directions mal accelerations of seats and dummies from thewere in the dummy axis system (Xd, Yd, and Zd) and third row back to the tail of the airplane were allwere only approximately along the aircraft X-, Y-, well under 10G. The accelerations of the seats and
and Z-directions. In the case of the NASA dum- dummies because of the main gear bulkhead impactmies, which were bent over in a crash position, the (BS 820 to 960) at approximately 0.85 sec are in-upper torsos were rotated so that the dummy zd- dicated by small pulses that are only apparent fordirection was approximately aligned with the air- the seats and dummies located rear of BS 600J. Thecraft X-axis. Table C1 includes a list of the seat dummy normal acceleration from left-wing impactexperiments in the CID consisting of seat location (occurring just after time 0 sec), forward-fuselage im-(row and side), body station, seat type, and num_ pact at 0.46 sec, and landing gear bulkhead impactber of occupants in each seat. The seats were ar- at 0.85 sec were comparable for locations to the rearranged in 16 widely spaced rows (see fig. C1) start- of BS 820.ing with the pilot seat (row 1) and ending with atwo-place attendants' seat located on the rear bulk-
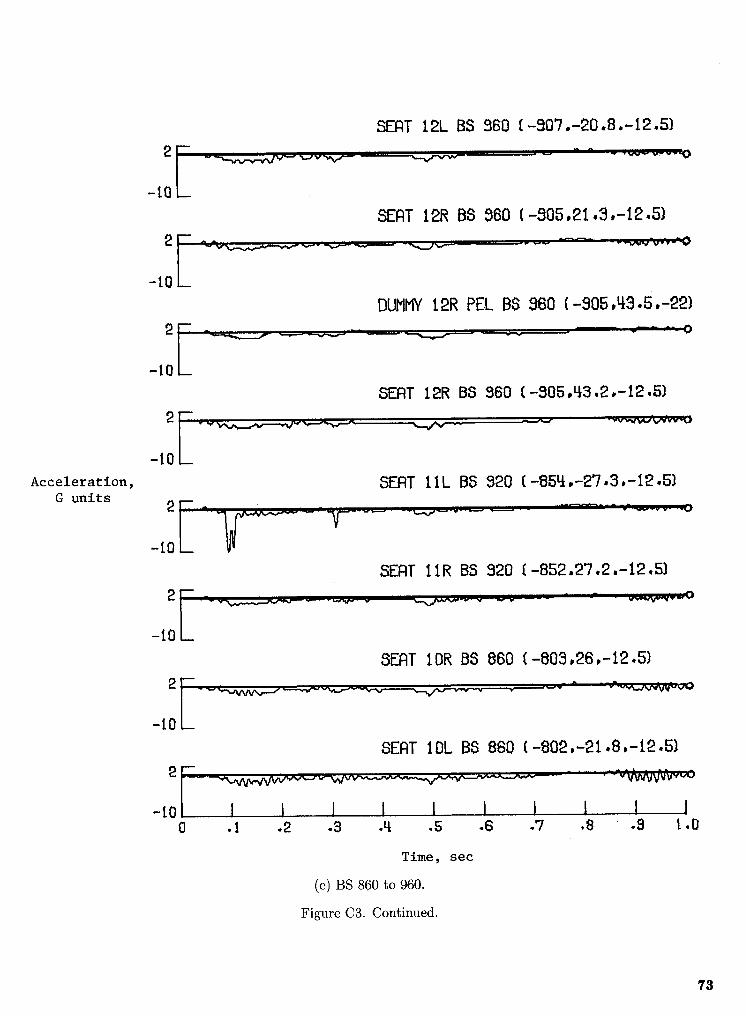
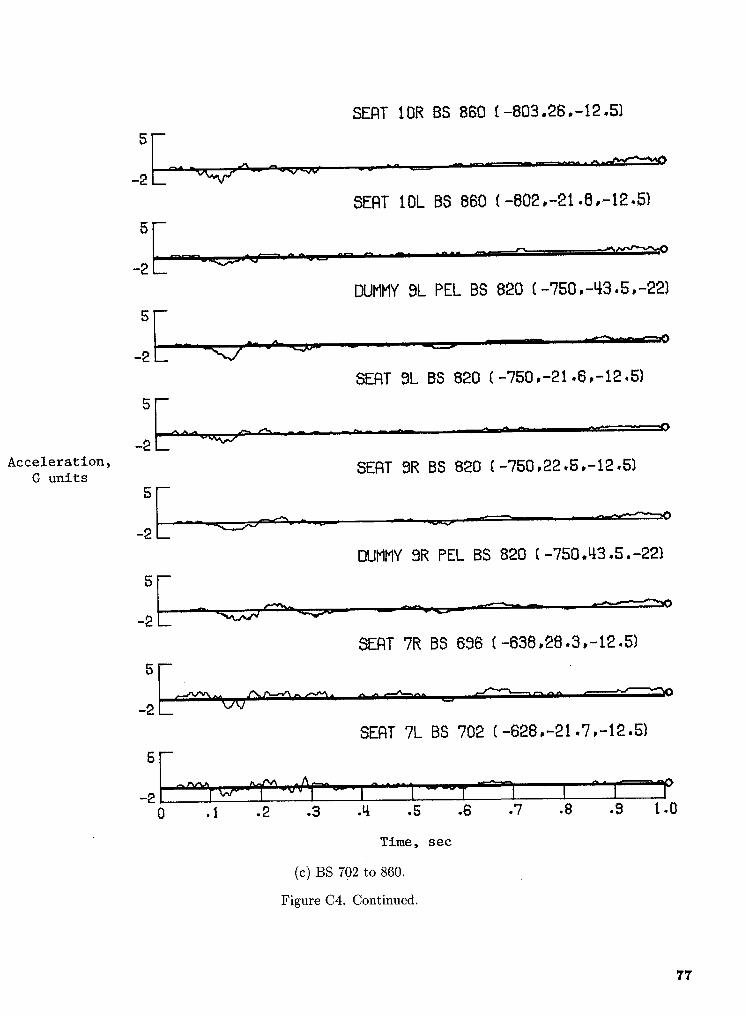
Seat and Dummy Longitudinal Accelerationshead at BS 1380 (row 16). Each plot is labeledwith the seat or dummy row number, the side of Seat and dummy longitudinal accelerations forthe airplane (for example, seat 3L is in the third the first second after left-wing impact from 48 trans-row on the left side of the aircraft), body station, ducers are presented in figure C3. For the longitu-and the coordinate location of the transducer. There dinal direction, the pilot-seat trace (fig. C3(a)) haswere 27 seats aboard with a capacity of 75 occu- the highest peak acceleration of 10G at 0.48 sec,pants. The seats were arranged in widely spaced slightly after the time of first fuselage impact. Therows so that one seat experiment would not inter- pilot pelvis trace (fig. C3(a)) responds very lit-fere with any other seat in case a failure occurred, tle at the time of forward-fuselage impact, show-Of the 73 dummies placed onboard, only 17 were ing very small acceleration. From an examina-of anthropomorphic research quality (with 13 instru- tion of the traces, the seat and dummy acceler-mented). Dummy instrumentation consisted of ac- ations overall were quite low in the longitudinalcelerometers, which could be located in the pelvis direction and in many cases did not exceed 2G(PEL), chest (CHST), and head cavities (HEAD), or 3G. The head accelerations for dummies inand of restraint load cells used to measure lap- seats 5L and 7L were higher than seat or torsobelt and shoulder-harness loads (where applicable), accelerations and peaked at 5G (figs. C3(b) andThe minimum dummy instrumentation was three ac- C3(c)). The trace for seat 6R (fig. C3(c)) iscelerometers located in the pelvis and two lap-belt included, but it is very suspect at the time ofload cells. All dummies were in a seated, upright forward-fuselage impact (0.46 sec) and definitelyposition except for the dummies in the NASA triple goes bad at 0.60 sec. From human toleranceseats, which were bent over and tied in a crash po- studies for seated subjects, these accelerations aresition. All accelerations and loads were filtered after very mild. In the high-speed motion pictures, thethe test with 100- and 50-Hz low-pass digital filters, dummies did not exhibit large displacements, andrespectively, dummies with a lap belt only did not "jackknife"
60
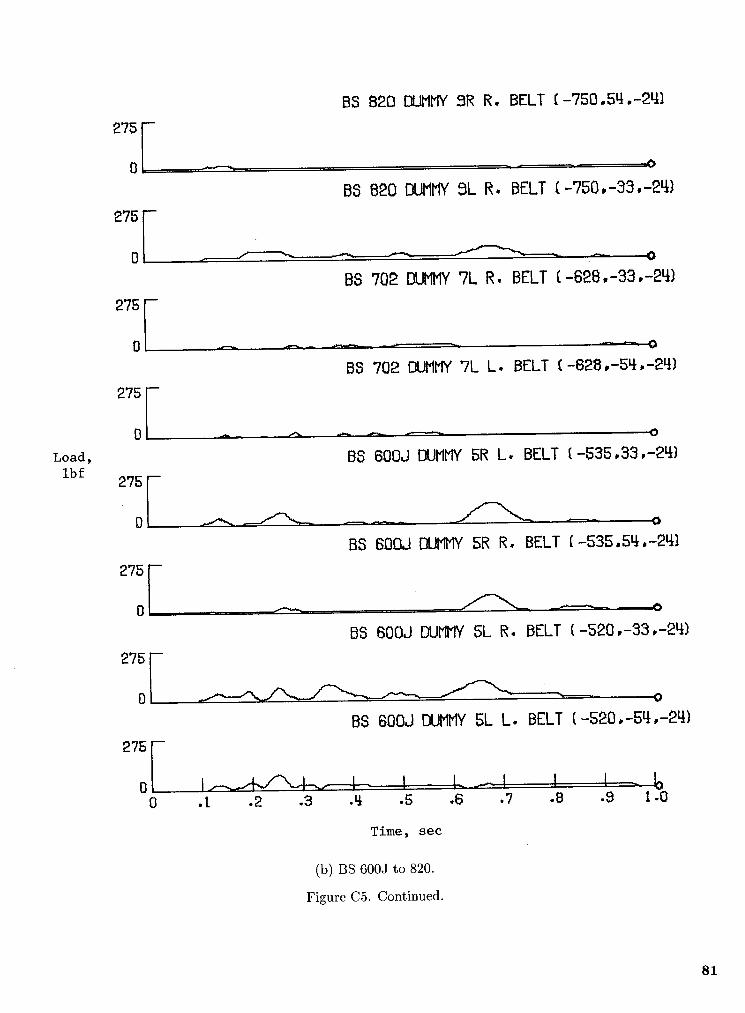
over the belt over the entire time period from initial Lap-Belt and Shoulder-Harness Loadsimpact to rest.
Seat and Dummy Transverse Accelerations Since the longitudinal accelerations were quiteThe transverse acceleration time histories are low, one would not expect to find large lap-belt or
given in figure C4 for 36 seat and dummy locations, shoulder-harness loads. Figure C5, which illustratesThe ordinate ranges from -2G to 5G and all trans- 29 load time histories for the dummy restraints, con-verse accelerations were within this range. The max- firms this hypothesis. Only the pilot dummy andimum transverse acceleration occurred early, at the a rear attendant dummy (labeled 16L) had instru-time of left-wing impact and wing crushing. This ac- mented shoulder harnesses. The maximum measuredceleration was greatest in the crew area (fig. C4(a) load in a lap belt or shoulder harness for the primarytraces for the pilot) and in the rear of the air- impact was approximately 275 lbf and occurred incraft (fig. C4(e) traces for dummy in seat 16L); it the left side of the pilot dummy lap belt and shoul-measured approximately 4G in both locations. A1- der harness (fig. C5(a)), in the right side of the rearthough the aircraft was rolled and yawed at impact, attendant dummy (16L) lap belt, and in the leftthe transverse accelerations were quite low, and in side of the rear attendant dummy shoulder harnessmany locations the peak was only approximately (fig. C5(d)). Most of the load cells measured less2G. than 100 lbf of restraint tension.
61
TABLE C1. SEAT LOCATION AND DESCRIPTION
Seat
(a) Body station Seat type Occupants1L 228 Pilot 1
References tigators 16 International Seminar (Scottsdale, Arizona),Sept. 1985.
7. Hayduk, Robert J.; Fasanella, Edwin L.; and Alfaro-i. Thomson, Robert G.; Carden, Huey D.; and Hayduk, Bou, Emilio: NASA Experiments Onboard the Con-
Robert J.: Survey of NASA Research on Crash Dynamics. trolled Impact Demonstration. SAE Paper 851885,NASA TP-2298, 1984. Oct. 1985.
2. Alfaro-Bou, Emilio; Fasanella, Edwin L.; and Williams, 8. Thomson, R. G.; and Caiafa, C.: Structural ResponseM. Susan: Crashworthy Design Considerations for Gen- of Transport Airplanes in Crash Situations. NASAeral Aviation Seats. SAE Tech. Paper Ser. 850855, TM-85654, 1983.
Apr. 1985. 9. Full-Scale Transport Controlled Impact Demonstration3. Fasanella, E. L.; Hayduk, R. J.; Robinson, M. P.; and Program. DOT/FAA/CT-82/151, Jan. 1984.
Widmayer, E.: Analysis of a Transport Fuselage Sec- 10. Eichelberger, Charles P.; Alfaro-Bou, Emilio; andtion Drop Test. Research in Structures and Dynamics-- Fasanella, Edwin L.: Development of an Energy-1984, Robert J. Hayduk and Akmed K. Noor, compilers, Absorbing Passenger Seat for a Transport Aircraft.NASA CP-2335, 1984, pp 347-368. 19th Aerospace Mechanisms Symposium, NASA CP-2371,
4. Fasanella, Edwin L.; Widmayer, E.; and Robinson, 1985, pp. 39-58.
Martha P.: Structural Analysis of the Controlled Impact 11. Fasanella, E. L.: Digital Filtering and AccelerationDemonstration of a Jet Transport Airplane. AIAA-86- Pulse Interpretation. Full-Scale Transport Controlled Im-
0939, May 1986. pact Demonstration, Robert J. Hayduk, compiler, NASA5. Hayduk, Robert J., compiler: Full-Scale Transport CP-2395, 1986, pp. 103 123.
Controlled Impact Demonstration. NASA CP-2395, 12. Eiband, A. Martin: Human Tolerance to Rapidly Applied1986. Accelerations: A Summary of the Literature. NASA
6. Hayduk, Robert J.; Fasanella, Edwin L.; and Alfaro- MEMO 5-19-59E, 1959.Bou, Emilio: Structural Crashworthiness Experiments 13. Williams, M. Susan; and Hayduk, Robert J.: Verticalof the Controlled Impact Demonstration. Paper pre- Drop Test of a Transport Fuselage Center Section Includ-sented at the International Society of Air Safety Inves- ing the Wheel Wells..NASA TM-85706, 1983.
84
Standard Bibliographic Page
1. Report No. _2. Government Accession No. 3. Recipient's Catalog No.NASA TP-2589 L
4. Title and Subtitle 5. Report Date
Impact Data From a Transport Aircraft During a Controlled Impact September 1986
Demonstration 6. Performing Organization Code
7. Author(s) 505-63-41-01Edwin L. Fasanella, Emilio Alfaro-Bou, and Robert J. Hayduk s. PerformingOrganizationReport No.
L-16125
9. Performing Organization Name and Address 10. Work Unit No.
NASA Langley Research CenterHampton, VA 23665-5225 11. Contract or Grant No.
12. Sponsoring Agency Name and Address 13. Type of Report and Period Covered
National Aeronautics and Space Administration Technical PaperWashington, DC 20546-0001 14. SponsoringAgencyCode
15. Supplementary Notes
Edwin L. Fasanella: PRC Kentron, Inc., Hampton, Virginia.Emilio Alfaro-Bou and Robert J. Hayduk: Langley Research Center, Hampton, Virginia.
16. Abstract
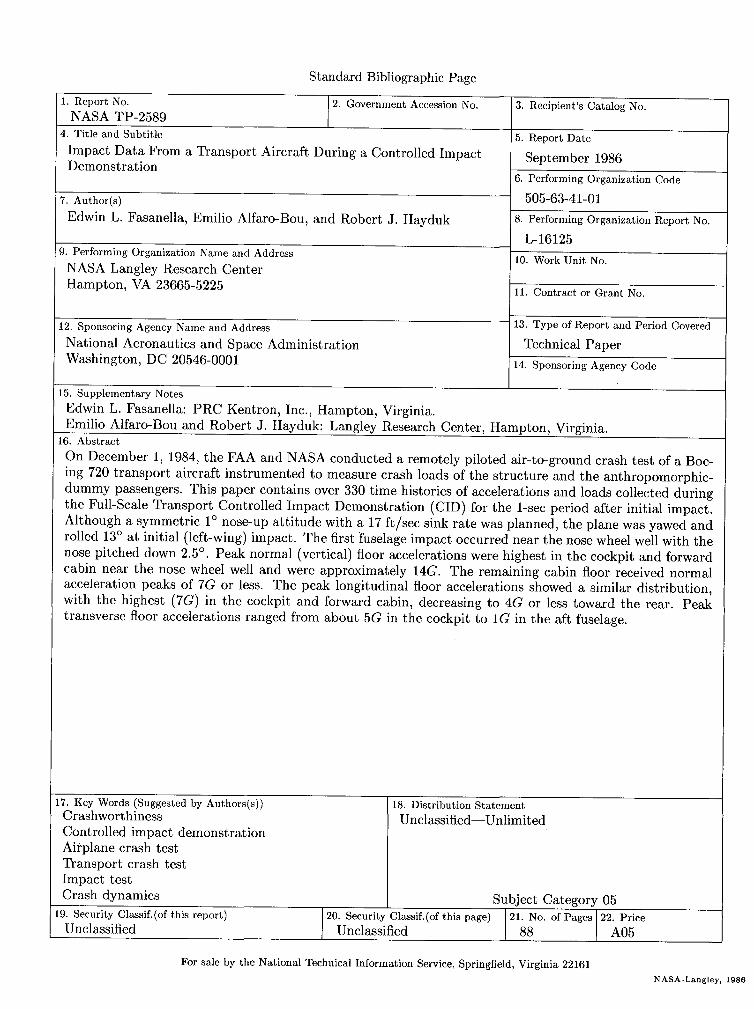
On December 1, 1984, the FAA and NASA conducted a remotely piloted air-to-ground crash test of a Boe-ing 720 transport aircraft instrumented to measure crash loads of the structure and the anthropomorphic-dummy passengers. This paper contains over 330 time histories of accelerations and loads collected duringthe Full-Scale Transport Controlled Impact Demonstration (CID) for the 1-sec period after initial impact.Although a symmetric 1° nose-up attitude with a 17 ft/sec sink rate was planned, the plane was yawed androlled 13° at initial (left-wing) impact. The first fuselage impact occurred near the nose wheel well with thenose pitched down 2.5 °. Peak normal (vertical) floor accelerations were highest in the cockpit and forwardcabin near the nose wheel well and were approximately 14G. The remaining cabin floor received normalacceleration peaks of 7G or less. The peak longitudinal floor accelerations showed a similar distribution,with the highest (7G) in the cockpit and forward cabin, decreasing to 4G or less toward the rear. Peaktransverse floor accelerations ranged from about 5G in the cockpit to 1G in the aft fuselage.
17. Key Words (Suggested by Authors(s)) 18. Distribution StatementCrashworthiness Unclassified--UnlimitedControlled impact demonstrationAirplane crash testTransport crash testImpact testCrash dynamics Subject Category 05
19. Security Classif.(of this report) 20. Security Classif.(of this page) I 21. No. of Pages 22. Price
Unclassified Unclassified I 88 A05
For sale by the National Technical Information Service, Springfield, Virginia 22161NASA-Langley, 1986