26
Florida Insurance Conference on Financial Reporting Citizens Property Insurance Corporation Sharon A. Binnun, CPA September 2011
| Date post: | 31-Dec-2015 |
| Category: |
Documents |
| Upload: | preston-moss |
| View: | 15 times |
| Download: | 0 times |

Florida Insurance Conference on Financial Reporting
Citizens Property Insurance CorporationSharon A. Binnun, CPA
September 2011

2
Basics re: Citizens
• Unlike a private insurer, Citizens does not have the ability to manage its book of business so that the exposure matches its surplus and reinsurance program. Citizens accepts most risks and its wind risk far exceeds its surplus and reinsurance.
• Add rate inadequacy to the mix and …assessments could occur if there is a large storm or multiple small storms.
• While Citizens is in its best ever financial position, with projected 2011 combined surplus + FHCF reimbursements + private reinsurance of just over $16.7 billion, we continue to rely on assessments to fund catastrophe losses in the event of a large storm or several smaller storms.

3
Market Share
•Coastal Account has over 65% market share
•CLA has approximately 53% market share
•PLA has approximately 20% market share
•PLA is the book of business experiencing significant growth since 1/1/10 and is most ripe for depopulation and keep out programs

4
Florida Residential Property Admitted Market BreakdownAs of March 31, 2011
The Florida Residential Property Insurance Admitted Market is divided into 4 major parts: (1) Citizens; (2) the Florida only subsidiaries “pups” of the major national writers; (3) the Florida-only domestic companies; and (4) non-domestic nationwide property writers, such as USAA, etc.
Source: Florida Office of Insurance Regulation, Quarterly Supplemental Report (QUASR). Includes licensed carriers only. Surplus lines companies are not included. Based on insured value for policies with wind coverage.
Citizens, 15%
"Pups", 35%
Florida-Only Unaffiliated Companies,
22%
Others (National Writers,
etc.), 28%
June 30, 2004

5
Florida Residential Property Market – Citizens vs. All Other Carriers Market ShareAs of March 31, 2011
Source: Florida Office of Insurance Regulation, Quarterly Supplemental Report (QUASR). Includes licensed carriers only. Surplus lines companies are not included. Based on insured value for policies with and without wind coverage.

6
The Current State of the Market
• When the private market writes less, Citizens writes more.
• CLA and Coastal Account PIF relatively steady.
• Significant growth in the PLA.

7
Significant Growth Only in the Personal Lines Account (PLA)
Why do policies come to Citizens?
•Price - Premium is likely lower than private market
•Agents•Captive agents•Citizens cannot become insolvent•Price
•Less stringent underwriting requirements
•Coverage - Until 2012, Citizens covered pool cages and carports
•Sinkhole territories
•Wind Mitigation Credit factor
•Few private companies want to write Commercial Residential policies and/or Coastal properties

8
Financing
•Pre-Event Bondso Issued to provide liquidity for timely payment of valid claimso Debt service is paid from operating funds and bond proceeds themselveso Can be issued taxable or tax exempt
•Post -Event Bondso Triggered by Emergency Assessmentso Very unlikely for PLA/CLAo 2% probability for Coastal Accounto Emergency Assessments can be levied over a number of years o Debt service is paid by Emergency Assessments
•Citizens credit o Rated A+ stable by S&P and Fitch; A2 stable by Moody’so Strength of credit
oAbility to levy assessmentsoParticipation in the FHCFoStrong non-impairment language in the statute
oName change from HRA to Coastal Account oDifferent from FHCF
9
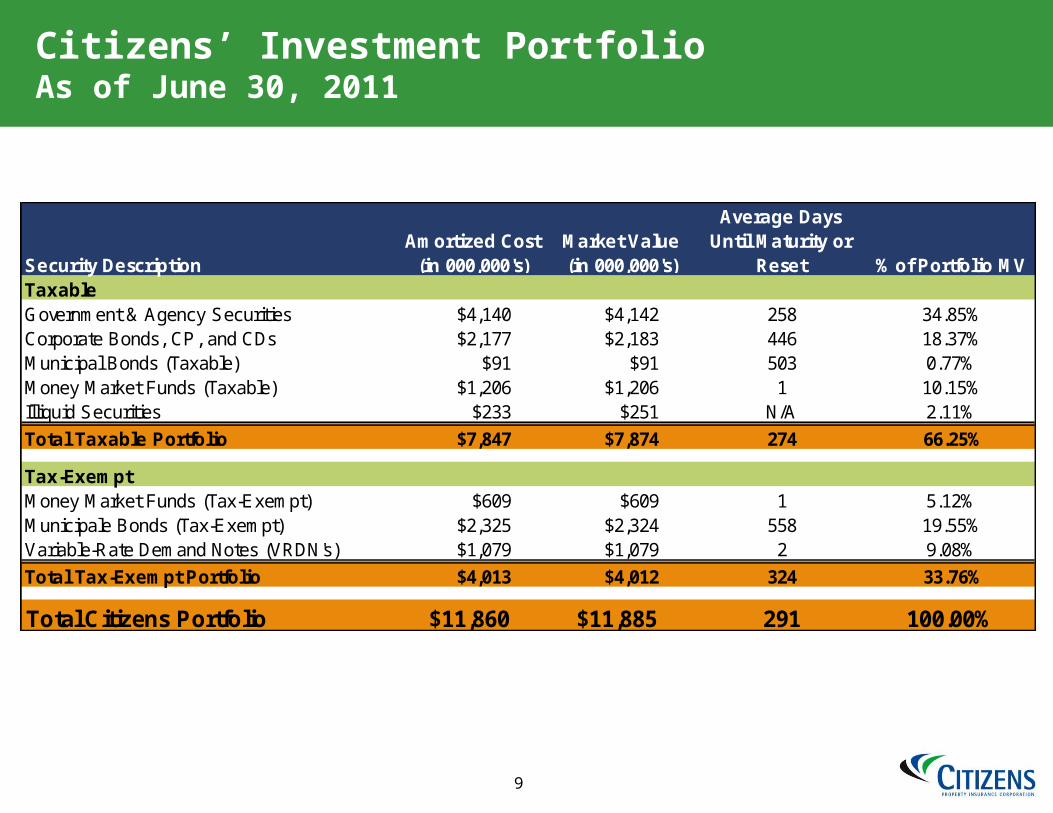
Citizens’ Investment PortfolioAs of June 30, 2011
Security DescriptionAmortized Cost
(in 000,000's)Market Value (in 000,000's)
Average Days Until Maturity or
Reset % of Portfolio MVTaxableGovernment & Agency Securities $4,140 $4,142 258 34.85%Corporate Bonds, CP, and CDs $2,177 $2,183 446 18.37%Municipal Bonds (Taxable) $91 $91 503 0.77%Money Market Funds (Taxable) $1,206 $1,206 1 10.15%Illiquid Securities $233 $251 N/A 2.11%
Total Taxable Portfolio $7,847 $7,874 274 66.25%
Tax-ExemptMoney Market Funds (Tax-Exempt) $609 $609 1 5.12%Municipale Bonds (Tax-Exempt) $2,325 $2,324 558 19.55%Variable-Rate Demand Notes (VRDN's) $1,079 $1,079 2 9.08%
Total Tax-Exempt Portfolio $4,013 $4,012 324 33.76%
Total Citizens Portfolio $11,860 $11,885 291 100.00%

10
Estimated Claims-Paying Ability – 2011 Hurricane Season
$'s in Millions
Description
Personal & Commercial
Lines Accounts
Coastal Account Total
Beginning Accumulated Surplus1 $ 2,770 $ 2,332 $ 5,102
Budgeted Net Income2 286 354 640
Total Accumulated Surplus available for claims
$ 3,056 $ 2,686 $
5,742
Pre-Event Liquidity Available3 - 3,821 3,821
Projected FHCF Coverage (Mandatory Layer Only)4 2,581 4,010 6,591
Private Reinsurance5 - 575 575
Total 2011 Projected Claims-Paying Ability
$ 5,637 $ 11,092 $
16,729
Notes:1 Accumulated Surplus (audited) as of December 31, 2009, plus audited 2010 net income and other changes in surplus.
2 Approved by the Board of Governors.3 Includes a provision for the issuance approved by Citizens' Board of Governors on May 11, 2011, of $900 million, which closed on July 14, 2011. Pre- Event liquidity does not represent risk transfer and any funds drawn must be repaid.
4 FHCF coverage is based on estimates of preliminary exposure data, rating factors and coverage multiples. The final retention and coverage amounts may be significantly different from these estimates.
5 Assumes the occurrence of an event or events sufficient to pierce and exhaust private reinsurance coverage.

11
Projected Claims Paying Resources - Combined Accounts2011 Hurricane Season1
1 See Notes & Assumptions attached hereto
12
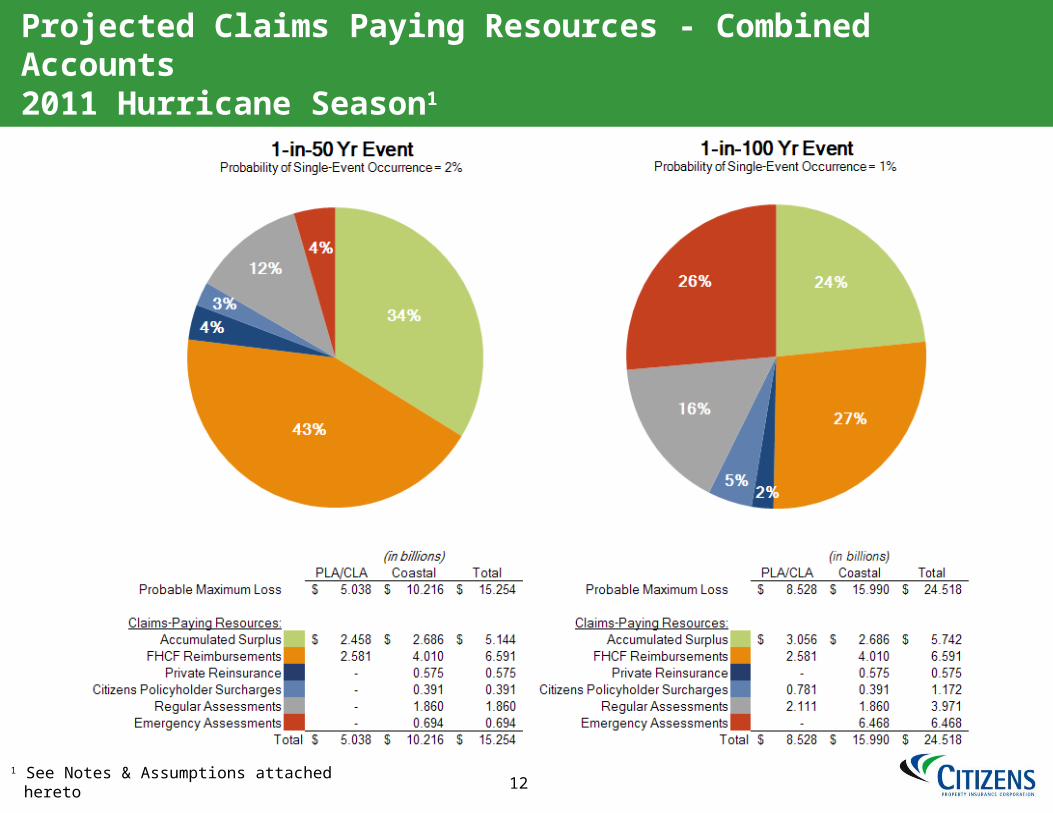
Projected Claims Paying Resources - Combined Accounts2011 Hurricane Season1
1 See Notes & Assumptions attached hereto

13
Projected Claims Paying Resources - Combined Accounts2011 Hurricane Season1
1 See Notes & Assumptions attached hereto

14
Projected Claims Paying Resources - Combined Accounts2011 Hurricane Season1
1 See Notes & Assumptions attached hereto

15
Projected Claims Paying Resources - Combined Accounts2011 Hurricane Season1
1 See Notes & Assumptions attached hereto

16
Actuarially Sound Rates
Even if actuarially sound, assessments could be triggered depending on amount of losses in a season (severe single event or multiple events)
When Citizens’ rates are actuarially sound, such rates could still be less than private market due to differences in cost structureo No taxeso No profit/ return to investorso Lower administrative expenses as a governmental entityo Less reinsurance than private marketo Lower commissions, no contingent commissions, profit sharingo No advertising

17
Summary of Indicated Statewide Rate Changes – Wind and Other PerilsPersonal Lines Excludes Sinkhole
1 Does Not include a-rated, special class, or specifically rated policies
Product Line
Type of Policy
12/31/2010 Total Inforce Premium at
Current Rate Level
Indicated Uncapped
Rate Change Including a
Provision for FHCF Build-
Up
12/31/2010 Total Inforce Non-Sinkhole Premium at
Current Rate Level
Indicated Uncapped
Non-Sinkhole
Rate Change
Capped Rate Change
Including a Provision for FHCF Build-
Up
Capped Rate Change
Excluding a Provision for FHCF Build-
Up
PRM & PRW
Homeowners - HO3 1,395,919,501 51.4% 1,352,031,891
35.0% 9.4% 8.0%
PRM & PRW
Renters - HO4 6,138,568 16.7% 6,138,568 15.8% -0.2% -0.6%
PRM & PRW
Condos Unit Owner - HO6 93,751,667 28.9% 93,751,667 26.8% 4.2% 3.3%
PRM Dwelling-DP1 32,492,292 59.9% 32,239,058 49.8% 10.9% 9.5%
PRM & PRW
Dwelling-DP3/DW2 363,291,468 48.6% 357,783,934 36.3% 8.8% 7.5%
PRM & PRW
Mobile Home 106,054,609 11.2% 106,054,609 8.8% 4.8% 3.4%
PRM & PRW
Mobile Home Dwelling 66,599,240 8.0% 66,599,240 6.0% 3.2% 2.1%
PRM & PRW
Total$
2,064,247,345
46.5%$
2,014,598,965
32.8% 8.6% 7.2%
CRW Condo 108,192,970 108,192,970 80.8% 13.5% 9.9%
CRW Apartment 30,305,576 30,305,576 75.0% 13.7% 10.0%
CRW1 Total $ 138,498,546
$ 138,498,546
79.5% 13.6% 9.9%
CNRW Total $ 80,107,521 $ 80,107,521
78.8% 10.0% 10.0%
CRM Condo 173,985,703 173,985,703 18.3% 5.2% 3.8%
CRM Apartment 48,258,265 48,258,265 22.6% 11.3% 9.9%
CRM1 Total $ 222,243,968
$ 222,243,968
19.2% 6.6% 5.1%
Grand Total$
2,505,097,380
$
2,455,449,000
35.6% 8.8% 7.3%

18
Personal Residential Regional Average Indicated Rate Change by Policy TypeWind and Other Perils (Excludes Sinkhole)

19
Indicated Wind and Other Perils Rate Change by Policy Type
Top Five Territories Based on Average Across all Policy Types
(Excludes Sinkhole)

20
Summary of Indicated Statewide Rate Changes – Sinkhole Only
Product Line Type of Policy
12/31/2010 Total Inforce Premium at
Current Rate Level
Indicated Uncapped Rate
Change Including a
Provision for FHCF Build-Up1
12/31/2010 Total Inforce
Sinkhole Premium at
Current Rate Level
Indicated Uncapped
Rate Change for Sinkhole
Only
Proposed Uncapped
Rate Change for Sinkhole
Only
PRM & PRW Homeowners - HO3 1,395,919,501 51.4% 43,887,611 443.6% 443.6%
PRM & PRW Renters - HO4 6,138,568 16.7% 0 n/a n/a
PRM & PRWCondos Unit Owner -
HO693,751,667 28.9% 0 n/a n/a
PRM Dwelling-DP1 32,492,292 59.9% 253,234 914.6% 914.6%
PRM & PRW Dwelling-DP3/DW2 363,291,468 48.6% 5,507,535 649.4% 649.4%
PRM & PRW Mobile Home 106,054,609 11.2% 0 n/a n/a
PRM & PRW Mobile Home Dwelling 66,599,240 8.0% 0 n/a n/a
PRM & PRW Total$
2,064,247,345
46.5% $ 49,648,380 428.6% 428.6%1 Indicated rate change excluding sinkhole

21
Characteristics for Potential Take-Out Policies - Location

Note: Premium is provided only for those buildings with wind mitigation credits. Premium is calculated as follows: Premium = Total Premium including Surcharges - Total Surcharges + Total Wind Mitigation Credits.
Premium for Buildings with WMC versus Total WMC
$421,283,941$561,665,038
$796,353,271
$1,024,753,086
$0
$500,000,000
$1,000,000,000
$1,500,000,000
$2,000,000,000
$2,500,000,000
$3,000,000,000
2008Q2 2008Q4 2009Q4 2010Q4
Premium Wind Mitigation Credits
22
Wind Mitigation Credits Trend AnalysisAs of December 31, 2010
Percentage of Policies Including Wind with WMC
38%43%
54%
63%
56%59%
78%82%
57%64%
74%78%
45%50%
60%65%
0%
10%
20%
30%
40%
50%
60%
70%
80%
90%
2008Q2 2008Q4 2009Q4 2010Q4
PR-M PR-W CR-M CR-W

23
Average Wind Mitigation Credits As of December 31, 2010
Commercial Residential Policies with WMC
Personal Residential Policies with WMC
$1,368 $1,412 $1,628$2,021
$2,633 $2,901 $2,862 $2,901 $2,982 $3,020 $3,086$2,870 $3,017
$3,474
$4,323
$5,708$6,188 $6,301 $6,360 $6,486 $6,469 $6,536
$0
$1,000
$2,000
$3,000
$4,000
$5,000
$6,000
$7,000
$8,000
2008Q2 2008Q3 2008Q4 2009Q1 2009Q2 2009Q3 2009Q4 2010Q1 2010Q2 2010Q3 2010Q4
Commercial Residential Multi-Peril
Commercial Residential Wind-Only
$440 $475$595
$680 $704 $683 $706 $713 $727 $744 $780 $800 $814$763 $780
$990
$1,201$1,320
$1,482 $1,508$1,533 $1,544 $1,549 $1,550 $1,562 $1,568
$0
$200
$400
$600
$800
$1,000
$1,200
$1,400
$1,600
$1,800
2007Q4 2008Q1 2008Q2 2008Q3 2008Q4 2009Q1 2009Q2 2009Q3 2009Q4 2010Q1 2010Q2 2010Q3 2010Q4
Personal Residential Multi-Peril
Personal Residential Wind-Only

24
Inspection Program
• 32,628 personal residential and commercial lines inspections have been fully processed as of May 31, 2011
– The estimated increase in premium as a result of these inspections is $15,535,192
• Future plans for the program:
oExpand the scope to include new businessoCommercial multiple building inspectionsoRetail inspectionsoAllow for additional inspection types such as four
point, general condition, and mobile home tie down

Appendix
26
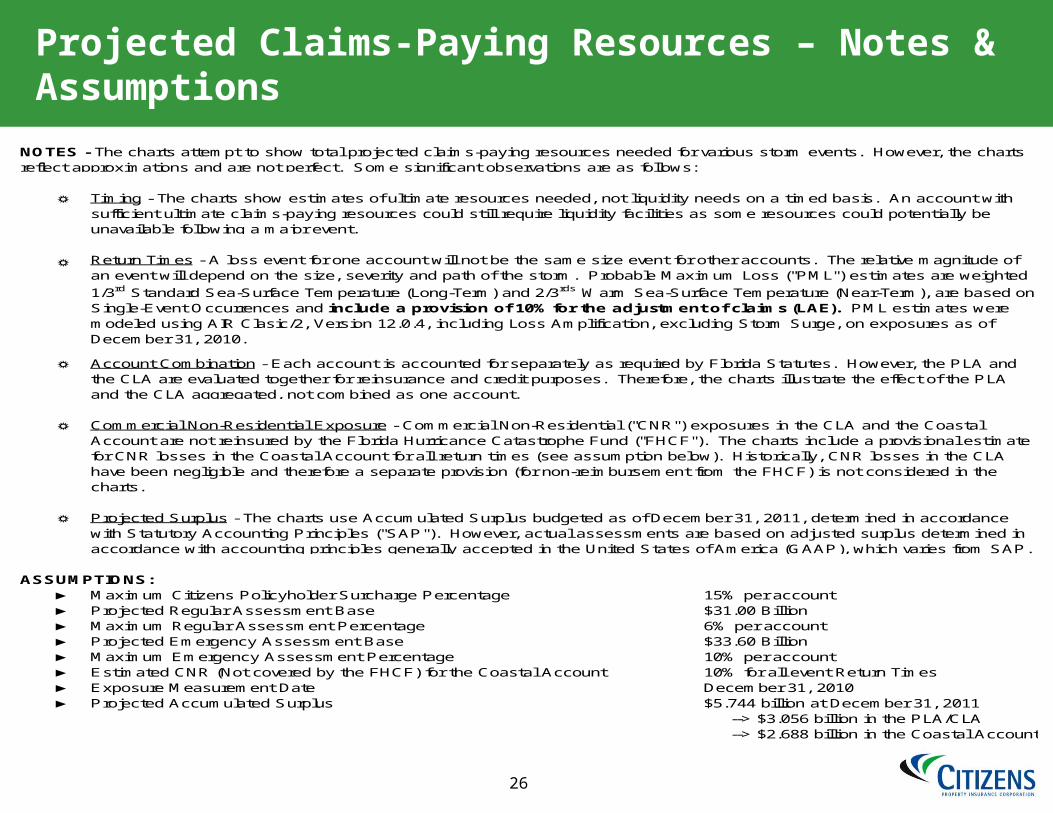
Projected Claims-Paying Resources – Notes & Assumptions
☼
☼
☼
☼
☼
ASSUMPTIONS:► Maximum Citizens Policyholder Surcharge Percentage 15% per account► Projected Regular Assessment Base $31.00 Billion► Maximum Regular Assessment Percentage 6% per account► Projected Emergency Assessment Base $33.60 Billion► Maximum Emergency Assessment Percentage 10% per account► Estimated CNR (Not covered by the FHCF) for the Coastal Account 10% for all event Return Times► Exposure Measurement Date December 31, 2010► Projected Accumulated Surplus $5.744 billion at December 31, 2011
--> $3.056 billion in the PLA/CLA --> $2.688 billion in the Coastal Account
Projected Surplus - The charts use Accumulated Surplus budgeted as of December 31, 2011, determined in accordance with Statutory Accounting Principles ("SAP"). However, actual assessments are based on adjusted surplus determined in accordance with accounting principles generally accepted in the United States of America (GAAP), which varies from SAP.
Return Times - A loss event for one account will not be the same size event for other accounts. The relative magnitude of an event will depend on the size, severity and path of the storm. Probable Maximum Loss ("PML") estimates are weighted
1/3rd Standard Sea-Surface Temperature (Long-Term) and 2/3rds Warm Sea-Surface Temperature (Near-Term), are based on Single-Event Occurrences and include a provision of 10% for the adjustment of claims (LAE). PML estimates were modeled using AIR Clasic/2, Version 12.0.4, including Loss Amplification, excluding Storm Surge, on exposures as of December 31, 2010.
Account Combination - Each account is accounted for separately as required by Florida Statutes. However, the PLA and the CLA are evaluated together for reinsurance and credit purposes. Therefore, the charts illustrate the effect of the PLA and the CLA aggregated, not combined as one account.
NOTES - The charts attempt to show total projected claims-paying resources needed for various storm events. However, the charts reflect approximations and are not perfect. Some significant observations are as follows:
Timing - The charts show estimates of ultimate resources needed, not liquidity needs on a timed basis. An account with sufficient ultimate claims-paying resources could still require liquidity facilities as some resources could potentially be unavailable following a major event.
Commercial Non-Residential Exposure - Commercial Non-Residential ("CNR") exposures in the CLA and the Coastal Account are not reinsured by the Florida Hurricance Catastrophe Fund ("FHCF"). The charts include a provisional estimate for CNR losses in the Coastal Account for all return times (see assumption below). Historically, CNR losses in the CLA have been negligible and therefore a separate provision (for non-reimbursement from the FHCF) is not considered in the charts.


