22
May 2015 September 2015 January 2018

May 2015 September 2015 January 2018
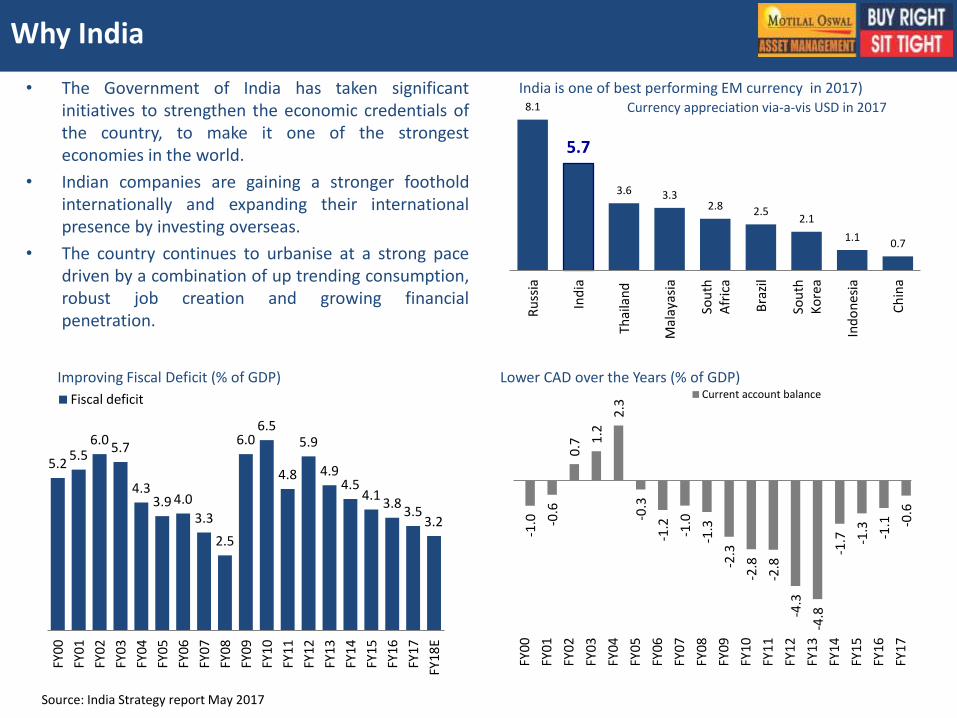
• The Government of India has taken significant initiatives to strengthen the economic credentials of the country, to make it one of the strongest economies in the world.
• Indian companies are gaining a stronger foothold internationally and expanding their international presence by investing overseas.
• The country continues to urbanise at a strong pace driven by a combination of up trending consumption, robust job creation and growing financial penetration.
-1.0
-0.6
0.7
1.2
2.3
-0.3
-1.2
-1.0
-1.3
-2.3
-2.8
-2.8
-4.3
-4.8
-1.7
-1.3
-1.1
-0.6
FY00
FY01
FY02
FY03
FY04
FY05
FY06
FY07
FY08
FY09
FY10
FY11
FY12
FY13
FY14
FY15
FY16
FY17
Current account balance
8.1
5.7
3.6 3.3 2.8 2.5
2.1
1.1 0.7
Ru
ssia
Ind
ia
Thai
lan
d
Mal
ayas
ia
Sou
thA
fric
a
Bra
zil
Sou
thK
ore
a
Ind
on
esia
Ch
ina
Currency appreciation via-a-vis USD in 2017
5.2 5.5
6.0 5.7
4.3 3.9 4.0
3.3
2.5
6.0 6.5
4.8
5.9
4.9 4.5
4.1 3.8
3.5 3.2
FY0
0
FY0
1
FY0
2
FY0
3
FY0
4
FY0
5
FY0
6
FY0
7
FY0
8
FY0
9
FY1
0
FY1
1
FY1
2
FY1
3
FY1
4
FY1
5
FY1
6
FY17
FY1
8E
Fiscal deficit
Why India
Source: India Strategy report May 2017
Improving Fiscal Deficit (% of GDP) Lower CAD over the Years (% of GDP)
India is one of best performing EM currency in 2017)
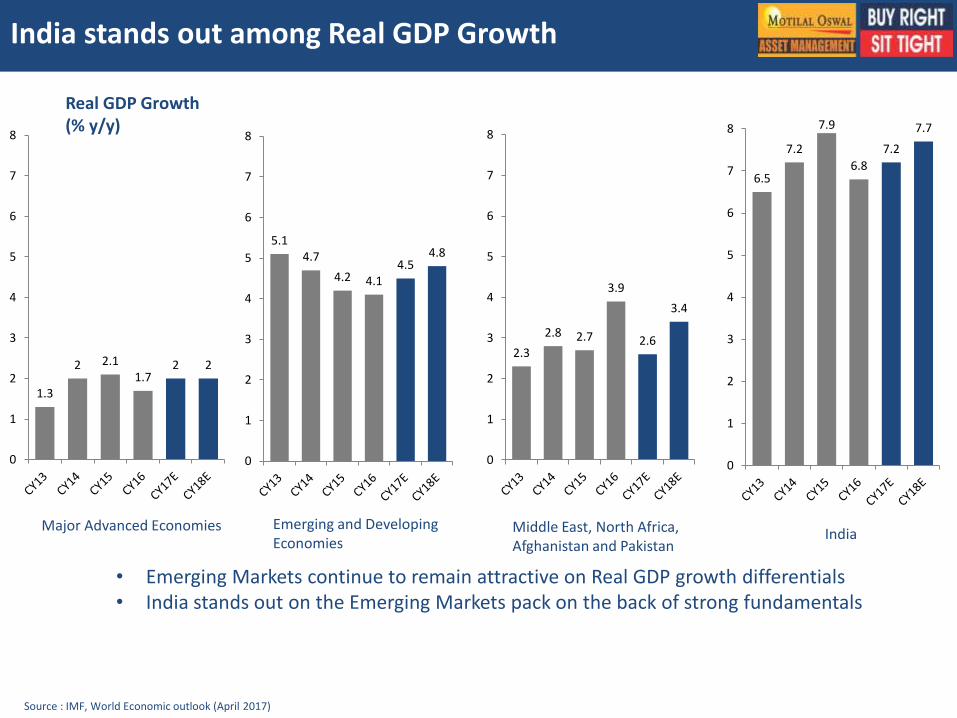
India stands out among Real GDP Growth
Real GDP Growth (% y/y)
• Emerging Markets continue to remain attractive on Real GDP growth differentials • India stands out on the Emerging Markets pack on the back of strong fundamentals
Source : IMF, World Economic outlook (April 2017)
Major Advanced Economies Emerging and Developing Economies
Middle East, North Africa, Afghanistan and Pakistan
India
6.5
7.2
7.9
6.8
7.2
7.7
0
1
2
3
4
5
6
7
8
1.3
2 2.1 1.7
2 2
0
1
2
3
4
5
6
7
8
5.1 4.7
4.2 4.1 4.5
4.8
0
1
2
3
4
5
6
7
8
2.3
2.8 2.7
3.9
2.6
3.4
0
1
2
3
4
5
6
7
8
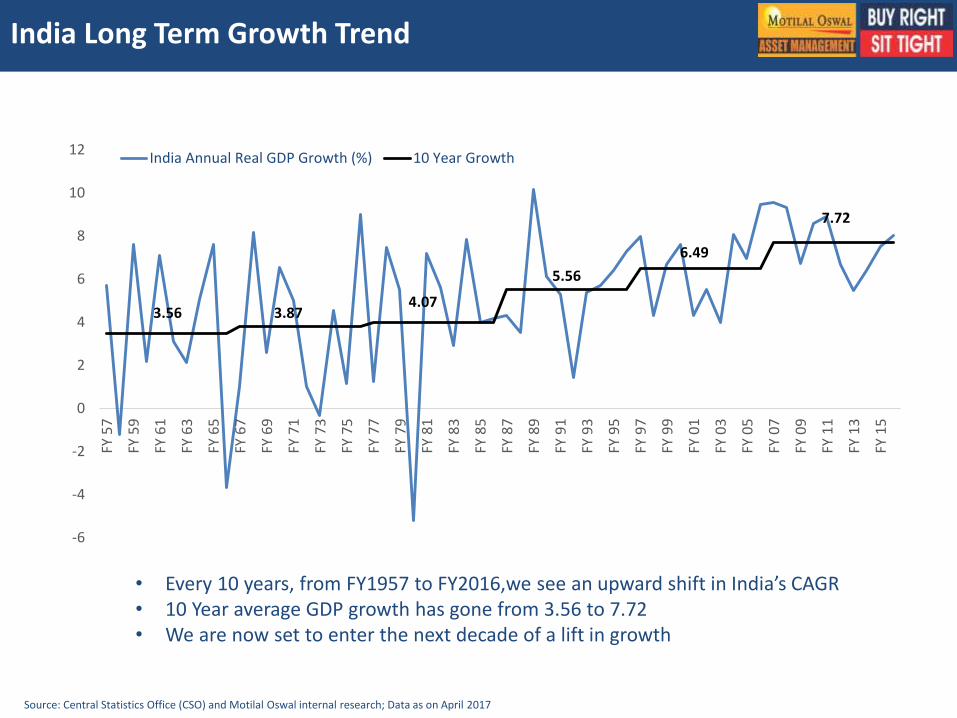
India Long Term Growth Trend
• Every 10 years, from FY1957 to FY2016,we see an upward shift in India’s CAGR • 10 Year average GDP growth has gone from 3.56 to 7.72 • We are now set to enter the next decade of a lift in growth
Source: Central Statistics Office (CSO) and Motilal Oswal internal research; Data as on April 2017
-6
-4
-2
0
2
4
6
8
10
12
FY 5
7
FY 5
9
FY 6
1
FY 6
3
FY 6
5
FY 6
7
FY 6
9
FY 7
1
FY 7
3
FY 7
5
FY 7
7
FY 7
9
FY 8
1
FY 8
3
FY 8
5
FY 8
7
FY 8
9
FY 9
1
FY 9
3
FY 9
5
FY 9
7
FY 9
9
FY 0
1
FY 0
3
FY 0
5
FY 0
7
FY 0
9
FY 1
1
FY 1
3
FY 1
5
India Annual Real GDP Growth (%) 10 Year Growth
4.07
5.56
6.49
7.72
3.56 3.87
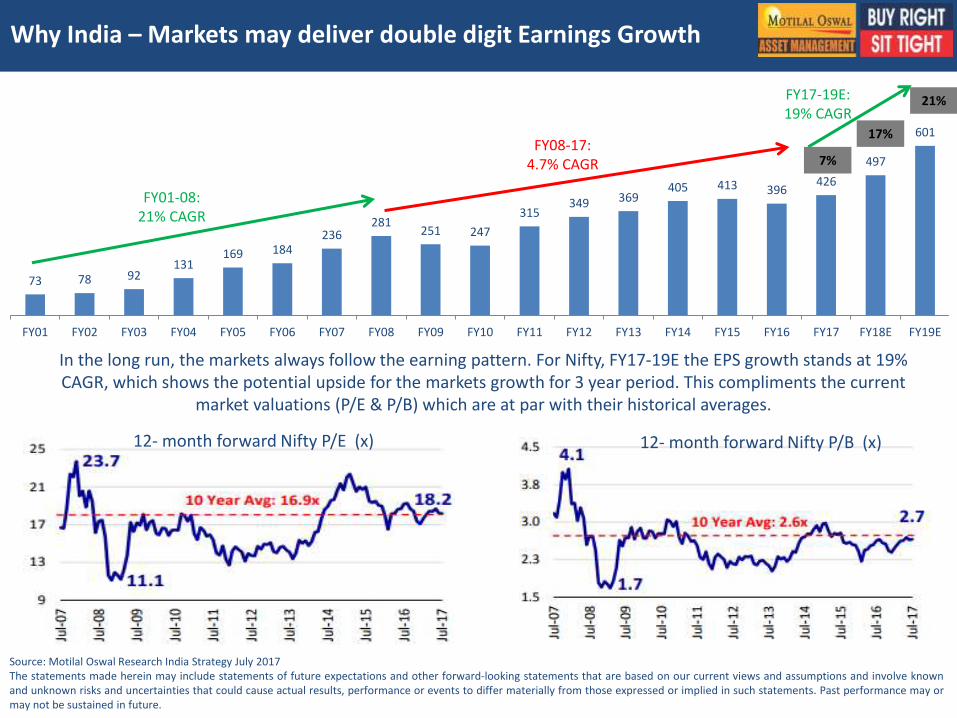
Why India – Markets may deliver double digit Earnings Growth
Source: Motilal Oswal Research India Strategy July 2017 The statements made herein may include statements of future expectations and other forward-looking statements that are based on our current views and assumptions and involve known and unknown risks and uncertainties that could cause actual results, performance or events to differ materially from those expressed or implied in such statements. Past performance may or may not be sustained in future.
FY01-08: 21% CAGR
FY08-17: 4.7% CAGR
FY17-19E: 19% CAGR
12- month forward Nifty P/E (x) 12- month forward Nifty P/B (x)
In the long run, the markets always follow the earning pattern. For Nifty, FY17-19E the EPS growth stands at 19% CAGR, which shows the potential upside for the markets growth for 3 year period. This compliments the current
market valuations (P/E & P/B) which are at par with their historical averages.
73 78 92 131
169 184 236
281 251 247
315 349 369
405 413 396 426
497
601
FY01 FY02 FY03 FY04 FY05 FY06 FY07 FY08 FY09 FY10 FY11 FY12 FY13 FY14 FY15 FY16 FY17 FY18E FY19E
7%
17%
21%
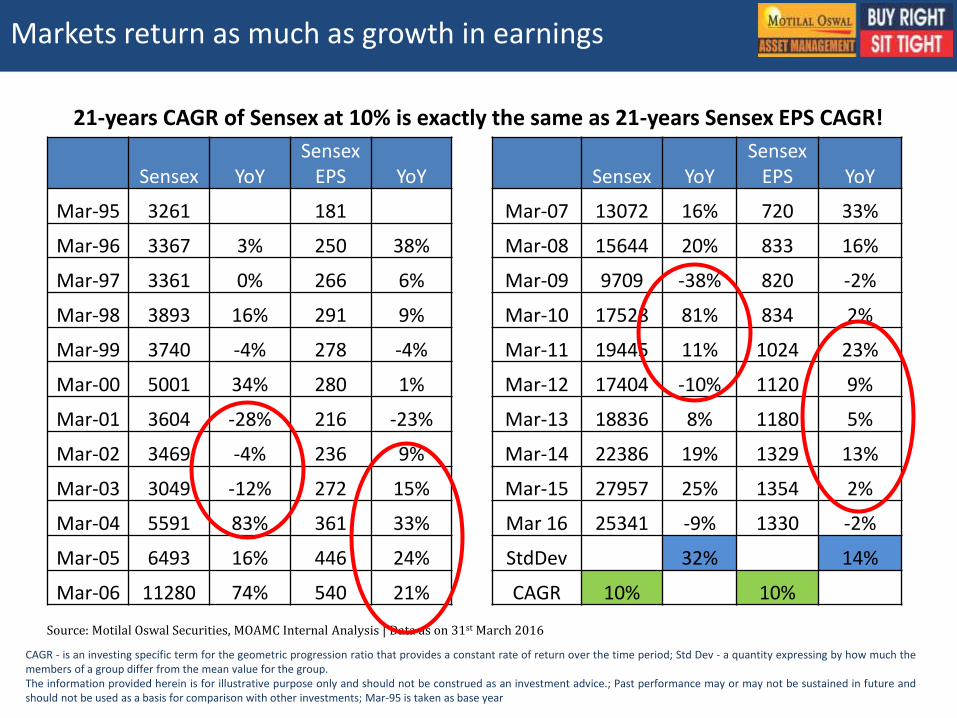
Markets return as much as growth in earnings
Sensex YoY Sensex
EPS YoY Sensex YoY Sensex
EPS YoY
Mar-95 3261 181 Mar-07 13072 16% 720 33%
Mar-96 3367 3% 250 38% Mar-08 15644 20% 833 16%
Mar-97 3361 0% 266 6% Mar-09 9709 -38% 820 -2%
Mar-98 3893 16% 291 9% Mar-10 17528 81% 834 2%
Mar-99 3740 -4% 278 -4% Mar-11 19445 11% 1024 23%
Mar-00 5001 34% 280 1% Mar-12 17404 -10% 1120 9%
Mar-01 3604 -28% 216 -23% Mar-13 18836 8% 1180 5%
Mar-02 3469 -4% 236 9% Mar-14 22386 19% 1329 13%
Mar-03 3049 -12% 272 15% Mar-15 27957 25% 1354 2%
Mar-04 5591 83% 361 33% Mar 16 25341 -9% 1330 -2%
Mar-05 6493 16% 446 24% StdDev 32% 14%
Mar-06 11280 74% 540 21% CAGR 10% 10%
Source: Motilal Oswal Securities, MOAMC Internal Analysis | Data as on 31st March 2016
21-years CAGR of Sensex at 10% is exactly the same as 21-years Sensex EPS CAGR!
CAGR - is an investing specific term for the geometric progression ratio that provides a constant rate of return over the time period; Std Dev - a quantity expressing by how much the members of a group differ from the mean value for the group. The information provided herein is for illustrative purpose only and should not be construed as an investment advice.; Past performance may or may not be sustained in future and should not be used as a basis for comparison with other investments; Mar-95 is taken as base year
Food For Thought
This volatility in share prices results in emotional response of greed in rising markets and fear in falling markets. Mostly these responses are way more exaggerated on upside as well as downside.
Over long periods of time equities do deliver in line with corporate earnings; but it’s a known fact that the volatility in share prices is way higher than volatility of earnings themselves.
When evaluated in hindsight after the data plays out; one usually rues that responses were disproportionate to changes in corporate earnings.
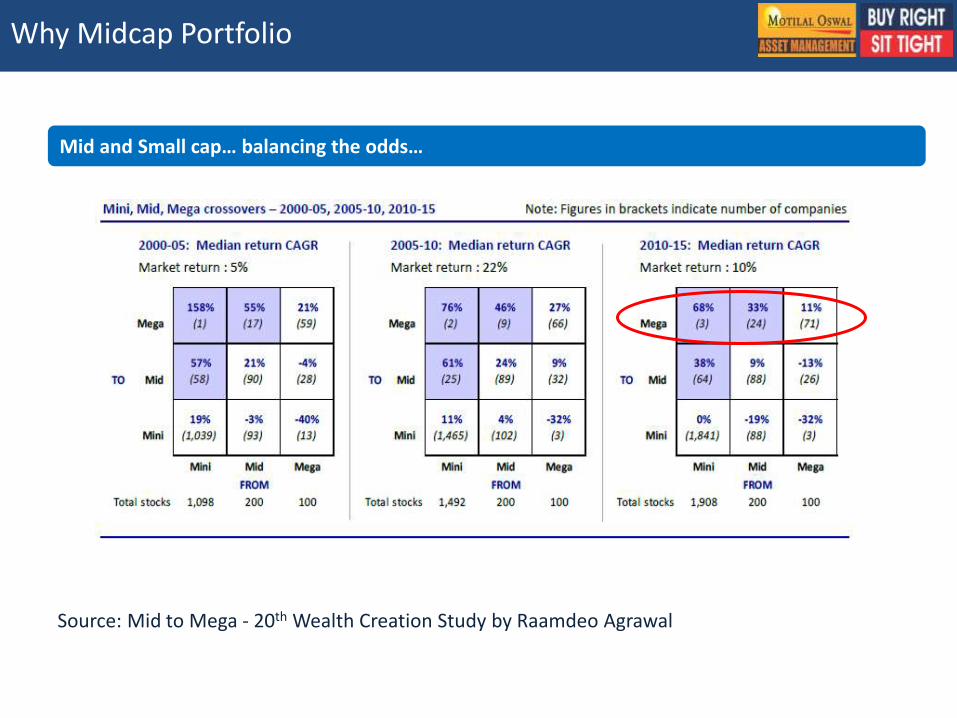
Why Midcap Portfolio
Source: Mid to Mega - 20th Wealth Creation Study by Raamdeo Agrawal
Mid and Small cap… balancing the odds…
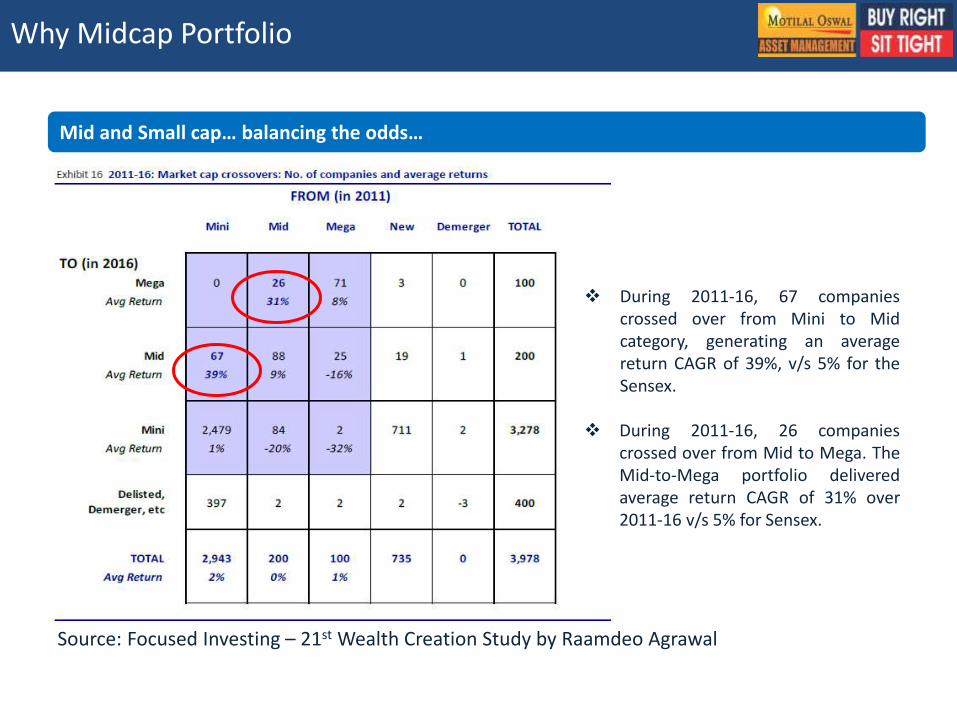
Why Midcap Portfolio
Source: Focused Investing – 21st Wealth Creation Study by Raamdeo Agrawal
During 2011-16, 67 companies crossed over from Mini to Mid category, generating an average return CAGR of 39%, v/s 5% for the Sensex.
During 2011-16, 26 companies
crossed over from Mid to Mega. The Mid-to-Mega portfolio delivered average return CAGR of 31% over 2011-16 v/s 5% for Sensex.
Mid and Small cap… balancing the odds…
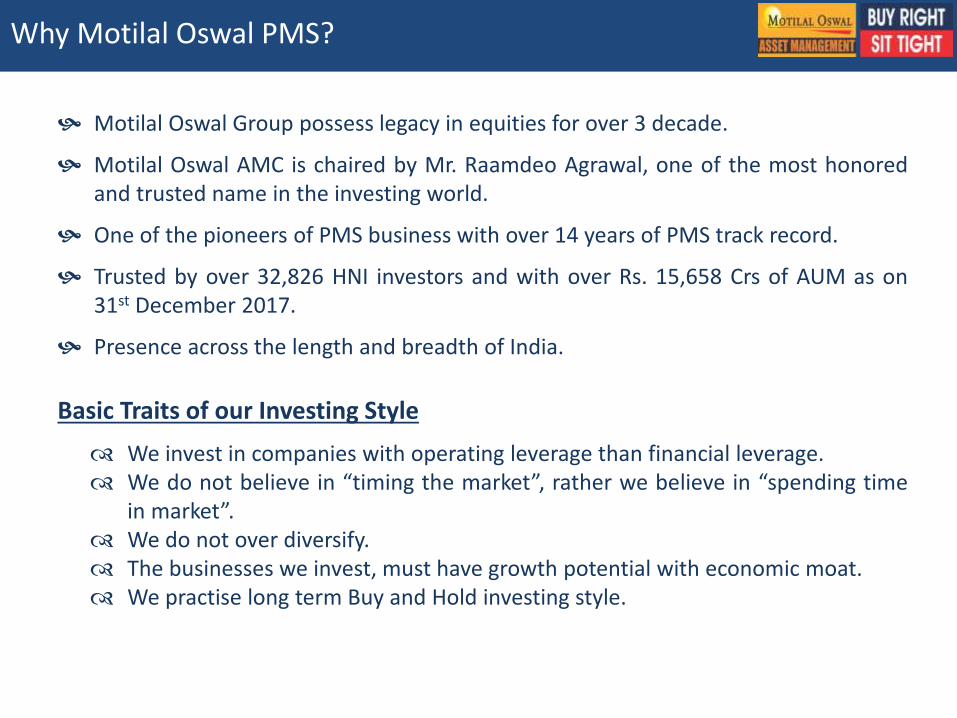
Why Motilal Oswal PMS?
Motilal Oswal Group possess legacy in equities for over 3 decade.
Motilal Oswal AMC is chaired by Mr. Raamdeo Agrawal, one of the most honored and trusted name in the investing world.
One of the pioneers of PMS business with over 14 years of PMS track record.
Trusted by over 32,826 HNI investors and with over Rs. 15,658 Crs of AUM as on 31st December 2017.
Presence across the length and breadth of India.
Basic Traits of our Investing Style
We invest in companies with operating leverage than financial leverage. We do not believe in “timing the market”, rather we believe in “spending time
in market”. We do not over diversify. The businesses we invest, must have growth potential with economic moat. We practise long term Buy and Hold investing style.
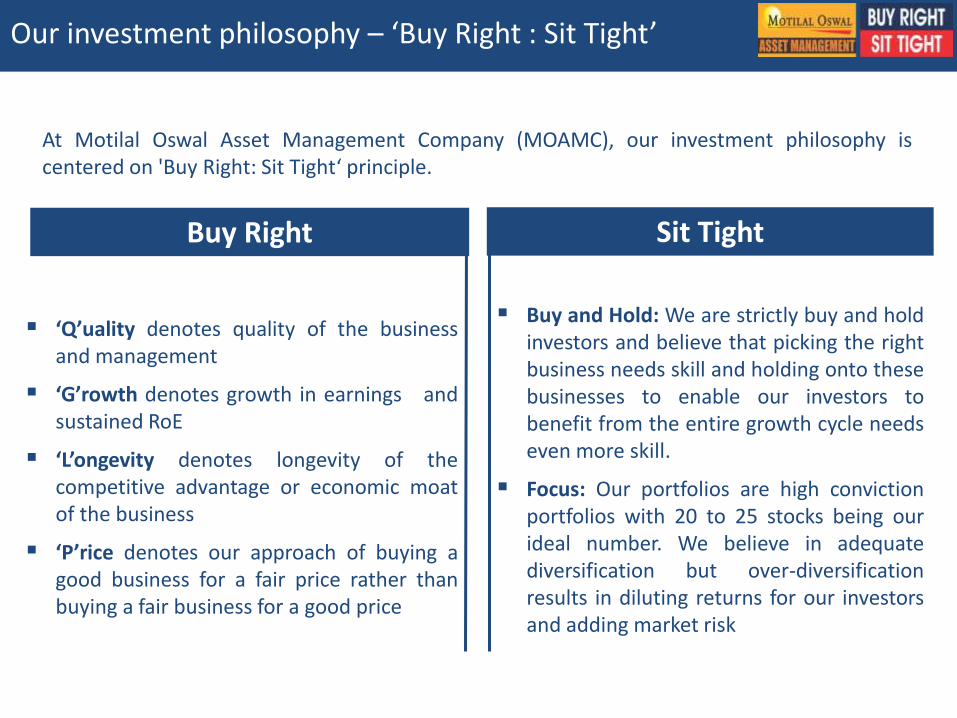
Our investment philosophy – ‘Buy Right : Sit Tight’
At Motilal Oswal Asset Management Company (MOAMC), our investment philosophy is centered on 'Buy Right: Sit Tight‘ principle.
Buy Right Sit Tight
‘Q’uality denotes quality of the business and management
‘G’rowth denotes growth in earnings and sustained RoE
‘L’ongevity denotes longevity of the competitive advantage or economic moat of the business
‘P’rice denotes our approach of buying a good business for a fair price rather than buying a fair business for a good price
Buy and Hold: We are strictly buy and hold investors and believe that picking the right business needs skill and holding onto these businesses to enable our investors to benefit from the entire growth cycle needs even more skill.
Focus: Our portfolios are high conviction portfolios with 20 to 25 stocks being our ideal number. We believe in adequate diversification but over-diversification results in diluting returns for our investors and adding market risk
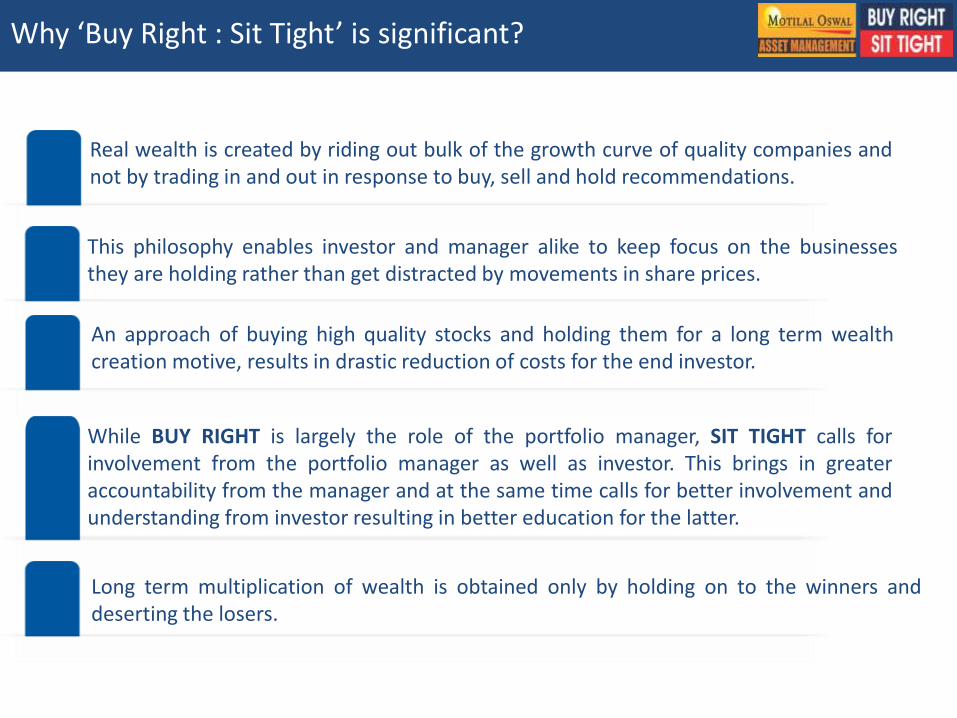
Why ‘Buy Right : Sit Tight’ is significant?
Long term multiplication of wealth is obtained only by holding on to the winners and deserting the losers.
Real wealth is created by riding out bulk of the growth curve of quality companies and not by trading in and out in response to buy, sell and hold recommendations.
This philosophy enables investor and manager alike to keep focus on the businesses they are holding rather than get distracted by movements in share prices.
An approach of buying high quality stocks and holding them for a long term wealth creation motive, results in drastic reduction of costs for the end investor.
While BUY RIGHT is largely the role of the portfolio manager, SIT TIGHT calls for involvement from the portfolio manager as well as investor. This brings in greater accountability from the manager and at the same time calls for better involvement and understanding from investor resulting in better education for the latter.
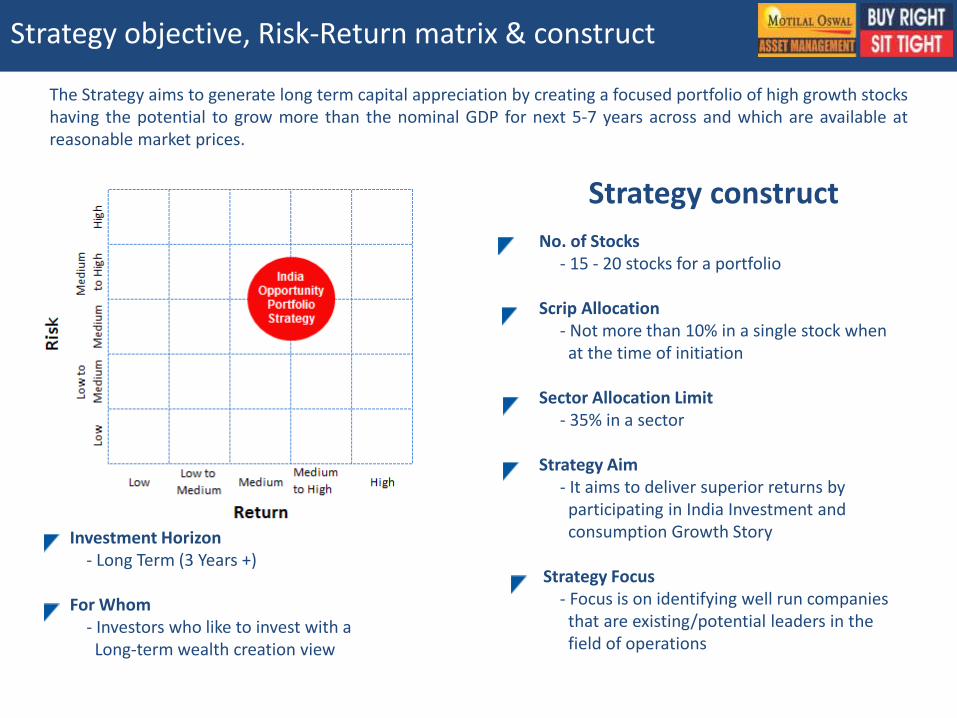
Strategy objective, Risk-Return matrix & construct
The Strategy aims to generate long term capital appreciation by creating a focused portfolio of high growth stocks having the potential to grow more than the nominal GDP for next 5-7 years across and which are available at reasonable market prices.
No. of Stocks - 15 - 20 stocks for a portfolio Scrip Allocation - Not more than 10% in a single stock when at the time of initiation Sector Allocation Limit - 35% in a sector Strategy Aim - It aims to deliver superior returns by participating in India Investment and consumption Growth Story Strategy Focus - Focus is on identifying well run companies that are existing/potential leaders in the field of operations
Investment Horizon - Long Term (3 Years +) For Whom - Investors who like to invest with a Long-term wealth creation view
Strategy construct
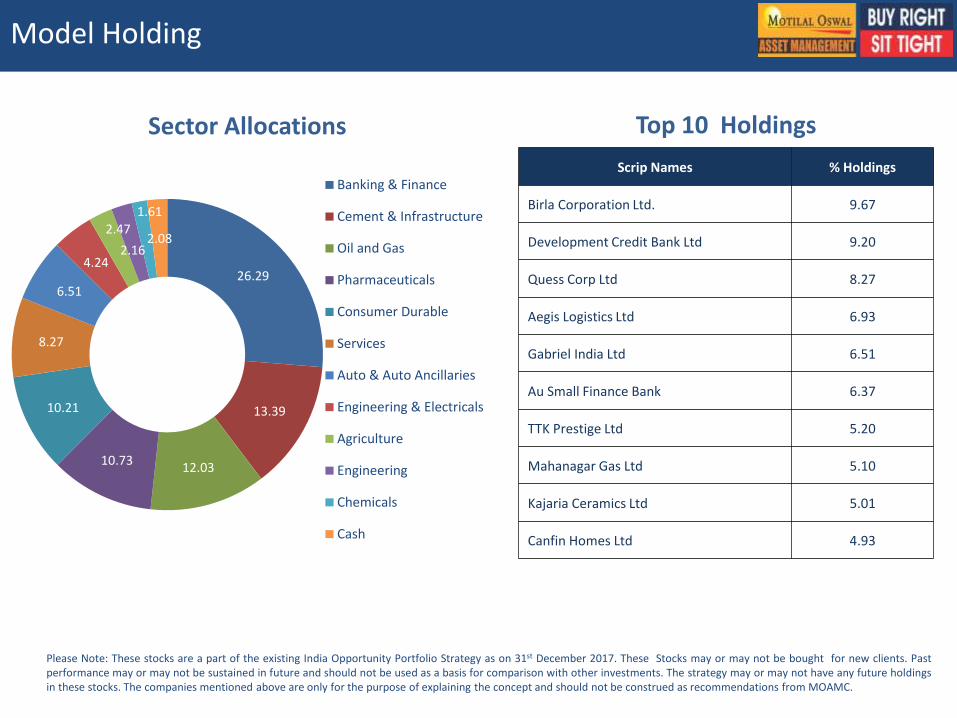
Model Holding
Top 10 Holdings Sector Allocations
Please Note: These stocks are a part of the existing India Opportunity Portfolio Strategy as on 31st December 2017. These Stocks may or may not be bought for new clients. Past performance may or may not be sustained in future and should not be used as a basis for comparison with other investments. The strategy may or may not have any future holdings in these stocks. The companies mentioned above are only for the purpose of explaining the concept and should not be construed as recommendations from MOAMC.
Scrip Names % Holdings
Birla Corporation Ltd. 9.67
Development Credit Bank Ltd 9.20
Quess Corp Ltd 8.27
Aegis Logistics Ltd 6.93
Gabriel India Ltd 6.51
Au Small Finance Bank 6.37
TTK Prestige Ltd 5.20
Mahanagar Gas Ltd 5.10
Kajaria Ceramics Ltd 5.01
Canfin Homes Ltd 4.93
26.29
13.39
12.03 10.73
10.21
8.27
6.51
4.24
2.47
2.16
1.61
2.08
Banking & Finance
Cement & Infrastructure
Oil and Gas
Pharmaceuticals
Consumer Durable
Services
Auto & Auto Ancillaries
Engineering & Electricals
Agriculture
Engineering
Chemicals
Cash
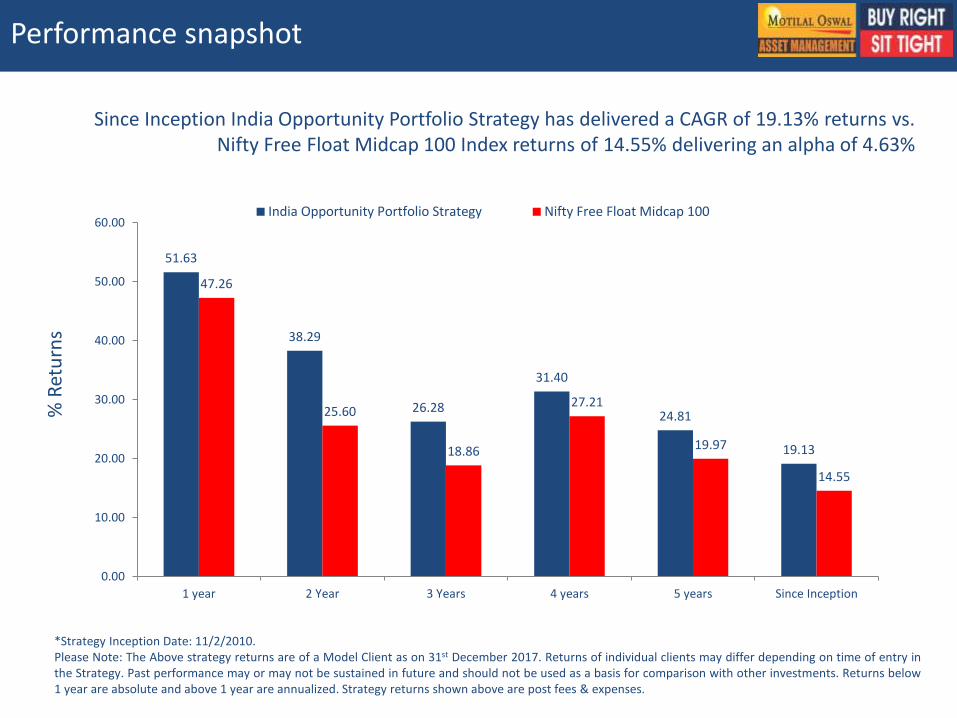
Performance snapshot
*Strategy Inception Date: 11/2/2010. Please Note: The Above strategy returns are of a Model Client as on 31st December 2017. Returns of individual clients may differ depending on time of entry in the Strategy. Past performance may or may not be sustained in future and should not be used as a basis for comparison with other investments. Returns below 1 year are absolute and above 1 year are annualized. Strategy returns shown above are post fees & expenses.
Since Inception India Opportunity Portfolio Strategy has delivered a CAGR of 19.13% returns vs. Nifty Free Float Midcap 100 Index returns of 14.55% delivering an alpha of 4.63%
% R
etu
rns
51.63
38.29
26.28
31.40
24.81
19.13
47.26
25.60
18.86
27.21
19.97
14.55
0.00
10.00
20.00
30.00
40.00
50.00
60.00
1 year 2 Year 3 Years 4 years 5 years Since Inception
India Opportunity Portfolio Strategy Nifty Free Float Midcap 100
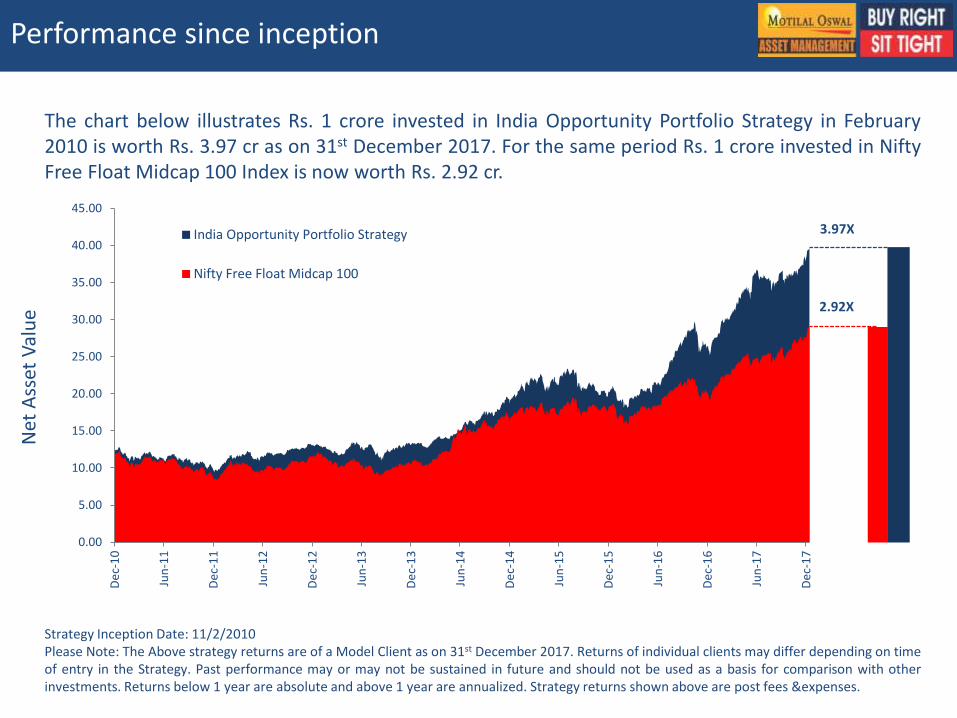
Performance since inception
Strategy Inception Date: 11/2/2010 Please Note: The Above strategy returns are of a Model Client as on 31st December 2017. Returns of individual clients may differ depending on time of entry in the Strategy. Past performance may or may not be sustained in future and should not be used as a basis for comparison with other investments. Returns below 1 year are absolute and above 1 year are annualized. Strategy returns shown above are post fees &expenses.
The chart below illustrates Rs. 1 crore invested in India Opportunity Portfolio Strategy in February 2010 is worth Rs. 3.97 cr as on 31st December 2017. For the same period Rs. 1 crore invested in Nifty Free Float Midcap 100 Index is now worth Rs. 2.92 cr.
3.97X
2.92X
Net
Ass
et V
alu
e
0.00
5.00
10.00
15.00
20.00
25.00
30.00
35.00
40.00
45.00
De
c-1
0
Jun
-11
De
c-1
1
Jun
-12
De
c-1
2
Jun
-13
De
c-1
3
Jun
-14
De
c-1
4
Jun
-15
De
c-1
5
Jun
-16
De
c-1
6
Jun
-17
De
c-1
7
India Opportunity Portfolio Strategy
Nifty Free Float Midcap 100
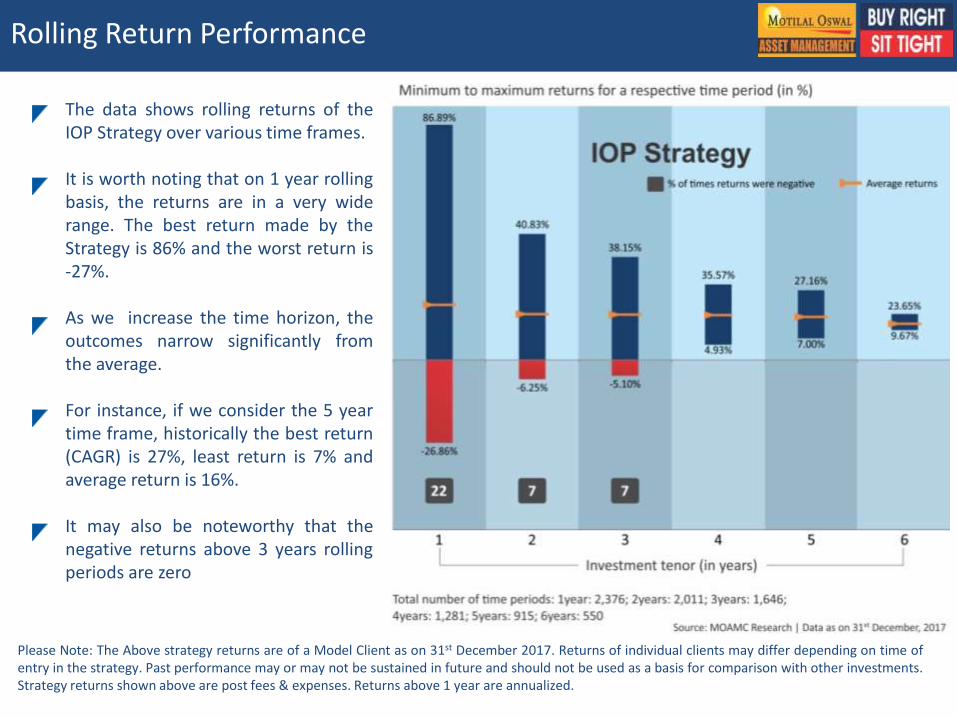
Rolling Return Performance
The data shows rolling returns of the IOP Strategy over various time frames. It is worth noting that on 1 year rolling basis, the returns are in a very wide range. The best return made by the Strategy is 86% and the worst return is -27%. As we increase the time horizon, the outcomes narrow significantly from the average. For instance, if we consider the 5 year time frame, historically the best return (CAGR) is 27%, least return is 7% and average return is 16%. It may also be noteworthy that the negative returns above 3 years rolling periods are zero
Please Note: The Above strategy returns are of a Model Client as on 31st December 2017. Returns of individual clients may differ depending on time of entry in the strategy. Past performance may or may not be sustained in future and should not be used as a basis for comparison with other investments. Strategy returns shown above are post fees & expenses. Returns above 1 year are annualized.
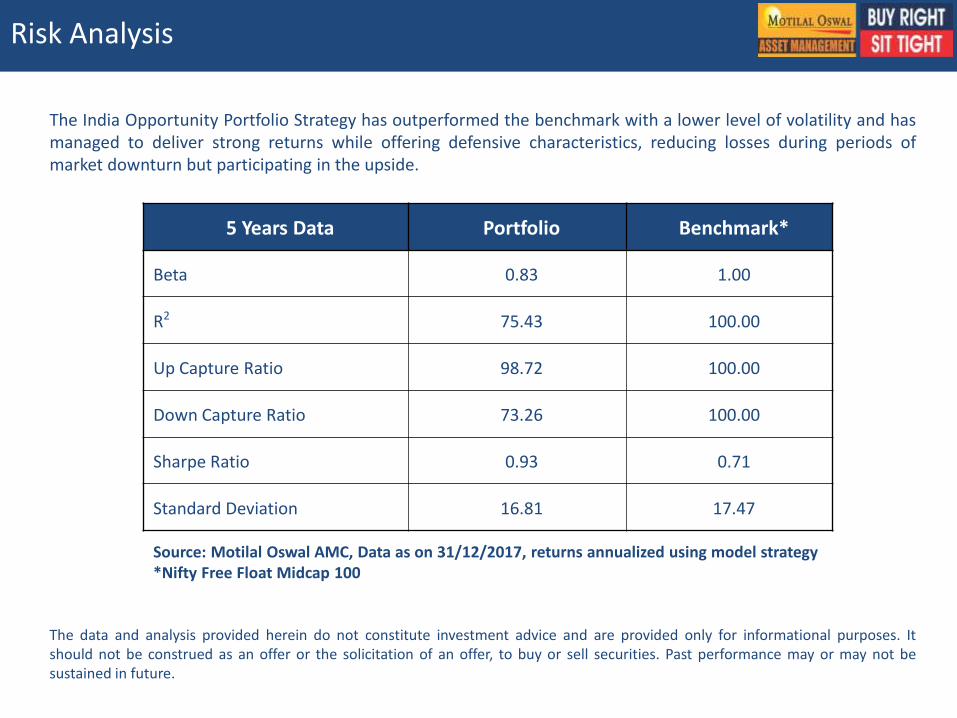
Risk Analysis
The India Opportunity Portfolio Strategy has outperformed the benchmark with a lower level of volatility and has managed to deliver strong returns while offering defensive characteristics, reducing losses during periods of market downturn but participating in the upside.
The data and analysis provided herein do not constitute investment advice and are provided only for informational purposes. It should not be construed as an offer or the solicitation of an offer, to buy or sell securities. Past performance may or may not be sustained in future.
Source: Motilal Oswal AMC, Data as on 31/12/2017, returns annualized using model strategy *Nifty Free Float Midcap 100
5 Years Data Portfolio Benchmark*
Beta 0.83 1.00
R2 75.43 100.00
Up Capture Ratio 98.72 100.00
Down Capture Ratio 73.26 100.00
Sharpe Ratio 0.93 0.71
Standard Deviation 16.81 17.47
Chairman
Mr. Raamdeo Agrawal Chairman
Raamdeo Agrawal is the Co-Founder and Joint Managing Director of Motilal Oswal Financial Services Limited (MOFSL).
As Chairman of Motilal Oswal Asset Management Company, he has been instrumental in evolving the investment management philosophy and framework.
He is on the National Committee on Capital Markets of the Confederation of Indian Industry (CII), and is the recipient of "Rashtriya Samman Patra" awarded by the Government of India.
He has also featured on ‘Wizards of Dalal Street‘ on CNBC. Research and stock-picking are his passions which are reflected in the book “Corporate Numbers Game” that he co-authored in 1986 along with Ram K Piparia.
He has also authored the Art of Wealth Creation, that compiles insights from 21 years of his Annual ‘Wealth Creation Studies’.
Raamdeo Agrawal is an Associate of Institute of Chartered Accountants of India.
Fund Management Team
Manish Sonthalia – Head Equity PMS and Alternatives, MOAMC (Fund Manager)
Mr. Manish Sonthalia heads the Equity Portfolio Management Services at Motilal Oswal Asset Management Company Ltd. He also, serves as the Chief Investment Officer and the Director of the Motilal Oswal India Fund.
He has over 22 years of experience across equity fund management and research covering Indian markets and has been with Motilal Oswal for over 11 years.
He holds a Bachelor Degree in Commerce (Hons), ICWAI, CS, MBA-Finance, FCA
He has authored a paper ‘A Rising Consumer Class’ on Indian markets, published by the Global World Economic Forum in year 2010.
He is frequently interviewed by leading Media channels in India as well as globally. He has contributed various articles on Finance and Capital Markets in various Journals.
Mythili Balakrishnan – Vice President, MOAMC (Co-Fund Manager)
Mythili has over 13 years of experience across buy side (8 years) and sell side (5 years).
She has previously been associated with Avezo Advisers, Motilal Oswal Group, Nalanda Capital-Singapore, JP Morgan & GE Capital.
Mythili is a Post Graduate from IIM Ahmedabad and awarded CFA Charter from CFA Institute.
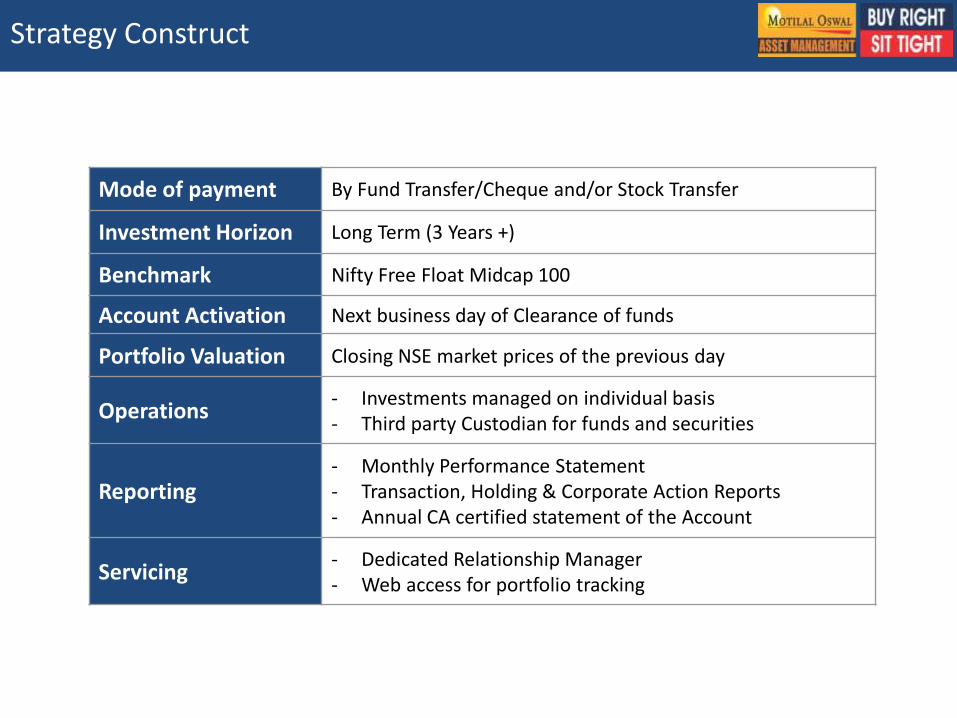
Mode of payment By Fund Transfer/Cheque and/or Stock Transfer
Investment Horizon Long Term (3 Years +)
Benchmark Nifty Free Float Midcap 100
Account Activation Next business day of Clearance of funds
Portfolio Valuation Closing NSE market prices of the previous day
Operations - Investments managed on individual basis - Third party Custodian for funds and securities
Reporting - Monthly Performance Statement - Transaction, Holding & Corporate Action Reports - Annual CA certified statement of the Account
Servicing - Dedicated Relationship Manager - Web access for portfolio tracking
Strategy Construct
Disclaimer: This presentation has been prepared and issued on the basis of internal data, publicly available information and other sources believed to be reliable. The information contained in this document is for general purposes only and not a complete disclosure of every material fact and terms and conditions. The information / data herein alone is not sufficient and shouldn’t be used for the development or implementation of an investment strategy. It should not be construed as investment advice to any party. All opinions, figures, charts/graphs, estimates and data included in this presentation are as on date and are subject to change without notice. While utmost care has been exercised while preparing this document, Motilal Oswal Asset Management Company Limited does not warrant the completeness or accuracy of the information and disclaims all liabilities, losses and damages arising out of the use of this information. The statements contained herein may include statements of future expectations and other forward-looking statements that are based on our current views and assumptions and involve known and unknown risks and uncertainties that could cause actual results, performance or events to differ materially from those expressed or implied in such statements. Readers shall be fully responsible /liable for any decision taken on the basis of this presentation. No part of this document may be duplicated in whole or in part in any form and/or redistributed without prior written consent of the Motilal Oswal Asset Management Company Limited. Readers should before investing in the Scheme make their own investigation and seek appropriate professional advice. • Investments in Securities are subject to market and other risks and there is no assurance or guarantee that the objectives of any of the strategies of the Portfolio Management Services will be achieved. • Clients under Portfolio Management Services are not being offered any guaranteed/assured returns. • Past performance of the Portfolio Manager does not indicate the future performance of any of the strategies. • The name of the Strategies do not in any manner indicate their prospects or return. • The investments may not be suited to all categories of investors. • The material is based upon information that we consider reliable, but we do not represent that it is accurate or complete, and it should not be relied upon as such. • Neither Motilal Oswal Asset Management Company Ltd. (MOAMC), nor any person connected with it, accepts any liability arising from the use of this material. The recipient of this material should rely on their investigations and take their own professional advice. • Opinions, if any, expressed are our opinions as of the date of appearing on this material only. While we endeavor to update on a reasonable basis the information discussed in this material, there may be regulatory, compliance, or other reasons that prevent us from doing so. • The Portfolio Manager is not responsible for any loss or shortfall resulting from the operation of the strategy. • Recipient shall understand that the aforementioned statements cannot disclose all the risks and characteristics. The recipient is requested to take into consideration all the risk factors including their financial condition, suitability to risk return, etc. and take professional advice before investing. As with any investment in securities, the Value of the portfolio under management may go up or down depending on the various factors and forces affecting the capital market. Disclosure Document shall be obtained and read carefully before executing the PMS agreement. • Prospective investors and others are cautioned that any forward - looking statements are not predictions and may be subject to change without notice. • For tax consequences, each investor is advised to consult his / her own professional tax advisor. • This document is not for public distribution and has been furnished solely for information and must not be reproduced or redistributed to any other person. Persons into whose possession this document may come are required to observe these restrictions. No part of this material may be duplicated in any form and/or redistributed without ’MOAMCs prior written consent. • Distribution Restrictions – This material should not be circulated in countries where restrictions exist on soliciting business from potential clients residing in such countries. Recipients of this material should inform themselves about and observe any such restrictions. Recipients shall be solely liable for any liability incurred by them in this regard and will indemnify MOAMC for any liability it may incur in this respect.
Custodian: IL&FS Securities Services Ltd | Auditor: M/s Morzaria & Associates | Depository: Central Depositary Services Ltd Portfolio Manager: Motilal Oswal Asset Management Company Ltd. (MOAMC) | SEBI Registration No. : INP 000000670
Disclaimer


