41
September 28–29, 1998 Philadelphia, Pennsylvania Lisa G. Chanzit Patrick R. Newlin Ruth E. Winnicki Actuarial & Claims — Strange Partners? Casualty Loss Reserve Seminar
| Date post: | 24-Dec-2015 |
| Category: |
Documents |
| Upload: | cameron-garrett |
| View: | 215 times |
| Download: | 0 times |

September 28–29, 1998Philadelphia, Pennsylvania
Lisa G. ChanzitPatrick R. NewlinRuth E. Winnicki
Actuarial & Claims — Strange Partners?
Casualty Loss Reserve Seminar

2
Claim Reserves — What Do We Mean?
Case reserves
IBNR (incurred but not reported)

3
Big Differences
Case reserves
Actuarial reserves

4
Case Reserves — What Are They?
Dollar estimates of loss
Determined by claim staff
Placed on individual claims

5
Case Reserves
Dependent upon currently available information and specific fact that are subject to change (usually for the worse) as cases develop
6
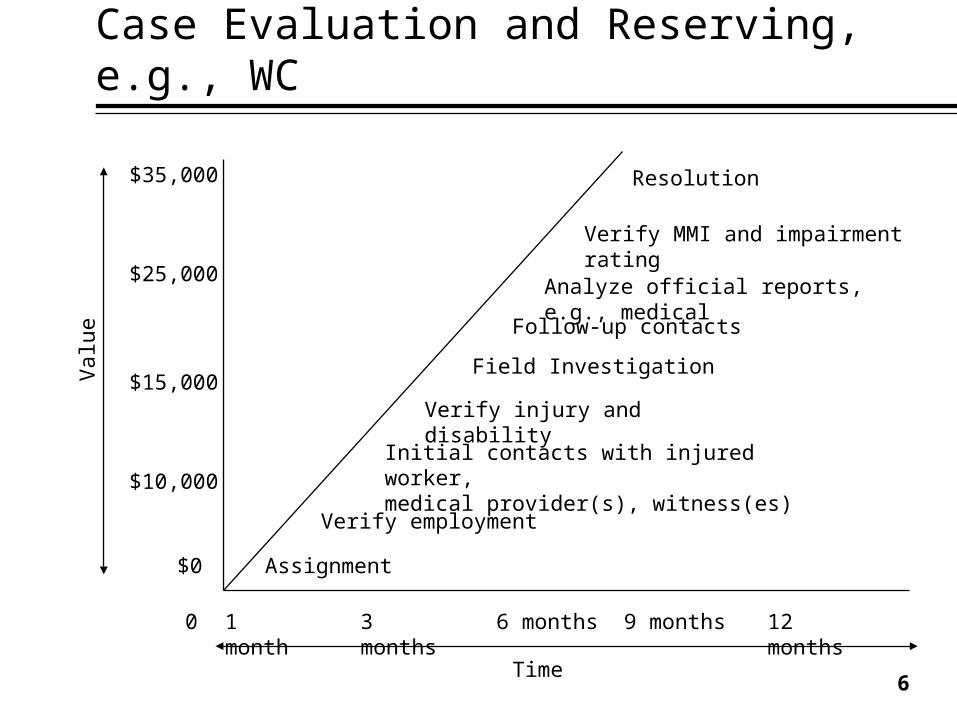
Case Evaluation and Reserving, e.g., WC
Valu
e
$35,000
$25,000
$15,000
$10,000
$0
1 month
3 months 6 months 9 months 12 months
Time
0
Resolution
Verify MMI and impairment rating
Analyze official reports, e.g., medical
Follow-up contacts
Field Investigation
Verify injury and disability
Initial contacts with injured worker,medical provider(s), witness(es)
Verify employment
Assignment

7
Case Reserving Practices
A common misconception or pitfall assessing the effectiveness and consistency of case reserving practices “Stepladder/Stair Step” reserving

8
Claim Reserves
The actuary takes over where case reserving ends

9
Actuarial Reserves
Determined by statistical projections of historical loss data, i.e., aggregate information
Subject to a higher degree of objectivity and accuracy compared to case reserve estimates
Involves considerable judgment

10
Actuarial Reserves (continued)
Takes into consideration Claims not yet reported Reopened claim reserves Consistency of case reserving practices Reinsurance Shock losses

11
Sample Aggregate Loss Values
0%
10%
20%
30%
40%
50%
60%
70%
80%
90%
100%0 24 48 72 96 120
144
168
192
216
240
Evaluation Point in Months
% Paid
% Reported
Ultimate

12
What Actuaries Like From Claim Staff
Effective, consistent case reserving practices
Candid communication
— Changes in case reserving philosophy
— Any changes that may influence case reserving consistency
— Claim trends

13
Effective and Consistent Case Reserving Practices
If effectiveness and consistency is important — if you don’t have it, how can you get it?

14
Effective and Consistent Case Reserving Practices
Ensure sound case evaluation and reserving practices

15
Sound Case Evaluationand Reserving Practices
Case reserving philosophy Probable or expected total cost of the claim,
based on current, available information

16
Sound Case Evaluationand Reserving Practices
Case reserving methodology Separate dollar amounts for the types of
loss Case evaluation and reserve worksheet

17
Sound Case Evaluationand Reserving Practices
Monitor and manage the practices Establish appropriate authority levels Conduct qualitative assessment, i.e.,
individual claim file reviews Perform quantitative analysis Link results of analyses to an individual’s
performance appraisal

18
Case Studies: Two Types
Actuary notices something unexpected in data
Management or claims staff notifies actuary of change in operation
19
Case Study #1
Claim management changed general liability TPA a year ago to improve case evaluation/reserving practices
Claim management is also improving oversight and management of TPA’s performance Financial results Customer service measures Quality/compliance with company standards Efficiency of operations evaluation

20
Case Study #1 (Continued)
Changes in case reserving practices — actuary assesses these changes
Actuarial Analysis Validate change
paid-to-incurred ratios average paid claims average outstanding claims
Adjust analysis

21
Case Study #1 (Continued)Paid-to-Incurred Ratios
AccidentYear Evaluation Age in Months
12 24 36 48 60
‘94 .36 .58 .70 .78 .89
‘95 .37 .62 .71 .85
‘96 .35 .61 .78
‘97 .36 .69
‘98 .46

22
Case Study #1 (Continued)Average Paid Claims
AccidentYear Evaluation Age in Months
12 24 36 48 60
‘94 $500 $1,500 $2,500 $3,200 $3,700
‘95 525 1,575 2,625 3,375
‘96 550 1,650 2,750
‘97 580 1,750
‘98 605

23
Case Study #1 (Continued)Average Outstanding Claim
AccidentYear Evaluation Age in Months
12 24 36 48 60
‘94 $500 $2,000 $5,000 $10,000 $11,250
‘95 525 2,103 5,282 8,980
‘96 550 2,206 4,464
‘97 580 1,730
‘98 423

24
Case Study #1 (Continued)
Validation Increase in paid-to-incurred ratios Stable paid loss trends Decrease in average outstanding
Follow up Confirm with interviews and/or claim file
review Development factors based on unadjusted
case reserves could be understated

25
Case Study #2
Actuary sees decreasing case reported workers compensation severity
Decreasing Severity

26
Case Study #2 (Continued)
AccidentYear Evaluation Age in Months
12 24 36 48 60
‘94 $500 $2,000 $5,000 $10,000 $11,750
‘95 525 2,103 5,282 10,100
‘96 550 2,206 5,550
‘97 580 2,310
‘98 425
Average Outstanding Claim

27
Case Study #2 (Continued)
Possible explanations: Company management/operational Environmental, e.g., legislative reform

28
Case Study #2 (Continued)
Interview claim manager Recent centralization of claim
administration function Delays setting up and assigning claims
decrease in reported severity appears to be result of delays

29
Case Study #2 (Continued)
Adjust actuarial analysis: Short-term, use trended historical frequency,
severity to project 1998 ultimate losses

30
Case Study #2 (Continued)
Action Items Determine if the new structure is effective
Conduct claim operational review business process analysis quantitative assessment (overpayment study)
Outcome Recommendations
Improve work processes Implement “how to” monitor/measure results
Long-term actuarial adjustments depend on nature of actions taken

31
Case Study #3
Greater proportion claims reported earlier
Case reserves established earlier and at more adequate levels
Greater proportion of claims paid earlier and closed earlier
CFO advises actuary over past several years:
32
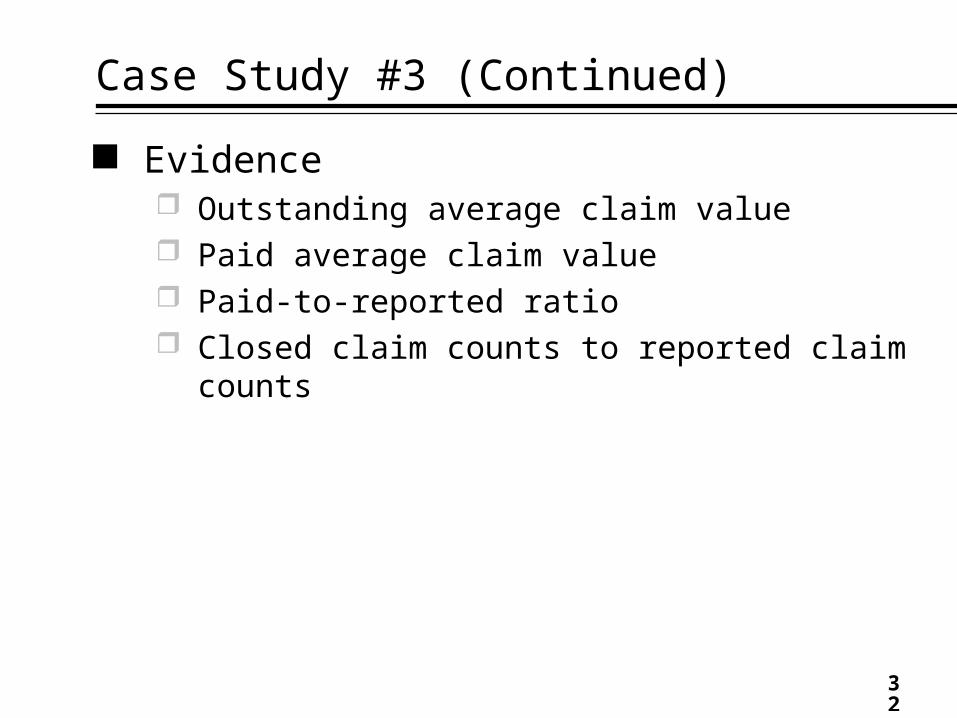
Case Study #3 (Continued)
Evidence Outstanding average claim value Paid average claim value Paid-to-reported ratio Closed claim counts to reported claim
counts

33
Case Study #3 (Continued)Outstanding Average Values (000’s)
AccidentYear Evaluation Age in Months
12 24 36 48 60 72 84 96 108 120
‘89 61 39 43 24 36 30
‘90 23 26 51 42 7 65
‘91 50 39 48 39 18 16
‘92 77 23 28 24 18 12
‘93 40 35 36 33 29 36
‘94 19 30 47 33 24
‘95 24 43 36 29
‘96 24 33 39
‘97 21 27
‘98 26

34
Case Study #3 (Continued)Paid Average Values (000’s)
AccidentYear Evaluation Age in Months
12 24 36 48 60 72 84 96 108 120
‘89 21.8 20.3 20.8 22.0 22.1 22.6
‘90 9.2 10.5 12.8 12.9 14.4 16.7
‘91 7.6 14.2 19.7 23.0 23.9 24.8
‘92 3.9 10.3 14.0 17.4 18.9 19.1
‘93 2.8 6.5 15.0 21.9 25.2 25.3
‘94 1.1 5.2 11.7 19.8 25.4
‘95 1.6 8.9 16.3 23.9
‘96 3.6 10.8 18.0
‘97 2.2 8.1
‘98 3.9
35
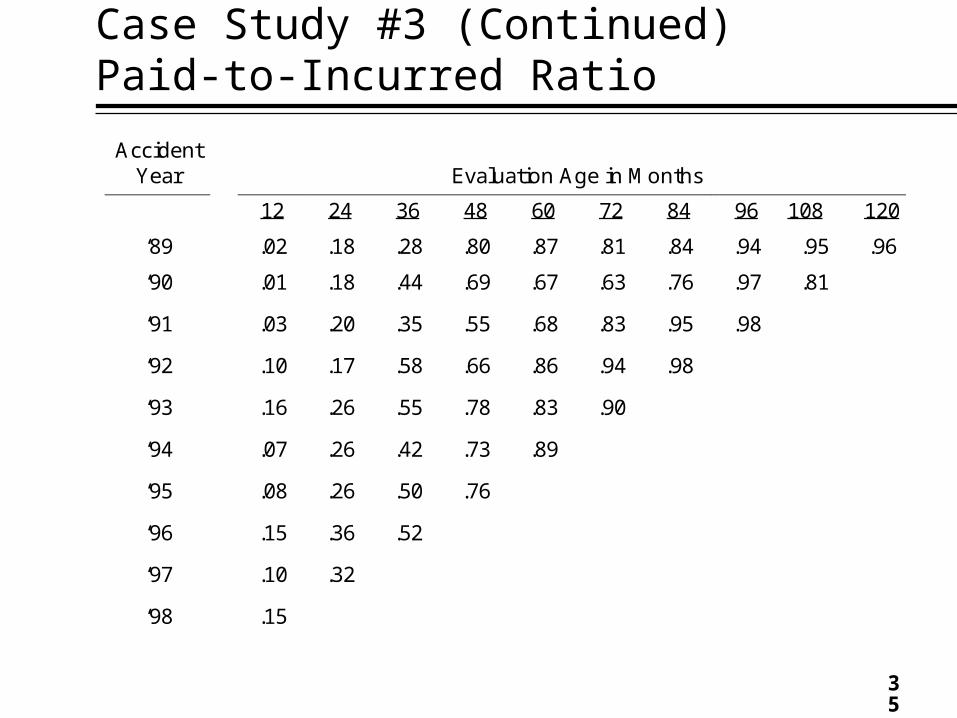
Case Study #3 (Continued)Paid-to-Incurred Ratio
AccidentYear Evaluation Age in Months
12 24 36 48 60 72 84 96 108 120
‘89 .02 .18 .28 .80 .87 .81 .84 .94 .95 .96
‘90 .01 .18 .44 .69 .67 .63 .76 .97 .81
‘91 .03 .20 .35 .55 .68 .83 .95 .98
‘92 .10 .17 .58 .66 .86 .94 .98
‘93 .16 .26 .55 .78 .83 .90
‘94 .07 .26 .42 .73 .89
‘95 .08 .26 .50 .76
‘96 .15 .36 .52
‘97 .10 .32
‘98 .15

36
Case Study #3 (Continued)Closed to Total Claims Ratio
AccidentYear Evaluation Age in Months
12 24 36 48 60 72 84 96 108 120
‘89 .95 .87 .91 .94 .97 .97
‘90 .82 .80 .85 .91 .94 .94
‘91 .71 .70 .80 .88 .92 .97
‘92 .76 .68 .75 .89 .94 .96
‘93 .64 .48 .66 .80 .82 .92
‘94 .24 .52 .65 .78 .87
‘95 .17 .42 .54 .74
‘96 .19 .41 .58
‘97 .06 .36
‘98 .11

37
Case Study #3 (Continued)
Results of claim review as respects case reserve strengthening High claim staff turnover New adjusters inexperienced Regular case reserve reviews? Recent strengthening represents 50% (or
less) of cases

38
Case Study #3 (Continued)
Case reserve strengthening
Implications: Possible future adverse development
Claims: conduct case reserve review — levels
sufficient? conduct staffing analysis
Actuarial: depends on results of review
Action Items:

39
Case Study #3 (Continued)
Results of claim review as respects faster settlement rate Some evidence of faster settlement rate Claim department “closing campaign”
quickly lower pending caseloads
Questionable cases settled prematurely?

40
Case Study #3 (Continued)
Faster settlement rate
Implications: Paying too much to close claims?
Claims: assess the basis for the closing campaign conduct qualitative and quantitative claim review
Actuarial: use operational analysis to adjust reserve
calculation
Action Items:

41
Claim Reserving
Claim reserving is a shared enterprise between company management, claim and actuarial functions Claim Person — Case reserving practices Actuary — Supplements case reserves and
projects ultimate total claim reserve needs Company Management —
Develops policies/procedures Monitors and manages practices/procedures Advises actuary of changes


